Issues with Data Quality for Wind Turbine Condition Monitoring and Reliability Analyses


1
School of Engineering, University College Cork, Cork T12 K8AF, Ireland
2
Science Foundation Ireland (SFI) MaREI Centre, Environmental Research Institute, University College Cork, Cork P43 C573, Ireland
*
Author to whom correspondence should be addressed.
Energies 2019, 12(2), 201; https://doi.org/10.3390/en12020201
Submission received: 20 November 2018
/
Revised: 15 December 2018
/
Accepted: 29 December 2018
/
Published: 9 January 2019
Abstract
:In order to remain competitive, wind turbines must be reliable machines with efficient and effective maintenance strategies. However, thus far, wind turbine reliability information has been closely guarded by the original equipment manufacturers (OEMs), and turbine reliability studies often rely on data that are not always in a usable or consistent format. In addition, issues with turbine maintenance logs and alarm system data can make it hard to identify historical periods of faulty operation. This means that building new and effective data-driven condition monitoring techniques and methods can be challenging, especially those that rely on supervisory control and data acquisition (SCADA) system data. Such data are rarely standardised, resulting in challenges for researchers in contextualising these data. This work aims to summarise some of the issues seen in previous studies, highlighting the common problems seen by researchers working in the areas of condition monitoring and reliability analysis. Standards and policy initiatives that aim to alleviate some of these problems are given, and a summary of their recommendations is presented. The main finding from this work is that industry would benefit hugely from unified standards for turbine taxonomies, alarm codes, SCADA operational data and maintenance and fault reporting.
1. Introduction
The International Renewable Energy Agency has stated that operations and maintenance (O&M) costs for wind turbines account for a significant proportion of the overall levelised cost of electricity (LCOE), at 20–25%. Up to 80% of this cost, for both on- and off-shore, is attributed directly to maintenance [1,2]. Corrective or unscheduled maintenance, whereby repairs are carried out when parts have become damaged, can be very expensive, particularly in the case of failures of major components; the cost of replacing a gearbox is in the region of €190,000, while a blade replacement is the region of €110,000 [3,4]. This can take up a significant part of the overall maintenance budget; at an estimate of €40/kW/year, the nominal annual maintenance cost for an onshore 3 MW turbine is typically €120,000 [1].
1.1. Condition-Based Maintenance
To avoid these unexpected failures and ensure proper component health, wind turbines typically undergo a preventive maintenance strategy, where inspections are carried out on a periodic basis and any needed maintenance carried out.
While this avoids the long down time and replacement costs in the event of major component failure, it also means that in many cases, a turbine has been brought off-line for inspection with minimal servicing work needed [5]. Condition-based maintenance (CBM) aims to address this by continuously monitoring the health of the turbine and only bringing it off-line for maintenance as needed [6].
In the wind industry, CBM has traditionally been carried out by installing additional vibration, oil-particulate, or other sensors on the turbine. The sensors can be expensive to install and record data at very high frequencies, meaning there are high bandwidth and storage requirements, and they have not seen as much broad success in the wind industry as in other industries [3,7]. However, there are a number of sensors already existing on the turbine used for its operation and control, which can be leveraged to capture some of the functionality of a traditional condition monitoring system (CMS) at a much lower cost. These data are typically aggregated and recorded at 10-min intervals in the supervisory control and data acquisition (SCADA) system. Although at a comparatively lower resolution, some early successes have already been achieved [8].
There are a number of different techniques used to implement such a system. Many of these are data-driven, whereby models of normal behaviour or classifiers are “trained” on historical data. These techniques heavily rely on high quality training data: periods of historical fault-free or faulty operation must be accurately identified. However, as will be discussed later, gaining access to and contextualising such data can be difficult and tedious and can create bottlenecks in the performance of some condition monitoring (CM) techniques.
1.2. Reliability Studies
Understanding turbine reliability is important in order to improve on this reliability both at the design and operation stage. This includes better targeting of CBM strategies, to see which assemblies can give the most return in value [9]. Unlike the oil and gas industry, which has standard ISO 14224:2016, there is no universal maintenance or reliability reporting standard for the wind industry [10]. This, along with the commercial sensitivity of such data, has meant that for a long time, there were few publicly available sources of reliability data for wind turbines, so the actual failure rates of various assemblies and components were difficult to obtain. As a result, the knowledge of component reliability was fragmentary and sometimes anecdotal, even among operators and professionals in the industry [11]. However, there are now a number of different studies spanning different time periods, turbine designs and turbine ages.
These studies often have to contend with disparate sources of failure data, because of this lack of consistency in their definitions of what constitutes a failure. Hence, it can be difficult to compare failure rates directly across reliability studies. Furthermore, there is a wide variation in the amount of detail available from the data underpinning these studies, so that, for example, many studies lack available data on downtime, as well as the pure failure rate. However, many studies have since attempted to amalgamate these reliability studies to draw broad conclusions, most recently in 2017 with [12] and 2018 in [9].
1.3. Research Overview
The aims of this research are to:
- Review the issues and highlight the bottlenecks that have arisen in recently-published works as a result of wind turbine data availability and quality in the context of reliability studies
- To do the same from the context of attempting condition monitoring with SCADA data
- Summarise these issues and place them in the context of present initiatives to address them
In Section 2, an overview of turbine SCADA and maintenance data is presented. In Section 3, issues with current sources of data as they relate to wind turbine reliability reporting are discussed. In Section 4, the difficulties associated with building data-driven condition monitoring models from SCADA data and historic maintenance records are discussed. Finally, in Section 5, a broad summary of the issues is presented, along with initiatives and standards that aim to alleviate them. Conclusions and future work are then discussed in Section 6.
2. Turbine Data Sources
2.1. SCADA Data
The turbine’s control system, usually centred around an industrial programmable logic controller (PLC), ensures that the turbine operates in a safe, stable, and efficient manner. This controller can be interfaced through the turbine’s SCADA system, which is used to give operators and original equipment manufacturers (OEMs) a high-level overview of performance at a turbine, farm, or fleet level. In recent years, however, leveraging these data for more advanced CM has become an ongoing area of research, as will be discussed more in Section 4.
SCADA data are typically split into three parts: operational data (usually recorded at 10-min intervals), availability data (commonly recorded at 10-min intervals to match the SCADA data) and alarms data (recorded instantaneously when alarms or information or warning messages are generated).
2.1.1. Operational Data
SCADA operational data are usually recorded continuously at 10-min intervals [8]. This can take the form of the average, minimum, maximum or standard deviation of live values recorded by the controller in the previous 10-min period [13]. Signals such as the turbine power output, wind speed, temperatures of various components, electrical signals and environmental conditions such as anemometer-measured wind speed and ambient temperature can be recorded. Different turbine manufacturers record different signals, and the systems can vary greatly from OEM to OEM in terms of the number and type of points recorded, and in some cases the resolution of the data. A sample of some typical turbine SCADA data is provided in Table 1.
2.1.2. Availability Data
Availability is a measure of the total time a system is operational and available to perform its function as intended. In the field of wind energy, it generally refers to the amount of time that a turbine is available to produce power from a technical standpoint, independent of whether or not the weather and grid conditions are within its design specifications. Various OEMs report availability data in different ways. These can usually be accessed in some capacity by the SCADA system and communicate the proportion of time the turbine was operating in a particular availability “category” in a given period, e.g., in 10-min timestamps to match the SCADA operational data. These categories cover broad situations where the turbine is generating, or available, but not generating due to weather or grid-side events or unavailable due to faults, repairs or scheduled maintenance.
2.1.3. Alarm System Data
Turbine control systems include a number of sensors to monitor certain operating parameters such as temperatures, speeds, fluid levels, voltages, etc., and ensure the turbine is operating correctly. The controller attempts to keep the turbine within acceptable bounds of operation for many of these parameters, and warning or fault alarms and information messages (sometimes collectively referred to as “status messages”) are generated to provide information to operators about the current turbine state. Turbine alarm systems vary between manufacturers, but generally there, are three different levels representing varying levels of severity applied to these alarms and messages:
- Information messages: These are generated to communicate any change in the operation mode of the turbine, not related to faults; for example, when wind speed is below cut-in speed, a change in grid conditions or when a maintenance switch has been engaged.
- Warning alarms are generated when certain control variables or operating conditions move close to the limits of acceptable bounds.
- Fault alarms are generated when these limits are exceeded.
While information messages and warning alarms do not have any direct effect on turbine operation (apart from in some cases to communicate that turbine operation has been curtailed), fault alarms are used to communicate that the turbine has been shut down and that some corrective action or intervention is needed before the turbine comes back on-line.
Alarms and messages are generated with instantaneous timestamps and cover many aspects of turbine operation. They usually give a description of where in the turbine the alarm originated and the severity of the alarm (e.g., warning message, fault, information message, etc.). A sample of turbine alarm system data is provided in Table 2.
2.2. Maintenance Logs and Work Orders
Different operators, owners, OEMs and maintenance contractors record maintenance call-outs and repair activity in different ways. These can range from hand-written forms that describe any works carried out in an unstructured format, to detailed digital work orders input to a maintenance management system where work completed and materials consumed can be selected from a prescribed list. Depending on the quality of the data, these maintenance logs can be used to root-cause faults and provide reliability information for components.
3. Issues Encountered in Wind Turbine Reliability Studies
This section will review wind turbine reliability studies from the point of view of the data sources used in each, and issues regarding the use of these data. A recent detailed review on the findings of these studies themselves can be found in [9]. Whereas that review and similar reviews discussed the actual reliability findings, here we focus purely on how the data quality and availability affected the quality of the studies and how easy they were to carry out. Only studies with a significant number of turbines (>50) and that discussed the source of their reliability data will be included. Although newer reliability studies (i.e., from 2012 onwards) better reflect the type of data that are available in modern wind farms, older reliability studies will also be included to demonstrate what is available to farm operators on older farms still in operation.
3.1. WMEP
One of the earliest data sources for reliability studies was the WMEP programme in Germany. This was an initiative by ISET (now part of the Fraunhofer Institute) and required operators to manually record all key incidents and maintenance events in paper logbooks. These logbooks were filled out by maintenance technicians, resulting in a database covering a period of 15 years from 1989–2006 and with just under 1500 turbines [14]. These turbines had a variety of technical configurations and were mostly smaller turbines, with rated powers below 1 MW. Here, failures were defined as instances where an unscheduled maintenance call-out was required, i.e., after an on-site manual restart or a repair followed by a restart. Analysis of these database is found in [15,16].
3.2. WindStats
The WindStats databases, comprised of German (WSDK) and Danish (WSD) turbines, were analysed in [17,18]. The WSDK study comprised a peak of 2500 turbines, across a nine-year period from 1994–2003, while WSD had a peak of 4500 turbines from 1995–2004. Both populations contained a mixture of turbine configurations, though the WSD study contained larger, newer turbines. The data were collected similarly to the WMEP study, with manual entry by maintenance technicians. WSD data were collected quarterly and WSDK data monthly; the data were then amalgamated and submitted in a quarterly WindStats report. The definition of failure in these database is the same as WMEP, i.e., unscheduled on-site intervention to get the turbine running again. The authors in [17] mentioned that some of the low failure rates seen for some assemblies in the WSDK study seem unrealistically low and may be cause for concern in terms of the accuracy of some of these data.
3.2.1. LWK
The LWK database in Germany covered 240 turbines over a period of 13 years from 1993–2006, and this population was generally static for the entire period. Once again, there was a variety of turbine configurations, and both the definition of failure and that of the reporting mechanisms were the same as in the previously-mentioned studies, though reported at an annual frequency, instead of monthly or quarterly. An analysis of these database is found in [18].
3.2.2. Ribrant et al.
The analysis performed in [19] was based on two separate surveys in Sweden, and the resulting data included turbines operating between 2000 and 2004. Both surveys consisted of 527–723 turbines and comprised 95% of all turbines in the country. Once again, a manual reporting format was used, but this time, the definition of failure was narrower: a failure was defined as when a repair or replacement was carried out on the turbine, so that on-site manual restarts were not included. The authors noted that in their preparatory work for this paper, statistical failure data were difficult to find. This included because it was not recorded, could not be compared across different turbine designs, OEMs refused to grant access to data, or data retrieval was too expensive to access.
3.3. ReliaWind
The EU-funded ReliaWindproject aimed to further progress information on wind turbine reliabilities, resulting in a comprehensive study for more modern wind turbines (manufactured between 2006 and 2008 and at least 850 kW) [20]. Due to being more modern wind turbines, there were more data sources available to the authors. A combination of SCADA operational and alarm data and some maintenance reports was used to build the database. It was mentioned that alarms do not always indicate the real cause of downtime, and hence, monthly operator reports and maintenance service records were manually interrogated to assign the stoppage to a fault in a particular assembly. The authors mentioned that this step involved significant effort. Here, a failure is defined as an unplanned stoppage, which lasts one hour or more and needed at least a manual restart to return to operation. Different failure severities measuring 1–4 were attributed to each incident with 1 being a manual restart and 4 being a major replacement. The project made a number of recommendations in terms of failure data collection, including mapping failures to a standardised taxonomy.
3.4. CREW
The Continuous Reliability Enhancement for Wind (CREW) database by Sandia National Laboratories was funded by the U.S. Department of Energy (DOE) [21]. This database consists of 800–900 turbines, all at least 1 MW in size. This study was unique in that it detailed the process used to transform the data used for reliability reporting, which was missing from other studies. High resolution (i.e., 1 or 2 s), as well as 10-min operational data were combined with availability and alarm system data, which had been collated and transformed by Strategic Power Systems’ (SPS) ORAPWind system. The transformed alarms data included fault alarms, which covered times the turbine was not generating, either due to external circumstances or fault incidents. These had a start time, end time, event type (i.e., whether the shut-down was because of a fault, a manual shut-down, external circumstances, etc.) and the component to which the event was related (from a standardised SPS taxonomy).
These data were amalgamated to give an overall view on the fleet availability, mean time between events, mean down time and capacity factor, among others. It is noted that 28.6% of all time on the turbine was unaccounted for (down from 37.3% from CREW’s figure for the previous year), and the remaining time is what was used to calculate the overall benchmarks. This unaccounted time was due to issues in SCADA communication and IT issues and is something that was not discussed in other studies.
The study also attempted to map the failures to specific assemblies in the turbine, as with other studies. The authors noted, however, that the majority of downtime was unable to be mapped to a specific assembly due to alarms being difficult to associate with a specific root cause, and so, 63.7% of the downtime was classed as generic “other”. As will be seen in Section 4, this is consistent with work by the authors of the current paper in [22].
3.5. Kaidis et al.
Kaidis et al. in [23] performed a reliability analysis for three different wind farms, with a total of 63 turbines from 850–3000 kW, with an average of 705 days of data for each turbine. This represents over 144 turbine-years of data. The authors defined a failure as any unplanned stoppage of any duration, but which required some sort of manual on-site intervention to restart the turbine. This differs from, for example, the ReliaWind study, where a failure was defined as an event that lasted more than 1 h and needed a manual intervention (i.e., manual remote restart, on-site restart or on-site repair). The authors stated the reason for this as being because although a stoppage that requires a simple manual restart may result in a low amount of downtime onshore, in the offshore context, this can result in extended periods due to issues with access.
The authors here acknowledged issues with data quality and availability. They compared the advantages and disadvantages of maintenance logs, SCADA alarm/fault logs, 10-min SCADA operational and availability data, maintenance service provider bills and component purchase bills. They mentioned that maintenance logs have accurate failure information, downtimes and cost of repairs, but are often only available in hard copies, difficult to read or are incomplete. The alarm system data contained failures and duration, but alarm codes can be hard to decipher and often contained many alarms or stoppages related to the same failure. The 10-min operational and availability data, meanwhile, had useful information for further root-cause analysis, environmental parameters and information on the availability category of the turbine (i.e., whether it was down or whether service or maintenance was carried out). The billing information, meanwhile, had no information on the actual failures themselves or when downtime occurred. A summary of this information as it appeared in that paper can be seen in Table 3.
As can be seen, this means that each disparate source of data has very real issues. The authors decided to use SCADA operational, availability and alarms data to build their reliability database. They did this by applying a number of rules to the SCADA data to determine periods when it was down and, if it was down, attribute the failure to a particular assembly (according to the ReliaWind taxonomy) from the alarm system data. The availability data were then used to count the time when the turbine was being serviced. This allowed the authors to split the downtime of a turbine into “repair time” and “logistical time”. The authors noted that for 17% of failures on the turbine, it was not possible to attribute the reason for the downtime to any particular fault(s) due to a lack of clarity in the alarms. Furthermore, 1% of the data related to times when the SCADA system was not available.
3.6. AWESOME Project
Reder et al. did a similar analysis to the ReliaWind study as part of the EU-funded AWESOME project, but had a larger database and used a more modern taxonomy applicable to more modern turbines [24]. This will be referred to here as AWE. Three years of data from turbines from a range of OEMs were analysed. The data here were taken from detailed work order databases by OEMs, so granular information was available. A failure was defined as any stop due to component failure that needed replacement and repair, i.e., automatic and manual restarts where no further action was taken were not included. The study comprised over 4300 turbines, split according to their size and drive train configuration. There were roughly 2270 doubly-fed induction generator (DFIG) turbines over ≥1 MW and 215 direct drive (DD) turbines comprising between 300 kW and 3 MW. A subset of these data, comprising 440 of the more modern turbines over three years, was used to compare to SCADA system data, to see if reliability information from the SCADA alarms could be successfully gleaned and accurately aligned with the work order data.
The authors noted in their study that there was not much research being carried out to determine the value of SCADA data for reliability analysis. To address this, the authors took SCADA data from a subset of the turbines in the work order database, comprised of 440 of the more modern turbines over three years, and compared the alarms generated to the failures in the work order data. A taxonomy was developed, and each alarm was mapped to a specific assembly or or sub-assembly in the turbine, or weather or grid related events, according to a process described in the related research in [25]. Analysis was performed to determine if alarms occurred more frequently in components that failed more frequently, and this led to mixed results. In some cases, the number of fault alarms was proportional to the failure rate from the work order data, but in others, no such relationship was found. Hence, the authors concluded that it is difficult to come to a global conclusion as to how well raw SCADA alarms add value to failure or reliability data. They pointed to the fact that some alarms may cause other alarms to trigger, meaning it can be hard to pinpoint the root cause of a failure simply from the alarms data.
3.7. Carroll et al.: Onshore
Carroll et al. performed an extensive study of failure rates of the generator and converter for two turbine configurations [26]. These were DFIG-configured turbines with a partially-rated converter (PRC) and permanent magnet generator (PMG)-configured DD turbines with a fully-rated converter (FRC). The turbines represent 2222 modern onshore turbines, built in the past five years. They were between 1.5 and 2.5 MW, with rotor diameters between 80 and 100 m.
The data came from very detailed OEM work order and inventory databases. A failure was defined as any unscheduled visit to a turbine where any consumables were used or parts replaced. Failures were also broken down into severity categories depending on the material cost of the repair or replacement (<€1000 for minor repair, €1000–€10,000 for major repair and ≥€10,000 for major replacement). The location of the failures, i.e., the sub-system or assembly to which they belonged, was deduced by manually reading text in the description field of work orders.
The detailed work order database available to these researchers came directly from an OEM and set this study apart from other studies. However, the downtime for each of these failures was not available, presumably as the work orders mentioned times maintenance was carried out as opposed to the specific periods in the SCADA data with which they were associated.
3.8. Carroll et al.: Offshore
Carroll et al. also analysed the failure data of 350 modern offshore turbines from a number of wind farms throughout Europe in [27]. All turbines were between three and 10 years old and between 2 and 4 MW. Rotor diameters were between 80 and 120 m, and 68% of the population was ≤5 years old. Similar to the analysis by Carroll et al. covered in Section 3.7, the data came from a very detailed work order and maintenance inventory and costs database, so that highly granular information was available. The same definitions of failure and different severity categories were also used, which depended on the material cost of the repair or replacement (i.e., do not count personnel or logistic costs, which can be very high for offshore turbines). Here again, the granularity available, as well as costs indicated that the database was of high quality; however, down time was once again not available, and failure location had to be manually deduced.
3.9. Reliability Studies’ Conclusions
All of the earlier studies, WMEP, WSD, WSDK and LWK, used manual reporting. This is an extra step, which could be otherwise automated, and leaves the reliability information open to human error with the extra reporting step required, as seen in the WSDK study. In addition, these studies collected their reports at different intervals.
The Reliawind, CREW and Kaidis et al. studies all drew on SCADA data in order to build their failure databases for the turbines. In addition, the AWESOME study collected SCADA data in order to compare to work order data. The CREW and Kaidis studies relied on SCADA data alone, and in both of these cases, there was a portion of the data that had to be discarded from the study due to not being able to assign a stoppage to a particular part of their respective taxonomies (or assign it to grid or weather issues or similar). This was due to issues with making sense of the turbine alarms that appeared during these periods. The ReliaWind study additionally drew on work orders, but mentioned that this was a similar issue when dealing with the SCADA alarms data. Hence, in all of these studies, significant effort was required in order to build a rule set for constructing a failure database from SCADA data. In addition, the AWESOME study mentioned that when a straightforward comparison was done to the frequency of SCADA alarms in certain assemblies vs. work orders related to the assemblies, the distribution of faults from the two sources did not match up, e.g., the pitch system made up nearly 25% of all SCADA alarms, but this was related to less than 5% of failures seen in the work order logs.
For the studies that drew on work orders, i.e., ReliaWind, AWESOME and both Carroll et al. studies, a manual step was needed to read the description of work carried out and map this to a specific part of a taxonomy. This also involved significant amounts of work for a process that has much potential to be automated.
In all of these studies, the authors were using what data they had to their full potential. Because of this, there were different degrees of granularity and analysis that could be done. This manifested itself in the definitions for failure and the different taxonomies that different studies used. Because of this, a straight comparison between studies is made difficult. However, there have been reviews of these studies to try and draw universal conclusions or comparisons, most recently in [9,12]. Here, the authors compared all of these studies, standardising the failures as much as is possible, but with some important caveats to say they were not directly comparable.
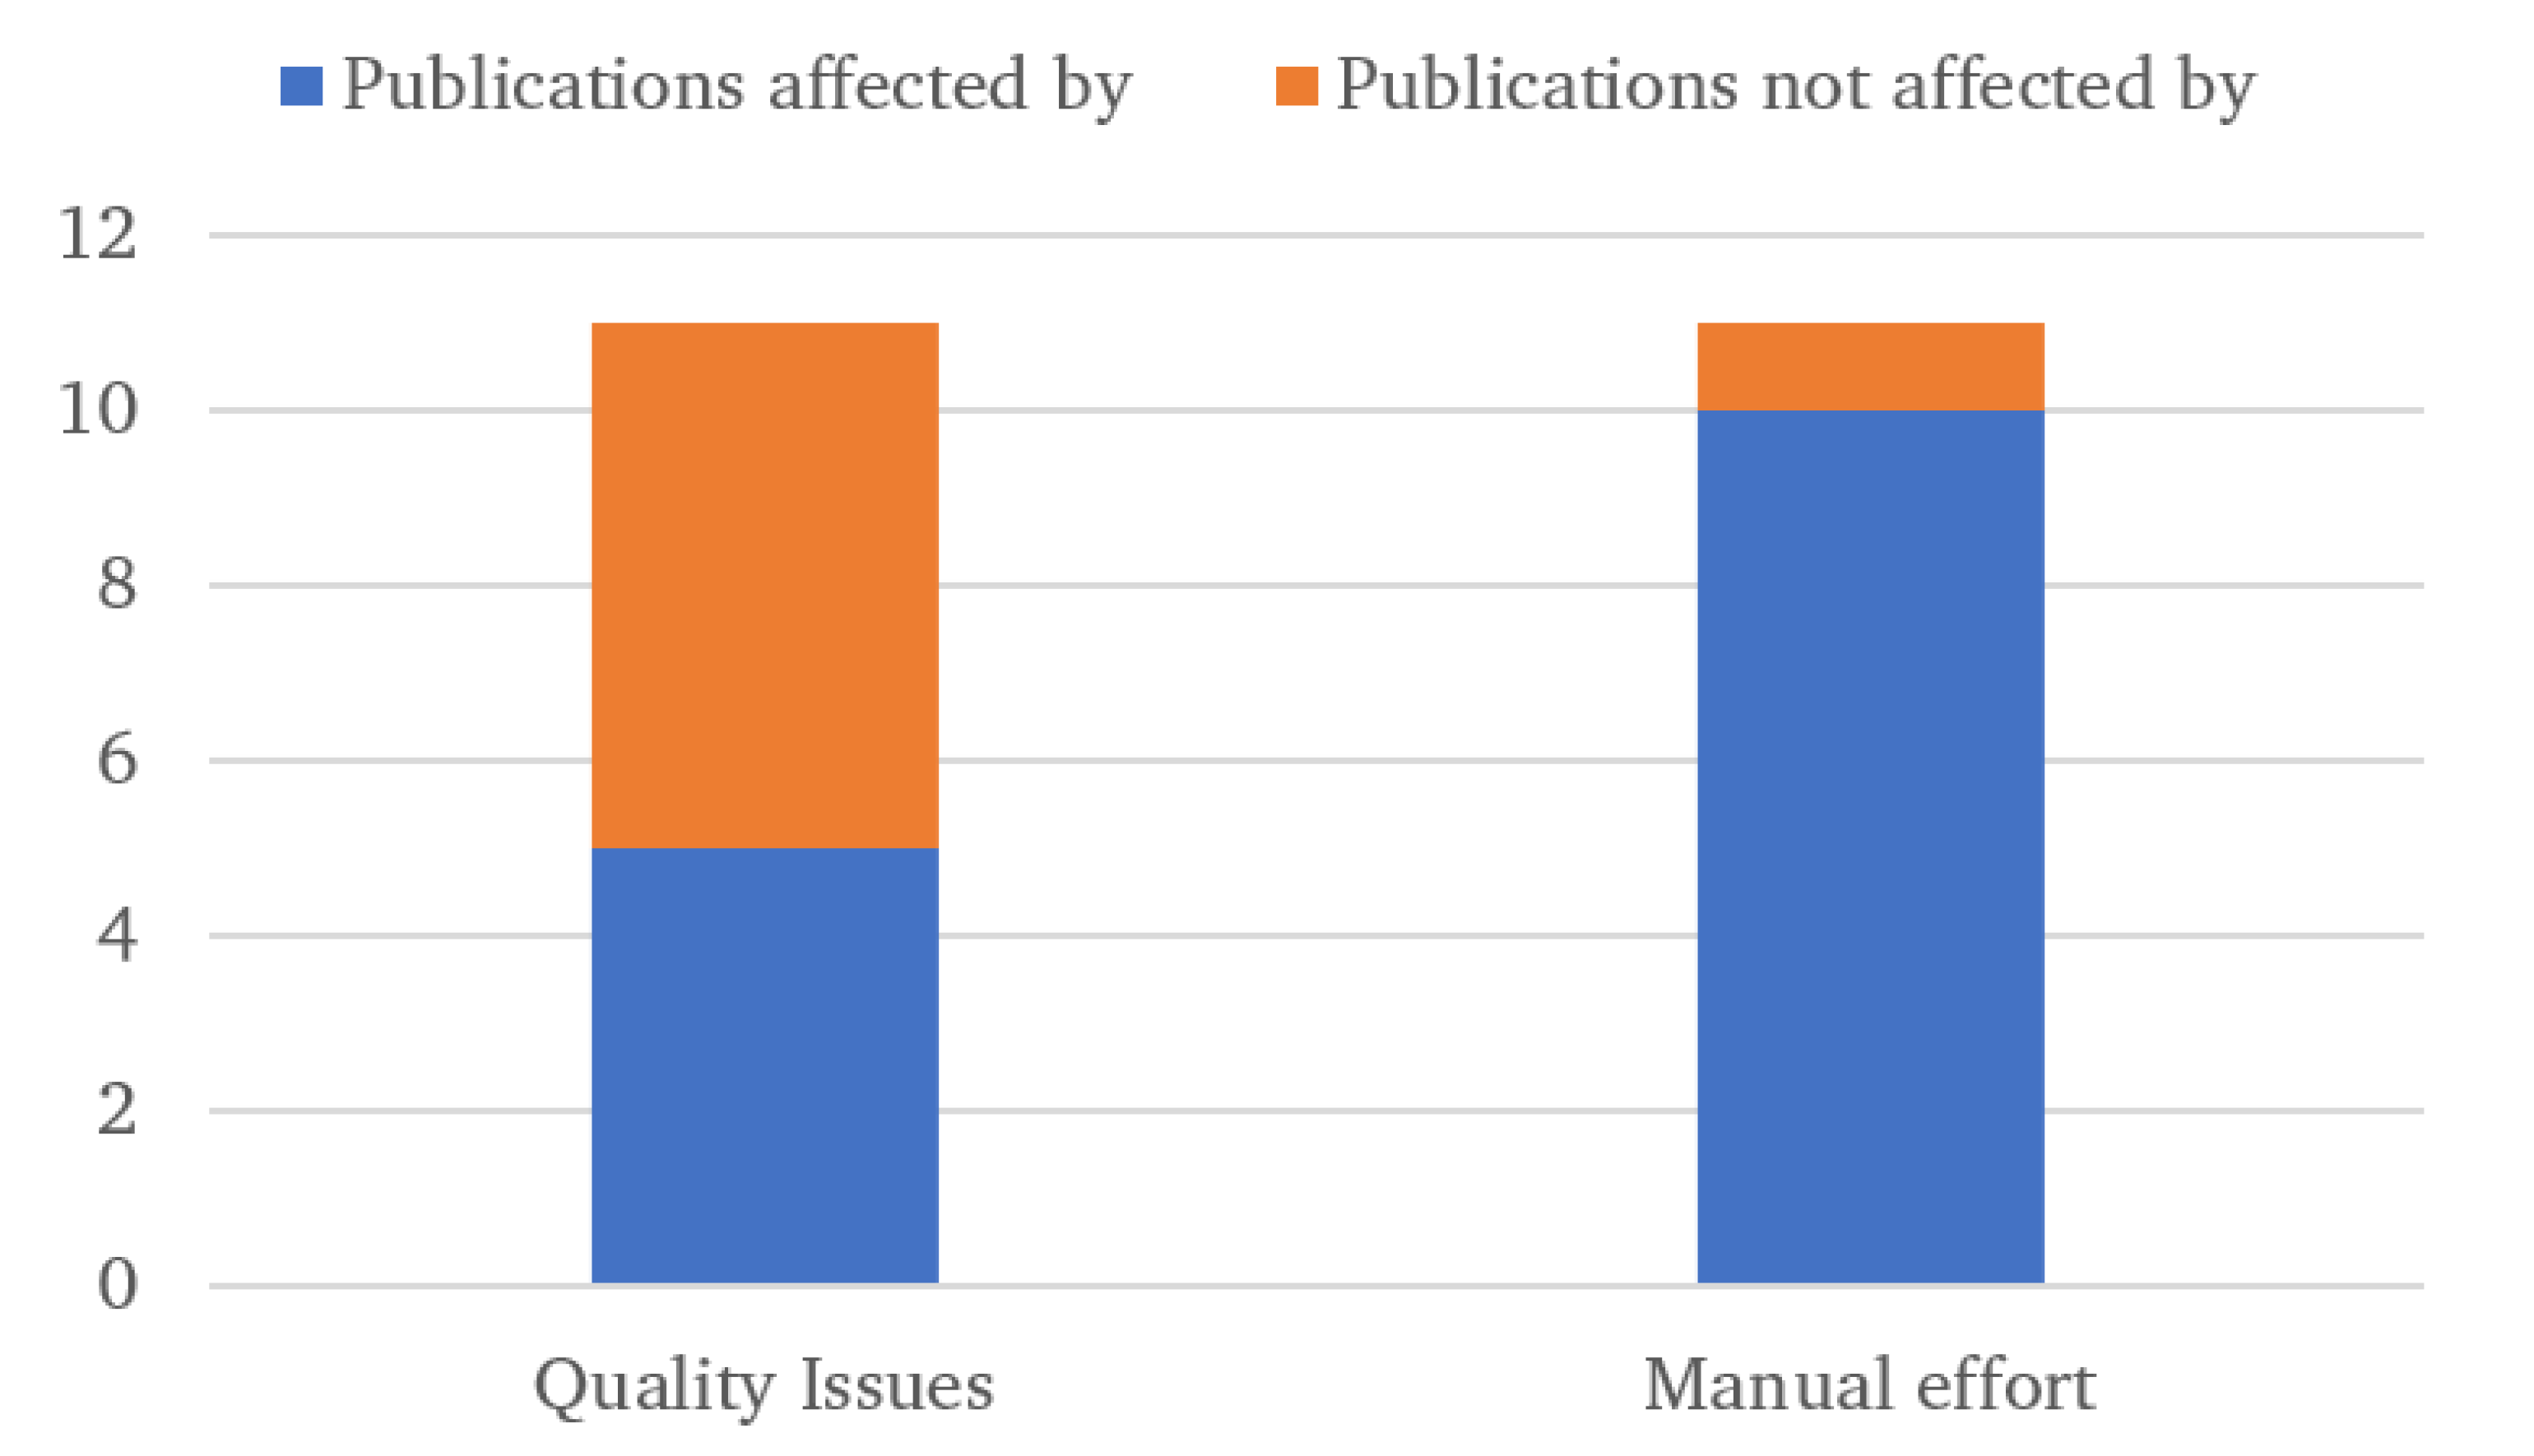
A summary of the findings from this section is shown in Table 4. In this table, data quality issues refer to issues where some analysis cannot be done because of a lack of quality data. This includes scenarios where a portion of the data has to be discarded, where some types of analysis, e.g., downtime, could not be done. It also includes cases where there are issues with the accuracy of some of the results or the underlying data. Manual effort issues, on the other hand, refer to cases where the data needed a significant amount of transformation or manual data entry before being useful (e.g., in the case of alarms data or reading manual reports). This results in the chart in Figure 1. As can be seen, data quality affected the work done in just under half of the papers surveyed, while all but one of them involved significant manual processing of the data to synthesise the results.
4. Issues Encountered in Condition Monitoring Using SCADA Data
CM can be divided into three levels of functionality: fault detection, fault diagnosis and fault prognosis/prediction. In order to build data-driven CM solutions based on SCADA data, periods of faulty and fault-free operation must be identified. Two of the major ways of doing this are through normal behaviour modelling (NBM) and classification-based approaches. NBM can be further split into performance monitoring and temperature modelling techniques. This section reviews issues with data quality for enabling CM at all three levels of functionality based on SCADA data. This review will not go into the specifics of the techniques used or their comparable effectiveness; rather, it will focus solely on the techniques and extra steps required to process the data, which could otherwise be avoided with better quality data. Further, only papers that either mention the source of their fault data or make any mention of the ease or difficulty of working with and getting access to these data will be included. Finally, papers must have been published in 2009 or later. This is because the general state of the industry from a data perspective has not moved on significantly since 2009, i.e., in a large number of cases, the type of data which was available then is much the same as is available now.
4.1. NBM: Performance Monitoring
Performance monitoring models a turbine performance metric such as the power curve under normal conditions, so that any performance deviation when the turbine enters into abnormal operation can be detected. In some cases, additional signals such as pitch angles, ambient temperature or wind direction are also used as inputs to model output power. Even under normal conditions, wind turbines can operate in a number of different modes, including nominal operation and curtailed due to grid, noise or shadow requirements [28]. In the same way that attributing historical unplanned fault-related stoppages to a particular sub-assembly is difficult (as was seen in Section 3), the same can be said for identifying periods of fully-nominal operation [29,30]. Hence, building a model based on these historical periods of nominal operation can be difficult.
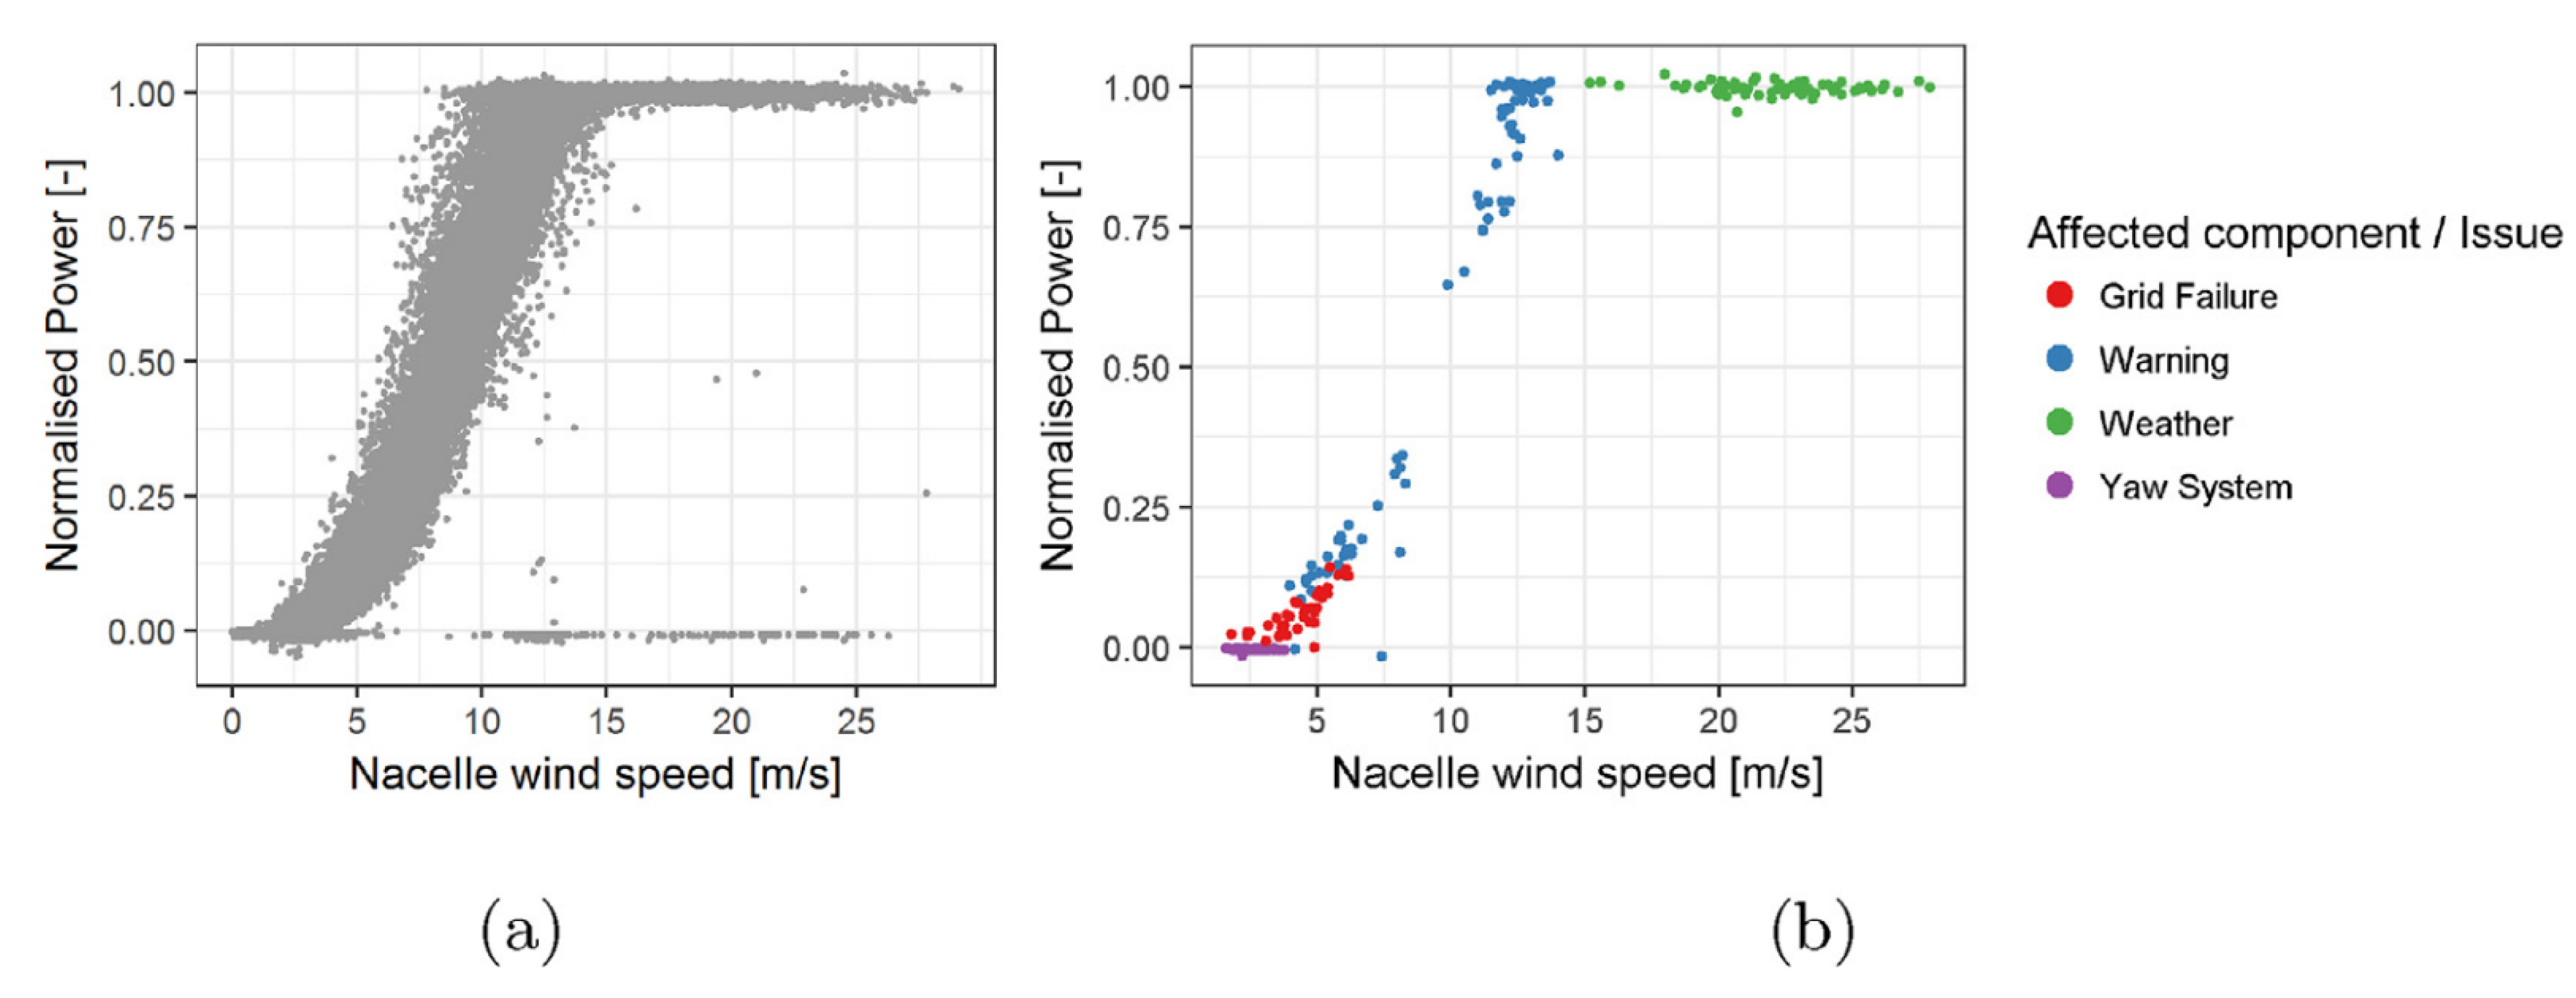
The two ways to do this are through filtering out abnormal periods using alarms and fault logs and by filtering out abnormal data using statistical methods. In [31], the authors built a historical fault database from cross referencing alarms and work order data, based on an extensive process described in [25]. This is then cross referenced with high frequency (i.e., 1 Hz) SCADA data and periods of abnormal operation filtered out. The first step involves filtering out all operational data corresponding to times when certain fault or other alarms were active. However, this still does not cover all problems seen on the turbine, as seen in Figure 2. Even after removing all of the points from Figure 2b, it is clear that there are still underperforming samples, as seen to the right of the power curve in this figure. Hence, an additional filtering step is carried out by using domain knowledge to further eliminate periods of poor performance or abnormal operation. By looking at the control characteristics of the turbine, rotational speeds and pitch angles that do not conform to nominal operation at various wind speeds are further filtered out, resulting in the power curve seen in Figure 3. As will be seen, alternative approaches simply look for statistical outliers on the power curve; however, the authors state that they have not done this here due to the notoriously unreliable nature of turbine anemometers. It should also be noted that the authors use high frequency (i.e., 1 s as opposed to 10 min) data so that transient anomalies can be detected, which may be lost with averaged data [3]. However, as the authors note, in many cases, these higher resolution data are not available.
To avoid having to do a significant amount of work processing turbine alarms data and work orders (which, as previously seen, may not necessarily identify all periods of poor performance), many performance monitoring-based NBM studies instead filter out any abnormal data using statistical methods. In the studies [28,29,30,32,33], a power curve was built from SCADA data where any outliers have been filtered out through a variety of statistical or domain knowledge-based methods. An example of this is provided in Figure 4. Of these, [28] and [33] additionally used domain knowledge to further reduce the number of samples of non-nominal operation. All of these studies, barring [30], used the turbine anemometer as a reference for the wind speed; however, as previously mentioned, turbine anemometers can be unreliable and may not be suitable for use when small deviations in performance need to be detected.
In all of these cases, significant processing is needed to identify historical periods of nominal operation on the turbine in order to build data-driven models for detecting future periods of reduced performance. This processing primarily takes the form of statistical analysis, but can also involve significant processing of alarms and domain knowledge. As will be seen in Section 6, this extra effort could be avoided through improved turbine data.
If accurate and easily-processable historical information were available (e.g., in the form of standardised turbine alarm or operating state information), then this initial filtering step could be avoided, and more information could be kept. In addition, as will be seen, this type of filtering is not always useful for other types of NBM.
4.2. NBM: Temperature Modelling
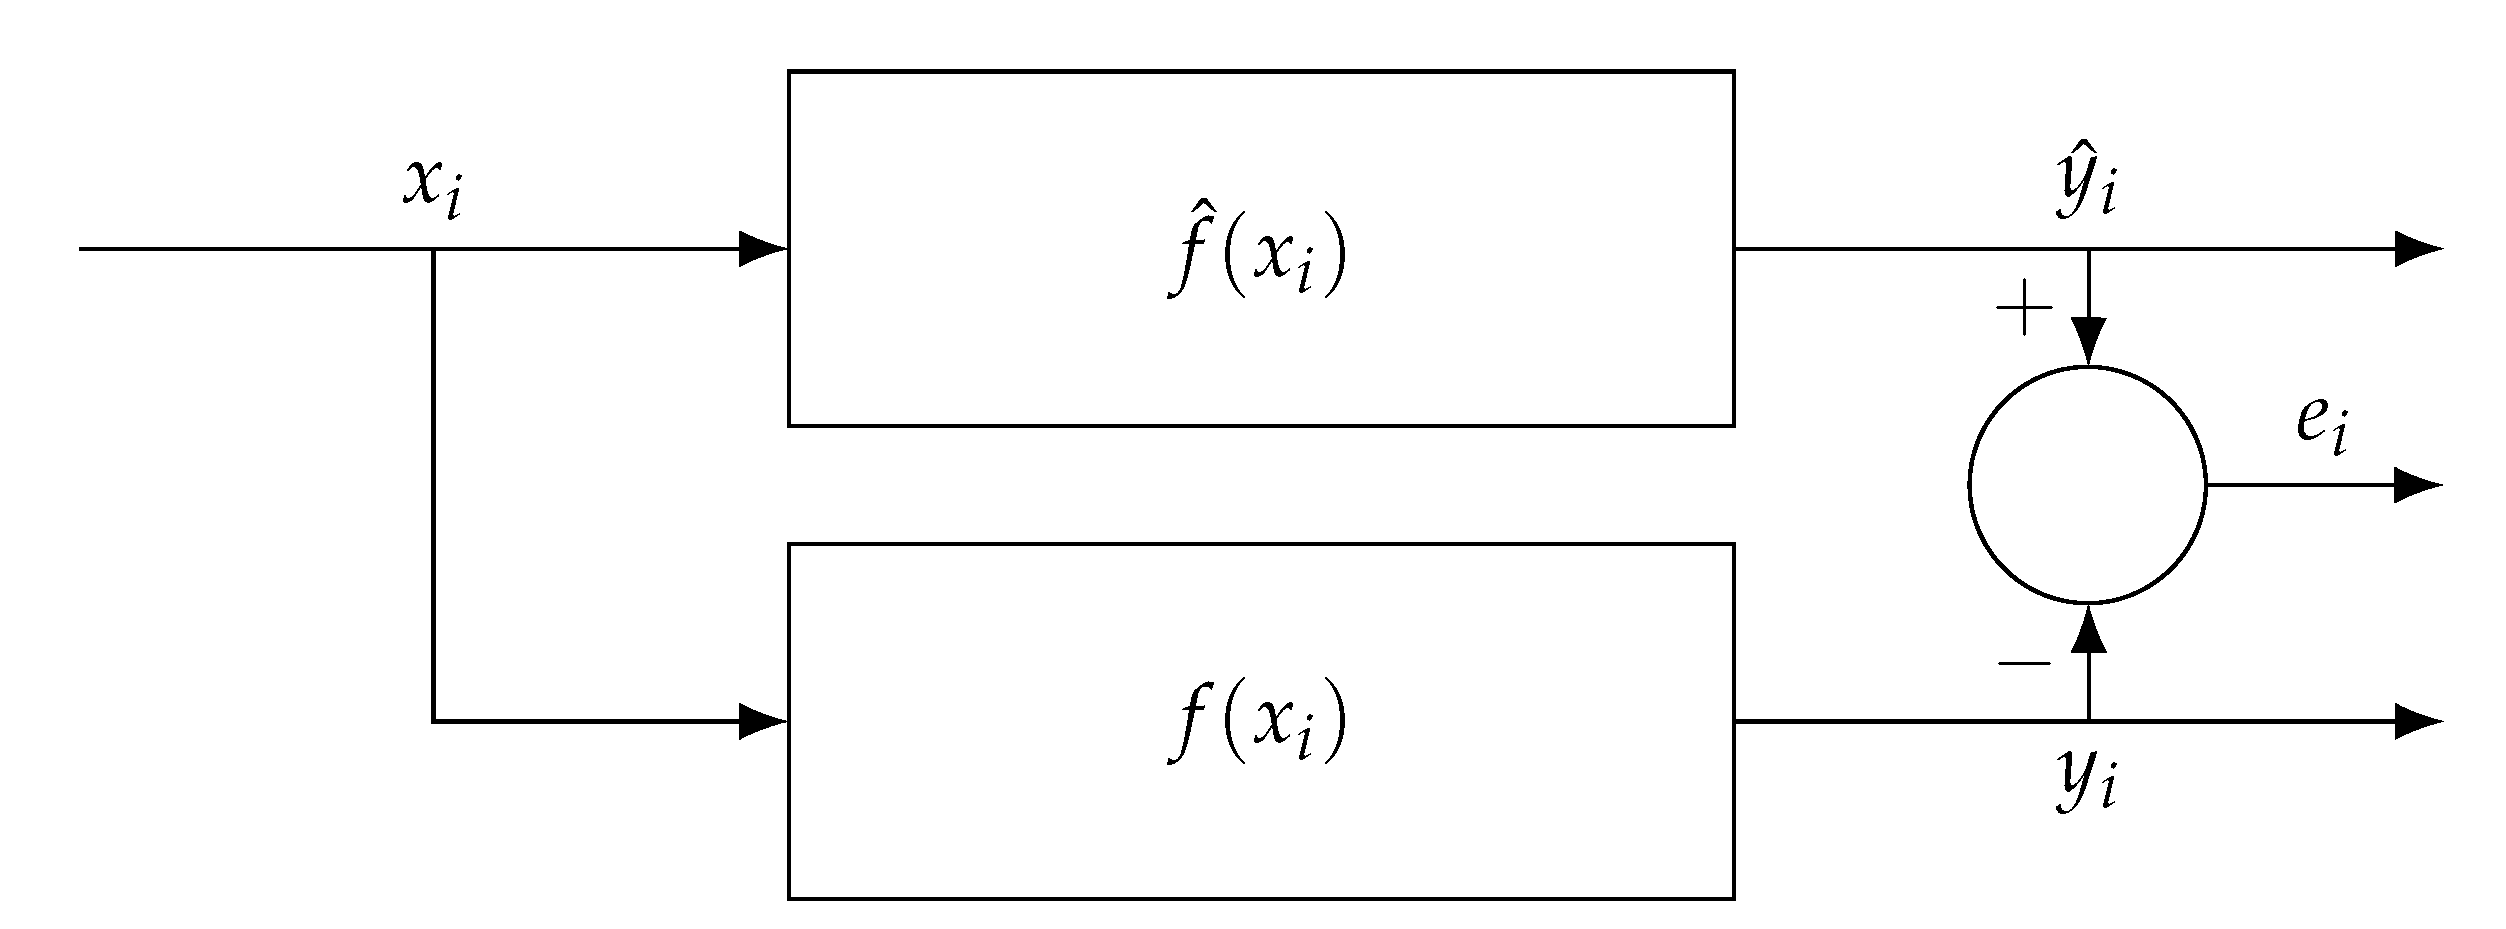
Another major type of NBM for detecting anomalous behaviour indicative of a developing fault is through modelling component temperatures. Similar to performance monitoring, the temperature of a component is modelled using historical data from periods of nominal operation. Then, the modelled or expected temperature value is compared to the live value and a distance metric used to quantify the discrepancy. Any significant residual value between the model and actual output can be indicative of a developing or materialised fault. An overview of this is shown in Figure 5. The advantages of this technique are that, because a specific component temperature is modelled, any abnormality can be associated with that component or its surrounding systems. In addition to this, because the temperature models are usually built using a wide range of SCADA parameters, the data do not significantly rely on the anemometer-recorded wind speeds as the main input to the model.
The issues seen in these studies are similar to those using performance monitoring techniques. In [35], the authors modelled the bearing temperature from a wide variety of SCADA parameters and stated that they manually identified periods of fault-free operation from work order maintenance logs. However, as seen in Figure 2, periods of abnormal operation are not always covered by fault instances. In [36], the authors also developed a model of the main bearing temperature using Gaussian process models. The authors here treated any data where a main bearing fault was not imminent as being “fault-free”, and hence did not distinguish between these faults and any other type of fault. The model still showed a strong indication of failure 30 days in advance when deployed on a test set. The reasoning for this may be because, unlike in performance monitoring where wind speed is an input and power a dependent variable, with temperature modelling, other types of failures may be built into the model; the model takes into account times when the wind is blowing, power output is zero (i.e., the turbine is stopped, possibly due to other faults), and yet the bearing is still healthy. This is an advantage to using this approach; granular failure data are not needed.
However, better performance may still be achieved by filtering out these granular failure data. In [37], the authors built models of gearbox bearing temperature based on artificial neural networks (ANNs) trained with filtered training data. The data needed to be filtered, and this was done in three steps. The first step deals with removing any obviously erroneous values, e.g., frozen sensor values or values where a parameter exceeds an obvious threshold. Next, a cluster filter is developed, similar to that used in [38], which looks at the power curve and uses clustering techniques to remove outliers and samples pertaining to curtailment conditions. This is a similar approach to many of the power curve filtering methods mentioned in Section 4.1. Finally, a simple “backfilling” method is used to fill in any missing data. The models were trained on turbines where there were no significant gearbox faults and tested on turbines that did experience these faults.
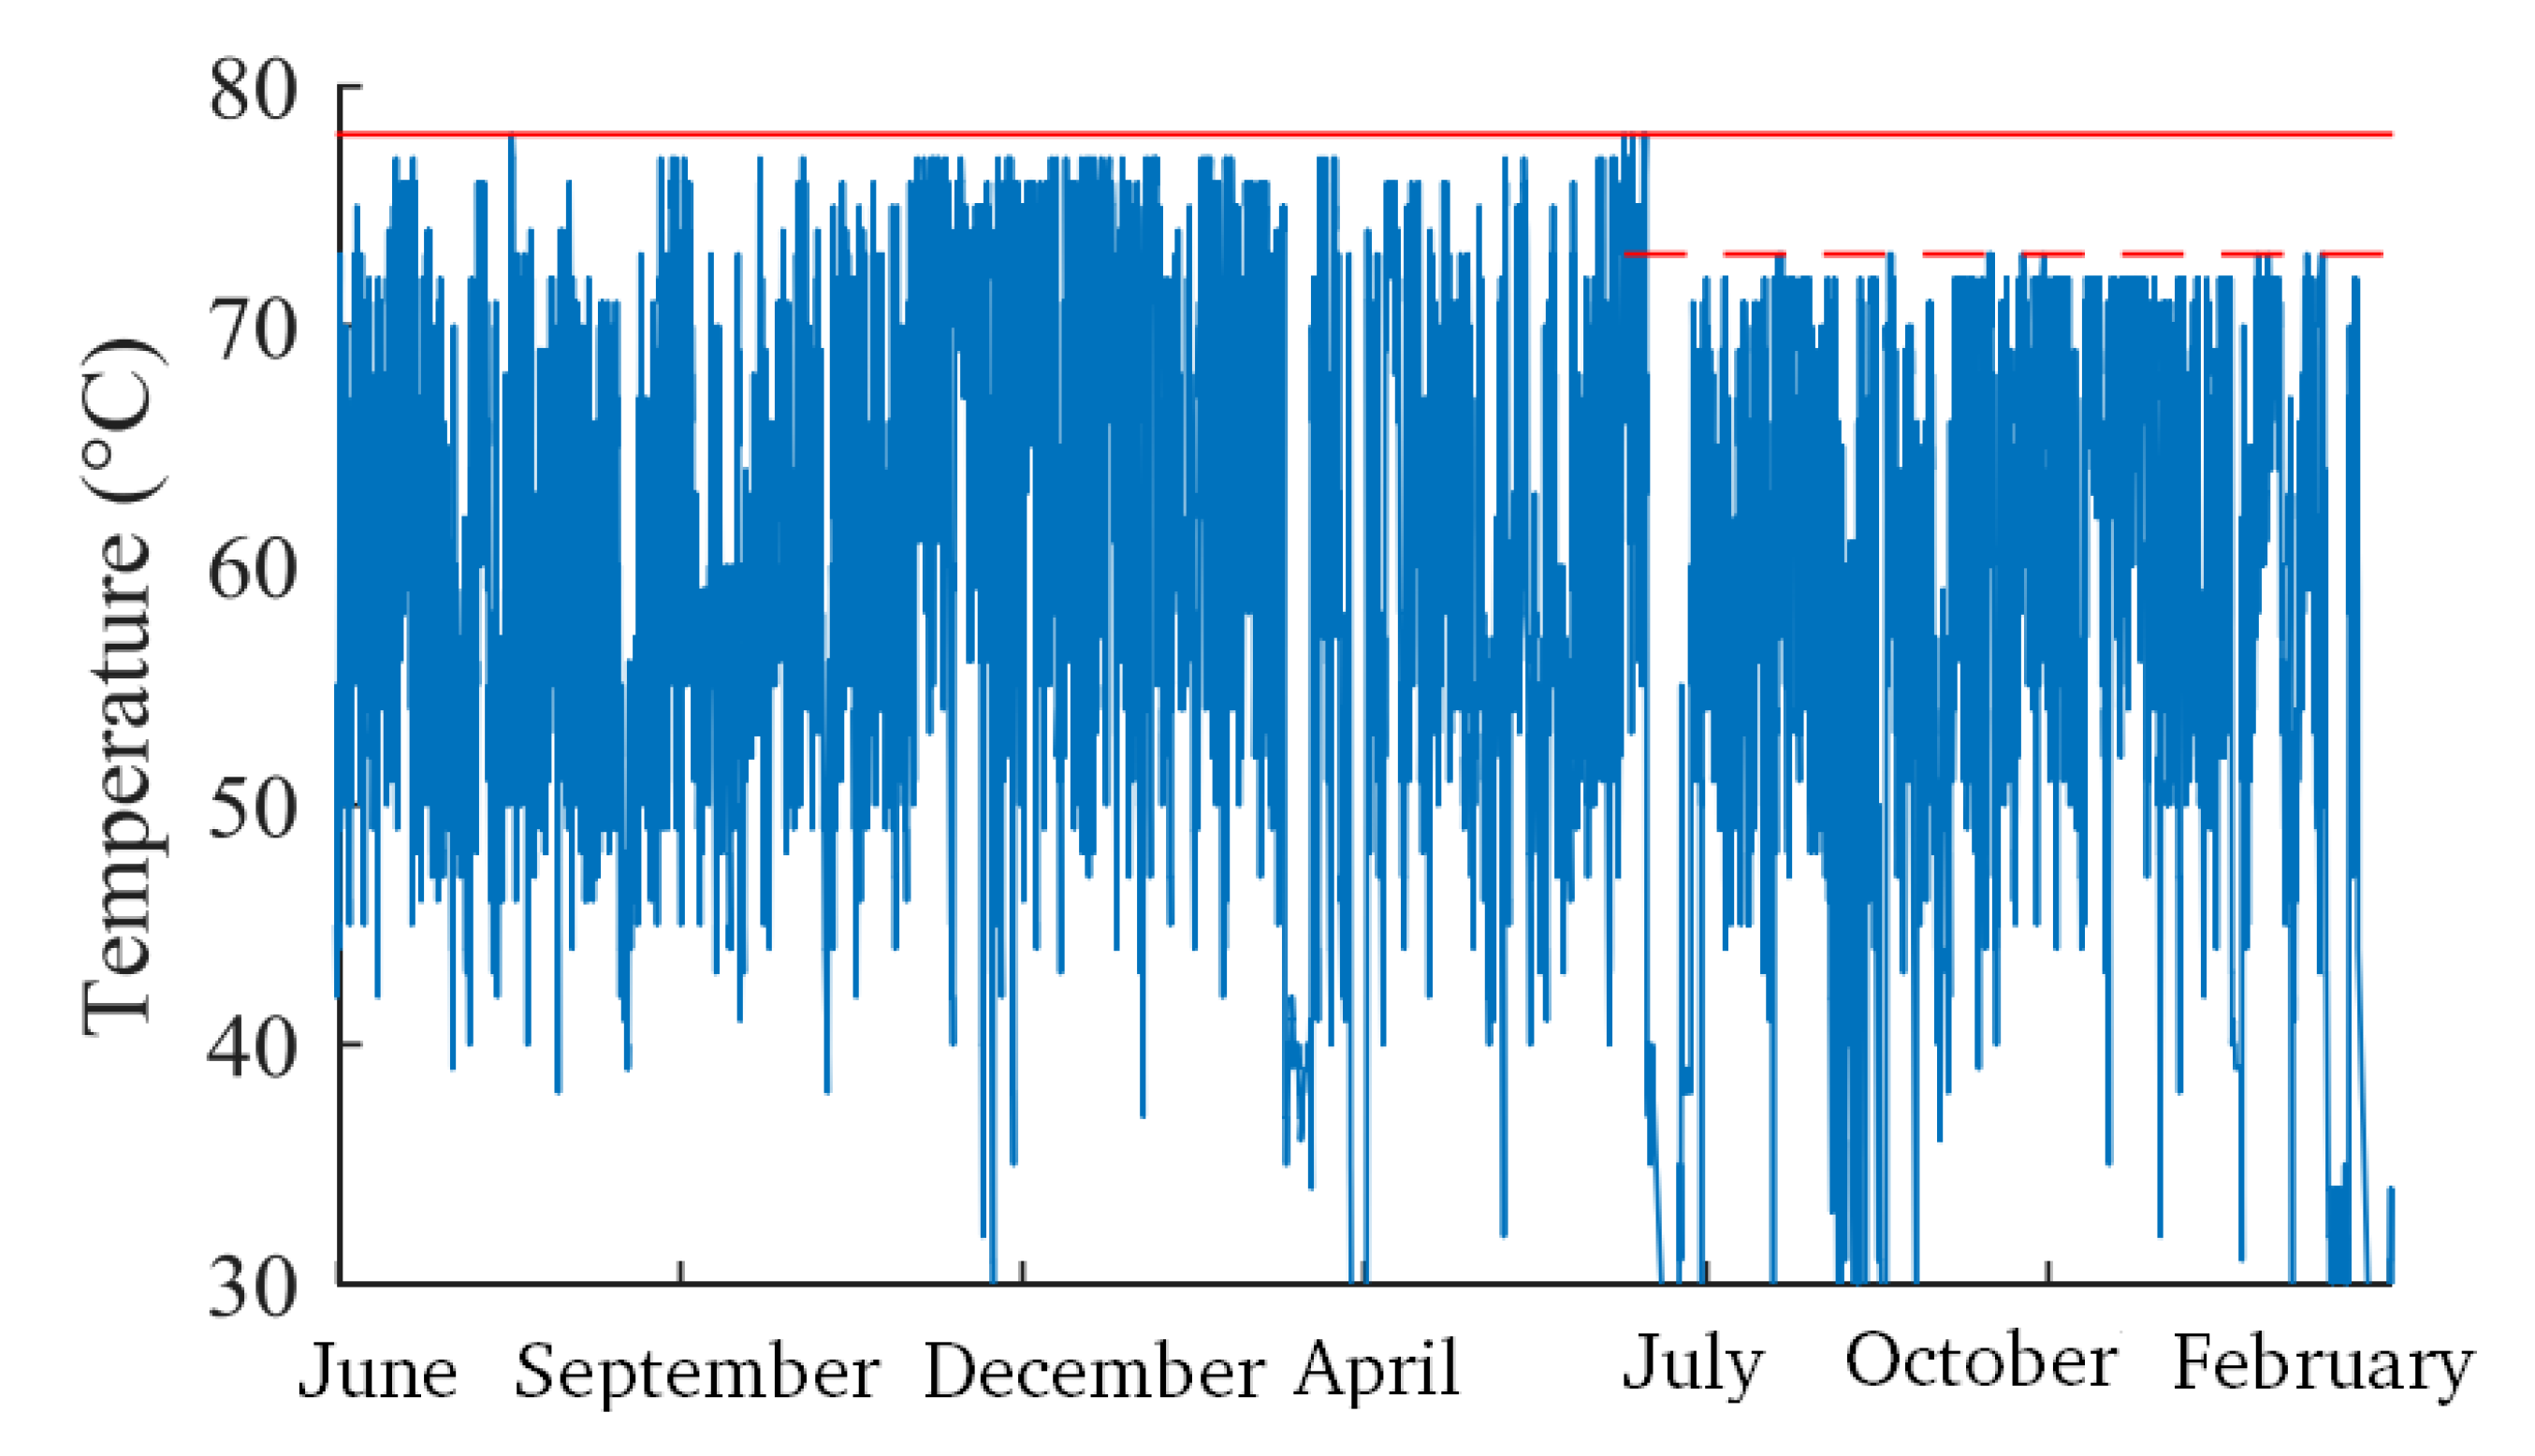
Publications that deal specifically with issues relating to wind turbine data quality are rare. However, in [39], the authors specifically discussed the issues with data quality. They mentioned a number of issues with SCADA data, based on experiences building gearbox bearing temperature models across four wind farms. First, because there is no universally-accepted standard taxonomy (as will be seen in Section 5), the labelling of the SCADA signals can be difficult to interpret, particularly for temperature sensors, where it can be hard to figure out in which part of the turbine each temperature sensor is located. They mention that there is insufficient documentation, as well as perceived confidentiality issues from data providers. Another issue is with inconsistency in the SCADA data. The authors mentioned that step changes occur in many values, probably due to sensor calibration after a software update. An example of this can be seen in Figure 6. This is a big issue for training data-driven models, where these changes must be normalised or otherwise taken into account.
The authors further noted that the work orders/service records available for all four wind farms were of varying quality. In the best case out of all four wind farms, this consisted of a list of stoppages with text added for details of major replacements, and sometimes other maintenance activities. Even still, this did not include reasons for stops or interpretations of alarms and did not list whether any work carried out was as a result of a failure or part of scheduled preventive maintenance. For the other three farms in the study, the failure record either listed some replacements or was not available at all.
4.3. NBM: Other Approaches
In [40], the authors did not model a component temperature, but rather used deep autoencoders to build a representation of normal behaviour that does not model a specific output. They found that blade breakages were detected 2–8 hours in advance when other types of fault data were filtered out, but this was reduced to a maximum of two hours without this filtering. It should be noted that this was a single case study and may not be representative.
In [41], the authors took only two SCADA signals: wind speed and tower acceleration, to build a stochastic model of tower vibration, and compared this with an ANN-based approach. This builds on a methodology mentioned in [42], which uses a similar stochastic approach for modelling torque loads. The authors here mentioned that there was very little data cleaning needed: some values were removed because the recording system flagged them as incorrect, while others outside of were removed. This amounted to less than 25 min over two months of data.
4.4. Classification-Based Approaches
Classification-based approaches aim to classify individual 10-min SCADA operational samples as being fault-free, “pre-fault”, i.e., a fault is imminent, or “faulty”, i.e., a particular type of fault has occurred. The classifiers are trained on a labelled set of historical training data, where each sample must be given one of the above labels. In [43], this is done by direct labelling of the SCADA alarms, i.e., the presence of a particular alarm at a particular time indicates the presence of a particular fault. The authors distinguished between different severities of alarms and only chose those that represented faults that were known to have the potential for severe malfunction on the turbine. However, they noted that there were issues in the alarms data relating to incorrect sensor values (e.g., negative wind speeds) or duplicated values. These were removed from the data before labelling the 10-min operational data samples. A similar approach was taken by the authors in [13] and in [44], and in both of these cases, similar issues with alarms were present. As noted in [22,24], however, individual alarms do not always indicate the presence of a fault, and so, individual alarms may not be an accurate way of labelling historical faults.
The authors in [44] addressed this by analysing patterns of 2–3 alarms, and used these to label the faults. In [22], the authors used a process developed in [45] to create “batches” of alarm sequences and cross-reference these with availability data to try and identify whether a fault had taken place, and where on a particular turbine taxonomy that fault occurred. Both of these approaches require significant further processing of turbine alarms and SCADA data.
Finally, in the studies in [46,47], the authors used maintenance records to indicate the presence of faults. As mentioned previously in this work, however, manually going through service records can be a tedious and time-consuming step. As demonstrated in [46], more training data improve the performance of a model, so if a large operator or OEM wished to use all available data, it would be an inefficient process with room for human error.
4.5. Enhancing Turbine Alarms
The turbine alarm system already provides some CM capabilities in the form of limited fault diagnostics. However, alarms are generally generated at a much higher rate than in other industries [25,45,48]. Because of this, a number of CM approaches aim to enhance the diagnostic capabilities of turbine alarm systems.
The authors in [48] found that alarms are generally generated in volumes that are too high for operators to be able to manage effectively. They also showed that this is even higher during periods of faulty operation. During these periods, they occur in a large and complex volume in what the authors call “alarm showers”, which makes fault diagnostics difficult. The authors performed separate time-based and probability-based analyses to identify alarms that regularly appear together, or that trigger one another, to see how a fault propagates through the subsystems in the turbine. Hence, more advanced fault diagnosis is possible. This concept was expanded in [25], where the alarms were further mapped to a standardised taxonomy (developed in [24]). This enabled alarms that were directly related to faults to be identified. Hence, the sequence of events as a fault occurred from root cause to failure mode could be tracked.
In [45], the authors made note of these issues with turbine alarm systems, as well as issues with documentation and “informal” knowledge held by maintenance technicians, which may not be well documented or shared. A similar probability analysis to that in [48] needed to be carried out in order to identify alarms that were relevant to faults in certain subsystems. Clustering algorithms were then used to identify distinct patterns of alarm sequences, for analysis by operators to map to specific types of faults.
In [49], the authors aimed to reduce the burden of analysis of alarms on operators through the use of pattern recognition techniques based on ANNs. Alarm sequences that occurred during or leading up to fault-related shut-downs were identified. Once the model was trained, any sequences as they occurred in real time could be fed to the ANN model, and particular types of faults could be flagged without the need for an operator to view manually and analyse the various alarms. Hence, the number of alarms that operators needed to analyse was reduced. However, the authors noted that more work is needed to improve the accuracy of the technique used.
4.6. CBM Conclusions
Similar to previously, a summary of the CM methods, evaluated in terms of access issues, quality issues and manual effort issues, is provided in Table 5. As before, access issues refer to difficulties getting access to the data or supplementary materials (documentation and other context), from, for example, the OEM or operator. Quality issues refer to whether data needed to be discarded due to sensor issues, issues with missing data or any other kind of problem with the data that led to decreased model performance or accuracy. Manual effort refers to whether a significant manual intervention was needed in order to access and/or process the data. This includes processing of alarms or having to read work orders manually and build a failure database.
As can be seen in Figure 7, a small number of publications explicitly stated that there were issues with data access. Although not universally mentioned, as will be seen in Section 5, industry reports and commentary by academics have highlighted this as an area of concern. Meanwhile, just over half mentioned there were quality issues with the data. In the case of publications using performance monitoring techniques, these issues came from cases of using turbine-mounted anemometers for measuring wind speed. As mentioned in Section 4.1, these are not always accurate, and certain studies (e.g., [30]) instead use wind mast wind speed data to avoid this issue. Other issues with quality included non-trivial amounts of SCADA data needing to be disregarded due to erroneous or missing values. Also mentioned were issues with the work order data, where times that certain work was carried out may not necessarily map to times when the failure took place, or they were lacking in detail. Finally, all alarm-centred techniques mentioned the common issues seen with SCADA alarms, i.e., being generated in very high volumes, lack of standardisation and significant expert knowledge needed to decode and understand the alarms.
Every study mentioned, barring [41], involved significant manual effort to process the data. In cases where work orders were used, this involved having to go through the work orders manually to read descriptions and times of work carried out and using this to create a failure database. In the case of performance monitoring, effort was needed in finding a way to filter out underperforming periods in order to build an NBM of turbine performance. Once again, issues with alarms meant that these needed to be significantly processed before a granular picture of historical turbine operation could be built.
5. Summary of Issues and Proposed Solutions
5.1. Summary of Issues
From the previous two sections, it is clear that issues with turbine data still persist within the industry. From a researcher’s perspective, these can be distilled into the following broad areas:
- Lack of standardisation in SCADA data and maintenance records
- -
- Standard alarm codes
- -
- Standard column names for 10-min data
- -
- Standard, universal taxonomy
- -
- Standard structured database format for maintenance records
- Issues with openness and access to data for researchers, including access to higher resolution (≥10 min) data
- Better context or reduced volume for alarms data
The lack of standardisation of SCADA data and maintenance records presents many challenges. From a reliability analysis perspective, this means that researchers must spend considerable time synthesising various different disparate sources of data into a usable format. Further, because in many cases the data are not structured with reliability analyses in mind, there are varying levels of analysis that can be done, e.g., repair costs, downtime analysis, etc. A special case of both of these issues is the alarm system. There is no universally-applied taxonomy for alarm system data, and no standards on the volume of alarms that can be generated, leading to significant effort being needed to map this to a failure database.
From a condition monitoring perspective, the same issues apply. Building a historical failure database to train a data-driven model requires more granular information on failures. It also requires a large database of failures, which means data from more than one wind farm may need to be drawn on. Having to go through an extensive ad-hoc approach for data cleaning and contextualising for every wind farm or make/model of turbine means less time can be spent on actually coming up with the solutions. In addition, there are in some cases access issues with OEMs being reluctant to share all available data with researchers [50].
5.2. Industry Experiences
While these broad issues have been summarised as a result of findings in this review, it has been known within the wind industry for some time that data are an issue that needs to be addressed. The ReliaWind final report, published in 2011, set out a number of recommendations for standardisation of maintenance data for the purposes of reliability reporting [51,52]. In 2012, an Elforsk report also made significant mention of the fact that accurate reliability and failure data were not available and made the recommendation to standardise these data and make them more openly accessible [53]. However, in 2016, this had still not become standard practice, as mentioned by the European Academy of Wind Energy (EAWE) [54].
Echoing other industry calls, the International Energy Agency (IEA) Wind Technology Collaboration Programme Task 33 focused on data collection and reliability assessment for wind energy. This culminated in Recommended Practice 17, which provides a number of recommendations for collecting, storing, standardising and sharing reliability data [55]. Although there are a number of existing standards for wind turbine taxonomies, there is still no one universal standard, and this is something that Task 33 aims to address.
From an academic standpoint, the authors of [3] stated in 2014 that issues with SCADA data for CM include lack of access to higher resolution data and issues with the volume of alarms being generated, echoing the broad findings from this review. A recent commentary in Nature highlighted the difficulties with getting OEMs or operators to share data with researchers [50]. This lack of data openness was another gap highlighted by the EAWE [54]. At the nexus of data openness and common standards is the EU-funded Integrated Research Programme on Wind Energy (IRPWind). This project aims to build a standardised taxonomy and supporting contextualising metadata, which the researchers noted is often missing from wind energy data. The intention is that this would then be used to provide a platform where data owners can securely share their data with researchers in order to build better O&M solutions for wind turbines [56].
5.3. Existing Standards
There exist a number of standards relevant to various aspects of the data talked about in this paper. They can be broadly split into two areas: taxonomies for physical parts and assemblies of the turbine; and standards for operational and availability data.
The ReliaWind taxonomy was developed by the ReliaWind project and is a commonly-used taxonomy in academia due to being openly available and simple to apply [52]. The Reference Designation System for Power Plants (RDS-PP) standard is a taxonomy for wind turbine components that was directly adapted from similar power industry taxonomies and designed to be consistent with designations of other power system types [57].
The Generating Availability Data System (GADS) database from the North American Electric Reliability Corporation (NERC) includes annual summary reports on statistics of power stations in the United States and Canada. All electricity producers in these markets have to report prescribed data, applied in a taxonomy specific to the GADS database [58].
ISO 14224, meanwhile, is a comprehensive taxonomy for reliability assessment in the oil and gas industry. This covers all aspects from equipment data (manufacturer’s data and design characteristics), to operational data (operating mode, power output, etc.), to failure and maintenance data (failure mode, cause and mechanism, maintenance activities and times, etc.). However, this standard is not yet complete and is not wind specific [10]. IEC 61400 covers a wide range of design standards for wind turbines. This includes IEC 61400-26, which is currently in a draft stage. This aims to standardise different availability categories for wind turbines and assign all times in which a turbine is operating to one of these states. There are 14 different categories, to which some OEMs assign their alarm states [59].
As is evident, there is much overlap between these standards, and as discussed in Section 5.2, the wind industry has yet to settle on a universal set of standards that will be used. This universal set of standards should include a taxonomy for mapping faults and reliability to OEM-agnostic assembly codes. It will also be important to adopt a universal format for maintenance reporting, allowing technicians to ascribe a fault or repair action to a standard taxonomy from a prescribed list of possible faults/repair actions. This will result in an easy-to-manage, structured failure database for individual turbines, which can then easily be used to build a picture of reliability or data-driven CM models. By standardising SCADA alarms and availability data, some parts of this may be automated, without the need for technicians manually inputting maintenance or failure records. An example of what this functionality might look like is found in [22], where the authors build a historical failure database by feeding in alarms and availability data. This standardisation would allow researchers to focus their efforts on building the next generation of maintenance and reliability analysis tools, without needing to worry about the quality of data available.
6. Conclusions
This work summarises issues encountered by researchers when working with wind turbine data, from both a perspective of carrying out reliability studies and building data-driven condition monitoring models from SCADA data. First, in Section 2, an overview of common data sources for wind turbines is presented. This goes through the common sources of data, including SCADA operational, alarms and availability data and maintenance logs.
Next, in Section 3, issues encountered with these data when conducting reliability studies are discussed. Eleven reliability studies are reviewed, and issues with data from a quality perspective, as well as any extensive manual processing that is needed, are investigated. Data quality issues here refer to any instances where data had to be discarded or where some types of analysis could not be carried out due to the format or availability of the data. Manual processing issues refer to instances where significant effort was expended in getting the data into a usable format for reliability analysis. It was found that five of the reliability studies surveyed faced issues with data quality, while all but one of the studies needed significant manual processing of the data to get it into a usable format. This has significance in that there is great potential for this process to be streamlined and for more robust and comparable studies to be done should the data streams be standardised.
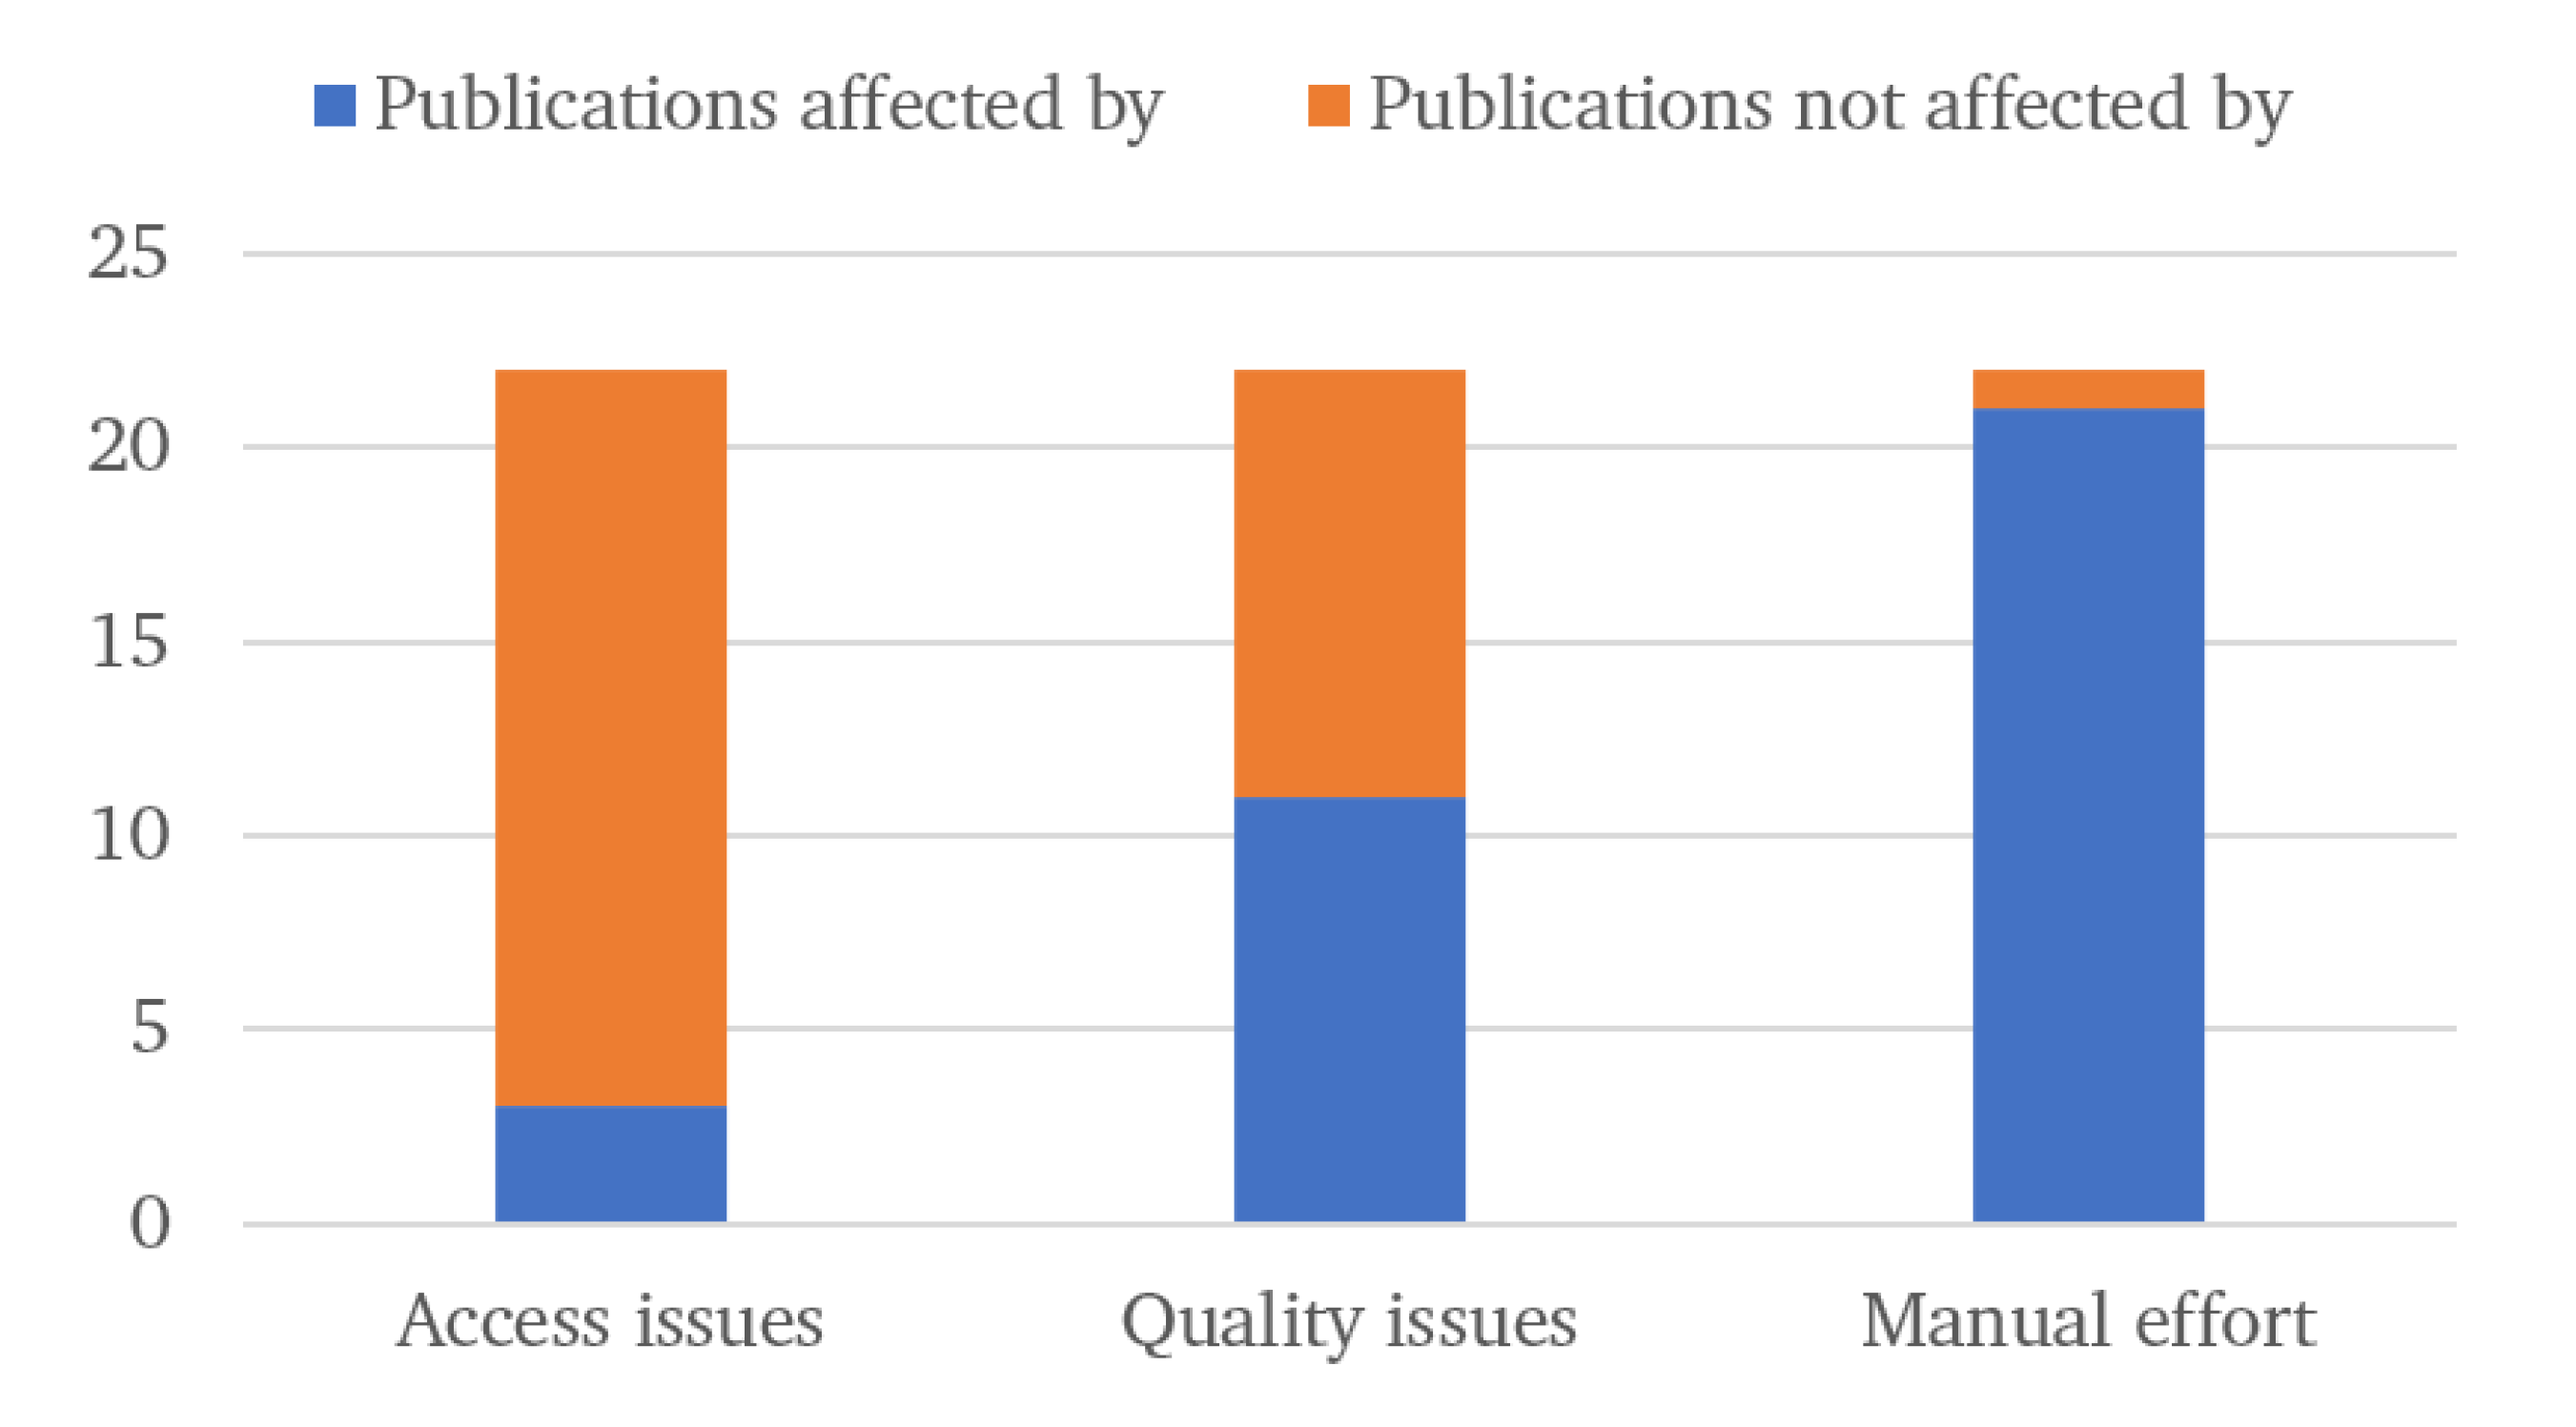
Section 4 looks at the above issues, but from a perspective of building data-driven condition monitoring solutions based on SCADA data. Additionally, issues with data access are presented, which includes any problems with being granted access to data from OEMs or operators. Of the 22 papers reviewed, it was found that three papers faced issues with getting access to data. Eleven papers faced issues with data quality, while 21 of the 22 needed significant manual processing of the data before they could be used to train data-driven condition monitoring models. These findings once again point to there being some systemic issues with researchers being able to access good quality data.
Section 5 summarises the issues and discusses industry attempts to alleviate them. This includes a review of industry initiatives over the past few years that have highlighted these issues, as well as existing standards that have seen various levels of adoption in the wind industry. The main recommendation from this piece of work is that the industry would benefit hugely from standards for turbine taxonomies, alarm codes, SCADA operational data and maintenance and fault reporting. It is hoped that this work will provide some academic context for what the requirements of these standards should be.
Author Contributions
Conceptualization, K.L. and C.G.; Methodology, K.L.; Validation, K.L., C.G. and P.O.; Formal Analysis, K.L.; Investigation, K.L.; Resources, K.L.; Data Curation, K.L.; Writing-Original Draft Preparation, K.L.; Writing-Review & Editing, K.L, C.G. and P.O.; Visualization, K.L.; Supervision, D.T.J.O.; Project Administration, D.T.J.O.; Funding Acquisition, D.T.J.O.
Funding
This research was funded by Science Foundation Ireland under Grant 12/RC/2302 for the Centre for Marine and Renewable Energy (MaREI).
Conflicts of Interest
The authors declare no conflicts of interest. The funders had no role in the design of the study; in the collection, analyses, or interpretation of data; in the writing of the manuscript, and in the decision to publish the results.
References
- International Renewable Energy Agency. Renewable Power Generation Costs in 2017; Technical Report; International Renewable Energy Agency: Abu Dhabi, UAE, 2018. [Google Scholar]
- VGB PowerTech. Levelised Cost of Electricity LCOE 2015; Technical Report; VGB PowerTech: Berlin, Germany, 2015. [Google Scholar]
- Yang, W.; Tavner, P.J.; Crabtree, C.J.; Feng, Y.; Qiu, Y. Wind turbine condition monitoring: Technical and commercial challenges. Wind Energy 2014, 17, 673–693. [Google Scholar] [CrossRef]
- Yürüşen, N.Y.; Tautz-Weinert, J.; Watson, S.J.; Melero, J.J. The Financial Benefits of Various Catastrophic Failure Prevention Strategies in a Wind Farm: Two market studies (UK-Spain). J. Phys. 2017, 926, 012014. [Google Scholar] [CrossRef] [Green Version]
- Kothamasu, R.; Huang, S.H.; VerDuin, W.H. System health monitoring and prognostics—A review of current paradigms and practices. Int. J. Adv. Manuf. Technol. 2006, 28, 1012–1024. [Google Scholar] [CrossRef]
- Ben-Daya, M.; Duffuaa, S.O.; Raouf, A.; Knezevic, J.; Ait-Kadi, D. Handbook of Maintenance Management and Engineering; Springer: London, UK, 2009; pp. 223–235. [Google Scholar]
- Yang, W.; Court, R.; Jiang, J. Wind turbine condition monitoring by the approach of SCADA data analysis. Renew. Energy 2013, 53, 365–376. [Google Scholar] [CrossRef]
- Tautz-Weinert, J.; Watson, S.J. Using SCADA data for wind turbine condition monitoring—A review. IET Renew. Power Gener. 2017, 11, 382–394. [Google Scholar] [CrossRef]
- Artigao, E.; Martín-Martínez, S.; Honrubia-Escribano, A.; Gómez-Lázaro, E. Wind turbine reliability: A comprehensive review towards effective condition monitoring development. Appl. Energy 2018, 228, 1569–1583. [Google Scholar] [CrossRef]
- ISO. ISO 14224: 2016 Petroleum, Petrochemical and Natural Gas Industries—Collection and Exchange of Reliability and Maintenance Data for Equipment; ISO: Geneva, Switzerland, 2016. [Google Scholar]
- Spinato, F. The Reliability Wind of Turbines. Ph.D. Thesis, Durham University, Durham, UK, 2008. [Google Scholar]
- Pfaffel, S.; Faulstich, S.; Rohrig, K. Performance and reliability of wind turbines: A review. Energies 2017, 10, 1904. [Google Scholar] [CrossRef]
- Leahy, K.; Hu, R.L.; Konstantakopoulos, I.C.; Spanos, C.J.; Agogino, A.M.; O’Sullivan, D.T. Diagnosing and Predicting Wind Turbine Faults from SCADA Data Using Support Vector Machines. Int. J. Progn. Health Manag. 2018, 9, 1–11. [Google Scholar]
- Faulstich, S.; Durstewitz, M.; Hahn, B.; Knorr, K.; Rohrig, K. Windenergy Report Germany 2008; Technical Report; ISET: Kassel, Germany, 2008. [Google Scholar]
- Hahn, B.; Durstewitz, M.; Rohrig, K. Reliability of Wind Turbines: Experiences of 15 years with 1500 WTs. In Wind Energy: Proceedings of the Euromech Colloquium; Springer: Berlin, Germany, 2007; pp. 329–332. [Google Scholar] [CrossRef]
- Faulstich, S.; Hahn, B.; Tavner, P.J. Wind turbine downtime and its importance for offshore deployment. Wind Energy 2011, 14, 327–337. [Google Scholar] [CrossRef]
- Tavner, P.J.; Xiang, J.; Spinato, F. Reliability analysis for wind turbines. Wind Energy 2006, 10, 1–18. [Google Scholar] [CrossRef]
- Spinato, F.; Tavner, P.; van Bussel, G.; Koutoulakos, E. Reliability of wind turbine subassemblies. IET Renew. Power Gener. 2009, 3, 387. [Google Scholar] [CrossRef]
- Ribrant, J.; Bertling, L.M. Survey of failures in wind power systems with focus on Swedish wind power plants during 1997–2005. IEEE Trans. Energy Convers. 2007, 22, 167–173. [Google Scholar] [CrossRef]
- Wilkinson, M.; Hendriks, B.; Spinato, F.; Delft, T.V. Measuring Wind Turbine Reliability—Results of the Reliawind Project. In Proceedings of the European Wind Energy Association Conference, Brussels, Belgium, 14–17 March 2011; pp. 1–8. [Google Scholar]
- Peters, V.A.; Ogilvie, A.B.; Bond, C.R. Continuous Reliability Enhancement for Wind (CREW) Database: Wind Plant Reliability Benchmark; Technical Report; Sandia National Laboratories: Albuquerque, NM, USA, 2012.
- Leahy, K.; Gallagher, C.; O’Donovan, P.; Bruton, K.; O’Sullivan, D. A Robust Prescriptive Framework and Performance Metric for Diagnosing and Predicting Wind Turbine Faults Based on SCADA and Alarms Data with Case Study. Energies 2018, 11, 1738. [Google Scholar] [CrossRef]
- Kaidis, C.; Uzunoglu, B.; Amoiralis, F. Wind turbine reliability estimation for different assemblies and failure severity categories. IET Renew. Power Gener. 2015, 9, 892–899. [Google Scholar] [CrossRef]
- Reder, M.D.; Gonzalez, E.; Melero, J.J. Wind Turbine Failures—Tackling current Problems in Failure Data Analysis. J. Phys. 2016, 753, 072027. [Google Scholar] [CrossRef]
- Gonzalez, E.; Reder, M.; Melero, J.J. SCADA alarms processing for wind turbine component failure detection. J. Phys. 2016, 753, 072019. [Google Scholar] [CrossRef]
- Carroll, J.; McDonald, A.; McMillan, D. Reliability Comparison of Wind Turbines With DFIG and PMG Drive Trains. IEEE Trans. Energy Convers. 2015, 30, 663–670. [Google Scholar] [CrossRef] [Green Version]
- Carroll, J.; McDonald, A.; McMillan, D. Failure rate, repair time and unscheduled O&M cost analysis of offshore wind turbines. Wind Energy 2016, 19, 1107–1119. [Google Scholar] [CrossRef]
- Butler, S.; Ringwood, J.; O’Connor, F. Exploiting SCADA system data for wind turbine performance monitoring. In Proceedings of the 2013 IEEE Conference on Control and Fault-Tolerant Systems (SysTol), Nice, France, 9–11 October 2013; pp. 389–394. [Google Scholar] [CrossRef]
- Park, J.Y.; Lee, J.K.; Oh, K.Y.; Lee, J.S. Development of a Novel Power Curve Monitoring Method for Wind Turbines and Its Field Tests. IEEE Trans. Energy Convers. 2014, 29, 119–128. [Google Scholar] [CrossRef]
- Marvuglia, A.; Messineo, A. Monitoring of wind farms’ power curves using machine learning techniques. Appl. Energy 2012, 98, 574–583. [Google Scholar] [CrossRef]
- Gonzalez, E.; Stephen, B.; Infield, D.; Melero, J.J. Using high-frequency SCADA data for wind turbine performance monitoring: A sensitivity study. Renew. Energy 2019, 131, 841–853. [Google Scholar] [CrossRef]
- Cambron, P.; Lepvrier, R.; Masson, C.; Tahan, A.; Pelletier, F. Power curve monitoring using weighted moving average control charts. Renew. Energy 2016, 94, 126–135. [Google Scholar] [CrossRef]
- Kusiak, A.; Zheng, H.; Song, Z. Models for monitoring wind farm power. Renew. Energy 2009, 34, 583–590. [Google Scholar] [CrossRef]
- Leahy, K.; Hu, R.L.; Konstantakopoulos, I.C.; Spanos, C.J.; Agogino, A.M. Diagnosing wind turbine faults using machine learning techniques applied to operational data. In Proceedings of the 2016 IEEE International Conference on Prognostics and Health Management (ICPHM), Ottawa, ON, Canada, 20–22 June 2016; pp. 1–8. [Google Scholar] [CrossRef]
- Garlick, W.G.; Dixon, R.; Watson, S.J. A Model-based Approach to Wind Turbine Condition Monitoring using SCADA Data. In Proceedings of the 20th International Conference on Systems Engineering, Coventry, UK, 8–10 September 2009. [Google Scholar]
- Butler, S. Prognostic Algorithms for Condition Monitoring and Remaining Useful Life Estimation. Ph.D. Thesis, NUI Maynooth, Maynooth, Ireland, 2012. [Google Scholar]
- Bangalore, P.; Letzgus, S.; Karlsson, D.; Patriksson, M. An artificial neural network-based condition monitoring method for wind turbines, with application to the monitoring of the gearbox. Wind Energy 2017, 20, 1421–1438. [Google Scholar] [CrossRef]
- Kusiak, A.; Verma, A. Monitoring wind farms with performance curves. IEEE Trans. Sustain. Energy 2013, 4, 192–199. [Google Scholar] [CrossRef]
- Tautz-Weinert, J.; Watson, S.J. Challenges in Using Operational Data for Reliable Wind Turbine Condition Monitoring. In Proceedings of the The 27th International Ocean and Polar Engineering Conference (ISOPE), San Francisco, CA, USA, 25–30 June 2017; pp. 613–620. [Google Scholar]
- Wang, L.; Zhang, Z.; Xu, J.; Liu, R. Wind Turbine Blade Breakage Monitoring with Deep Autoencoders. IEEE Trans. Smart Grid 2016, 3053, 1–10. [Google Scholar] [CrossRef]
- Lind, P.G.; Vera-Tudela, L.; Wächter, M.; Kühn, M.; Peinke, J. Normal behaviour models for wind turbine vibrations: Comparison of neural networks and a stochastic approach. Energies 2017, 10, 1944. [Google Scholar] [CrossRef]
- Lind, P.G.; Herráez, I.; Wächter, M.; Peinke, J. Fatigue load estimation through a simple stochastic model. Energies 2014, 7, 8279–8293. [Google Scholar] [CrossRef]
- Kusiak, A.; Li, W. The prediction and diagnosis of wind turbine faults. Renew. Energy 2011, 36, 16–23. [Google Scholar] [CrossRef]
- Kusiak, A.; Verma, A. A data-driven approach for monitoring blade pitch faults in wind turbines. IEEE Trans. Sustain. Energy 2011, 2, 87–96. [Google Scholar] [CrossRef]
- Leahy, K.; Gallagher, C.; O’Donovan, P.; O’Sulllivan, D.; O’Sullivan, D.T. Cluster analysis of wind turbine alarms for characterising and classifying stoppages. IET Renew. Power Gener. 2018, 12, 1146–1154. [Google Scholar] [CrossRef]
- Godwin, J.L.; Matthews, P. Classification and Detection of Wind Turbine Pitch Faults Through SCADA Data Analysis. Int. J. Prog. Health Manag. 2013, 4, 11. [Google Scholar]
- Chen, B.; Matthews, P.C.; Tavner, P.J. Wind turbine pitch faults prognosis using a-priori knowledge-based ANFIS. Expert Syst. Appl. 2013, 40, 6863–6876. [Google Scholar] [CrossRef]
- Qiu, Y.; Feng, Y.; Tavner, P.; Richardson, P.; Erdos, G.; Chen, B. Wind turbine SCADA alarm analysis for improving reliability. Wind Energy 2012, 15, 951–966. [Google Scholar] [CrossRef]
- Chen, B.; Qiu, Y.; Feng, Y.; Tavner, P.; Song, W. Wind turbine SCADA alarm pattern recognition. In Proceedings of the IET Conference on Renewable Power Generation (RPG 2011), Edinburgh, UK, 6–8 September 2011; p. 163. [Google Scholar] [CrossRef]
- Kusiak, A. Renewables: Share data on wind energy. Nature 2016, 529, 19–21. [Google Scholar] [CrossRef] [Green Version]
- Gayo, J.B. ReliaWind Project Final Report; Technical Report; Gamesa Innovation and Technology: Madrid, Spain, 2011. [Google Scholar]
- Tavner, P. Offshore Wind Turbines: Reliability, availability and maintenance; Institution of Engineering and Technology: Stevenage, UK, 2012. [Google Scholar] [CrossRef]
- Wennerhag, L.B.; Tjernberg, P. Wind Turbine Operation and Maintenance: Survey of the Development and Research Needs; Technical Report; Elforsk: Stockholm, Sweden, 2012. [Google Scholar]
- Van Kuik, G.A.M.; Peinke, J.; Nijssen, R.; Lekou, D.; Mann, J.; Sørensen, J.N.; Ferreira, C.; van Wingerden, J.W.; Schlipf, D.; Gebraad, P.; et al. Long-term research challenges in wind energy—A research agenda by the European Academy of Wind Energy. Wind Energy Sci. 2016, 1, 1–39. [Google Scholar] [CrossRef]
- Hahn, B.; Welte, T.; Faulstich, S.; Bangalore, P.; Boussion, C.; Harrison, K.; Miguelanez-Martin, E.; O’Connor, F.; Pettersson, L.; Soraghan, C.; et al. Recommended Practice 17: Wind Farm Data Collection and Reliability Assessment for O&M Optimization. Energy Procedia 2017, 137, 358–365. [Google Scholar] [CrossRef]
- Sempreviva, A.M.; Vesth, A.; Bak, C.; Verelst, D.R.; Giebel, G.; Danielsen, H.K.; Mikkelsen, L.P.; Andersson, M.; Vasiljevic, N.; Barth, S.; et al. Integrated Research Programme on Wind Energy: Taxonomy and Meta Data for Wind Energy R & D; DTU Wind Energy: Roskilde, Denmark, 2017. [Google Scholar] [CrossRef]
- VGB PowerTech. RDS-PP—Application Guideline; Part 32: Wind Power Plants; Technical Report; VGB PowerTech: Berlin, Germany, 2014. [Google Scholar]
- NERC. GADS Wind Turbine Generation: Data Reporting Instructions; Technical Report; NERC: Atlanta, GA, USA, 2018. [Google Scholar]
- International Electrotechnical Commission (IEC). IEC 61400-26-1: Time Based Availability for Wind Turbines; International Electrotechnical Commission: Geneva, Switzerland, 2010. [Google Scholar]
Figure 1.
Number of publications that mention issues with data quality or manual processing.

Figure 2.
Example of normal (a) and abnormal performance (b) as indicated by the component-related SCADA alarm logs. Reproduced with permission from [31].
Figure 2.
Example of normal (a) and abnormal performance (b) as indicated by the component-related SCADA alarm logs. Reproduced with permission from [31].

Figure 3.
Samples with abnormal pitch angles or rotor speeds filtered out. Reproduced with permission from [31].
Figure 3.
Samples with abnormal pitch angles or rotor speeds filtered out. Reproduced with permission from [31].

Figure 4.
Samples with abnormal values (shown in red) filtered out using statistical methods. Adapted from [34].
Figure 4.
Samples with abnormal values (shown in red) filtered out using statistical methods. Adapted from [34].

Figure 5.
Normal behaviour modelling (NBM) overview, showing the on-line inputs, , the actual system and output, and , the modelled system and output, and , and the residual or error signal, .
Figure 5.
Normal behaviour modelling (NBM) overview, showing the on-line inputs, , the actual system and output, and , the modelled system and output, and , and the residual or error signal, .

Figure 6.
Example of sensor inconsistency in a bearing temperature with a maximum temperature of 78 °C before and 73 °C after the step. Adapted from [39].
Figure 6.
Example of sensor inconsistency in a bearing temperature with a maximum temperature of 78 °C before and 73 °C after the step. Adapted from [39].

Figure 7.
Number of publications that mention issues with data access, quality or manual processing.
Figure 7.
Number of publications that mention issues with data access, quality or manual processing.


Table 1.
Ten-minute operational data.
| Timestamp | Wind Speed (avg.) m/s | Wind Speed (max.) m/s | Wind Speed (min.) m/s | Power (avg.) kW | Ambient Temp (avg.) °C | Bearing Temp (avg.) °C |
|---|---|---|---|---|---|---|
| 09 June 2014 14:10:00 | 5.8 | 7.4 | 4.1 | 367 | 17.9 | 25.0 |
| 09 June 2014 14:20:00 | 5.7 | 7.1 | 4.1 | 378 | 17.5 | 24.6 |
| 09 June 2014 14:30:00 | 5.6 | 6.5 | 4.5 | 384 | 17.6 | 25.1 |
| 09 June 2014 14:40:00 | 5.8 | 7.5 | 3.9 | 426 | 18.1 | 23.7 |
Table 2.
Sample alarm system data from a given day.
| Code | Description | Category | Severity | ||
|---|---|---|---|---|---|
| 02:13:38 | 07:56:14 | Normal operation | No fault | Information | |
| 07:56:14 | 08:37:32 | Low wind cut out | Weather | Information | |
| 08:37:32 | 23:44:02 | Normal operation | No fault | Information |
Table 3.
O&M information sources and their usability, adapted from [23].
Table 3.
O&M information sources and their usability, adapted from [23].
| O&M Data Type | Information Derived | Disadvantages |
|---|---|---|
| A. Maintenance logs | • Accurate failure info • Information for downtimes • Cost of repair | • Sometimes available only in hard copies • Can be difficult to read or incomplete |
| B. Operation and alarm logs | • Failures and duration | • Unknown alarm codes • Numerous stops for the same failure • No environmental conditions info |
| C. 10-min SCADA and alarms | • Failure data • Information for further analysis (e.g., root cause analysis) • Environmental parameters • Comparison/verification of logs (if both available) | • Large amount of data, require time-consuming processing • Not all alarms indicate failures • No maintenance activity described |
| D. Service provider bills | • Maintenance cost • Indications for the kind of failures | • Less detailed info about failures |
| E. Component purchase bills | • Information for component replacements | • No downtime information • No failure information |
Table 4.
Summary of findings from all reviewed reliability studies. CREW, Continuous Reliability Enhancement for Wind; SPS, Strategic Power Systems; OEM, original equipment manufacturer.
Table 4.
Summary of findings from all reviewed reliability studies. CREW, Continuous Reliability Enhancement for Wind; SPS, Strategic Power Systems; OEM, original equipment manufacturer.
| Study Name | Published | Reporting Period | Number of Turbines | Turbine Capacity (MW) | Data Collection | Failure Defined As | Taxonomy | Quality Issues? | Manual Effort Issues? |
|---|---|---|---|---|---|---|---|---|---|
| WMEP [15,16] | 2007, 2011 | 1989–2006 | 1500 | <1 | Manual report | - | 11 assemblies/parts | No | Yes |
| WindStats-WSD [17,18] | 2006, 2009 | 1994–2003 | 2345–851 | 0.1–2.5 | Manual report-quarterly | Manual on site restart | 12 assemblies/parts | No | Yes |
| WindStats-WSDK [17,18] | 2006, 2009 | 1995–2004 | 1295–4285 | 0.1–2.5 | Manual report-monthly | Manual on site restart | same as above | Yes | Yes |
| LWK [18] | 2009 | 1993–2006 | 158–643 | 0.2–2 | Manual report-annually | Manual on site restart | same as above | No | Yes |
| Ribrant et al. [19] | 2007 | 2000–2004 | 527–723 | 0.5–1.5 | Manual report | On-site restart and repair | 13 assemblies/parts | No | Yes |
| ReliaWind [20] | 2011 | 2008–2011 | max. 350 | >0.8 | SCADA, work orders, contractor reports | 1 hour downtime and manual restart | ReliaWind | Yes | Yes |
| CREW [21] | 2012 | - | 800–900 | 1.3–1.4 | SCADA | Any fault event | SPS proprietary | Yes | No |
| Kaidis et al. [23] | 2015 | (avg 705 days) | max. 63 | 0.85–3 | SCADA | Manual on site restart | ReliaWind | Yes | Yes |
| AWESOME [24] | 2016 | 2013–2015 | - | 1–3 | OEM work order database | On-site restart and repair | ReliaWind-Extended | Yes | Yes |
| Carroll-onshore [26] | 2015 | <5 years | max. 2222 | 1.5–2.5 | OEM work order and materials databases | On-site repair where material is consumed | Drivetrain only (gen/converter) | No | Yes |
| Carroll-offshore [27] | 2016 | 5 years | max. 350 | 2–4 | OEM work order and materials databases | On-site repair where material is consumed | 19 assemblies/parts | No | Yes |
Table 5.
Summary of the condition monitoring studies’ review.
| Publication | Published | Technique | Filtering | Access Issues? | Quality Issues? | Manual Effort Issues? |
|---|---|---|---|---|---|---|
| [31] | 2019 | NBM-PM | Alarms and work orders | No | No | Yes |
| [28] | 2013 | NBM-PM | Statistical and domain knowledge | No | Yes | Yes |
| [29] | 2014 | NBM-PM | Statistical | No | Yes | Yes |
| [30] | 2012 | NBM-PM | Statistical | No | No | Yes |
| [32] | 2016 | NBM-PM | Statistical | No | Yes | Yes |
| [33] | 2009 | NBM-PM | Statistical and domain knowledge | No | Yes | Yes |
| [35] | 2009 | NBM-T | Work orders | No | No | Yes |
| [36] | 2012 | NBM-T | Work orders | No | No | Yes |
| [40] | 2016 | NBM-O | Work orders | No | No | Yes |
| [41] | 2017 | NBM-O | Statistical | No | No | No |
| [37] | 2017 | NBM-T | Statistical and domain knowledge | No | No | Yes |
| [39] | 2017 | NBM-T | Alarms and work orders | Yes | Yes | Yes |
| [43] | 2011 | Class. | Alarms | No | Yes | Yes |
| [44] | 2011 | Class. | Alarms (processed) | No | No | Yes |
| [13] | 2018 | Class. | Alarms | No | Yes | Yes |
| [22] | 2018 | Class. | Alarms (processed) | Yes | No | Yes |
| [46] | 2013 | Class. | Work orders | No | No | Yes |
| [47] | 2013 | Class. | Work orders | No | No | Yes |
| [48] | 2012 | alarms | Alarms (processed) | No | Yes | Yes |
| [25] | 2016 | alarms | Alarms (processed) | No | Yes | Yes |
| [45] | 2018 | alarms | Alarms (processed) | Yes | Yes | Yes |
| [49] | 2011 | alarms | Alarms (processed) | No | Yes | Yes |
© 2019 by the authors. Licensee MDPI, Basel, Switzerland. This article is an open access article distributed under the terms and conditions of the Creative Commons Attribution (CC BY) license (http://creativecommons.org/licenses/by/4.0/).
Share and Cite
MDPI and ACS Style
Leahy, K.; Gallagher, C.; O’Donovan, P.; O’Sullivan, D.T.J. Issues with Data Quality for Wind Turbine Condition Monitoring and Reliability Analyses. Energies 2019, 12, 201. https://doi.org/10.3390/en12020201
AMA Style
Leahy K, Gallagher C, O’Donovan P, O’Sullivan DTJ. Issues with Data Quality for Wind Turbine Condition Monitoring and Reliability Analyses. Energies. 2019; 12(2):201. https://doi.org/10.3390/en12020201
Chicago/Turabian StyleLeahy, Kevin, Colm Gallagher, Peter O’Donovan, and Dominic T. J. O’Sullivan. 2019. "Issues with Data Quality for Wind Turbine Condition Monitoring and Reliability Analyses" Energies 12, no. 2: 201. https://doi.org/10.3390/en12020201
Note that from the first issue of 2016, this journal uses article numbers instead of page numbers. See further details here.