High Throughput Screening and Characterization Methods of Jordanian Oil Shale as a Case Study

 ,
,  ,
,
Abstract
:
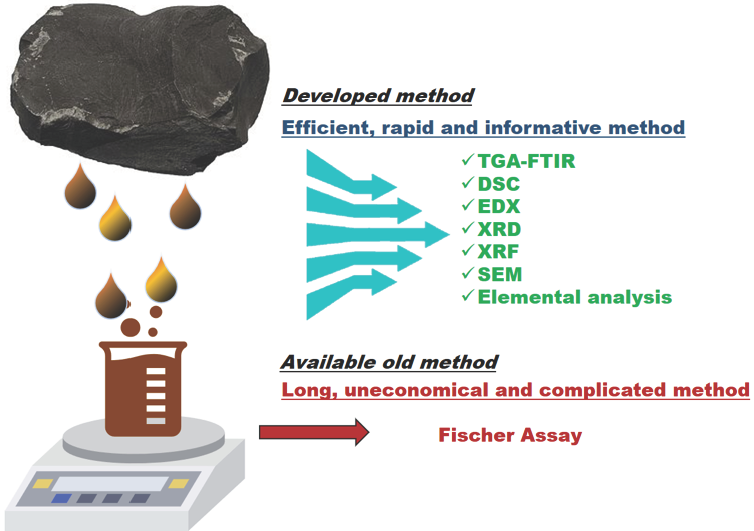
1. Introduction
2. Materials and Methods
3. Results and Discussion
3.1. Fischer Assay
3.2. Thermogravimetric Analysis
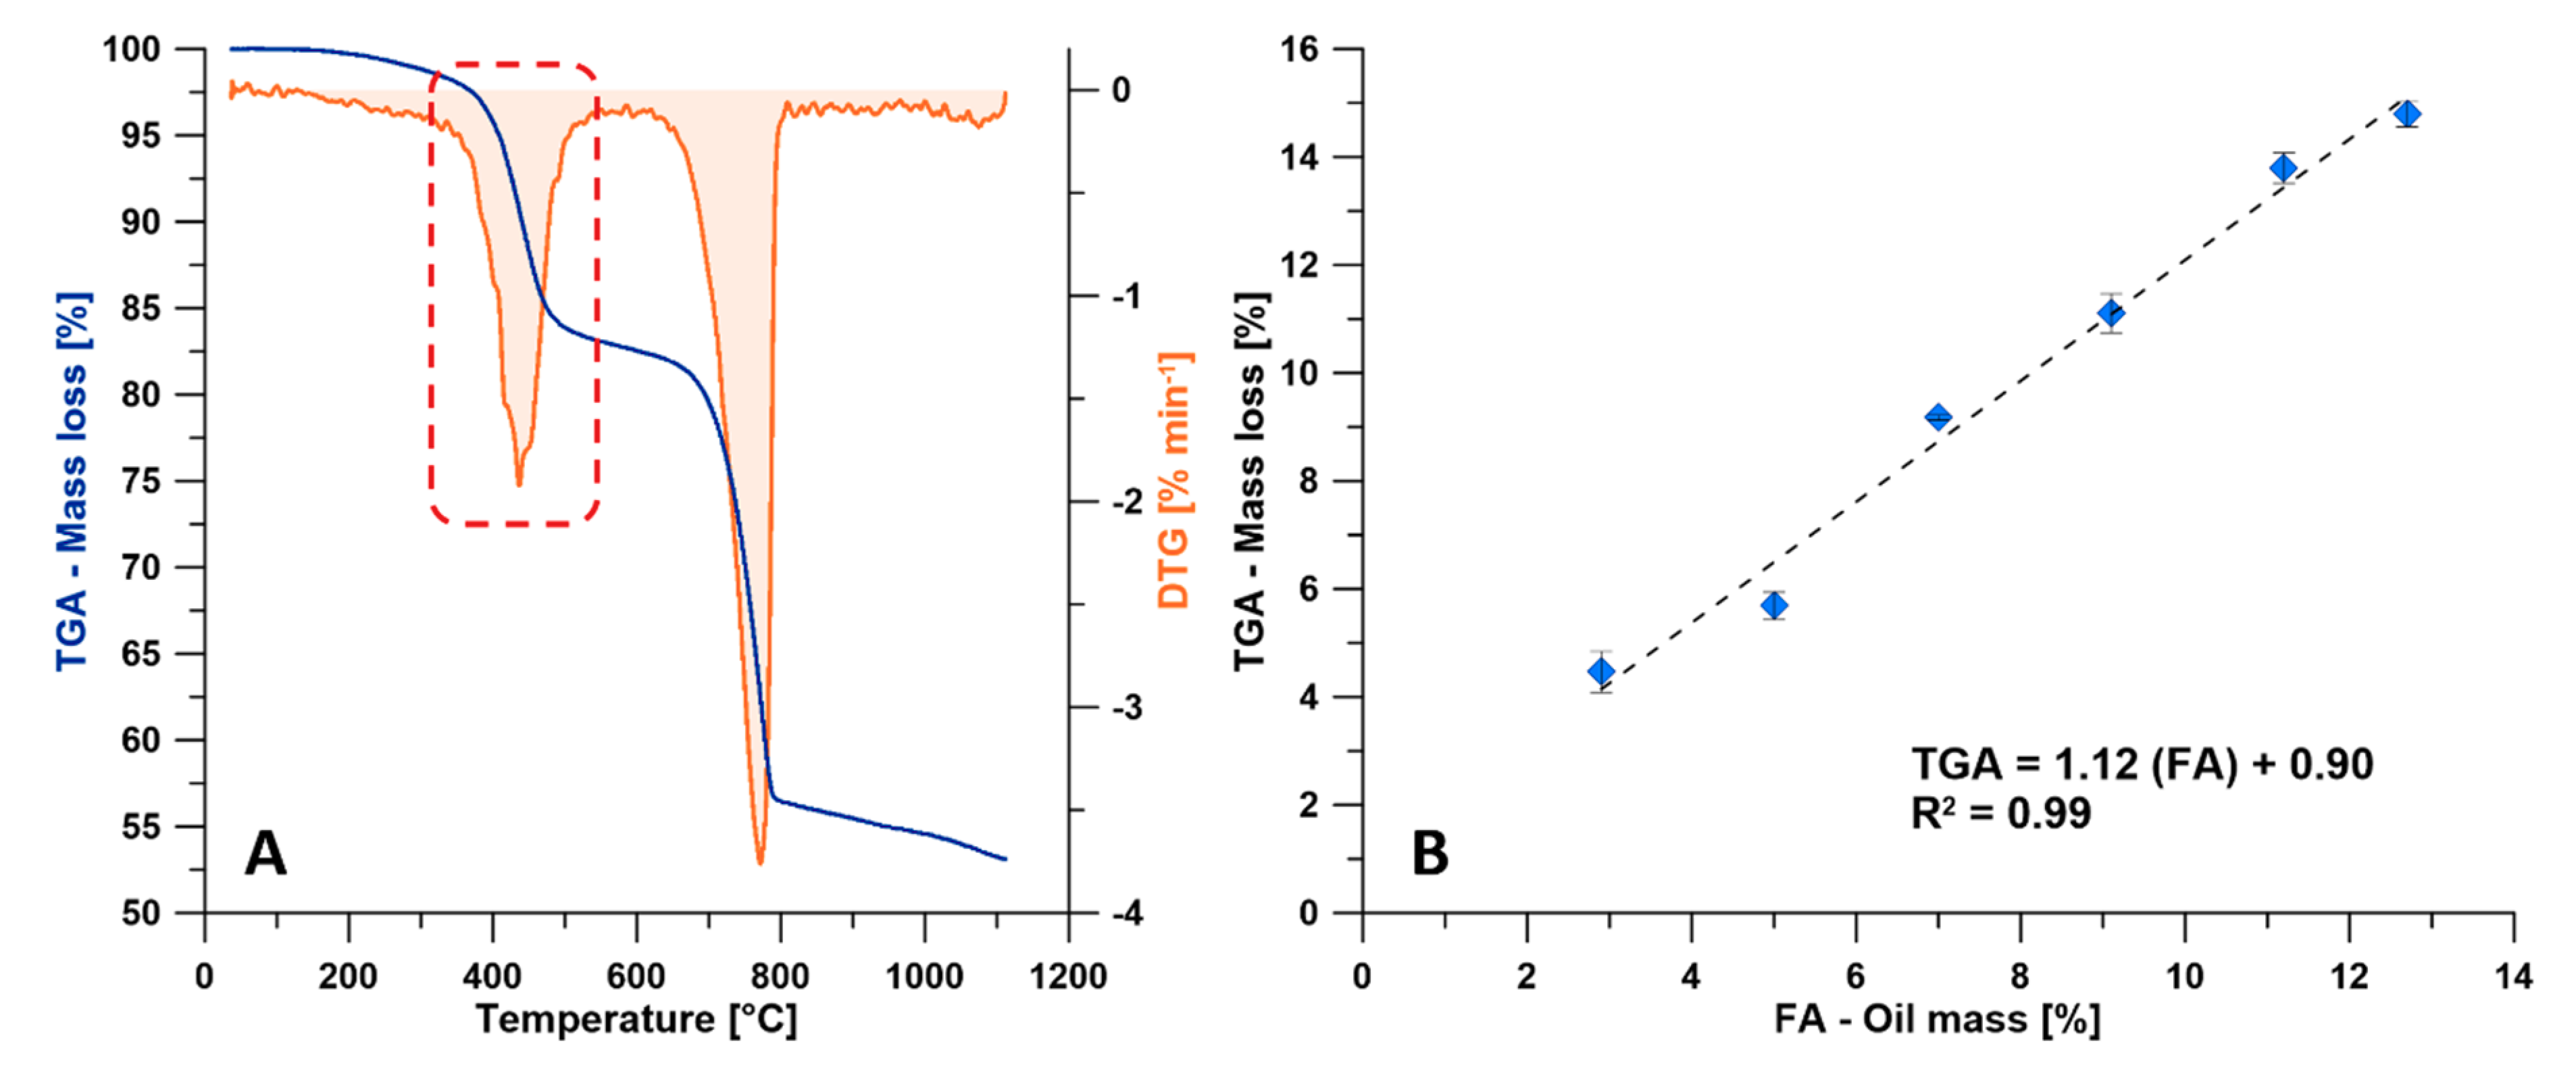
3.2.1. TGA and DTG
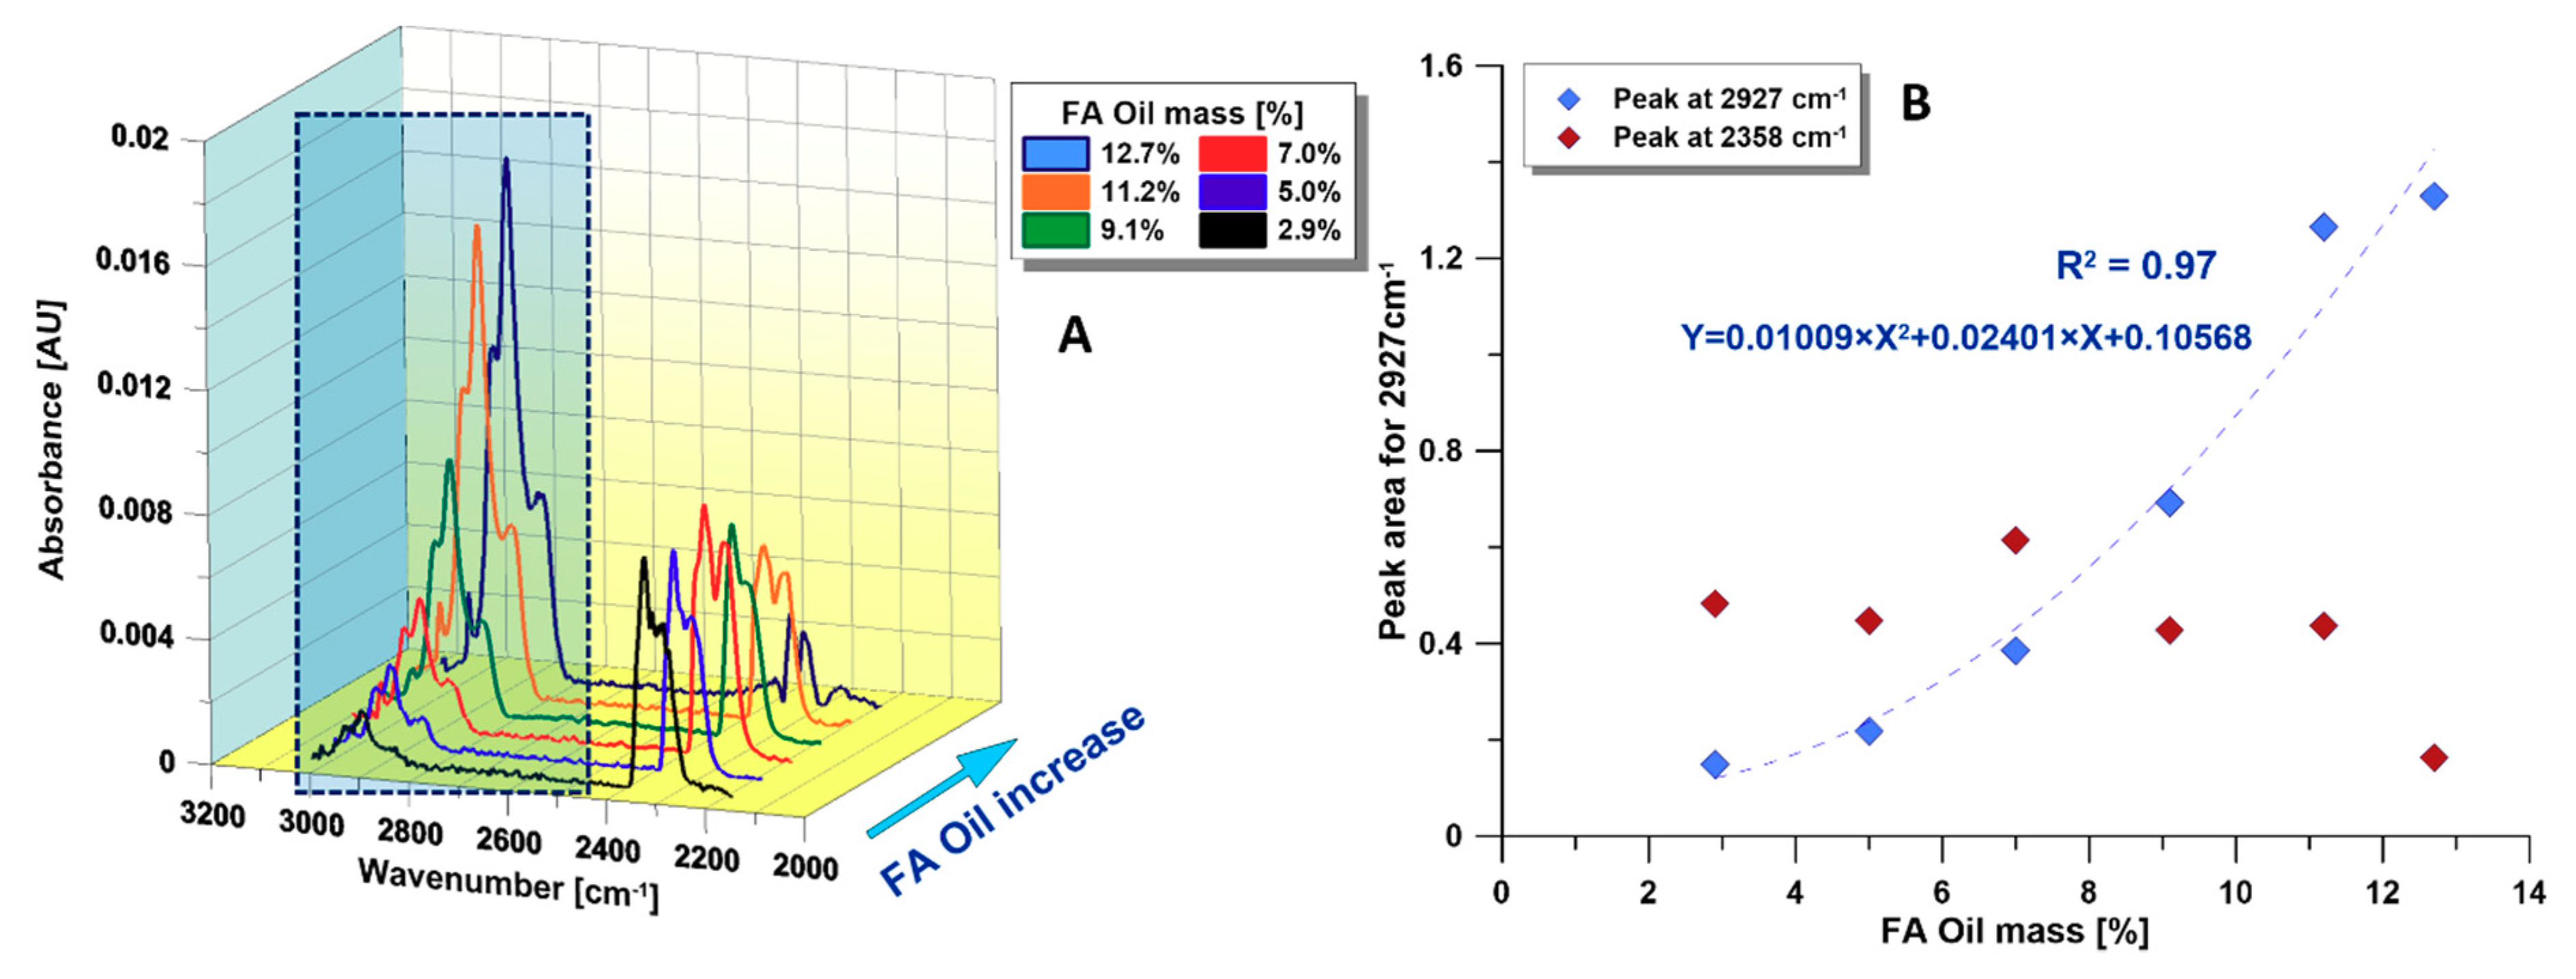
3.2.2. TGA-FTIR
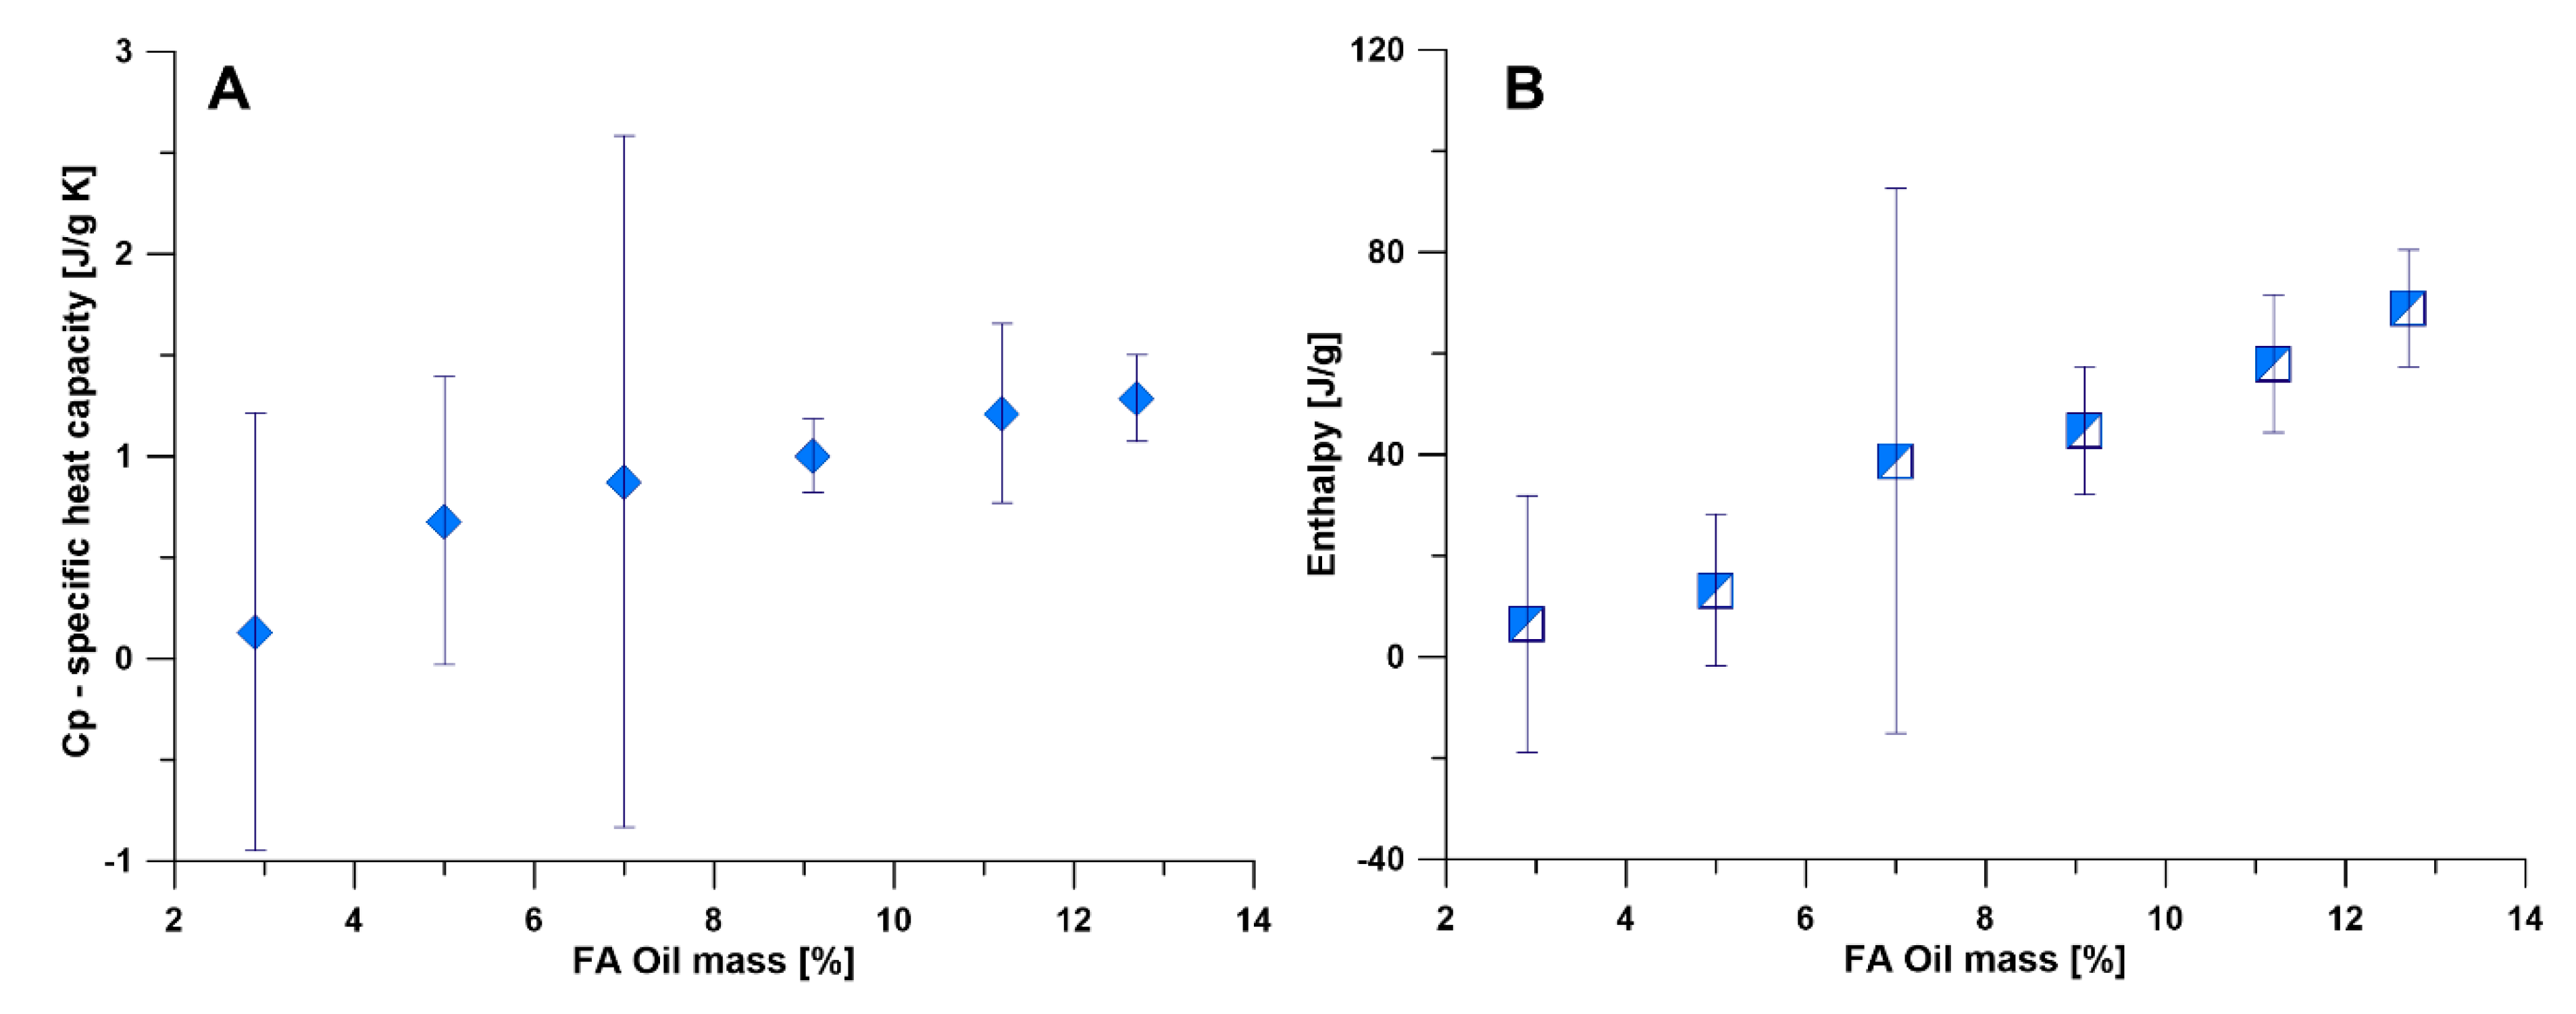
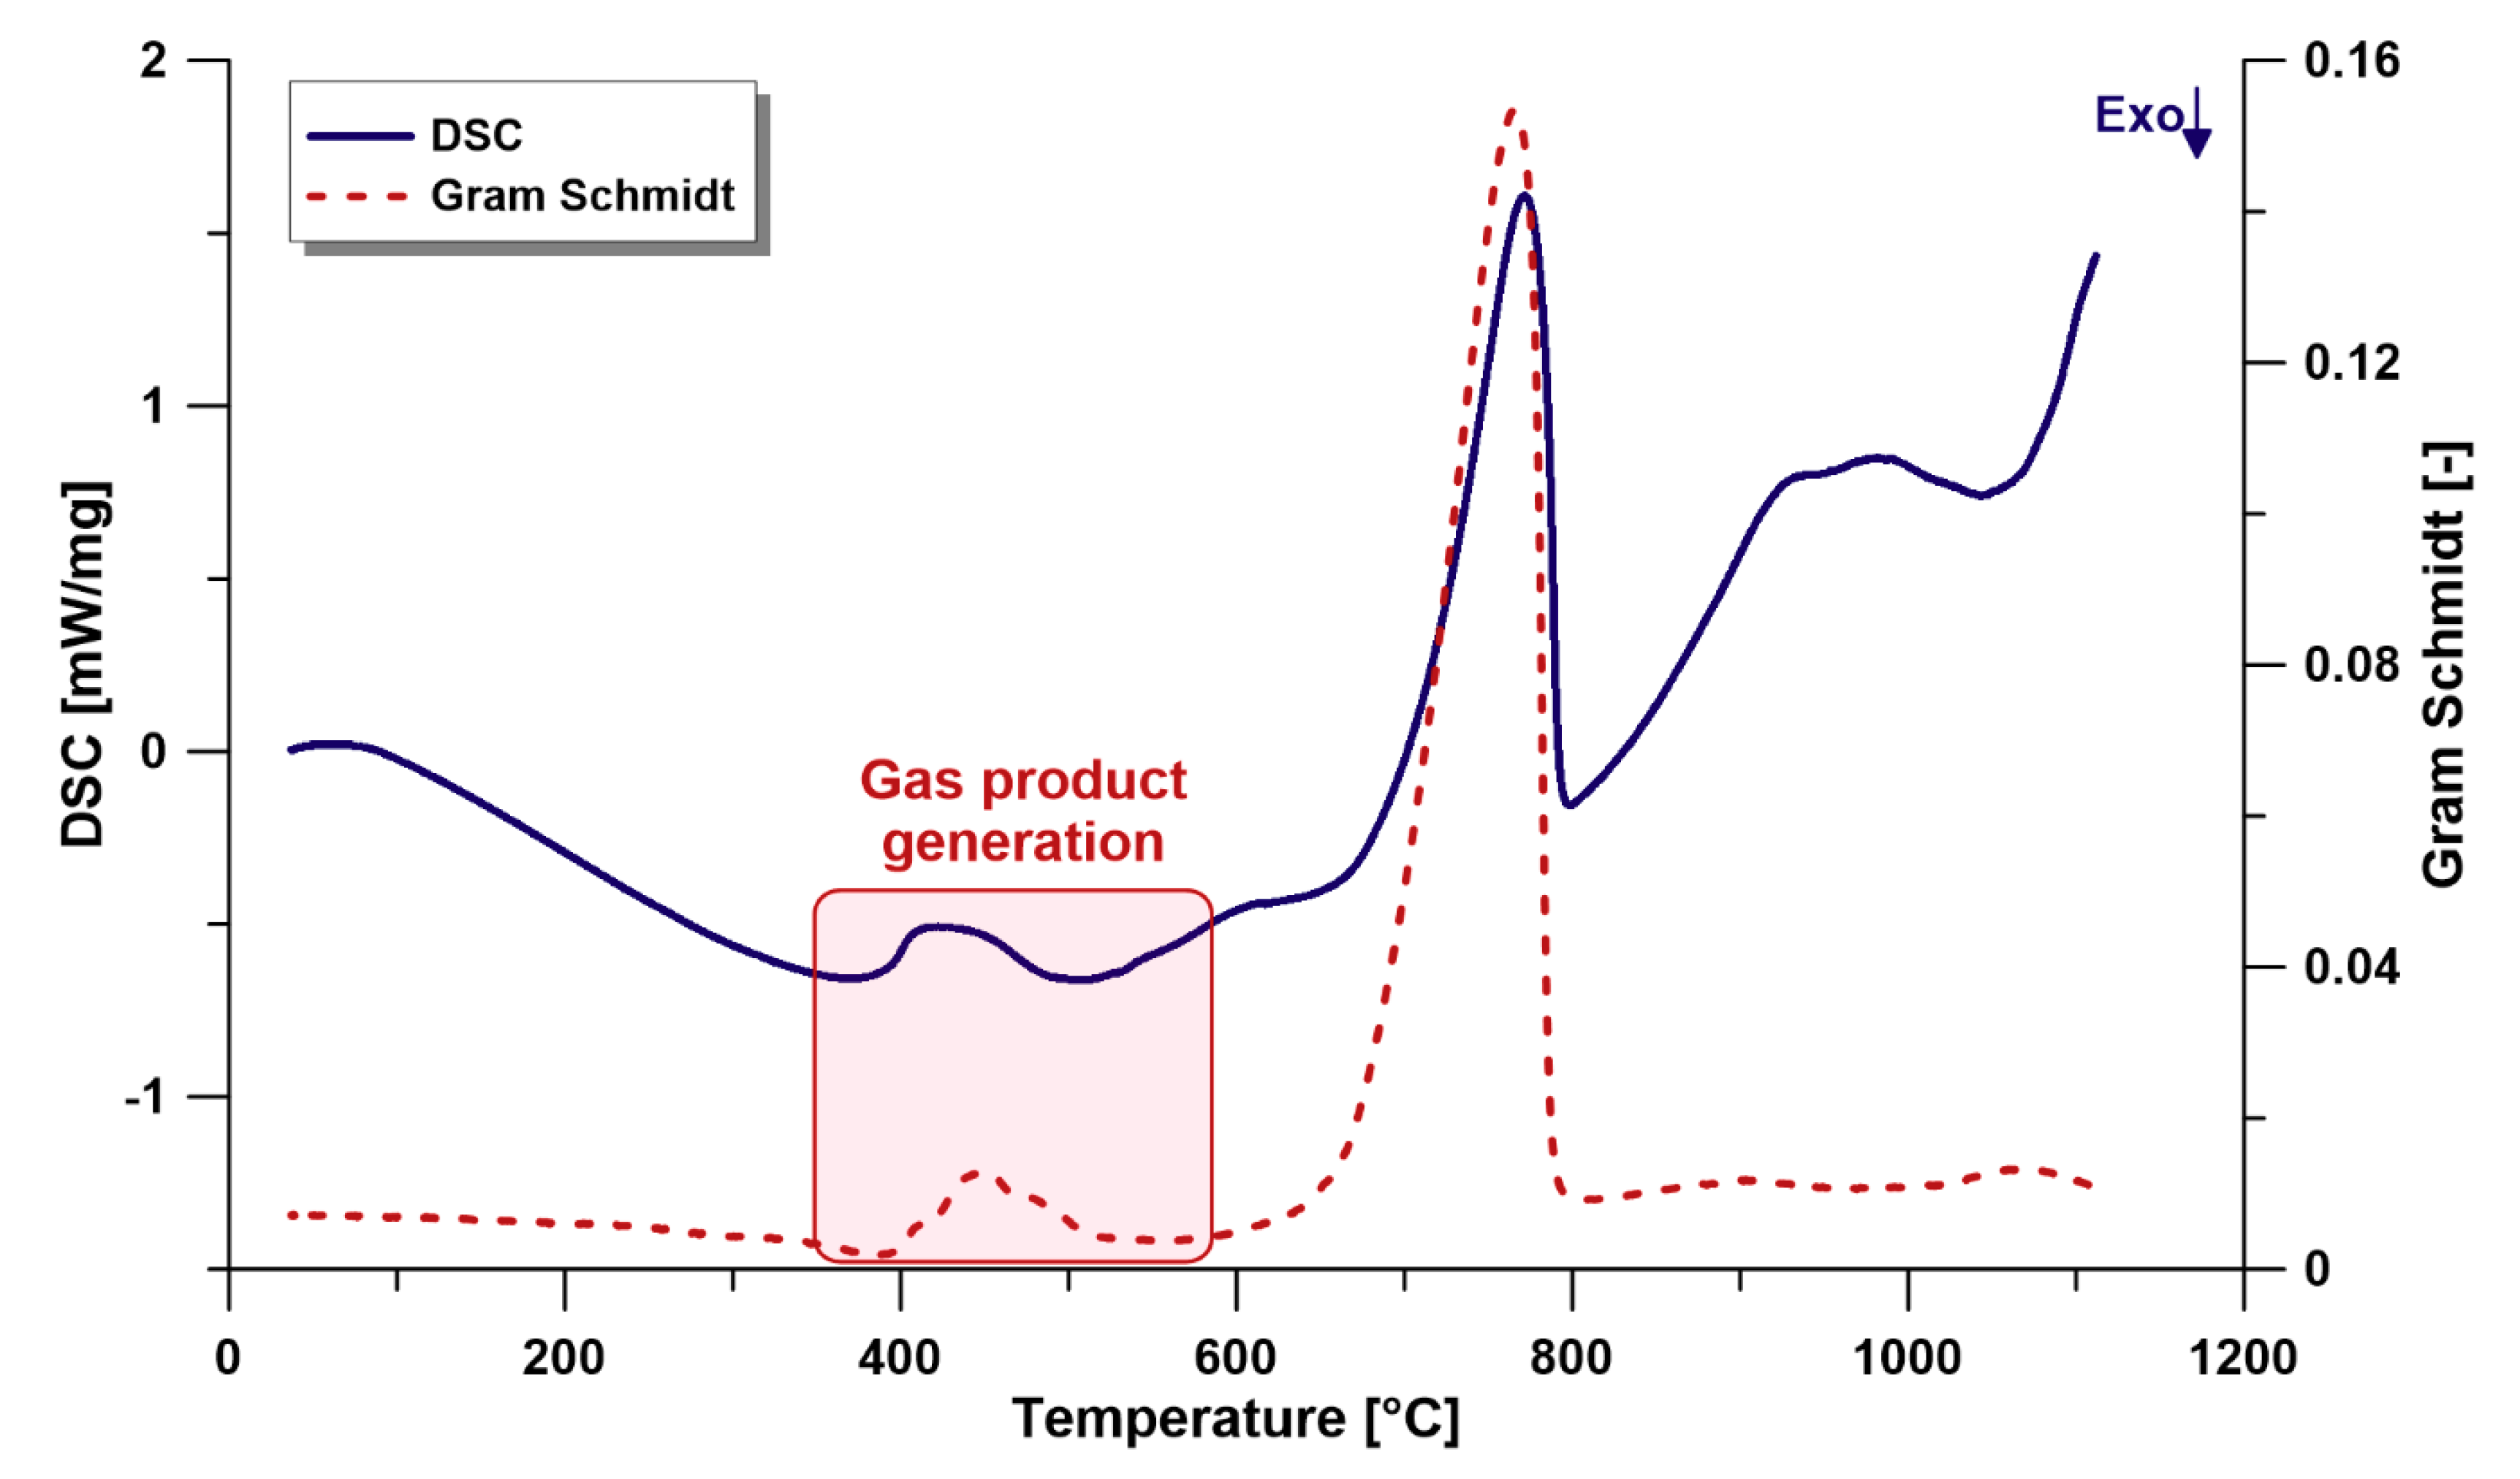
3.2.3. DSC
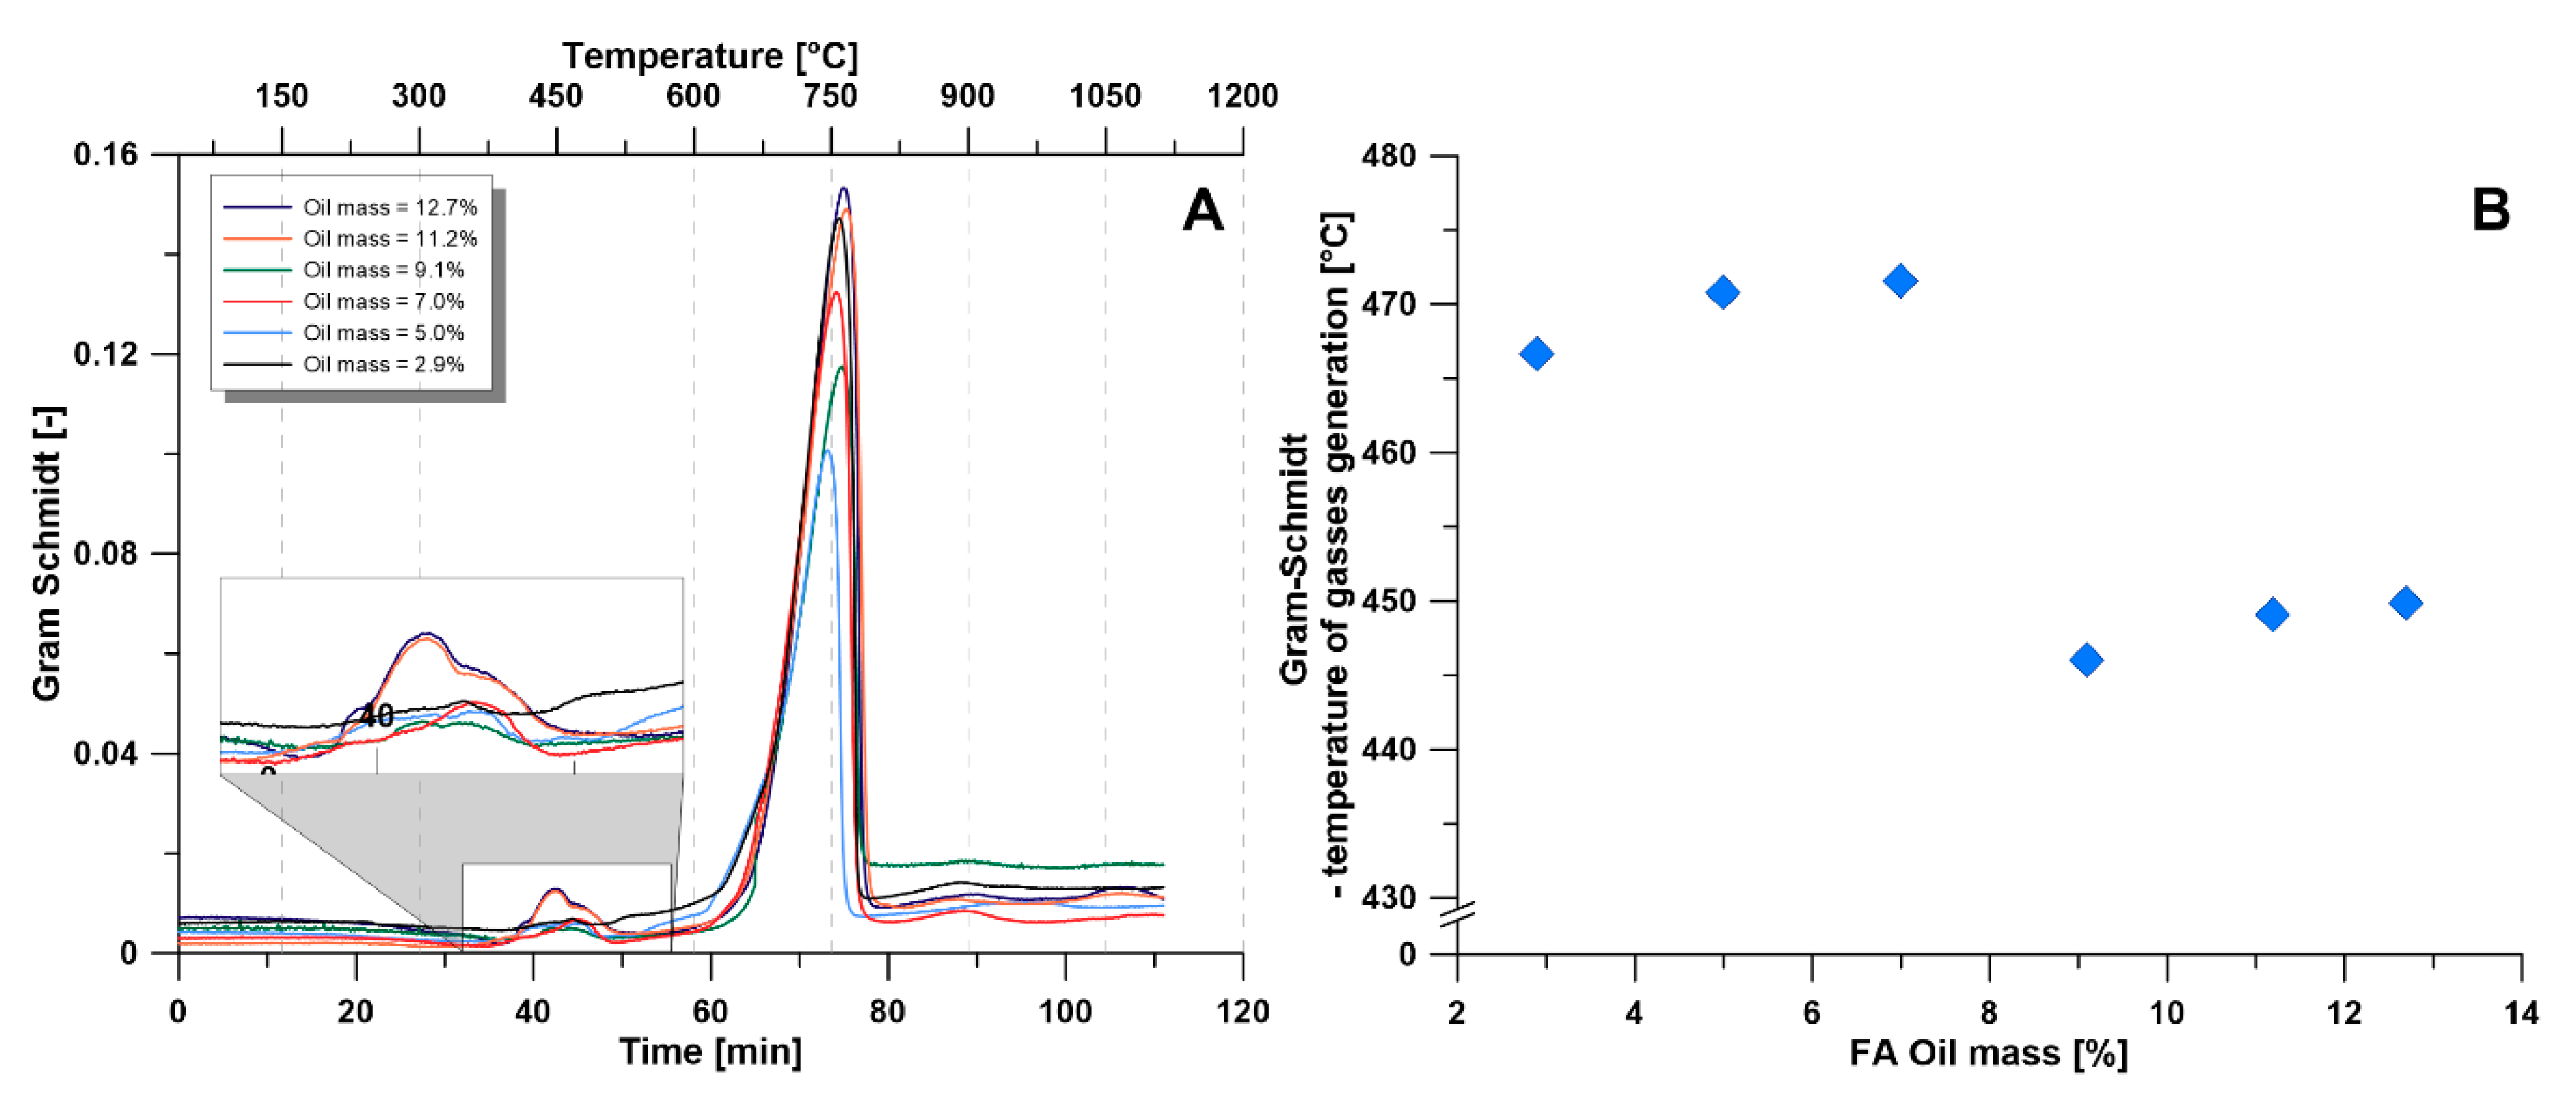
3.2.4. Gram-Schmidt
3.3. Elemental and Mineral Analysis
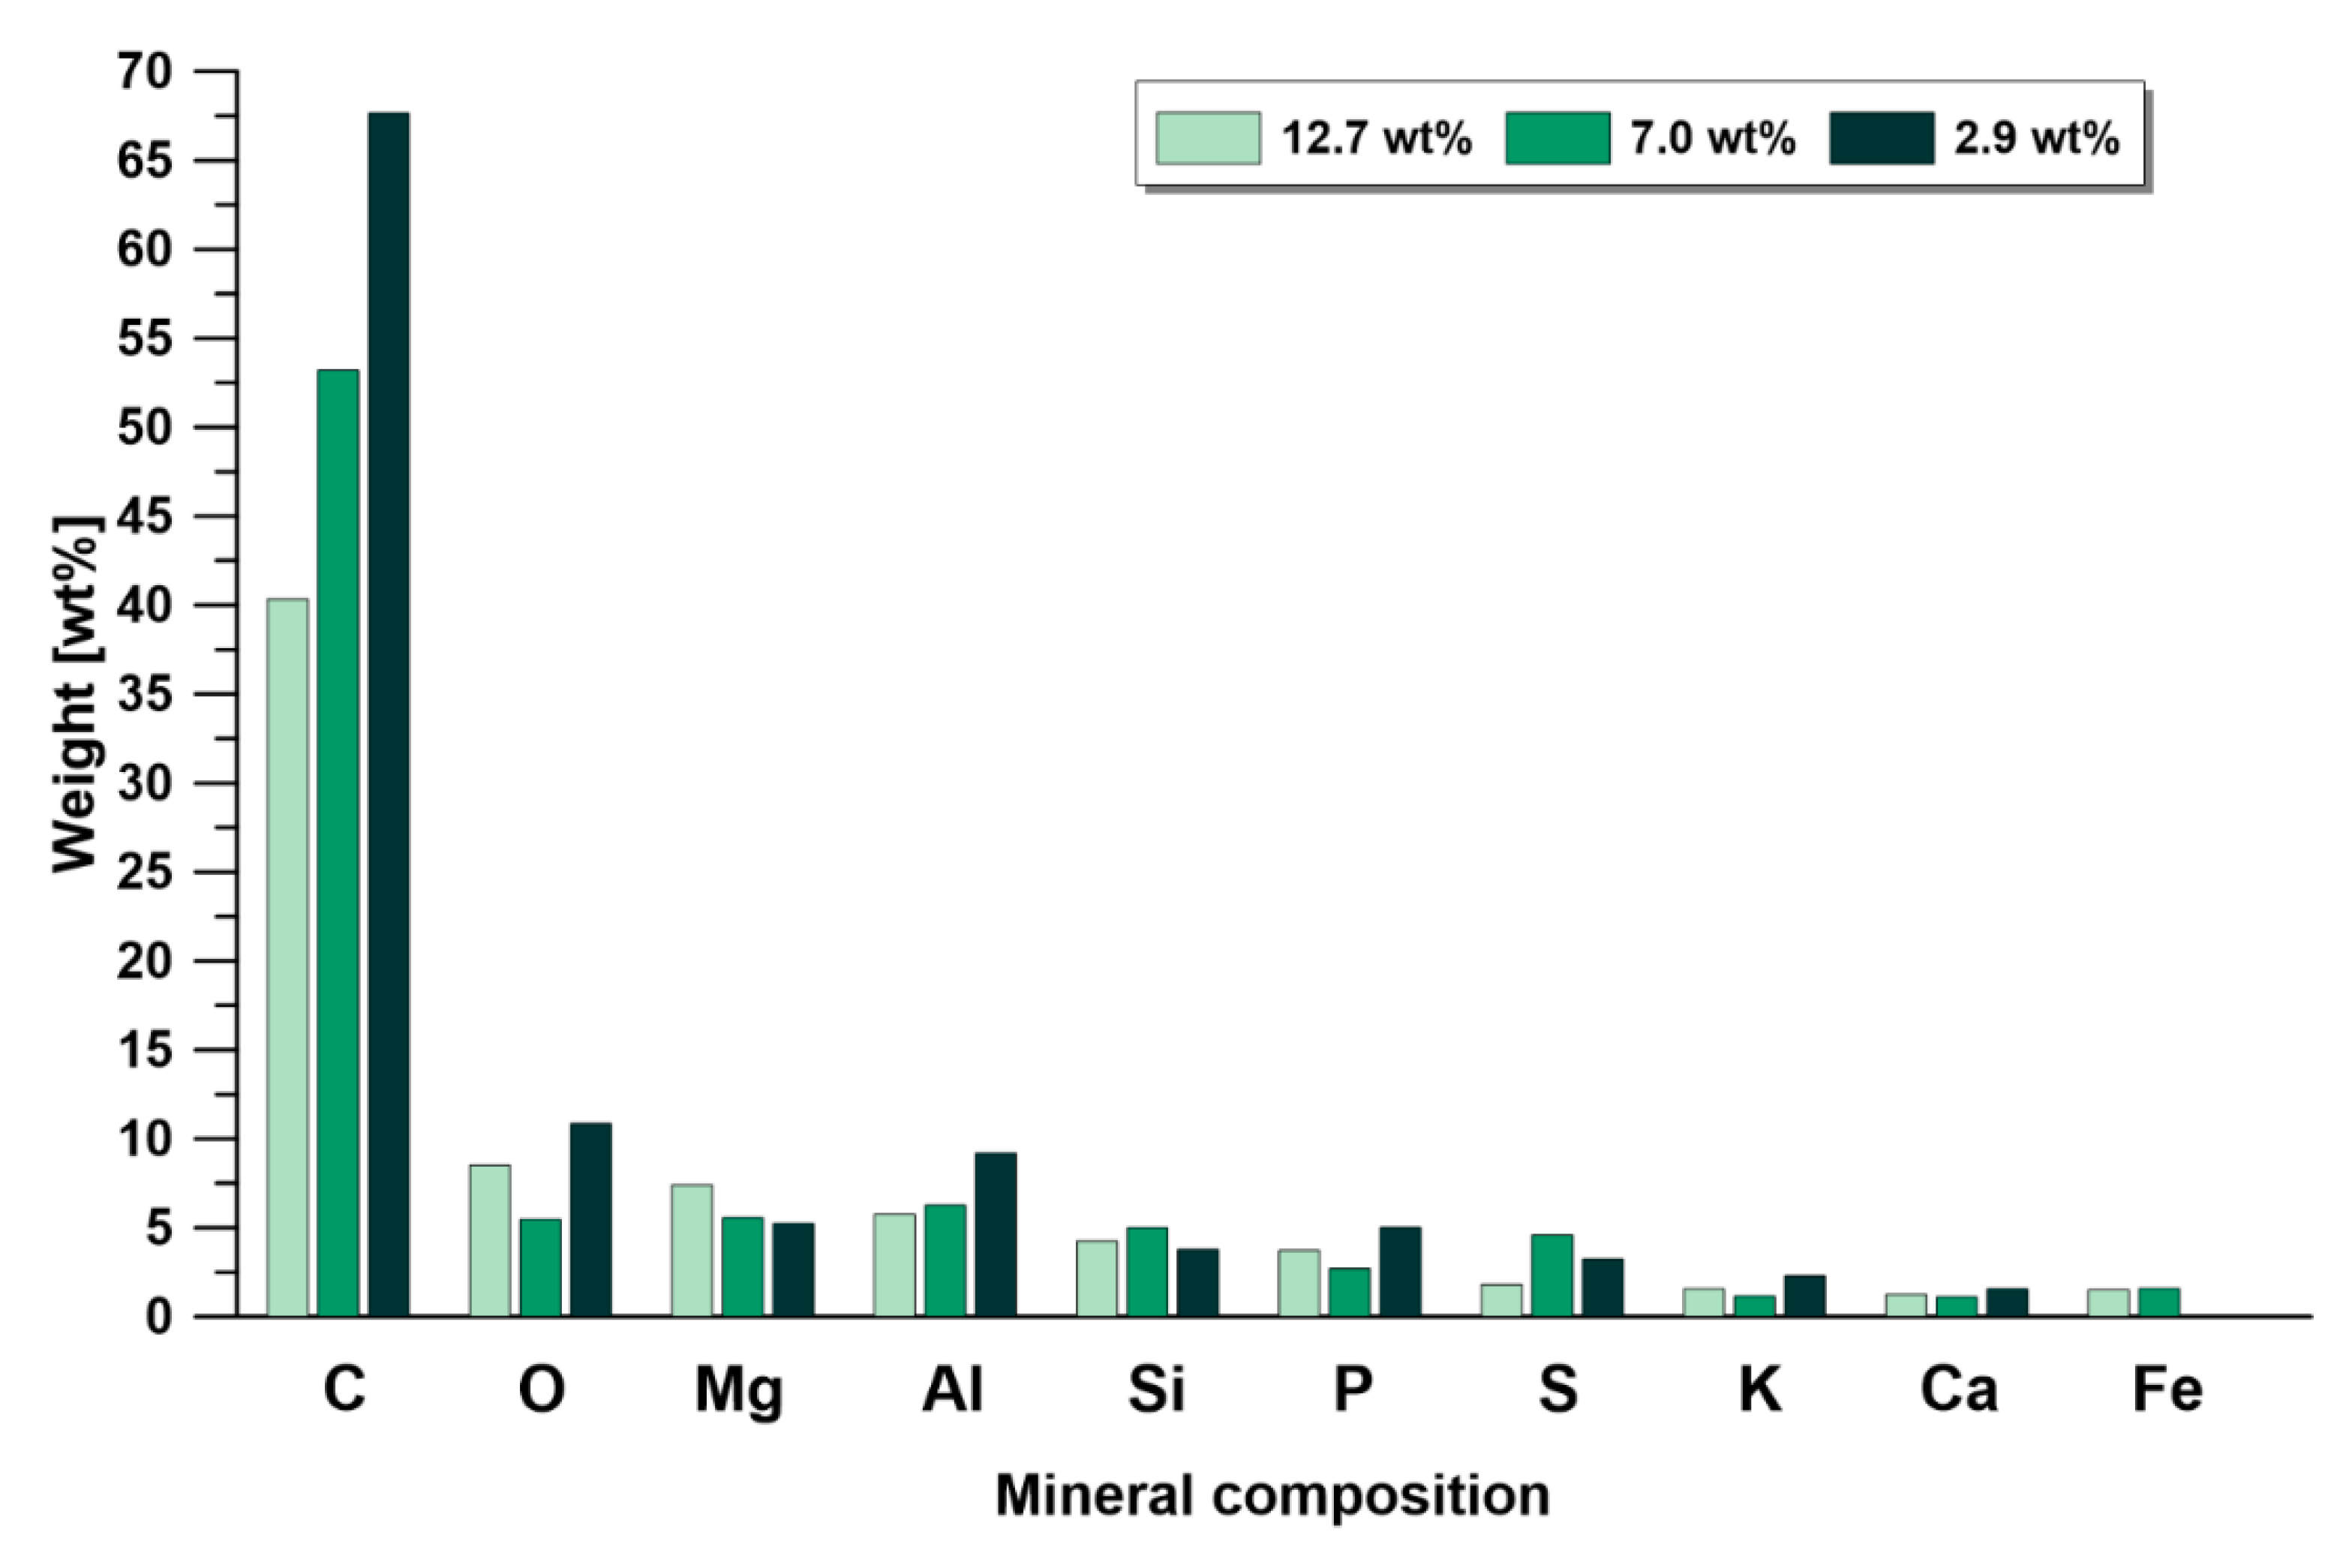
3.3.1. Elemental analysis
3.3.2. XRF
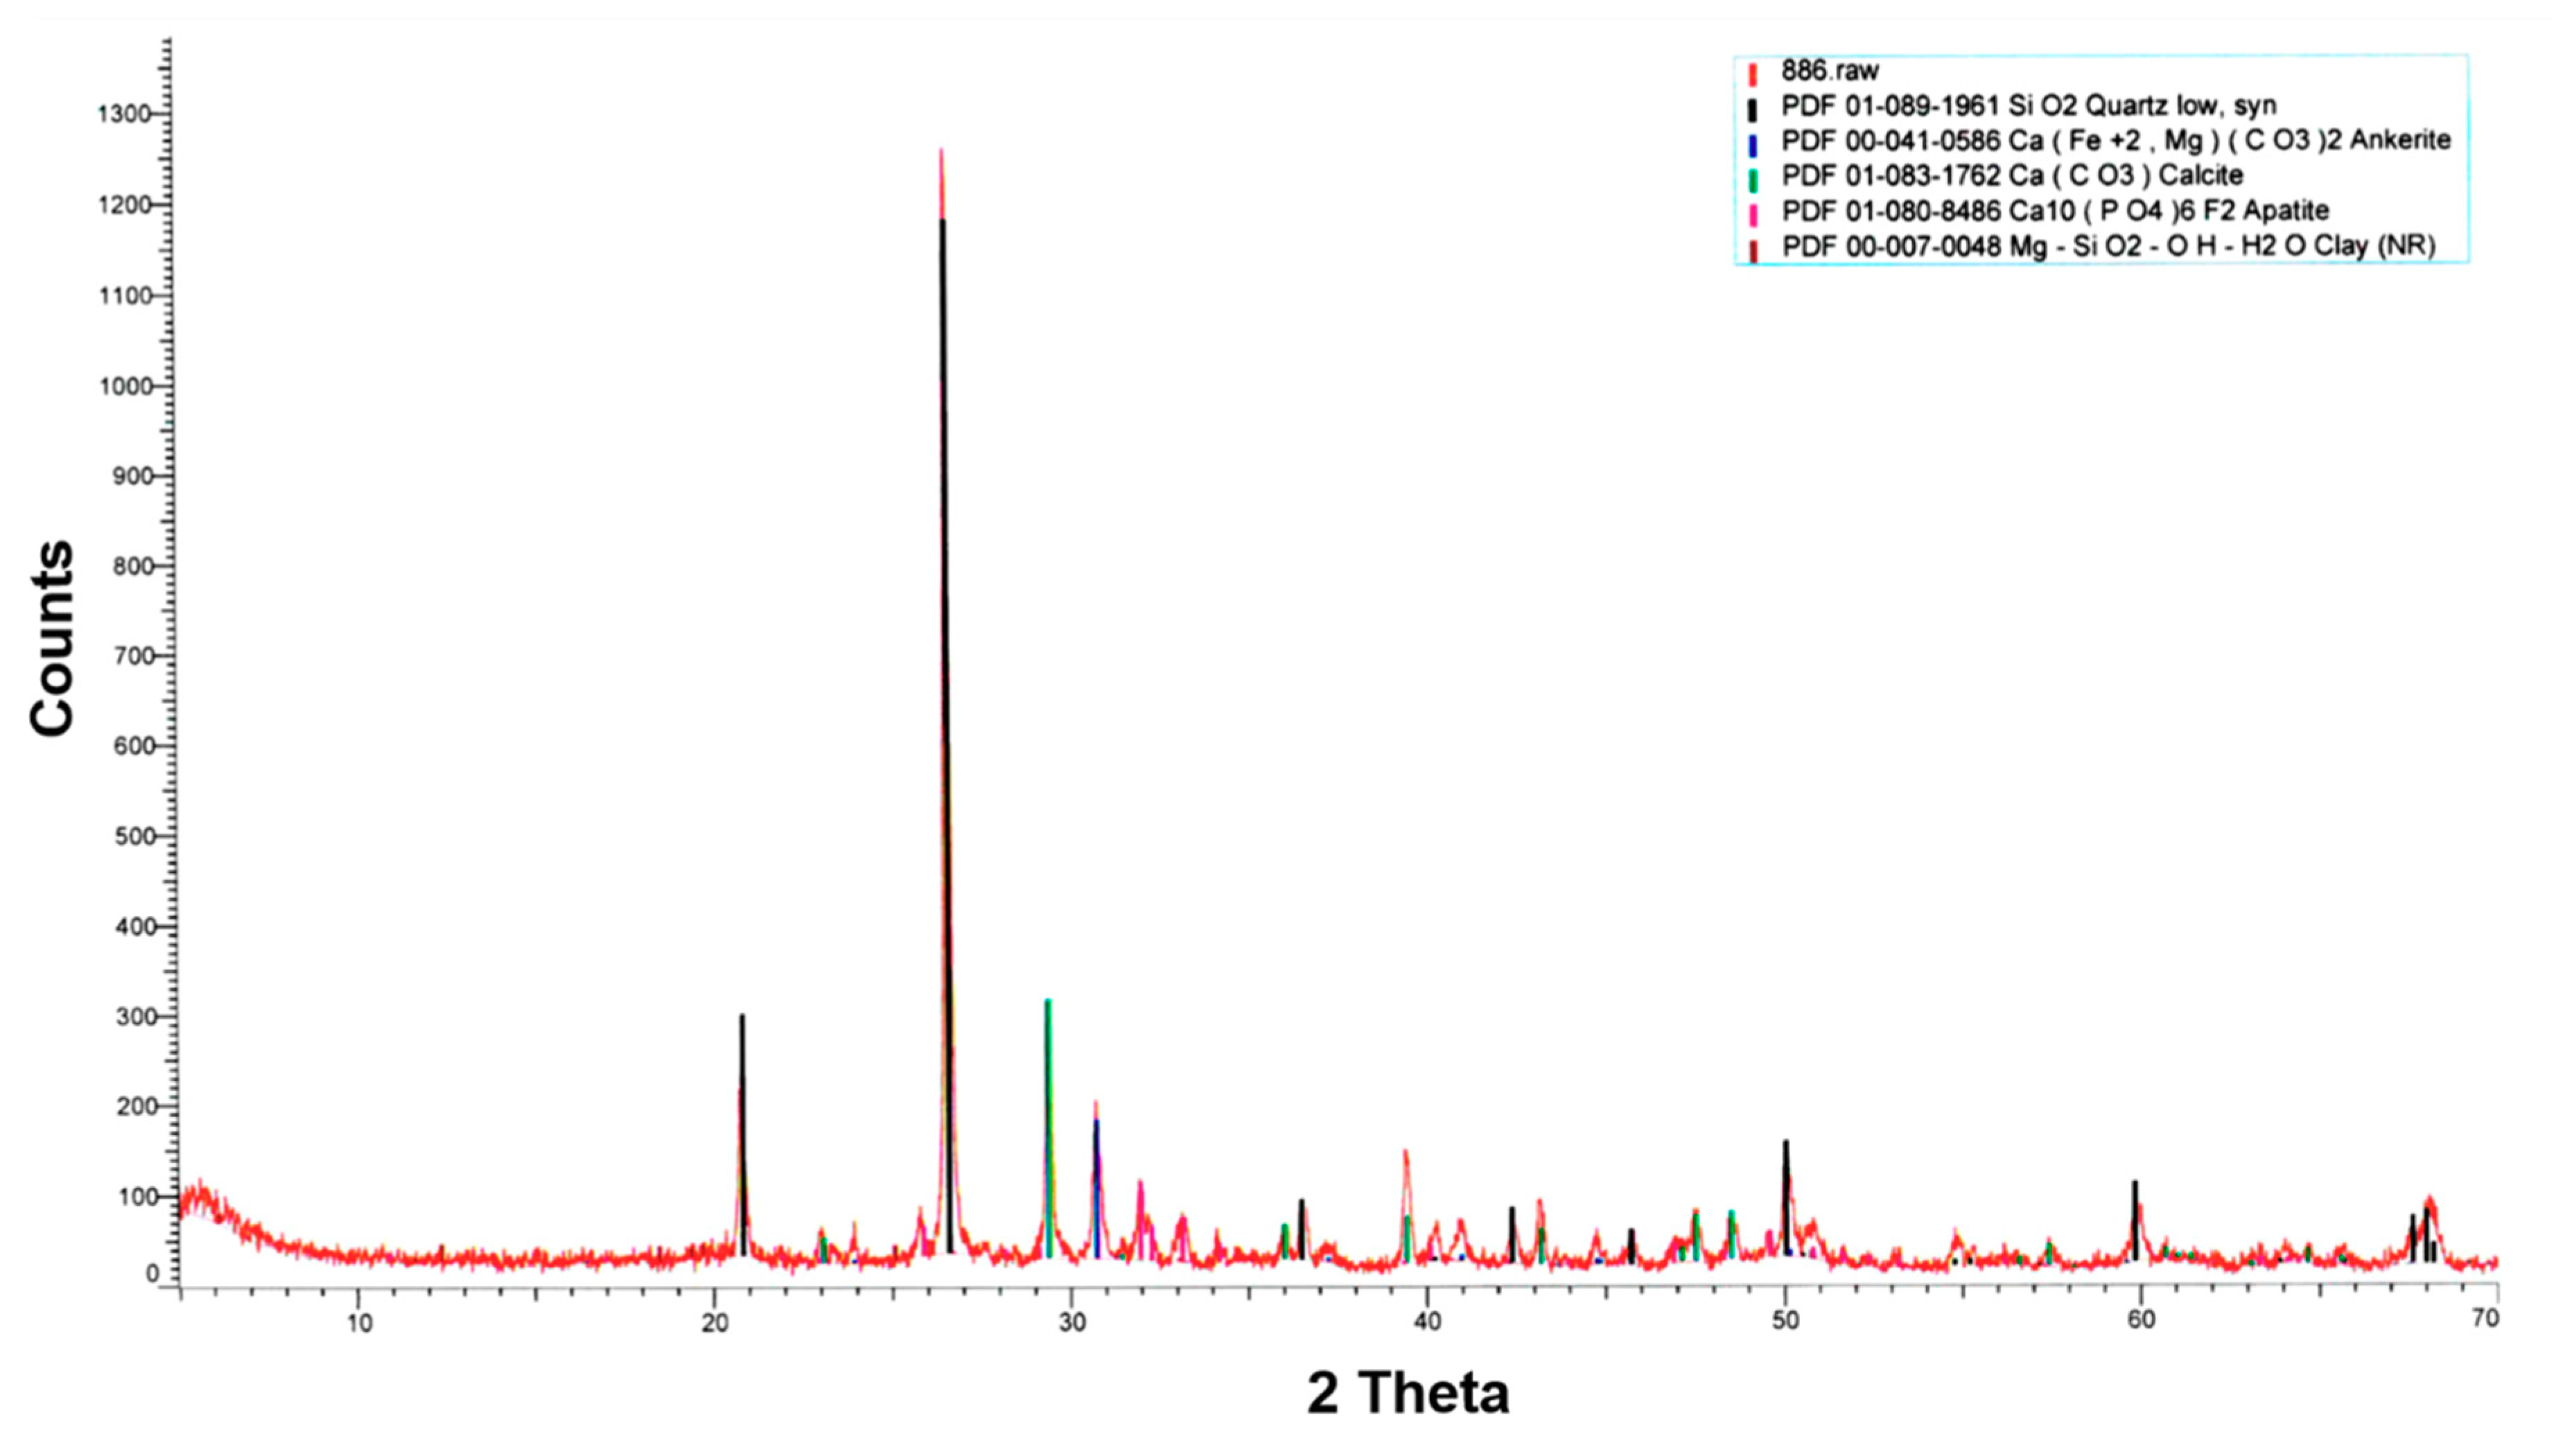
3.3.3. XRD
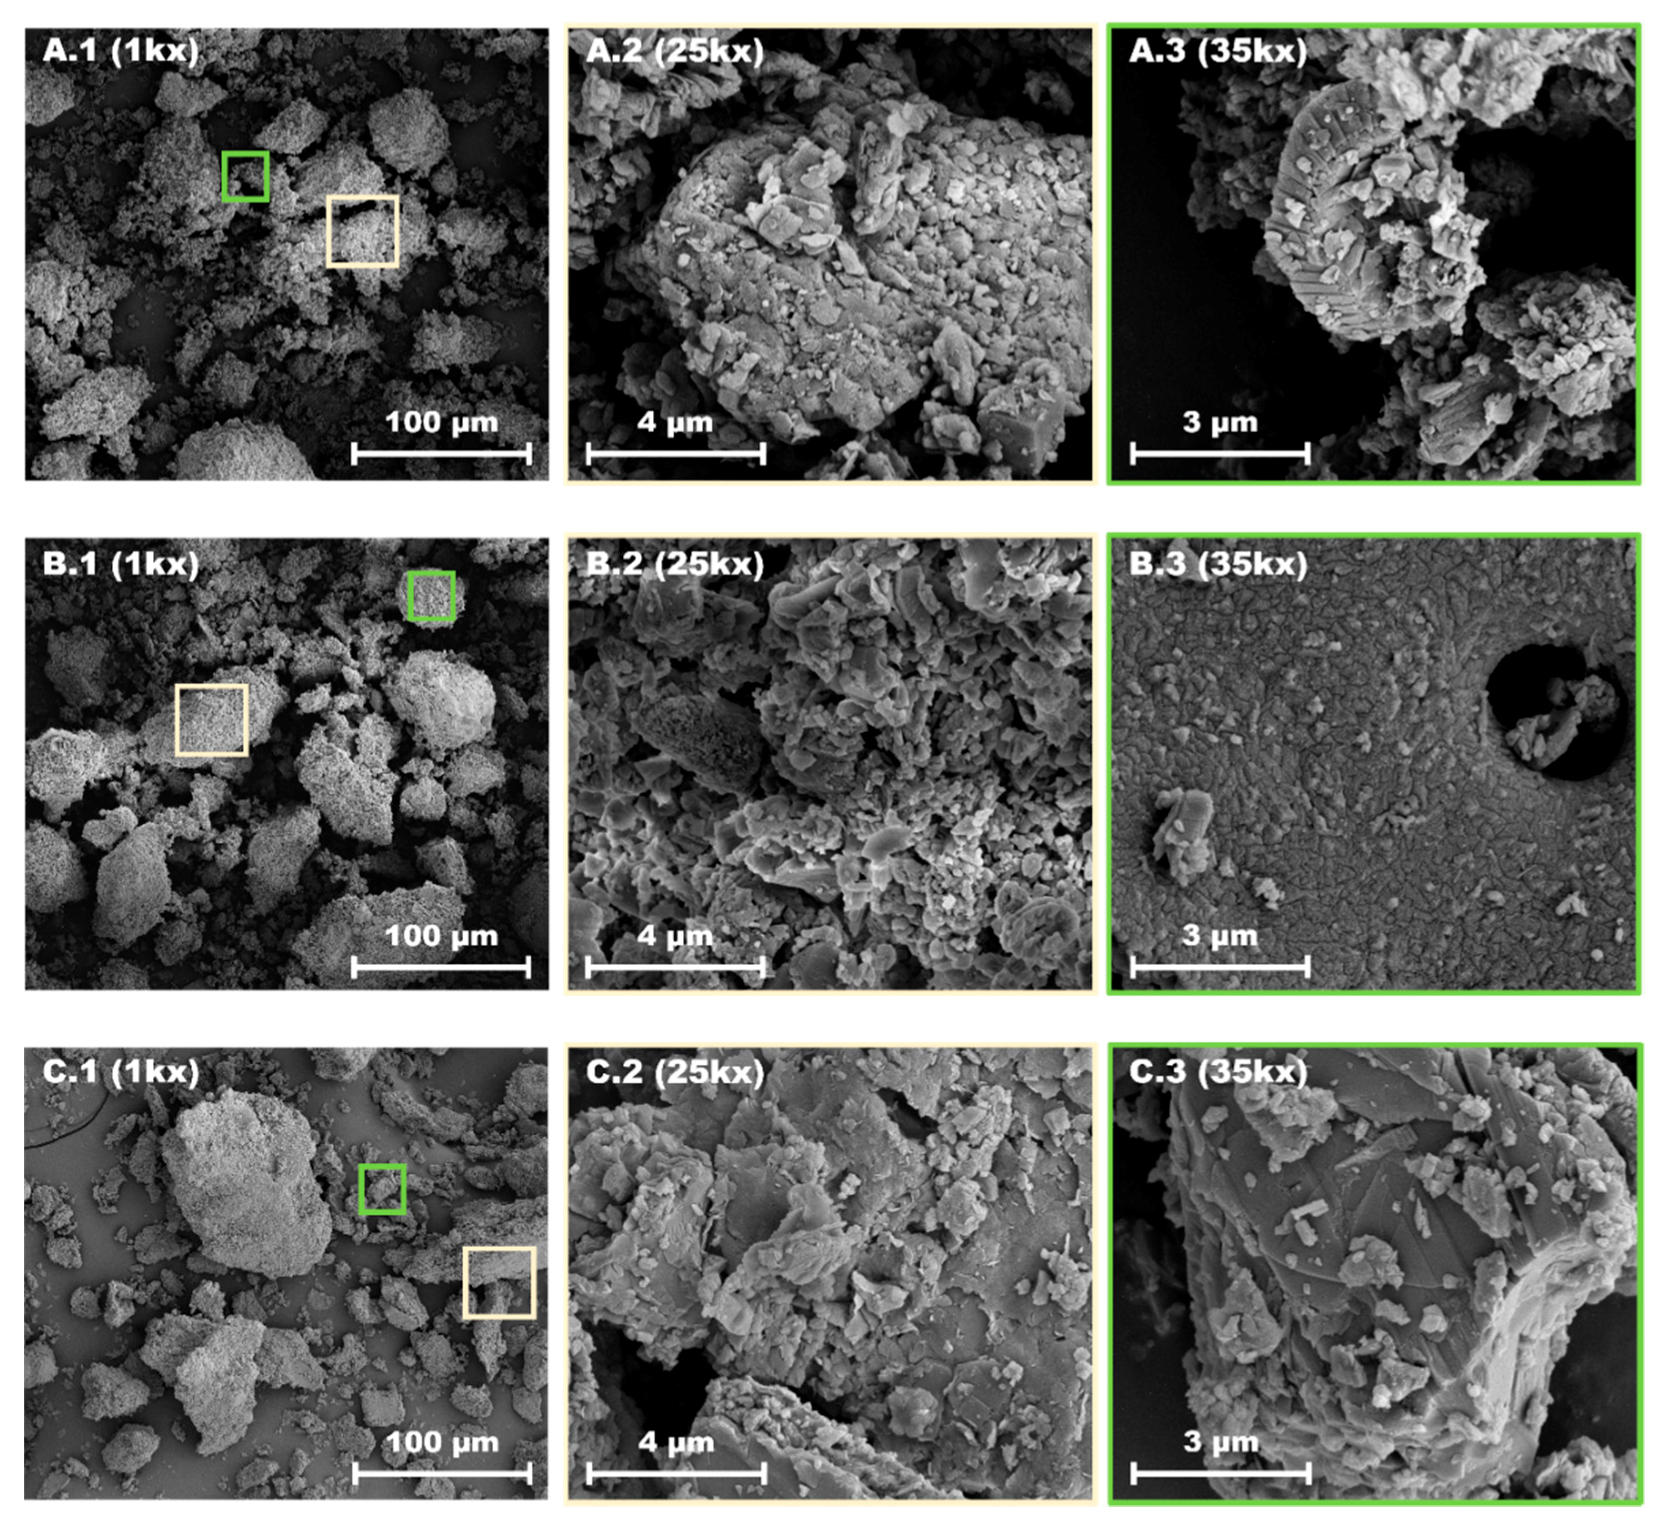
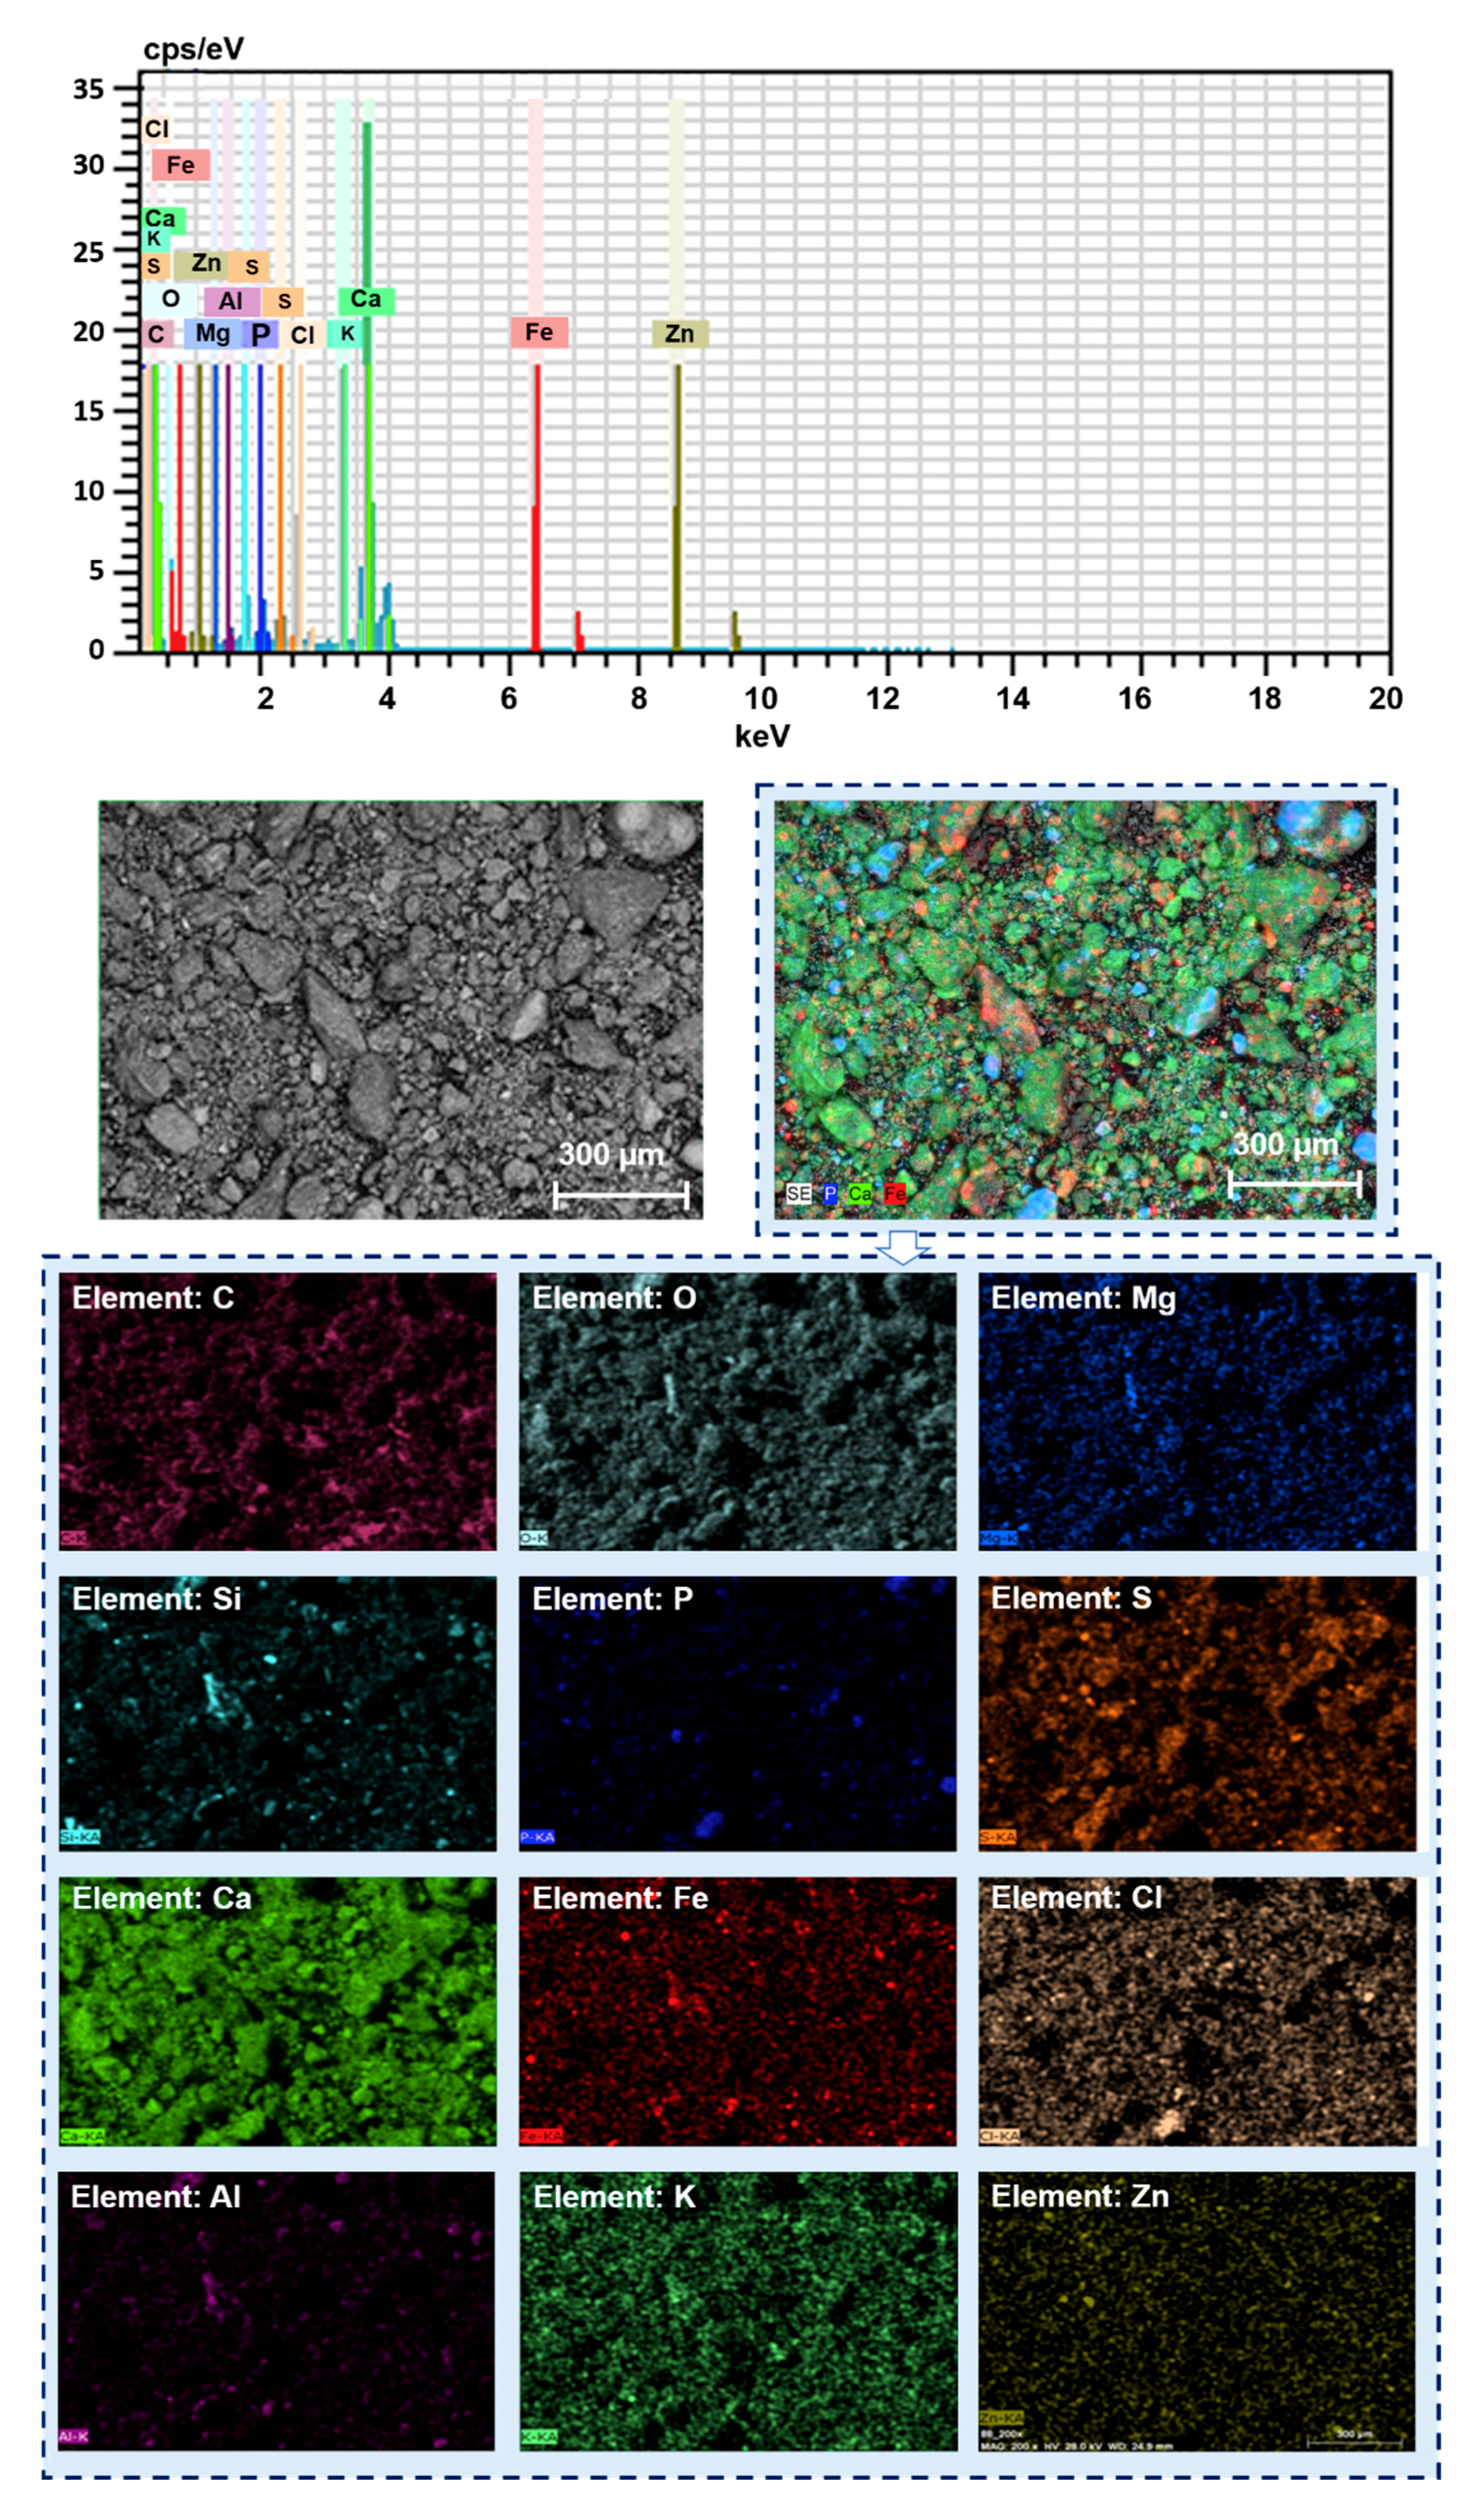
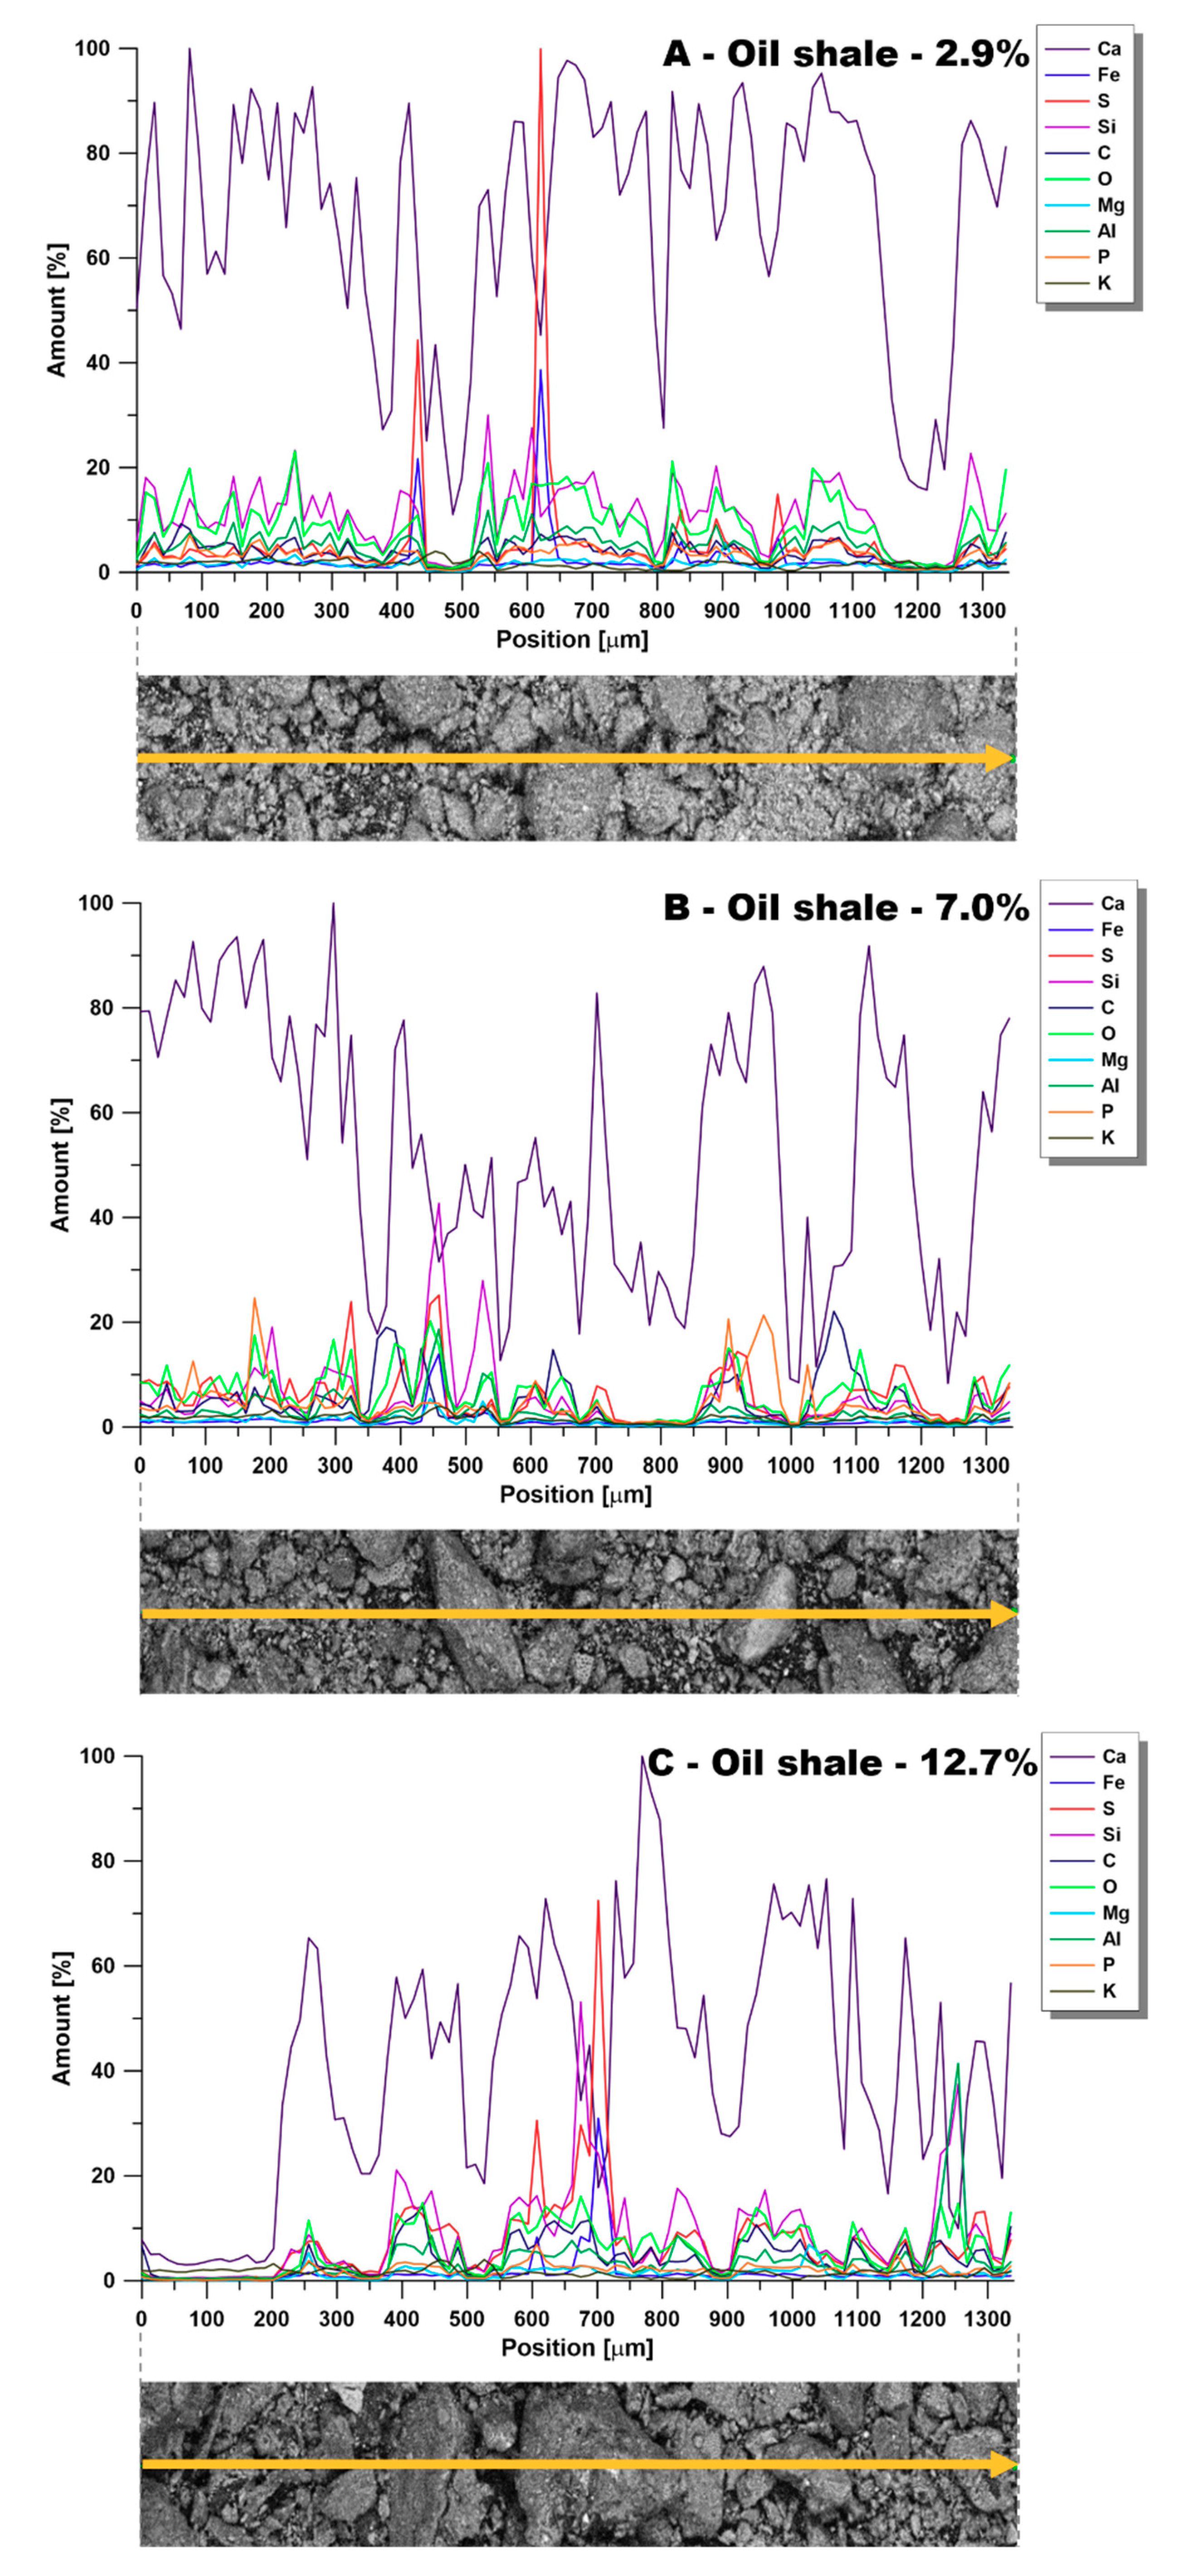
3.3.4. SEM
4. Conclusions
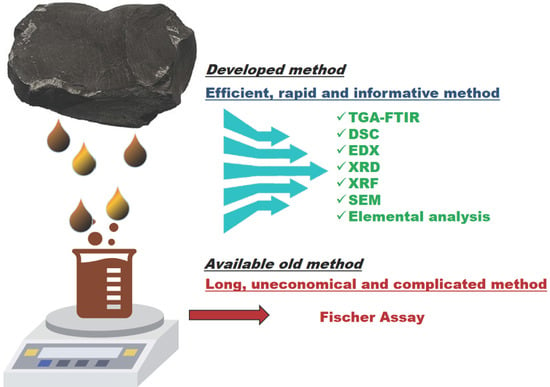
- The TGA method could be used as an alternative method to the conventional FA method due to the high linear regression factor (R2 = 0.99) obtained between the weight loss of the organic content in the pyrolysis range (370–560 °C) obtained by the TGA and the oil yield (wt.%) obtained by the FA method.
- Elemental analysis could be used for replacing the conventional FA method. A good quadratic correlation (R2 = 0.98) was maintained between the FA and the hydrogen mass content.
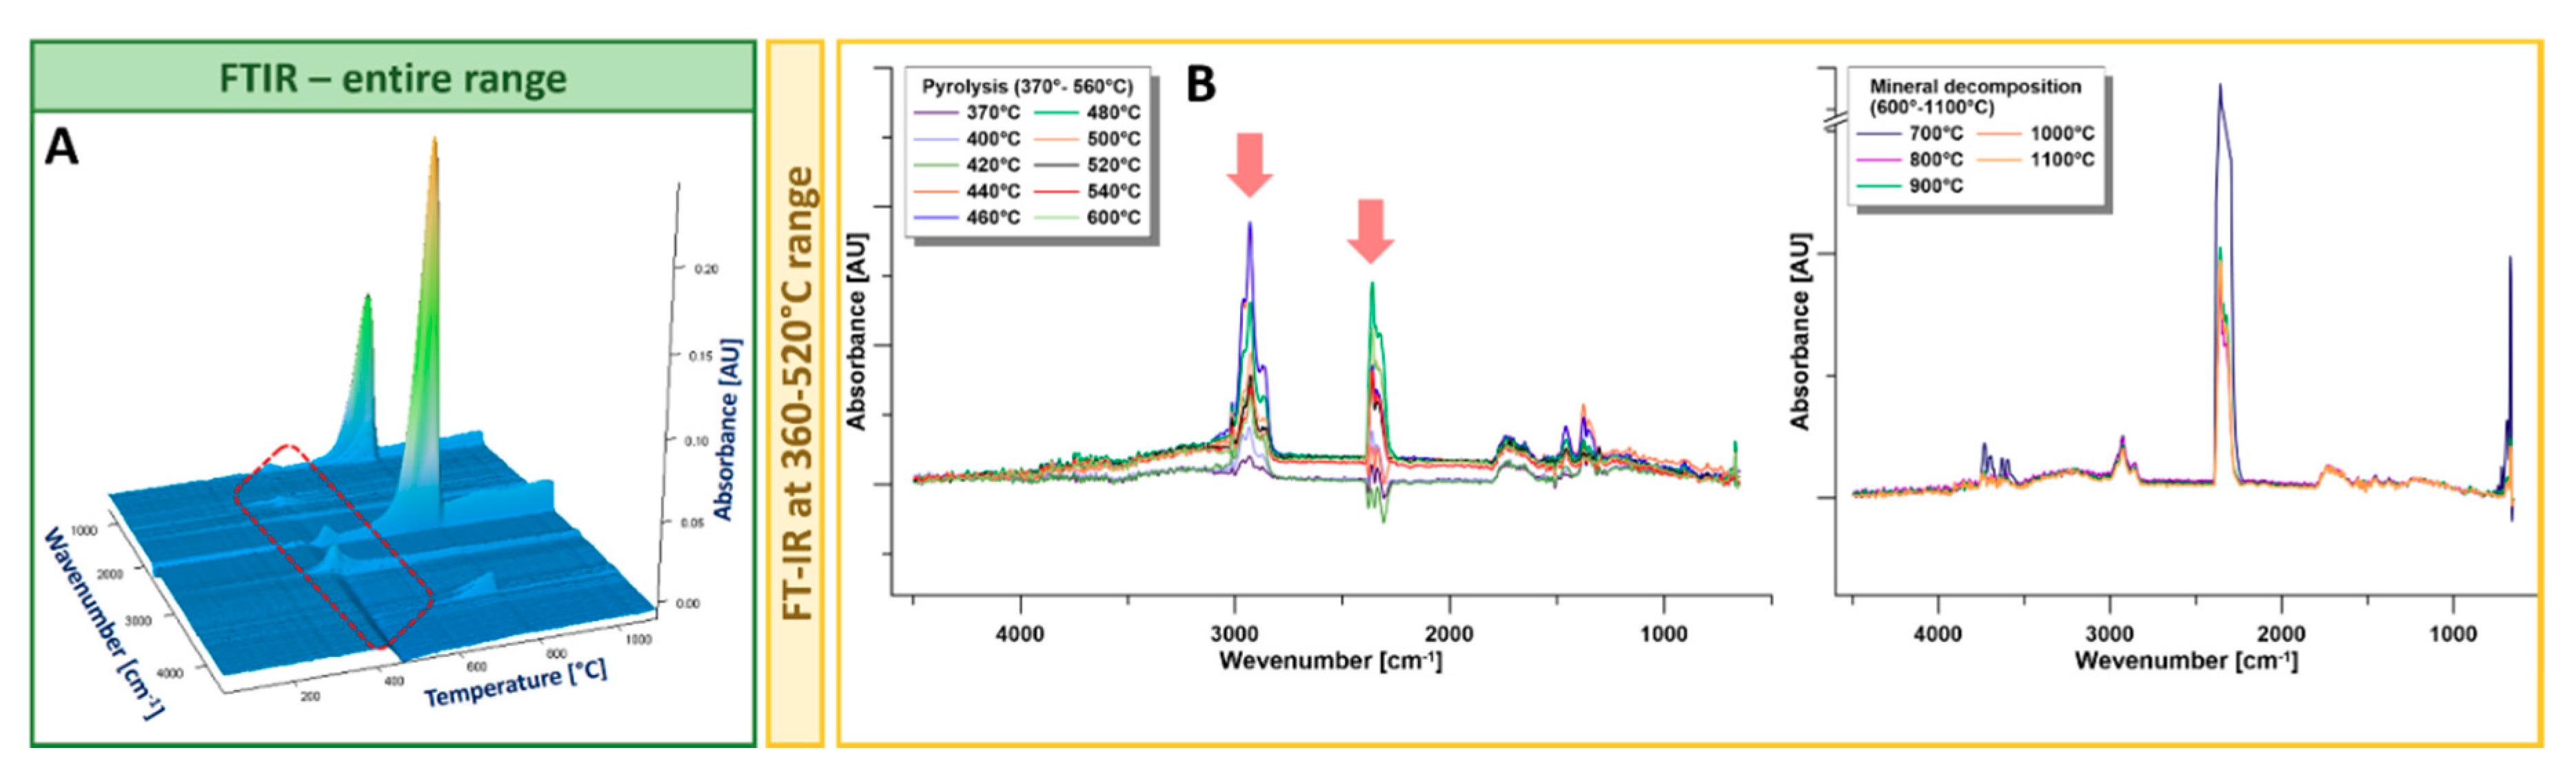
- The TGA-FTIR method could be used as another quick method for replacing the conventional FA method. A good quadratic correlation (R2 = 0.97) was maintained between the FA and the aliphatic hydrocarbons (FTIR peak at 2927 cm−1) produced in the pyrolysis zone.
- XRF analysis of the mineral matter revealed that this oil shale contains mainly calcite and quartz with low concentrations of other metal oxides (Al2O3, P2O5, Fe2O3, MgO, K2O, and TiO2).
- XRD analysis revealed the presence of the following minerals: quartz, ankerite, calcite, apatite, and clay, which matches oil shale composition.
- SEM analysis revealed an amorphous oil shale surface with no distinct clusters of organic material, which was proven by area mapping and line analysis.
Author Contributions
Funding
Acknowledgments
Conflicts of Interest
References
- Energy 2018—Facts and Figures; Ministry of Energy and Mineral Resources: Amman, Jordan, 2018.
- Qian, J.; Yin, L. Oil Shale—Petroleum Alternative; Petroleum Industry Press: Beijing, China, 2010. [Google Scholar]
- Wang, Q.; Hou, Y.; Wu, W.; Liu, Q.; Liu, Z. The structural characteristics of kerogens in oil shale with different density grades. Fuel 2018, 219, 151–158. [Google Scholar] [CrossRef]
- Alali, J.; Salah, A.A.; Yasin, S.M.; Omari, W.A. Oil Shale; Ministry of Energy and Mineral Resources: Amman, Jordan, 2015.
- El-Hasan, T.; Szczerba, W.; Buzanich, G.; Radtke, M.; Riesemeier, H.; Kersten, M. Cr(vi)/cr(iii) and As(v)/As(iii) ratio assessments in Jordanian spent oil shale produced by aerobic combustion and anaerobic pyrolysis. Environ. Sci. Technol. 2011, 45, 9799–9805. [Google Scholar] [CrossRef]
- Alhilu, G. Jordanian Oil Shale 2019; Ministry of Energy and Mineral Resources: Amman, Jordan, 2019.
- Jaber, J.O.; Probert, S.D. Exploitation of Jordanian oil-shales. Appl. Energy 1997, 58, 161–175. [Google Scholar] [CrossRef]
- Zhang, Z.; Yang, X.; Jia, H.; Zhang, H. Kerogen beneficiation from longkou oil shale using gravity separation method. Energy Fuels 2016, 30, 2841–2845. [Google Scholar] [CrossRef]
- Williams, P.F.V. Oil shales and their analysis. Fuel 1983, 62, 756–771. [Google Scholar] [CrossRef]
- Korth, J. Analytical Studies on Australian Oil Shales. Ph.D. Thesis, University of Wollongong, Wollongong, Australia, 1987. [Google Scholar]
- Tian, S.; Dong, X.; Wang, T.; Zhang, R.; Zhang, P.; Sheng, M.; Cheng, S.; Zhao, H.; Fei, L.; Street, J.; et al. Surface properties of organic kerogen in continental and marine shale. Langmuir 2018, 34, 13882–13887. [Google Scholar] [CrossRef]
- Foltin, J.P.; Lisboa, A.C.L.; de Klerk, A. Oil shale pyrolysis: Conversion dependence of kinetic parameters. Energy Fuels 2017, 31, 6766–6776. [Google Scholar] [CrossRef]
- Bai, F.; Sun, Y.; Liu, Y.; Guo, M.; Zhao, J. Characteristics and kinetics of Huadian oil shale pyrolysis via non-isothermal thermogravimetric and gray relational analysis. Combust. Sci. Technol. 2019, 1–15. [Google Scholar] [CrossRef]
- Hackley, P.C.; Lünsdorf, N.K. Application of raman spectroscopy as thermal maturity probe in shale petroleum systems: Insights from natural and artificial maturation series. Energy Fuels 2018, 32, 11190–11202. [Google Scholar] [CrossRef]
- Lu, Z.Q.; Hai, X.Q.; Wei, J.X.; Bao, R.M. Characterizing of oil shale pyrolysis process with laser ultrasonic detection. Energy Fuels 2016, 30, 7236–7240. [Google Scholar] [CrossRef]
- Budinova, T.; Razvigorova, M.; Tsyntsarski, B.; Petrova, B.; Ekinci, E.; Yardim, M.F. Characterization of Bulgarian oil shale kerogen revealed by oxidative degradation. Chemie Erde-Geochem. 2009, 69, 235–245. [Google Scholar] [CrossRef]
- Stam, A.F.; Meij, R.; te Winkel, H.; van Eijk, R.J.; Huggins, F.E.; Brem, G. Chromium speciation in coal and biomass co-combustion products. Environ. Sci. Technol. 2011, 45, 2450–2456. [Google Scholar] [CrossRef] [PubMed]
- Li, Z.-K.; Wei, X.-Y.; Yan, H.-L.; Zong, Z.-M. Insight into the structural features of zhaotong lignite using multiple techniques. Fuel 2015, 153, 176–182. [Google Scholar] [CrossRef]
- Salmon, E.; Behar, F.; Hatcher, P.G. Molecular characterization of type I kerogen from the green river formation using advanced NMR techniques in combination with electrospray ionization/ultrahigh resolution mass spectrometry. Org. Geochem. 2011, 42, 301–315. [Google Scholar] [CrossRef]
- Kelemen, S.R.; Afeworki, M.; Gorbaty, M.L.; Sansone, M.; Kwiatek, P.J.; Walters, C.C.; Freund, H.; Siskin, M.; Bence, A.E.; Curry, D.J.; et al. Direct characterization of kerogen by x-ray and solid-state 13C nuclear magnetic resonance methods. Energy Fuels 2007, 21, 1548–1561. [Google Scholar] [CrossRef]
- Chu, W.; Cao, X.; Schmidt-Rohr, K.; Birdwell, J.E.; Mao, J. Investigation into the effect of heteroatom content on kerogen structure using advanced 13C solid-state nuclear magnetic resonance spectroscopy. Energy Fuels 2019, 33, 645–653. [Google Scholar] [CrossRef]
- Siramard, S.; Bunman, Y.; Lai, D.; Xu, G. Pyrolysis of Huadian oil shale in an infrared heating reactor. Energy Fuels 2017, 31, 6996–7003. [Google Scholar] [CrossRef]
- Xu, S.; Zeng, X.; Han, Z.; Cheng, J.; Wu, R.; Chen, Z.; Masĕk, O.; Fan, X.; Xu, G. Quick pyrolysis of a massive coal sample via rapid infrared heating. Appl. Energy 2019, 242, 732–740. [Google Scholar] [CrossRef]
- Siramard, S.; Zhan, J.-H.; Han, Z.; Xu, S.; Mašek, O.; Xu, G. Secondary cracking of volatile and its avoidance in infrared-heating pyrolysis reactor. Carbon Resour. Convers. 2018, 1, 202–208. [Google Scholar] [CrossRef]
- Luo, X.; Guo, Q.; Zhang, D.; Zhou, H.; Yang, Q. Simulation, exergy analysis and optimization of a shale oil hydrogenation process for clean fuels production. Appl. Therm. Eng. 2018, 140, 102–111. [Google Scholar] [CrossRef]
- Dyni, J.R. Geology and Resources of Some World Oil-Shale Deposits; 2005–5294; U.S. Department of the Interior: Washington, DC, USA, 2006; p. 49. Available online: https://pubs.usgs.gov/sir/2005/5294/pdf/sir5294_508.pdf (accessed on 8 August 2019).
- Standard Test Method for Oil from Oil Shale (Resource Evaluation by the Fischer Assay Procedure; ASTM: D 3904-90; ASTM International: West Conshohocken, PA, USA, 1990.
- Williams, P.F.V. Thermogravimetry and decomposition kinetics of British Kimmeridge clay oil shale. Fuel 1985, 64, 540–545. [Google Scholar] [CrossRef]
- Mingshu, C.; Xiyan, L.; Hongpeng, L.; Yang, X.; Qing, W. Gaseous emission and thermal analysis during co-combustion of oil shale semi-coke and sawdust using TG-FTIR. Oil Shale 2015, 32, 356–372. [Google Scholar] [CrossRef]


| Sample | Fischer Assay | OS Density | |
|---|---|---|---|
| (g/100 g) | (mL/100 g) | (g/mL) | |
| OS1 | 2.90 | 3.00 | 0.967 |
| OS2 | 5.31 | 5.50 | 0.964 |
| OS3 | 7.00 | 7.25 | 0.966 |
| OS4 | 9.10 | 9.48 | 0.960 |
| OS5 | 11.20 | 11.70 | 0.957 |
| OS6 | 12.70 | 13.35 | 0.951 |
| Sample | Shale Oil (wt.%) | CaO | SiO2 | Al2O3 | P2O5 | Fe2O3 | MgO | K2O | TiO2 |
|---|---|---|---|---|---|---|---|---|---|
| OS1 | 2.9 | 41.0 | 10.7 | 3.83 | 1.77 | 1.71 | 0.58 | 0.34 | 0.11 |
| OS2 | 5.0 | 21.4 | 41.3 | 2.35 | 3.81 | 1.30 | 2.83 | 0.77 | 0.12 |
| OS3 | 7.0 | 44.6 | 3.97 | 1.19 | 8.51 | 0.61 | 0.12 | 0.01 | 0.02 |
| OS4 | 9.1 | 37.2 | 11.2 | 2.05 | 1.13 | 1.09 | 0.33 | 0.08 | 0.08 |
| OS5 | 11.2 | 36.9 | 7.76 | 1.21 | 0.83 | 0.73 | 0.39 | 0.09 | 0.05 |
| OS6 | 12.7 | 33.8 | 9.28 | 2.46 | 1.21 | 1.19 | 0.63 | 0.28 | 0.11 |
© 2019 by the authors. Licensee MDPI, Basel, Switzerland. This article is an open access article distributed under the terms and conditions of the Creative Commons Attribution (CC BY) license (http://creativecommons.org/licenses/by/4.0/).
Share and Cite
Abu El-Rub, Z.; Kujawa, J.; Albarahmieh, E.; Al-Rifai, N.; Qaimari, F.; Al-Gharabli, S. High Throughput Screening and Characterization Methods of Jordanian Oil Shale as a Case Study. Energies 2019, 12, 3148. https://doi.org/10.3390/en12163148
Abu El-Rub Z, Kujawa J, Albarahmieh E, Al-Rifai N, Qaimari F, Al-Gharabli S. High Throughput Screening and Characterization Methods of Jordanian Oil Shale as a Case Study. Energies. 2019; 12(16):3148. https://doi.org/10.3390/en12163148
Chicago/Turabian StyleAbu El-Rub, Ziad, Joanna Kujawa, Esra’a Albarahmieh, Nafisah Al-Rifai, Fathieh Qaimari, and Samer Al-Gharabli. 2019. "High Throughput Screening and Characterization Methods of Jordanian Oil Shale as a Case Study" Energies 12, no. 16: 3148. https://doi.org/10.3390/en12163148