Energy-Efficient Improvement Approaches through Numerical Simulation and Field Measurement for a Data Center


Department of Refrigeration, Air Conditioning and Energy, Engineering, National Chin-Yi University of Technology, Taichung 411, Taiwan
*
Author to whom correspondence should be addressed.
Energies 2019, 12(14), 2757; https://doi.org/10.3390/en12142757
Submission received: 18 June 2019
/
Revised: 10 July 2019
/
Accepted: 16 July 2019
/
Published: 18 July 2019
(This article belongs to the Special Issue Building Renewable Energy and Thermal Energy Storage System 2019)
Abstract
:The power density of electronic equipment increased dramatically recently. Data center and data processing and telecommunication facilities are facing the exceptionally high sensible heat loads which result in a large amount of energy consumption. In this study, a numerical simulation using computational fluid dynamics (CFD) was conducted to investigate the influence of alternative approaches to avoid bypassing and recirculation for air distribution in a full-scale data center. Field measurements were extensively conducted to validate the simulation results. Various performance indexes were adopted to enhance the evaluation of the thermal performance of the data center. The simulation results revealed that the practice with hot aisle enclosure and the installation of blocking panels for the unoccupied racks can provide satisfactory airflow distribution and thermal management under low load conditions. The return temperature index (RTI) can be improved by 3% through CFD simulation through installation of the blank panels, which reveals the reduction of recirculation airflow. The return heat index (RHI) increases by 8%, which presents a reduction of bypass airflow. A practical experiment using physical air curtains was conducted to enclose the hot aisle in the data center, which also reveals an 8% improvement for bypass airflow. Higher cooling performance can be achieved via reduction of recirculation and bypass airflow in the data center. Through the simulation of different improvement approaches in the data center, the optimum practice for cooling airflow arrangement can be identified accordingly.
1. Introduction
The energy consumption of internet data centers (IDC) is anticipated to ascend dramatically in the coming years [1]. Cooling of high-computation-density IDCs is extremely essential and critical due to the increasing power density of electronic equipment. However, the heat rejection augmentation made manufactures and internet service providers within information technology (IT) industries face huge challenges to provide decent cooling for IT facilities [2]. It is vital to examine the best airflow distribution to address the energy saving concern for data center facilities. Both numerical and experimental investigations on airflow distribution and management for data centers were reviewed comprehensively [3]. An extensive review on airflow management for data centers based on available airflow patterns was conducted through numerical simulation and field measurement [4]. The major concerns for airflow management, including recirculation, bypassing, and leakage problems, were addressed extensively. Another study on recent advancements for thermal management for data centers was presented [5]. Various design and thermal management approaches were proposed to improve the energy efficiency for data centers.
The computational fluid dynamics (CFD) simulation is a scientific and widely accepted technique which can be used to better understand the situation and make an optimum decision to improve the conditions to those desired. Airflow distribution in a data center affects the cooling effectiveness significantly, which impacts the energy efficiency of the data center accordingly. The cooling performance and different airflow patterns were investigated by CFD simulation to identify feasible improvement approaches [6]. The airflow distribution through perforated floor grilles in a data center was studied comprehensively by applying CFD simulation [7]. Additionally, the opening percentage and the height of the raised floor in an IDC were investigated extensively to analyze the influence of airflow distribution by the application of numerical simulation using CFD [8]. Furthermore, the inlet temperature of racks can be decided by CFD simulation and the rack cooling index (RCI) can be defined according to Herrlin [9]. This study also discussed the method for optimizing cooling performance by applying the index of RCI via CFD simulation. It reveals that CFD modeling enhances three-dimensional (3D) analyses of key environmental parameters such as temperature and airflow distribution in a feasible way [10].
ASHRAE TC 9.9 [11] provides comprehensive thermal guidelines for data center environments. The design specification along with all operating conditions of data centers was presented extensively. The design and management for IDC cooling, including the challenges for energy saving concerns, were investigated extensively to implement better thermal management and energy-efficient data centers [12]. The energy-saving potential of two hybrid cooling systems with evaporative coolers and heat pipes for a data center was investigated through the calculation of energy efficiency, which revealed a substantial energy saving compared to the traditional vapor compression cycle system [13]. The application of fresh air economizers to reduce the cooling load in the data center may have more substantial energy saving than high-efficiency air-conditioning units [14]. Moreover, some worst-case practices in data centers were investigated to identify the best practices via comprehensive field measurement [15]. Another retrofitting project of a data center was implemented and the feasibility of improving the heat source enclosure and airflow management through field tests was investigated comprehensively [16]. Furthermore, the practical survey metrics of the data center on airflow management was presented extensively [17]. This investigation also analyzed the airflow distribution and effectiveness between the raised floor and non-raised system for data center systems.
Although some studies were conducted on field measurements, as well as CFD simulations, for data centers, little quantitative information was available for a full-scale investigation, especially when the data center was not under full load operation and different improvement approaches needed to be evaluated. In this study, the field measurement for a performance evaluation of a full-scale data center was investigated comprehensively including facility health audit tests and equipment installation verification tests. After the field measurement, a comprehensive CFD model for the existing data center was conducted for further comparison of different improvement approaches to improve the thermal performance for energy saving concerns. Then, a practical experiment using physical air curtains was conducted to enclose the hot aisle in the data center to evaluate the effect of thermal performance accordingly.
2. System Description and Numerical Modeling
The layout plan of the investigated data center is shown in Figure 1a. The investigated data center with floorage of 95.4 m2 and height of 2.7 m is located in the computer science center of our university campus. There are 23 racks (each 1.2 m × 0.8 m × 2.0 m) within the data center with a typical hot aisle and cold aisle design arrangement. Two computer room air-conditioning (CRAC) units provide chilled airflow, which is distributed to the cold aisle for cooling down the heat generation from tracks through the raised floor. The schematic diagram of the investigated data center is shown in Figure 1b. The servers are organized to pull and drag airflow from the front and drain air out at the back of the mounted racks. The airflow is delivered through the server and cools down the heating load, then returned back to CRAC units from the hot aisles. The cooling capacity of the CRAC1 unit is 67 kW with a rated supply airflow rate of 15,600 (m3/h), while the CRAC2 unit is 25 kW with a rated supply airflow rate of 5700 (m3/h) as a backup unit for expansion purpose. Furthermore, the cold airflow from the cold aisles is supplied through 22 supplying air perforated plates from the raised floor, while the hot airflow from the hot aisles is exhausted through 17 returning air grilles at the ceiling and then circulated back to the CRAC units of the data center. Additionally, the specific on-site rack arrangement plan of the data center is shown in Figure 2a, which reveals that the data center is not under full loading operation with two spare racks, two idle racks, and some non-fully occupied racks. The specific heat generation parameters for each rack in the data center are depicted in Figure 2b.
The rack plan for simulation of the investigated data center is displayed in Figure 3a, which exactly corresponds to the on-site rack arrangement. A single server box with the dimensions of 0.75 m × 0.5 m × 2.0 m was assumed, which is equivalent to a 4 U (unit) server. One rack can accommodate a maximum of 10 server boxes. The lighter gray ones display servers that are idle, while the charcoal gray ones present servers under operation. There are still many uninstalled server spaces within the rack, which are presented in white, while some of them are blocked by blanking panels in black color. Moreover, the 3D geometric model for simulation of the investigated data center is displayed in Figure 3b. Two CRAC units and 23 racks are present with hot aisles and cold aisles in an alternating arrangement of a 1.2-m-wide aisle. The airflow data including temperature, velocity, and airflow rate from field measurements are provided as the boundary conditions for the numerical simulation. The inlet boundary conditions for the supply perforated plates correspond to the field measurement layout depicted in Figure 4a, while the return air grilles with outflow boundary conditions are displayed in Figure 4b.
To evaluate the energy-saving potential and the thermal performance under different improvement approaches, a commercial CFD code, ANSYS Fluent [18], was applied to simulate the temperature and airflow distribution of the data center. The simulation set-up is summarized in Table 1. The governing equations were solved by Fluent, including the three-dimensional steady-state incompressible Navier–Stokes equation and standard k–ε turbulence equations. These formulated equations can be found in the ANSYS Fluent user manual, as well as CFD textbooks, and is not repeated here. The well-known finite control volume method with a Semi-Implicit Method for Pressure-Linked Equation (SIMPLE) algorithm was adopted to solve the problem involving velocity and pressure coupling simultaneously. It was assumed that the temperature and velocity field was homogeneous and three-dimensional. The temperature and face velocity of the CRACs, supply air perforated plates, and returned air grilles were measured through field tests using a hot-wired anemometer and an array anemometer which provided reliable data as the boundary conditions of the CFD simulation. All of the boundary conditions were clearly defined, corresponding to the actual field measurement data. The supply air temperature from CRACs was maintained at 291 K (18 °C). Typically, the no-slip stationary wall condition was assumed on the solid walls at a temperature of 298 K (25 °C). The k–ε turbulence model with standard wall function was applied for simulation. The poor cooling performance might be induced due to the recirculation or mixing airflow of the hot aisle and cold aisle. Different improvement approaches through simulation were compared extensively to achieve better thermal performance and an energy-efficient data center. A grid independent test was carried out in this study to determine the suitable number of elements of the mesh. Three different numbers of meshes were considered in this study: 5,750,221 elements for coarse meshes, 10,653,761 elements for medium meshes, and 13,024,003 elements for fine meshes. Medium meshes were adopted in this study with a compromise of accuracy and time. Those meshes were validated in terms of their accuracy with the data from field measurements.
3. Field Measurement and Performance Evaluation Index
Field tests including temperature and humidity were conducted to ensure that the data center performed correctly and met the design guidelines. These guidelines are specified comprehensively in ASHRAE [11]. They also contain a lot of valuable information, describing field measurements to evaluate and characterize the overall performance of the data center. There were two tests conducted in this study, namely, facility health and audit tests and equipment installation verification tests [9]. The schematic diagram of sampling points for audit tests is shown in Figure 5, which focuses more on the intake air parameters of cold aisles only. However, hot aisle air parameters are also included for further comparative study with the numerical simulation. Sampling points 1, 2, 3, 7, 8, and 9 represent cold aisles, while sampling points 4, 5, 6, 10, 11, and 12 depict hot aisles. As for the verification tests which focus more on the intake air parameters for servers, the specific sampling points for each rack are displayed in Figure 2a. There are three sampling points (denoted as a, b, and c) located at the lower, central, and upper parts in front of the servers (about 5 cm for each rack).
To examine the indoor environmental parameters and thermal performance of this investigated data center, comprehensive field measurements were conducted at specified sampling locations. It was also vital to provide reliable measured data as the boundary conditions of the CFD simulation for performance improvement. The specifications of instruments for field measurements are depicted in Table 2. The temperature and humidity were measured at specified sampling locations. The variations of temperature and humidity were measured using a multi-channel data logger with several temperature sensors and humidity transmitters. Tests of temperature at an accuracy of 0.2 °C and humidity at an accuracy of 2% relative humidity (RH) were conducted continuously for one hour under different measurement conditions. The face velocities of each rack were tested with a TSI-9565-P thermal (hot-wired) anemometer with an uncertainty of 3% at full scale. The volumetric airflow rate of each supply air perforated plates and return air grilles was measured three times using a TSI PH731 array anemometer for accuracy and repeatability. To support the auxiliary temperature profile for racks and aisles, an FLIR-17 infrared thermograph was employed to derive the real-time temperature on site.
As for the performance evaluation index adopted in this study, four widely accepted indexes [9] were included to assess the thermal performance of the investigated data center. They were the rack cooling index (RCI), return temperature index (RTI), supply heat index (SHI), and return heat index (RHI). The rack cooling index (RCI) was applied as a measure of how efficiently racks are cooled under thermal guidelines. It can provide a useful measure for rack cooling performance. The RCI is defined in ASHRAE [11] as follows:
where Tx is the mean temperature at intake x, n is the total number of intakes, Tmax-rec is the maximum recommended temperature by the guideline, Tmax-all is the maximum allowable temperature, and HI and LO display the measures of a data center at the highest and lowest temperatures, respectively.
RCIHI is a measure of the deficiency over high temperatures, while RCIHI = 1 represents the ideal case with no over-temperature occurring.
The return temperature index (RTI) demonstrates whether a measure of supply air volume is over or under the guideline. The oversupply of airflow causes bypassing flow, while less airflow induces recirculation for the data center. It provides an effective measure for the domination of recirculation or bypass supply airflow. The RTI is defined as follows:
where TReturn is the mean return air temperature from the CRAC unit, TSupply is the mean supply air temperature from the CRAC unit, and ∆TEquip is the mean temperature difference of the rack equipment.
The supply heat index (SHI) presents a measure of the efficiency of the supply air heat loss caused by recirculation under thermal guidelines. It provides an effective measure of supply air heat loss for cooling the racks. The SHI is defined as follows:
where TIntake is the intake air temperature of the rack, TExhust is the exhaust air temperature of the rack, and TSupply is the supply air temperature from the CRAC unit.
The return heat index (RHI) demonstrates a measure of the efficiency of the return air heat loss via bypassing the racks. It provides an effective measure for return air bypassing for cooling the racks. The RHI is defined as follows:
RHI is a measure of bypass heat loss. RHI = 1 represents the ideal case without bypass heat loss, which reveals that the return air temperature is equal to the CRAC unit temperature. It also demonstrates an energy-efficient data center with less bypass heat loss.
4. Results and Discussion
To investigate the thermal performance of the existing data center, field measurements were conducted comprehensively, including facility health audit tests and equipment installation verification tests. It is essential to evaluate the thermal performance, as well as airflow management, because the energy-intensive data center operates 24 hours year-round.
Figure 6a presents the facility health and audit tests, where the cold aisle temperature was about 24.0–24.7 °C, which was within but close to the maximum recommended limit of 18.0–27.0 °C. However, due to the data center not being under full load conditions, it was quite essential for evaluating the thermal performance in advance. The temperature difference between the hot aisle and cold aisle was as low as 1–2 °C, which reveals that bypassing and recirculation might be obvious and need to be improved more effectively. As shown in Figure 6b, the installation verification tests for the intake air temperature at each rack are presented. The temperature increased from the bottom to the top of the cold aisle at three sampling points (a, b, and c) for each rack. The sampling point c for rack 14 and rack 15 almost reached the maximum recommended limit of 27 °C even under partial load conditions, which reveals that the airflow management should be improved effectively to avoid high intake air temperature for racks. Figure 6c demonstrates that the temperature reached almost 30 °C from the infrared thermograph image (in red color) at the top of the rack in the cold aisle. This is due to the heat generation not only from server only but also from the extra power supply located at the top of the racks. It might make the cooling performance degrade significantly.
After the field measurements, bypass airflow at both ends of the cold aisle/hot aisle, as well as higher intake temperature at some racks, was observed. To improve the thermal performance and to address the energy saving concerns, a comprehensive full-scale CFD model for the existing data center was conducted for further comparison with different improvement approaches. As shown in Figure 7, the temperature distribution along the Y-axis (height of data center) is presented. The temperature increased along the Y-axis, but the temperature difference became not so apparent at the top of aisles due to the mixing of bypass airflow. The cooling performance degraded accordingly due to higher intake air temperature for the racks. All of the simulation results were validated with the field measurement data at the same sampling point. Figure 8 depicts the comparison of CFD simulation and field test data at the same location. The simulation results present good agreement with the field test data except for a slightly lower temperature due to a simplified assumption ignoring minor heat generation from lighting and the power supply within the data center. The error percentage of 6% between simulation and field test data is acceptable for engineering applications.
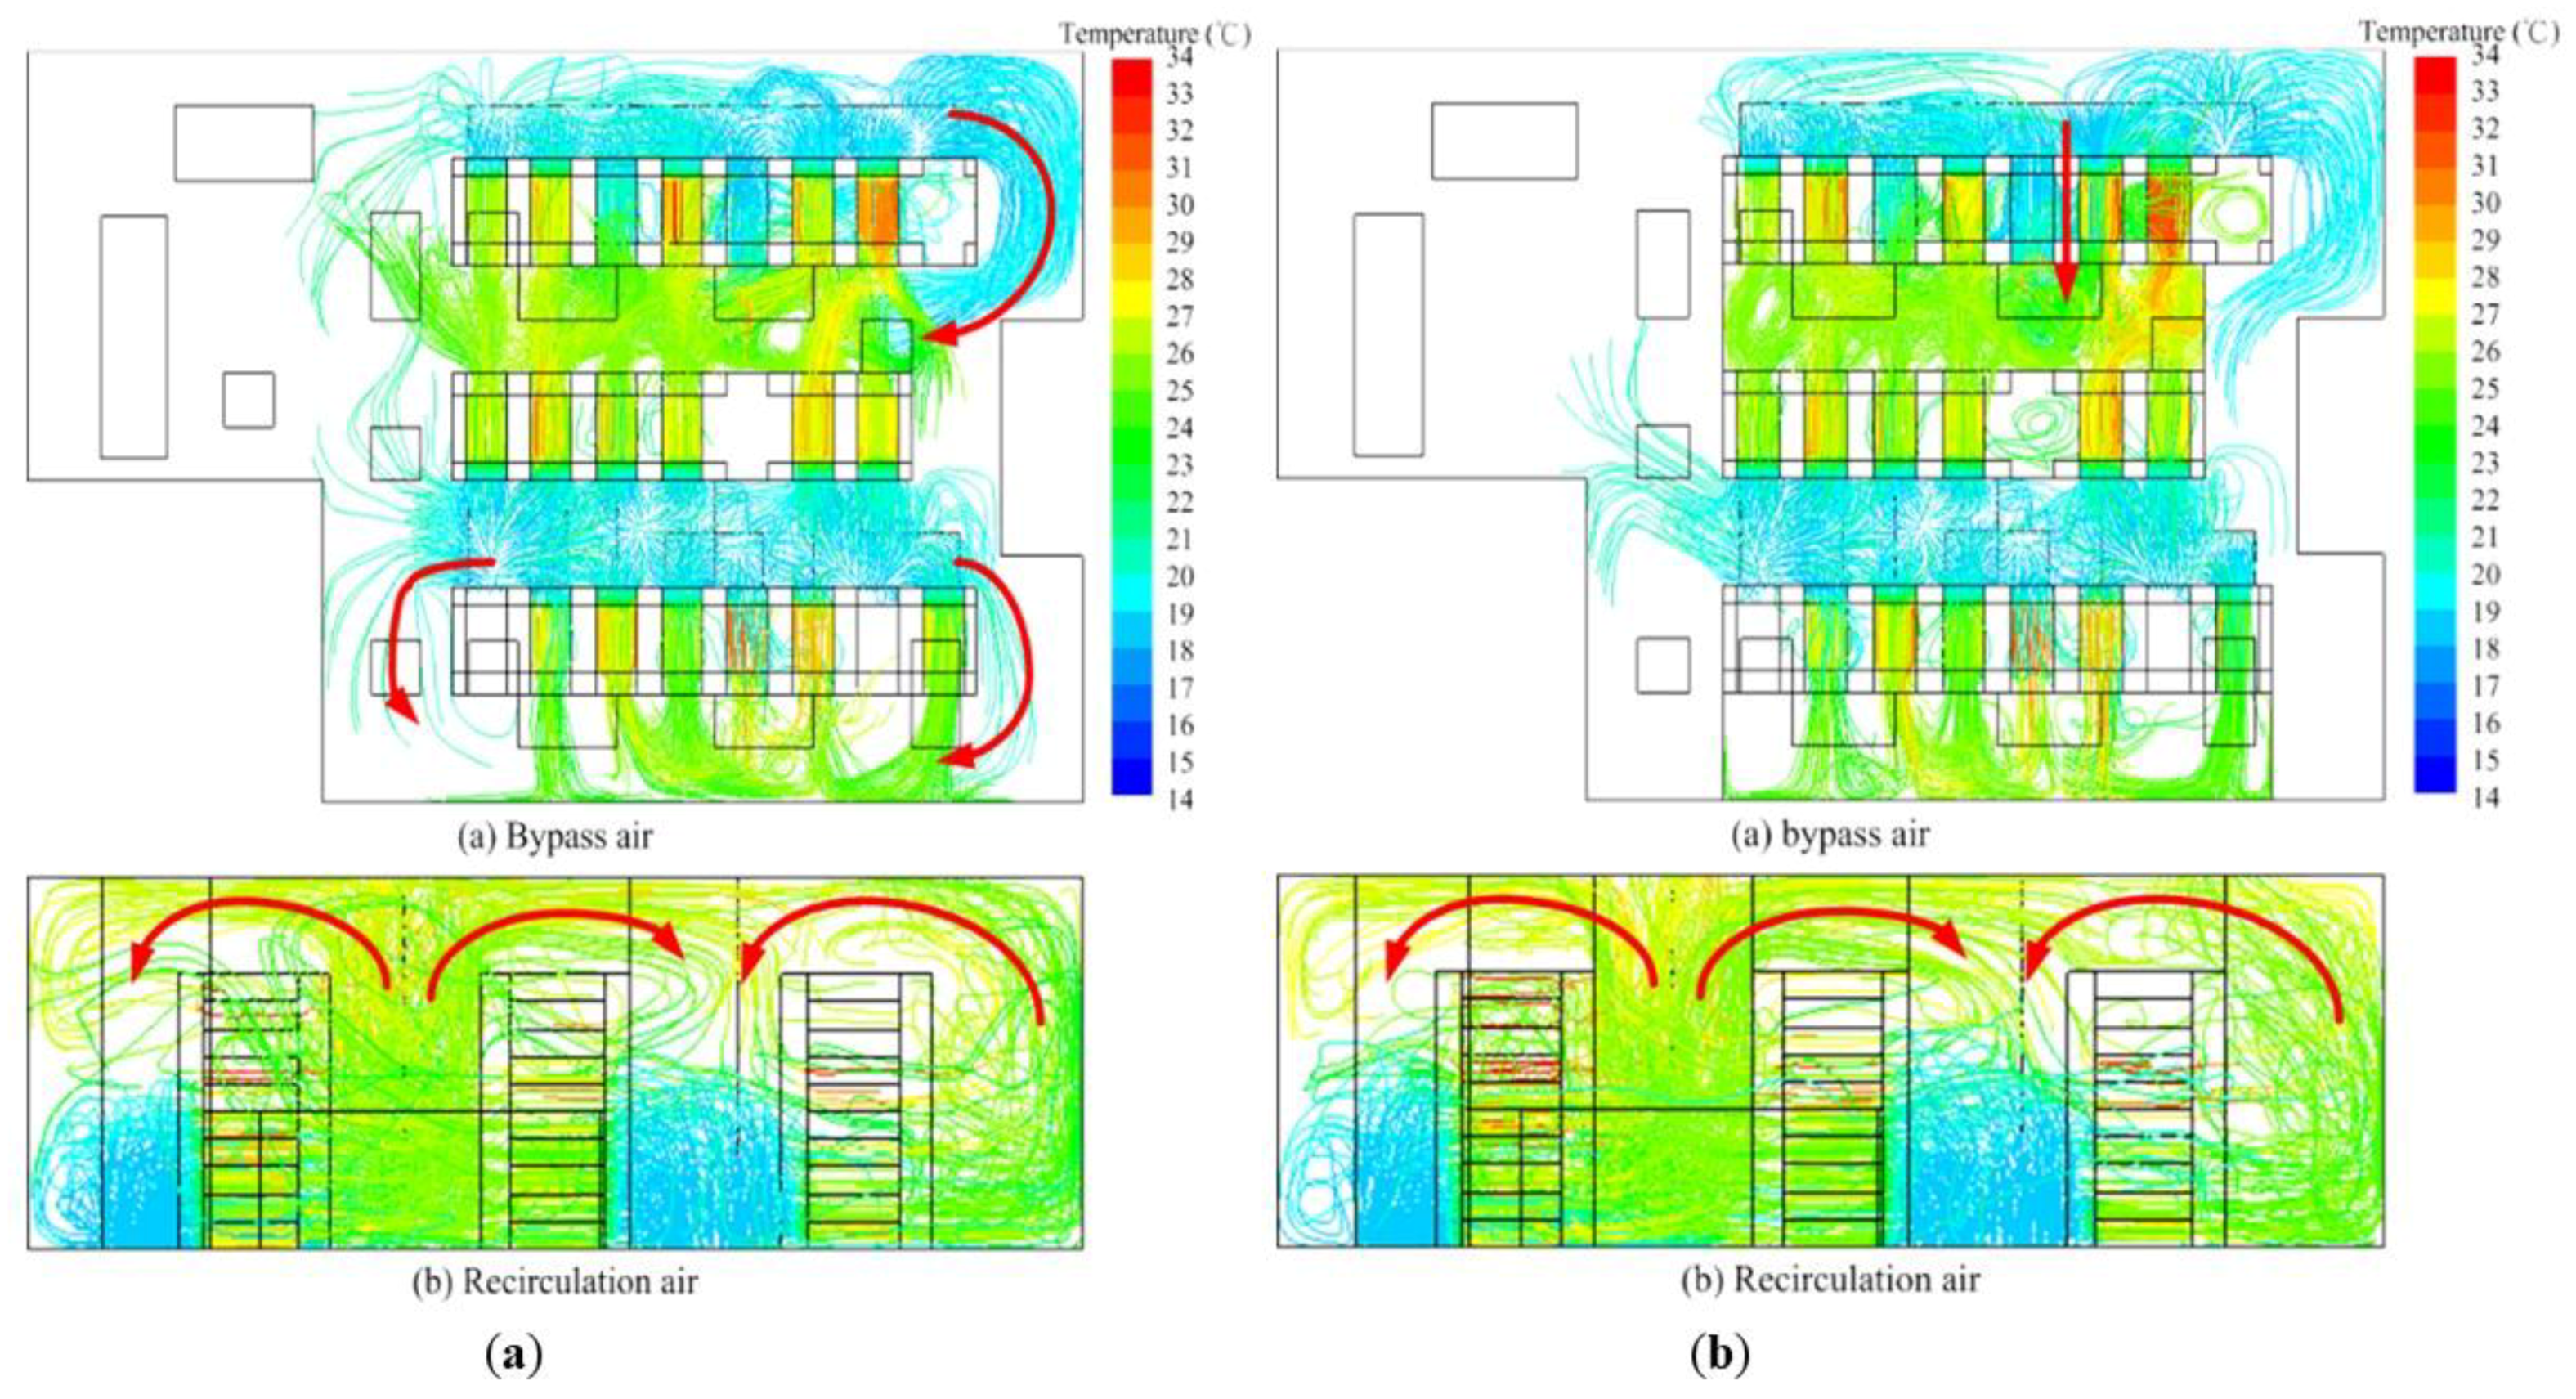
To enhance the understanding of bypass and recirculation airflow of the data center, the temperature trajectory is presented through the CFD simulation. As shown in Figure 9a, the bypass airflow was obvious at both ends of the cold aisle, which corresponds to the field measurement scenario. Due to the lower supply air volume at the central part of the cold aisle, the recirculation airflow moving from the top of the racks also degraded the cooling performance. To improve the poor thermal performance of the airflow management, utilizing the enclosure on both sides of the hot aisle was conducted. The results from the CFD simulation depicted in Figure 9b revealed that the bypass airflow can be improved substantially at both ends of the aisles, except for some minor bypass from the blank racks. However, the recirculation from the top of the racks did not improve effectively. Therefore, another improvement approach utilizing the installation of a blocking panel for unoccupied blank racks was proposed and simulated.
Figure 10a presents the simulation results for the hot aisle enclosure, which demonstrates an obvious improvement for bypass airflow at both ends of the aisles. However, there still exists bypass airflow from the cold aisle to the hot aisle due to the unoccupied blank racks. To improve the bypass airflow, the installation of more blanking block panels was conducted for the unoccupied racks. As shown in Figure 10b, the improvement after the installation of block panels was obvious, which reveals that the bypass airflow from the cold aisle at the bottom and some unoccupied racks was improved substantially.
Various indexes were adopted to evaluate the thermal performance of this data center. The rack cooling index (RCI) was not suitable for this case due to the data center not being under full load operation. The mean highest and lowest temperatures for intake air were still within the recommended temperature range by the guideline, which reveals that the RCIHI and RCILO were 100%. However, as displayed in Figure 11a, the return temperature index (RTI) of the existing data center was 105%, which reveals that recirculation from both aisles was 5% deviated from the target (ideal) condition. The improvement approach via installation of blocking panels presented a better performance with an RTI of 102%, which demonstrates a 2% deviation from the target, which reduced the recirculation airflow from the hot aisle back to the cold aisle. Figure 11b presents the indexes of SHI and RHI for different improvement approaches. SHI could be reduced from 0.22 (existing case) to 0.2 (enclosed hot-aisle case) and 0.15 (blocking panel case) due to the reduction of heat loss through recirculation mixing. Furthermore, the RHI could be improved from 0.78 to 0.8 and 0.85, which reveals that both two approaches could enhance cooling performance by about 2% to 7% less bypass airflow. It also demonstrates that an energy-efficient data center can be achieved effectively.
After the preliminary study for improvement approaches, a practical experiment using physical air curtains was conducted to enclose the hot aisle in the data center. Figure 12a shows the snapshot of the physical air curtain enclosing the hot aisle. Field tests were conducted again to examine the thermal performance of the data center after utilizing the physical curtain. As presented in Figure 12b, the temperature decreased in the cold aisle and increased in the hot aisle after using the air curtain, which reveals that the improvement approach was effective. Furthermore, the temperature and humidity variations at specific sampling locations in the hot aisle were also recorded on site. Figure 12c presents that the temperature increased 2–3 °C and the relative humidity decreased 5–10% after putting down the air curtain, which reveals that this approach not only enhanced the cooling performance but also reduced the relative humidity effectively.
As for the verification tests for the intake temperature of the racks, Figure 13a shows that the maximum intake temperature decreased for almost every rack after utilizing the physical curtain. It reveals the effectiveness of the approach involving enclosing the hot aisle to reduce the recirculation for both aisles. However, there still existed an intake temperature increase for rack 4 and rack 5. This is because the enclosed hot aisle increased some bypass airflow from the unoccupied rack spaces. It also reveals that no one improvement approach can enhance thermal performance entirely. The integration of different approaches such as the installation of blocking panels is essential for achieving the energy-efficient data centers. As shown in Figure 13b, the intake temperature did not decrease for rack 4 at sampling point c after using the physical curtain due to substantial bypass airflow through unoccupied rack spaces. This field measurement result also corresponds to the CFD simulation in Figure 10.
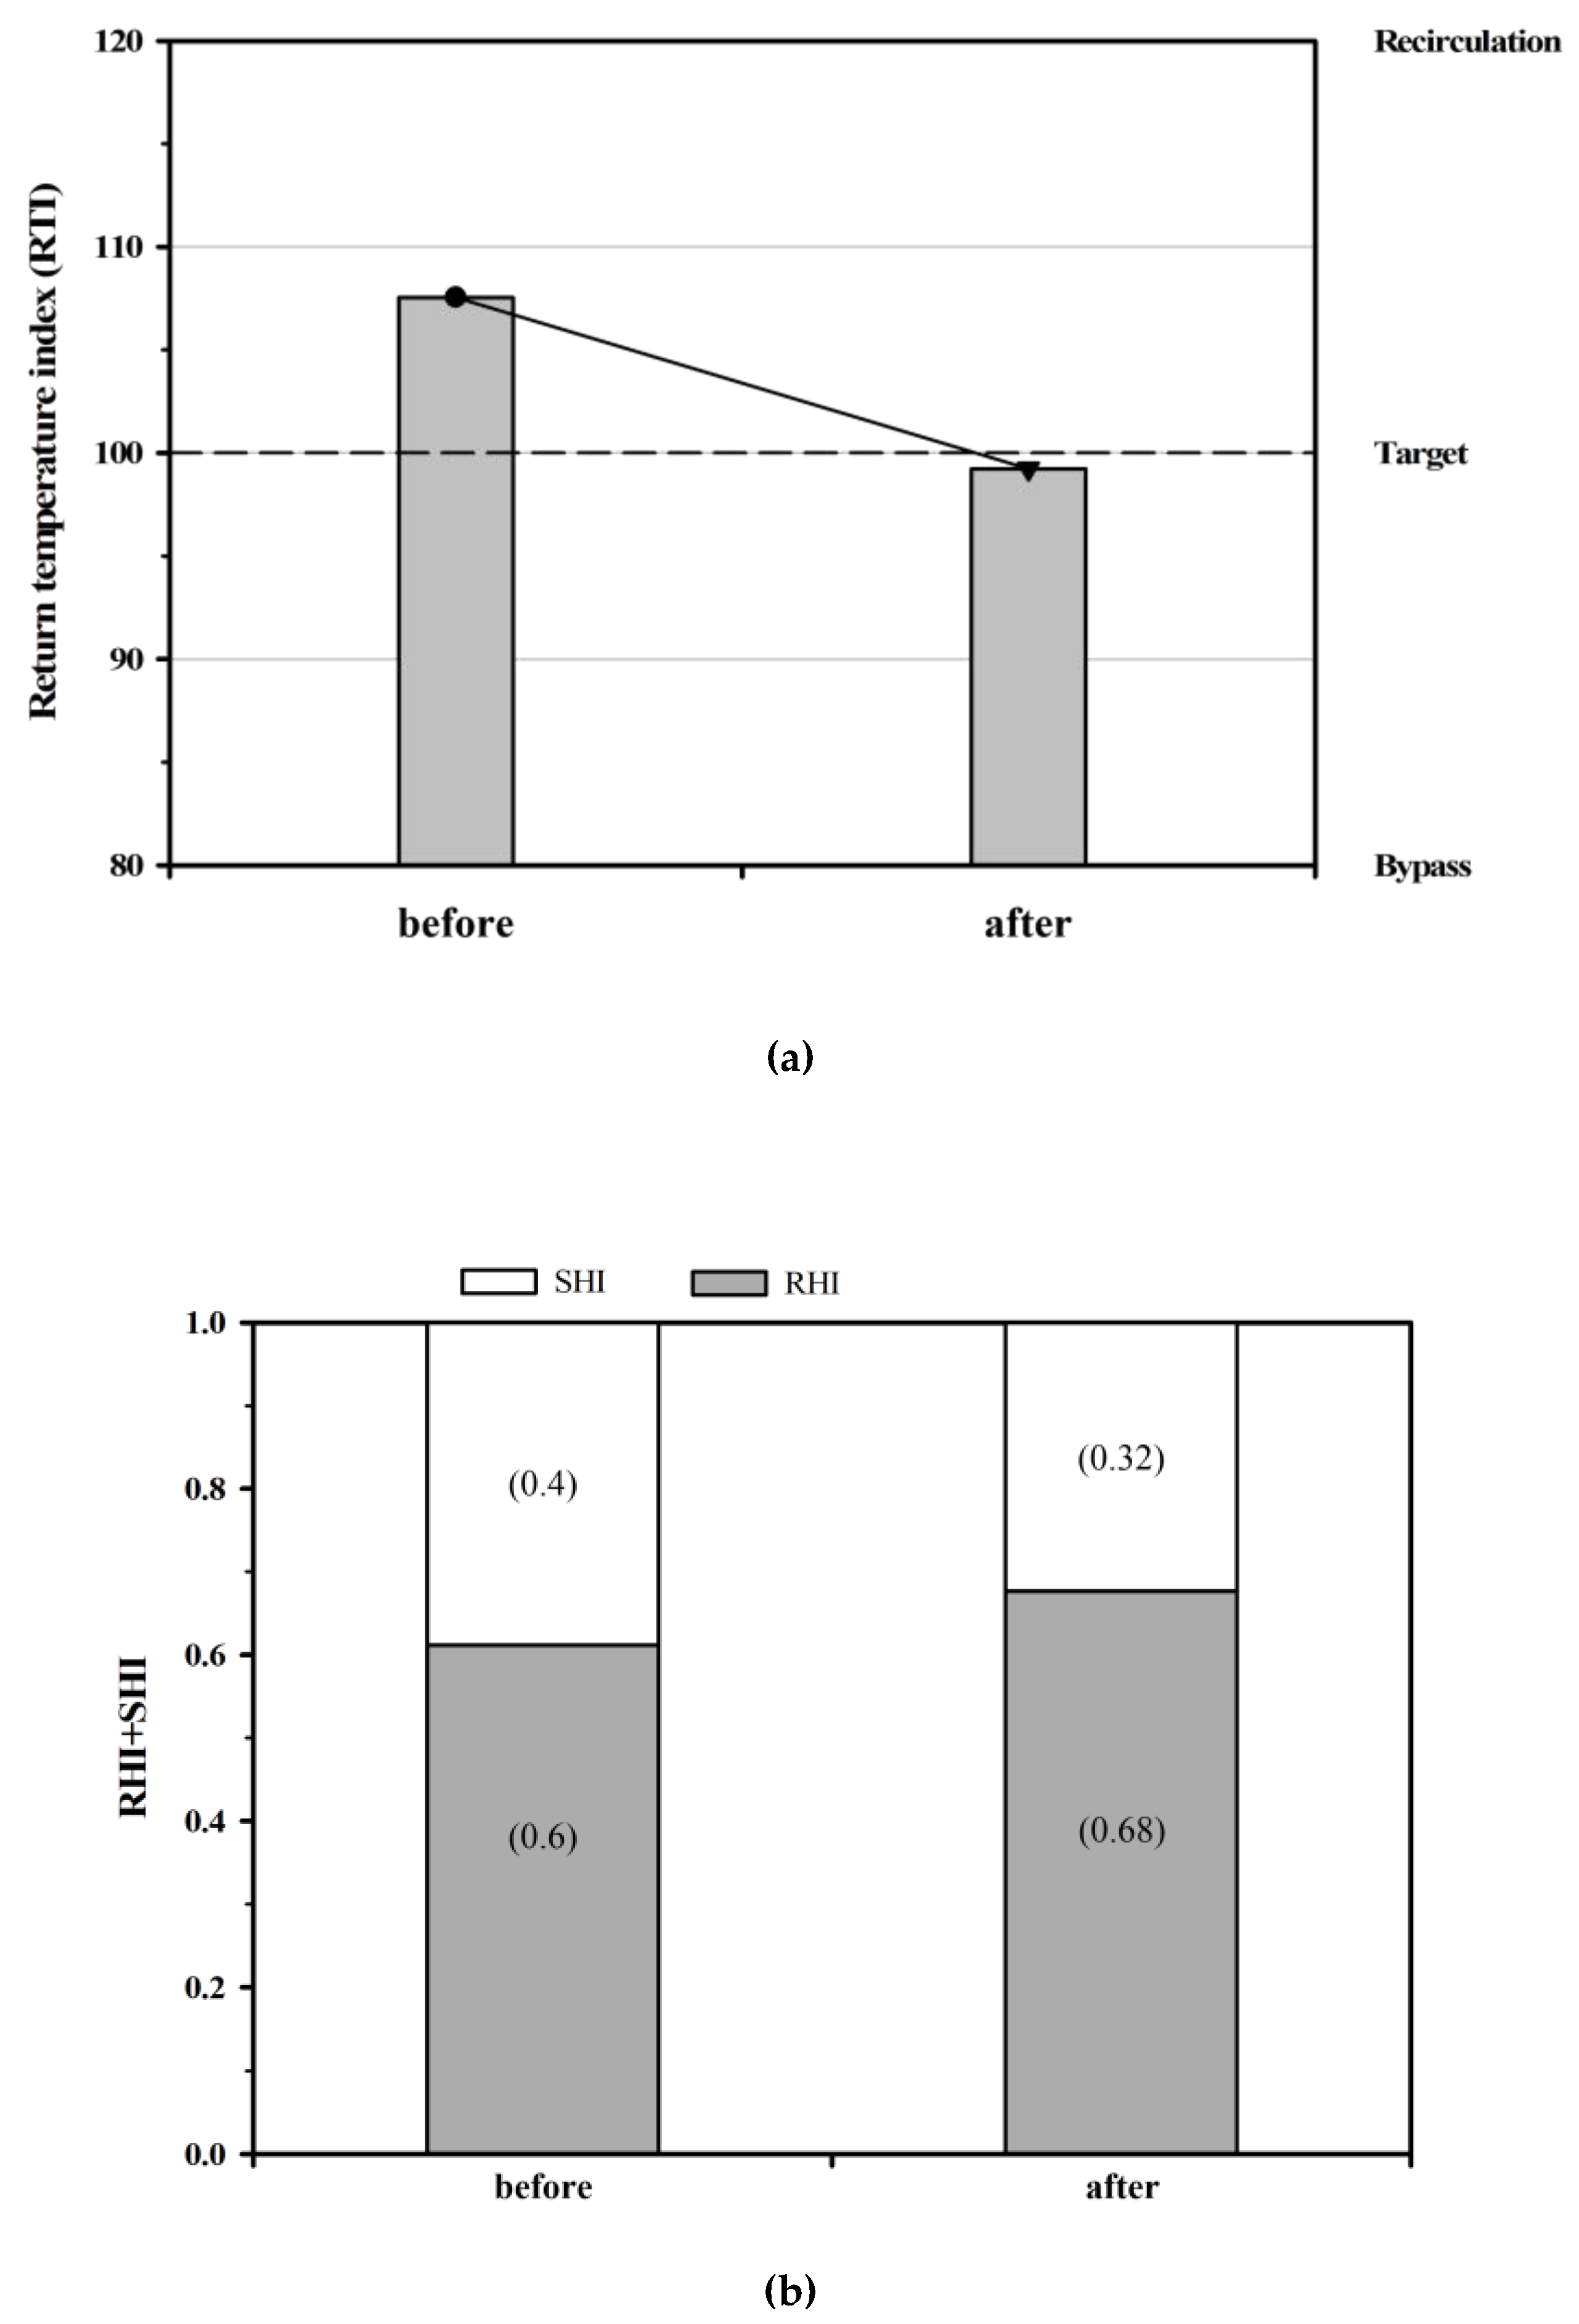
By evaluating indexes while using the physical curtain, Figure 14a demonstrates that the RTI index decreased from 107% to 99% via field measurement, which presents a 7% improvement for reducing recirculation airflow. As for the SHI index shown in Figure 14b, SHI at 0.40 was worse than the case for the simulation, but it still could be improved to 0.32 after the improvement approach due to the 8% reduction of recirculation airflow. Moreover, the RHI increased slightly from 0.6 to 0.68, which reveals the reduction of bypass airflow. Even though the indexes could be improved by using the physical curtain, the percentage of improvement was still limited. More improvement approaches should be introduced in real-case scenarios due to the complexity of data centers.
5. Conclusions
This study comprehensively presented energy-efficient improvement approaches through numerical simulations and field measurements for a data center. The conclusions can be summarized as follows:
- Various performance indexes were adopted to enhance the evaluation of the thermal performance of the data center. The return temperature index (RTI) could be improved from 105% to 102% through the CFD simulation by installing blank panels, which reveals the reduction of recirculation airflow in the data center. The return heat index (RHI) increased from 0.78 to 0.85, which presents an 8% reduction of bypass airflow.
- A practical experiment using physical air curtains was conducted to enclose the hot aisle in the data center, which reveals an RTI recirculation reduction of 7% and an RHI improvement of 8% (bypass airflow reduction).
- The integration of different approaches such as enclosing hot aisles and installing blocking panels is effective to achieve energy-efficient data centers.
Author Contributions
conceptualization, F.W. and Y.H.; methodology, Y.H.; software, Y.H.; validation, Y.H.; formal analysis, Y.H.; investigation, Y.H.; resources, F.W. and Y.H.; data curation, F.W. and Y.H.; writing—original draft preparation, B.Y.P.; writing—review and editing, F.W.and B.Y.P.; visualization, B.Y.P.; supervision, F.W.; project administration, F.W.; funding acquisition, F.W.
Funding
This research received no external funding.
Conflicts of Interest
The authors declare no conflict of interest.
References
- Cho, J.; Lim, T.; Kim, B.S. Measurements and predictions of the air distribution systems in high compute density (Internet) data centers. Energy Build. 2009, 41, 1107–1115. [Google Scholar] [CrossRef]
- Malone, C.; Belady, C.L. Optimizing data center TCO: Efficiency metrics and an infrastructure cost model. ASHRAE Trans. 2008, 114, 44–50. [Google Scholar]
- Lu, H.; Zhang, Z.; Yang, L. A review on airflow distribution and management in a data center. Energy Build. 2018, 179, 264–277. [Google Scholar] [CrossRef]
- Chu, W.X.; Wang, C.C. A review on airflow management in data centers. Appl. Energy 2019, 240, 84–119. [Google Scholar] [CrossRef]
- Zhang, K.; Zhang, Y.; Liu, J.; Niu, X. Recent advancements on thermal management and evaluation for data centers. Appl. Therm. Eng. 2108, 142, 215–231. [Google Scholar] [CrossRef]
- Gao, C.; Yu, Z.; Wu, J. Investigation of Airflow Pattern of a Typical Data Center by CFD Simulation. Energy Procedia 2015, 78, 2687–2693. [Google Scholar] [CrossRef] [Green Version]
- Rambo, J.; Nelson, G.; Joshi, Y. Airflow distribution through perforated tiles in close proximity to computer room air-conditioning units. ASHRAE Trans. 2007, 113, 1–12. [Google Scholar]
- Karki, K.C.; Patankar, S.V. Airflow distribution through perforated tiles in raised-floor data centers. Build. Environ. 2006, 41, 734–744. [Google Scholar] [CrossRef]
- Herrlin, M.K. Airflow and cooling performance of data center. ASHRAE Trans. 2008, 114, 182–187. [Google Scholar]
- Herrlin, M.K.; Khankari, K. Method for optimizing equipment cooling effectiveness and HVAC cooling costs in Telecom and data centers. ASHRAE Trans. 2008, 114, 17–21. [Google Scholar]
- ASHRAE. ASHRAE TC 9.9. Thermal Guidelines for Data Processing Environments; American Society of Heating, Refrigerating and Air-Conditioning Engineers, Inc.: Atlanta, GA, USA, 2011. [Google Scholar]
- Kant, K. Data canter evolution a tutorial on state of the art, issues, and challenges. Comput. Netw. 2009, 53, 2939–2965. [Google Scholar] [CrossRef]
- Liu, Y.; Yang, X.; Li, J.; Zhao, X. Energy savings of hybrid dew-point evaporative cooler and micro-channel separated heat pipe cooling systems for computer data centers. Energy 2018, 163, 629–640. [Google Scholar] [CrossRef] [Green Version]
- Sorell, V. OA Economizers for data centers. ASHRAE J. 2007, 49, 32–37. [Google Scholar]
- Sullivan, R.F. Some worst case practices in data centers. ASHRAE Trans. 2008, 114, 3–7. [Google Scholar]
- Khattar, M.K. Data center retrofit heat containment and airflow management. ASHRAE J. 2010, 52, 40–49. [Google Scholar]
- Tozer, R.; Salim, M. Data center air management metrics-practical approach. In Proceedings of the 12th IEEE Intersociety Conference on Thermal and Thermomechanical Phenomena in Electronic Systems, Las Vegas, NV, USA, 2–5 June 2010. [Google Scholar]
- ANSYS. ANSYS Fluent User’s Guide; ANSYS, Inc.: Canonsburg, PA, USA, 2013. [Google Scholar]
Figure 1.
Layout plan and schematic diagram of the investigated data center: (a) layout plan; (b) schematic diagram.
Figure 1.
Layout plan and schematic diagram of the investigated data center: (a) layout plan; (b) schematic diagram.

Figure 2.
Rack plan arrangement and heat generation of the data center: (a) rack plan and sampling test points; (b) rack heat generation.
Figure 2.
Rack plan arrangement and heat generation of the data center: (a) rack plan and sampling test points; (b) rack heat generation.

Figure 3.
Rack plan and geometric model for simulation of the data center: (a) rack plan; (b) three-dimensional (3D) geometric model.
Figure 3.
Rack plan and geometric model for simulation of the data center: (a) rack plan; (b) three-dimensional (3D) geometric model.

Figure 4.
Layout plan of supply and return air arrangement of the data center: (a) supply air perforated plates; (b) return air grilles.
Figure 4.
Layout plan of supply and return air arrangement of the data center: (a) supply air perforated plates; (b) return air grilles.

Figure 5.
Schematic diagram and sampling points for field tests.

Figure 6.
Temperature distribution of installation verification field tests: (a) temperature distribution for audit tests; (b) temperature distribution for installation verification tests; (c) infrared thermograph image of cold aisle B.
Figure 6.
Temperature distribution of installation verification field tests: (a) temperature distribution for audit tests; (b) temperature distribution for installation verification tests; (c) infrared thermograph image of cold aisle B.

Figure 7.
Temperature distribution along Y-axis.

Figure 8.
Comparison of computational fluid dynamics (CFD) simulation and field measurement.

Figure 9.
Temperature trajectory after using blockers on both sides of hot aisles: (a) before; (b) after.
Figure 9.
Temperature trajectory after using blockers on both sides of hot aisles: (a) before; (b) after.

Figure 10.
Simulation of different improvement approaches: (a) enclosing the hot aisle; (b) installation of blank blocking panels.
Figure 10.
Simulation of different improvement approaches: (a) enclosing the hot aisle; (b) installation of blank blocking panels.

Figure 11.
Improvement evaluation by return temperature index (RTI), supply heat index (SHI), and return heat index (RHI): (a) RTI index; (b) SHI–RHI index.
Figure 11.
Improvement evaluation by return temperature index (RTI), supply heat index (SHI), and return heat index (RHI): (a) RTI index; (b) SHI–RHI index.

Figure 12.
Temperature distribution for using a physical curtain: (a) snapshot of the curtain; (b) Temperature distribution; (c) Temperature and humidity variation.
Figure 12.
Temperature distribution for using a physical curtain: (a) snapshot of the curtain; (b) Temperature distribution; (c) Temperature and humidity variation.

Figure 13.
Maximum temperature variation after using a physical curtain: (a) Maximum rack intake temperature; (b) Intake and exhaust temperature of rack no.4.
Figure 13.
Maximum temperature variation after using a physical curtain: (a) Maximum rack intake temperature; (b) Intake and exhaust temperature of rack no.4.

Figure 14.
Performance index improvement for using a physical curtain: (a) RTI index; (b) SHI-RHI index.
Figure 14.
Performance index improvement for using a physical curtain: (a) RTI index; (b) SHI-RHI index.


Table 1.
Simulation set-up. SIMPLE—Semi-Implicit Method for Pressure-Linked Equation.
| Simulation Method | Boundary Conditions |
|---|---|
| Steady state | Inlet: Velocity inlet Velocity: 0.72 m/s Temperature: 291 K Outlet: Outflow Heat: Radiator Heat flux: based on field measurement data Wall: Wall Type: Stationary, no slip wall Temperature: 298 K |
| Simulation Models | |
| Energy equation Standard k–ɛ, standard wall function | |
| Solution Method | |
| SIMPLE |
Table 2.
Apparatus for field measurements. RH—relative humidity.
| Apparatus Model | Probe | Operative Range | Accuracy |
|---|---|---|---|
| TSI-9565-P | Hot-wired anemometer | 0–50 (m/s) | 3% |
| TSI PH731 | Array anemometer | 42–4250 (m³/h) | 3% |
| YOKOGAWA-MV100 | PT-100 and humidity sensor | 0–100 (°C), 0–100 (% RH) | 0.2 °C 2% RH |
| FLIR-17 | Infrared thermograph | −20–250 (°C) | 2% |
© 2019 by the authors. Licensee MDPI, Basel, Switzerland. This article is an open access article distributed under the terms and conditions of the Creative Commons Attribution (CC BY) license (http://creativecommons.org/licenses/by/4.0/).
Share and Cite
MDPI and ACS Style
Wang, F.; Huang, Y.; Prasetyo, B. Energy-Efficient Improvement Approaches through Numerical Simulation and Field Measurement for a Data Center. Energies 2019, 12, 2757. https://doi.org/10.3390/en12142757
AMA Style
Wang F, Huang Y, Prasetyo B. Energy-Efficient Improvement Approaches through Numerical Simulation and Field Measurement for a Data Center. Energies. 2019; 12(14):2757. https://doi.org/10.3390/en12142757
Chicago/Turabian StyleWang, Fujen, Yishun Huang, and BowoYuli Prasetyo. 2019. "Energy-Efficient Improvement Approaches through Numerical Simulation and Field Measurement for a Data Center" Energies 12, no. 14: 2757. https://doi.org/10.3390/en12142757
Note that from the first issue of 2016, this journal uses article numbers instead of page numbers. See further details here.