Economic-Engineering Modelling of the Buildings Sector to Study the Transition towards Deep Decarbonisation in the EU

1
Researcher in E3MLab, National Technical University of Athens, 15773 Athens, Greece
2
School of Electrical and Computer Engineering, National Technical University of Athens, 15780 Athens, Greece
*
Author to whom correspondence should be addressed.
Energies 2019, 12(14), 2745; https://doi.org/10.3390/en12142745
Submission received: 17 June 2019
/
Revised: 8 July 2019
/
Accepted: 16 July 2019
/
Published: 17 July 2019
(This article belongs to the Special Issue Climate Changes and Energy Markets)
Abstract
:The paper presents a newly developed economic-engineering model of the buildings sector and its implementation for all the European Union (EU) Member States (MS), designed to study in detail ambitious energy efficiency strategies and policies, in the context of deep decarbonisation in the long term. The model has been used to support the impact assessment study that accompanied the European Commission’s communication “A Clear Planet for All”, in November 2018. The model covers all EU countries with a fine resolution of building types, and represents agent decision-making in a complex and dynamic economic-engineering mathematical framework. Emphasis is given to behaviours driving the energy renovation of buildings and the ensuing choice of equipment for heating and cooling. The model represents several market and non-market policies that can influence energy decisions in buildings and promote deep energy renovation. Moreover, the paper presents key applications for supporting policies targeting ambitious reduction of energy consumption and carbon emissions in buildings across Europe. The results illustrate that the achievement of ambitious energy-efficiency targets in the long-term heavily depends on pursuing a fast and extensive renovation of existing buildings, at annual rates between 1.21% and 1.77% for the residential sector and between 0.92% to 1.35% for the services sector. In both cases, the renovation rates are far higher past trends. Strong policies aimed at removing non-market barriers are deemed necessary. Electrification constitutes a reasonable choice for deeply renovated buildings and, as a result, almost 50% of households chooses electric heating over gas heating in the long term. However, heat pumps need to exploit further their learning potential to be economical and implementable for the various climatic conditions in Europe. The results also show that the cost impacts are modest even if renovation and decarbonisation in buildings develop ambitiously in the EU. The reduced energy bills due to energy savings can almost offset the increasing capital expenditures. Fundraising difficulties and the cost of capital are, however, of concern.
1. Introduction
As one of the signing parties in the Paris agreement, the European Union (EU) has undertaken the commitment to pursue best efforts in order to limit the global average temperature rise to 1.5 °C. Consequently, the energy system should become carbon-neutral by mid-century while all sectors undergo substantial transformations to achieve strong energy savings and switch to low-carbon technologies and fuels. The main pillars of this transformation are energy efficiency, electrification of end-uses and decarbonisation of power generation through a wide penetration of variable renewables.
According to the priorities of the EU’s ambitious “Clean Energy for All Europeans” policy package (announced by the European Commission in November 2016 and transcribed into legislation, after revisions, in the following years), the EU aims to achieve specific energy and climate targets by 2030. The 2030 targets include at least 40% greenhouse gas (GHG) emissions reduction compared to 1990; at least 32% renewable energy share in final energy consumption and at least 32.5% reduction in both primary and final energy consumption compared to the (2030 projections established in) the 2007 baseline. The European Commission also published in November 2018 along-term decarbonisation strategy for 2050 entitled “A Clear Planet for All”. Both policies include energy efficiency as a major pillar and define specific targets for energy savings. The impact assessment studies, accompanying the European Commission’s communications, identified that the buildings have highest potential of energy savings among the energy consumption sectors.
The present paper presents the newly developed PRIMES-BuiMo (PRIMES Buildings model, PRIMES standing for Price-Induced Market Equilibrium System), a hybrid economic-engineering model founded on microeconomic theory, built to represent behaviours of consumers, with embedded engineering constraints. The model combines discrete choice theory with dynamic programming to represent the evolution of the buildings stock and the energy-using equipment and appliances. It also represents various policy instruments, as well as their effects on decisions. Emphasis was given to the modelling of renovation decisions as the high inertia of building stock (low demolition and new construction rates) implies that renovating the building shells is key for achieving deep energy efficiency. The model represents renovation decisions simultaneously with the choice of type of equipment in the various energy uses in buildings and the fuel mix. The model has been implemented to each EU Member State (MS) using a very large segmentation of the building types.
The paper illustrates the use of the model in the assessment of policies for the buildings sector through the comparison of several decarbonisation scenarios quantified for all EU countries up to 2050. The numerical implementation of the model benefitted from an extensive consultation with stakeholders in 2018 regarding the technical-economic data for buildings’ renovation possibilities and energy using equipment for various technologies. The scenario quantification results of the model have been extensively reviewed by policy-makers in the European Commission in the context of the impact assessment studies for the “A Clear Planet for All” communication in 2018.
2. Approach
2.1. Rationale
The buildings sector is the highest energy consumer in the EU, accounting for 38TWh or 41.07% of the total final energy consumption in 2017, according to Eurostat [1]; the largest part of the energy consumed in buildings is used for space heating and cooling alone [2]. Energy demand for space heating and cooling depends on the insulation level of the building shell and the efficiency rate of the equipment used. Thus, the improvement of the energy performance of the building shell, along with the uptake of efficient equipment for heating and cooling (H&C), constitute the most important drivers in reducing energy demand in buildings [3].
According to the Energy Performance of Buildings Directive (EPBD) of the EU [4], all new EU buildings will have to be Nearly Zero-Energy Buildings (NZEBs) from 2021 onwards, that is, high energy performance buildings covering their (low) energy consumption by primarily using renewable energy sources [5]. To that end, the MS have already put in legislation specific requirements for the new buildings’ shell performance, which are part of the building codes [6]. However, although regulatory mechanisms are currently in place, the enforcement practices do not ensure full compliance with the building codes in some MS [7].
While energy performance of new buildings can be high, demolition and new construction rates are low in the EU according to the literature [8,9]. New constructions are likely to represent a small fraction of the buildings stock in 2050 and buildings that are 50 years old represent the largest share of the total stock. Consequently, the key to improving energy performance in the buildings sector lies in the renovation pace of old buildings. The potential to achieve high energy savings through deep renovation is enormous, as the majority of the buildings were built before energy performance standards even existed.
The eco-design and the energy labelling directive [10] cover most of the energy using appliances in the domestic sector, aiming to improve their performance by setting minimum energy efficiency requirements as technology standards. In recent years, the energy efficiency improvement of specific electric appliances and lighting has been impressive. Nonetheless, further energy efficiency potential is possible [11,12].
As far as fuel mix is concerned, the buildings sector mainly uses fossil fuels (primarily distributed gas) for heating, as well as electricity for cooling and a mix of fuels for cooking and water heating. According to Eurostat’s Energy Balances [1] for 2017, 46.93% of total final energy consumption in buildings is covered by fossil fuels, namely solids, oil and gas. Renewables comprise solar energy for water heating and biomass. District heating has unequal coverage among the MS, depending on infrastructure, which is available mostly in Eastern European countries. Reducing GHG directly emitted in the buildings sector can rely on fuel switching towards electricity, distributed heat and renewables. It would also be possible to continue using gas if methane is carbon-neutral in the future. Heat pumps can enable the electrification of heating with high energy efficiency [12]. However, they may need a backup fuel in cold climatic conditions.
The EU policy adopted energy efficiency in buildings as an autonomous target, not only to induce carbon emissions reduction. The reason is that energy efficiency is a cost-effective solution per se, and at the same time, reduction of final energy consumption can allow energy supply to decarbonise easily by optimising the development of carbon-free resources that have limited potential. Energy efficiency policies induce a reduction of GHG emissions because of energy savings but do not necessarily incentivise fuel switching. Nonetheless, engineering analysis suggests that heat pumps may be the most appropriate solution for deeply efficient building shells. Thus, electrification may accompany energy efficiency progress. Developing the use of renewables beyond the traditional use of biomass also requires oriented policies, which at the moment are not in place in many of the EU MS. The potential of renewables (i.e., solar thermal, geothermal, biomass and waste energy) depends on regional resources, and their use is rather costly. District heating and cooling is a valid alternative, but it depends on the existence of distribution infrastructure, which is hardly expanding in the EU MS for various reasons. Engineering analysis confirm that the deep energy insulation of buildings ultimately pays-off and that is due to its large potential, it deserves the highest priority in policy-making. Paradoxically, however, the willingness of consumers to undertake buildings renovation work is poor and inefficiently incentivised by existing policies. Numerous studies have identified non-market barriers as the causes of the paradox and suggest adopting policies aiming to remove the barriers [13,14,15].
Most studies agree that economic rationality would advise towards undertaking “deep” energy renovation in most buildings when economic calculation uses pure engineering considerations. However, economic literature [16,17] suggests that investment reluctance could be attributed to high subjective discount rates reflecting a multitude of factors, including uncertainty, lack of funding and information. Not proceeding with energy efficiency investments, despite the engineering perception of cost-effectiveness, leads to an “energy efficiency gap” or an “energy paradox”, as stated in the literature.
The low uptake of efficiency investments in the buildings sector may be interpreted as a seemingly irrational behaviour of consumers. The approach of the modelling in this paper is to postulate rational behaviours, as in standard microeconomic theory, but introduce barriers, depending on the individual’s specific attributes, and thus reproduce the paradoxical choices. The consideration of barriers is neglected in pure engineering calculations. A granular disaggregation of building and consumer types is followed in the model to capture the consumer and buildings attributes in detail and at the same time assess distributional effects of energy-efficiency policies, to allow policy addressing them effectively.
Barriers can be divided into market and non-market barriers [14], with market barriers being related to “true” costs (which consumers actually pay), termed hidden up-front investment costs and factors related to the accessibility to capital resources. Non-market barriers refer to elements which do not have a direct payable or “true” cost. The model, however, monetises non-market barriers as “perceived costs” and by raising risk premium factors, as others also did in the literature [15]. The non-market barriers can be broadly categorised in three groups: (a) (lack of) information and knowledge, (b) uncertainty about economic and technical performance, and (c) poor access to funding and limited cash flow by individuals (e.g., high opportunity cost of equity and debt).
Even within a group of consumers with similar attributes, the individuals do not have homogeneous preferences when deciding on efficiency and heating investment, but they rather exhibit idiosyncratic behaviours. Also, the engineering peculiarities of the building stock regarding age, technical constraints and geographical location vary to such an extent that the technical and costing circumstances differ even within groups of buildings with similar attributes.
Consequently, modelling economic-engineering decision-making to project the energy demand in the buildings sector into the future is a complex endeavour the main difficulties being behaviours and variety. It is difficult to capture behavioural factors in the modelling because of the large variety of idiosyncratic behaviours and decision circumstances. Despite relying on statistical evidence, econometric modelling fails to incorporate the complex engineering constraints and possibilities of building renovation.
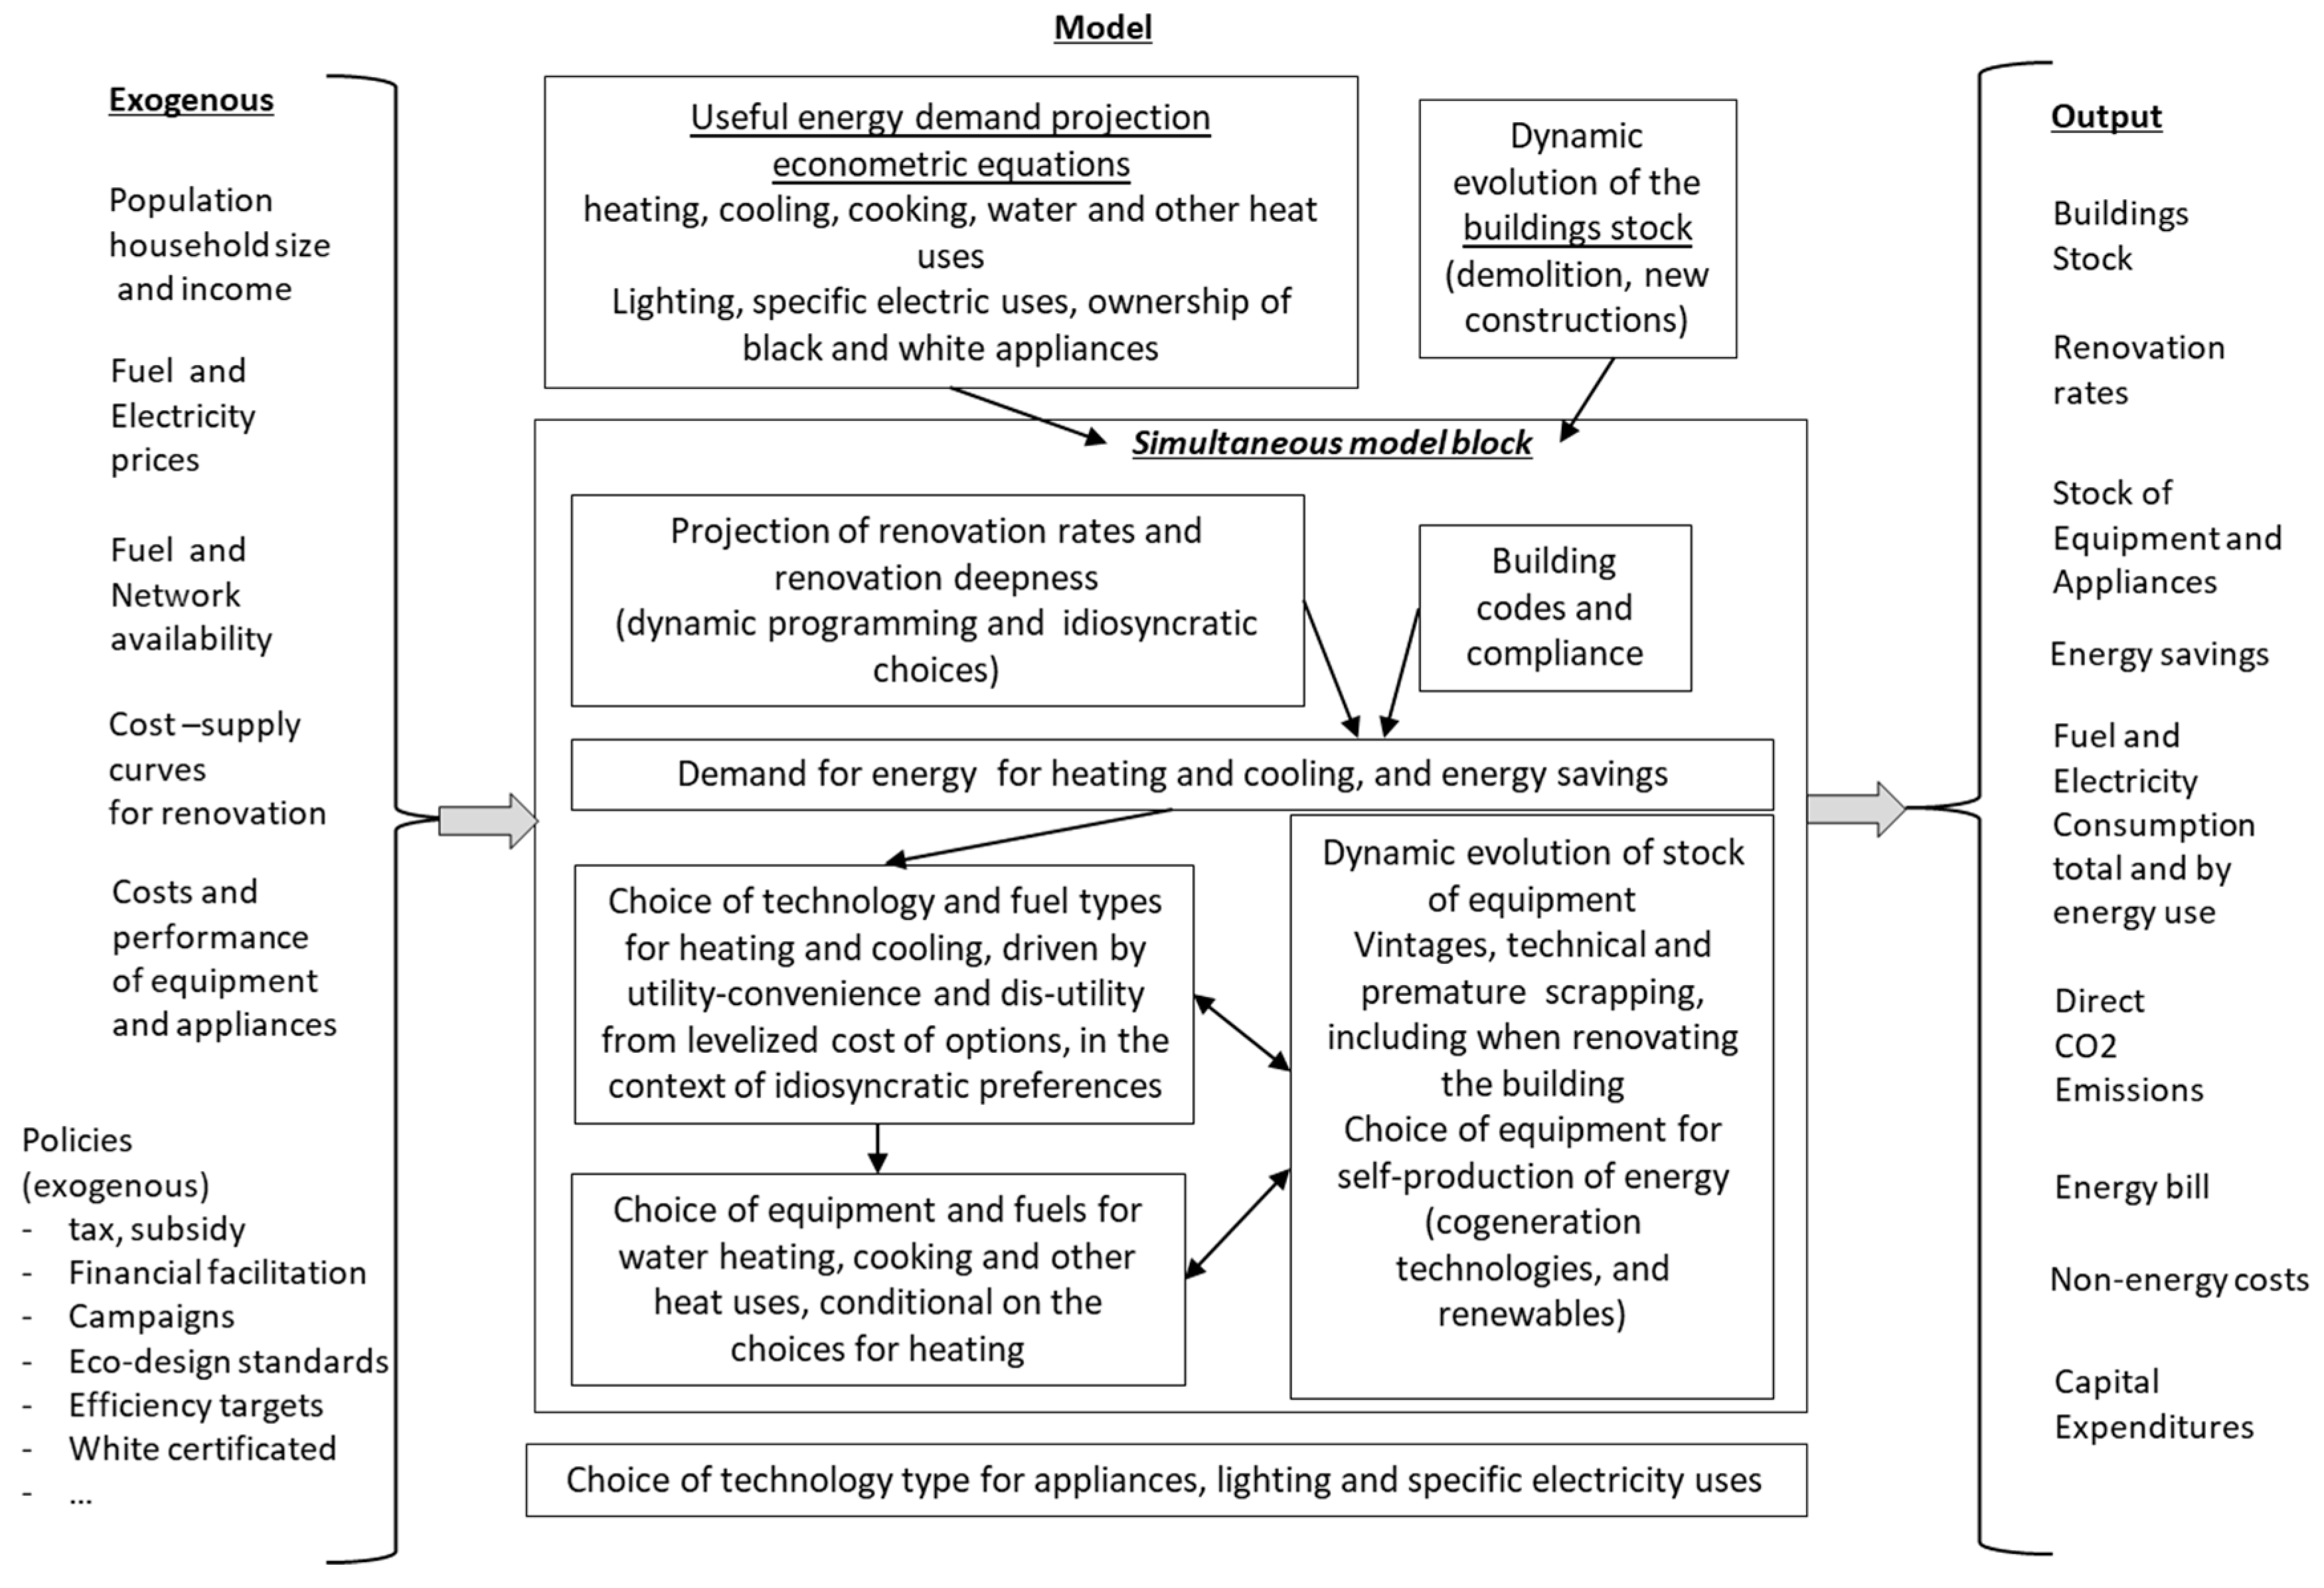
PRIMES-BuiMo opts for a hybrid economic-engineering approach, covering the dynamics of stock evolution and placing great emphasis on modelling behaviours, as well as on policies influencing behaviours (see Figure 1). Hence, the model represents idiosyncratic behaviours and (non-) market barriers, while also providing a high-resolution disaggregation of the building stock. Furthermore, it classifies the building stock in many different categories (termed “building classes”) based on house/building type, geographic location, age of construction, income class or services sub-sector. Thereby, the model projects into the future energy demand, using a dynamic simulation of the renovation of the buildings’ shell, together with the choice of technology and fuel types for the different uses of energy.
Following [18] the mathematical models for energy in buildings can be classified in a) top-down approaches, b) bottom-up (accounting) approaches, c) approaches based on building physics, d) statistical models, and e) hybrid models. The top-down models investigate the inter-relationships of energy demand in buildings and the economy at large and are aggregate approaches [19]. The categorisation of energy models into bottom-up, top-down and hybrid is established in the literature reviewing modelling, [20].
The bottom-up methods apply a fine segmentation of buildings in categories, calculate an engineering-based cost optimisation on a single representative building type per category to derive energy demand and energy savings, and finally multiply the results by the number of similar buildings in the same category to calculate totals, [21,22,23]. The approaches based on physics also consider individual typical buildings and apply engineering calculations [24]. In contrast, the statistical approaches are aggregate, usually reduced-form, models on which regression methods estimate parameters statistically, [25,26,27,28,29]. These models cannot handle assessment of restructuring policies directly. The literature of statistical aggregated models of energy demand in buildings is vast and its review is out of the scope of the present paper.
Hybrid models are the largest and more complex of the modelling techniques classified in the paper, and are the only ones that combine economic, behavioural and engineering approaches. The hybrid models formulate the decisions as derived from utility and cost optimisation, subject to constraints part of which represent engineering aspects. The presence of utility functions allows for the incorporation of preferences and other parameters capturing behaviours and imperfections. The hybrid approaches usually calculate the frequency of choices at different levels based on distribution functions, which reflect the discrete choice theory, [30]. Historically, some of the largest energy models applied to the buildings sector following the physical bottom-up approach are among others Building Research Establishment Housing Model for Energy Studies (BREHOMES) [31], Building Research Establishment Domestic Energy Model (BREDEM) [32], Domestic Energy and Carbon Model (DeCARB) [33], and National Nondomestic Buildings Energy and Emissions Model (N-DEEM) [34]. There exist several other physical bottom-up modelling approaches developed recently to support the EU policy for the buildings sector, [35,36,37,38]. Several recent physical models are mentioned in other places in this paper, as our modelling has drawn on data and some engineering functions developed for these models. Modèle d’Evolution de la Demande d’Energie (MEDEE) [39], Model for Analysis of Energy Demand (MAED) [40] and the demand sub-models of Long-range Energy Alternatives Planning System (LEAP) [41] are examples of bottom-up accounting models, lacking representation of price-driven substitutions and economic or behavioural choices.
Our model, PRIMES-BuiMo is in the category of hybrid economic-engineering models. Due to the complexity of the mathematical problem and the data intensiveness, hybrid models of full-scale are very rare in the literature. Examples are the Canadian Hybrid Residential End-Use Energy and Emission model (CHREM) [42,43,44], the residential and services sector sub-models of the National Energy System Model (NEMS) [45] and the Canadian Integrated Modelling System (CIMS) model in Canada, [46,47]. Several model applications for the buildings sector have been performed using linear programming models that cover the entire energy system and represent energy equipment choices as part of the overall optimisation. Examples are MARKet and Allocation (MARKAL), The Integrated MARKAL-EFOM (Energy Flow Optimization Model) System (TIMES) and several others [48,49]. The linear programming approaches do not model idiosyncratic behaviours, based on the discrete choice theory, and non-linear cost-potential relations, as in the hybrid models mentioned in the beginning of this paragraph. This is a major drawback of the linear programming modelling approach.
Regarding the modelling of buildings renovation, the literature according to [50] can be divided in two main streams: (a) the models that evaluate technical options of renovation economically mainly based on present value calculations combined with physical modelling of buildings and (b) behavioural models that capture homeowners’ decision making for renovation. The literature on modelling renovation is expanding [51,52,53,54] but it lacks comprehensive modelling of renovation of buildings for the purpose of projections for the entire stock and for assessing policy measures. The PRIMES-BuiMo has the ambition to cover this gap in the literature, as it incorporates a fully-fledged economic-engineering model of renovation decisions within the energy model. Also, the application of the model for many countries with very fine segmentation of buildings is also novel in the literature of modelling renovation decisions. Other large-scale models, such as NEMS, CIMS, CHREM and TIMES, that we mentioned above, do not include endogenous economic modelling of renovation of buildings, and instead use simple accounting equations based on exogenous parameters. A further novelty of PRIMES-BuiMo is the combination of discrete choice theory with dynamic programming in the modelling of renovation decisions; such a mathematical formulation cannot be found in the literature according to our knowledge.
A vast literature deals with non-market barriers and subjective factors (including subjective discount rates), which hinder energy efficiency investment, [55]. The present modelling approach has drawn on this literature extensively, regarding the conceptual framework and numerical data that have been estimated statistically (the references are included in the corresponding sections of the paper). To our knowledge, however, there exist no full-scale model that incorporates the non-market barriers and their removal thanks to policies in a systematic manner. PRIMES-BuiMo is a novel modelling approach to this respect.
Finally, PRIMES-BuiMo is by far the largest model ever built for the buildings sector of the EUMS, as it uses a fine segmentation of the building stock and the agents acting as decision-makers. The model builds on this fine segmentation to represent idiosyncratic behaviours and the influence of subjective factors and imperfections, which are considered as non-market barriers. Thanks to the segmentation and the explicit modelling of behaviours, PRIMES-BuiMo is able to assess individual policy measures of market and non-market nature, a feature which is very important for policymaking as the distributional effects are of great policy significance.
2.2. The Mathematical Framework
Decision-making for energy-related investment in the buildings sector includes: demolition and construction of new buildings, renovation of the building’s shell, purchasing of new energy-using equipment and appliances (e.g., washing machines, lighting and many others) and scrappage of old equipment and appliances, including possible premature replacement of equipment. The consumer considers different time horizons for these investment decisions; renovation has a long lifetime, but lighting equipment may last for only a few years. Also, there is an inherent hierarchy among the investment decisions; renovation of a building is prior to the choice of heating system, and this, in turn, influences the choice of a water heating system.
For every investment decision, the decision-maker is invited to choose among various technologies, which may, in turn, vary in terms of capital costs and energy consumption (or energy savings) performance. Capital costs are generally higher when energy efficiency increases. The eco-design policy framework, which is part of the formulation, bans certain technologies based on poor energy efficiency and promotes the most efficient ones via the labelling system, which generally induces lower technical risks.
The equipment using energy also differ according to the type of fuel they use; the model spans a wide variety of options, including liquid fuels (notably diesel oil), liquefied petroleum gas (LPG), distributed gas (with different possible blends of natural gas, hydrogen, biogas and synthetic e-gas), electricity, distributed heat, biomass (wood, pellets and waste), solar and geothermal energy. The availability of a fuel type depends on the distribution infrastructure. The various building categories, belonging to different geographic areas, have differentiated access to fuel distribution infrastructure.
Investment decisions also rely on the interdependence between the deepness of a building’s energy insulation and the choice of heating equipment and fuel. A highly insulated building has low energy consumption, and in the case of passive buildings, it may only occasionally use energy for heating or cooling. The power size and the rate of use are important factors for the economics of the candidate heating systems, and thus the thermal performance of a building influences the rational choice of heating equipment. Oversized equipment for a highly insulated building is less cost-effective compared to other types of appropriate size, even if the unit cost of purchasing is higher for the latter than for the former. For example, an electric heat pump would be more suitable for a well-insulated house rather than a boiler, which would inevitably be oversized. The choice also depends on the power sizes available in the market, as well as the flexibility of its use. The model captures this complexity by considering the entire typical building, including the thermal performance of the shell, for the calculation of the technical size of the candidate heating and cooling systems and the evaluation of the economic performance of equipment and fuel types. An assessment per sqm and not per building would be unable to capture the influence of power sizes and the thermal performance of buildings on the choice of heating equipment. The model includes the possibility of revising the choice of equipment and fuel for heating and cooling after a deep renovation of the building, even if the previously installed heating equipment has not reached the end of their lifetime.
In reality, decisions regarding equipment and fuel types are nested choices. The choice of heating equipment and fuel type reasonably takes place prior to the choice of water heating and cooking system. The decision hierarchy is due to the high cost of installation and operation of heating compared to the cost of other heat uses. The model reflects the nested choices as a tree of interdependent choices. Not all combinations of choices are fully compatible with each other, and the model applies penalty factors to unusual combinations, as such cases involve additional or hidden costs also in reality. The compatibility of choices differs between various building categories, especially concerning the geographical area, the size of the building, the availability of energy supply infrastructure, and others.
It is well known that the models based on engineering-economic optimisation suffer from the representative-agent hypothesis. Even if the building and agent characteristics are highly segmented, as far as data availability allows, the limitations arising from the representative-agent hypothesis are still valid. In reality, the individual decision-maker makes only discrete choices. Models producing a single discrete choice for each class of building, based on the representative-agent hypothesis oversimplify and are unacceptable, even if the segmentation of building classes is very fine.
An approach based on discrete choice theory, as described in [56], is more appropriate for addressing the representative-agent hypothesis. Discrete choice theory postulates that the frequencies of candidate choices in the population within a segment of buildings follow a given probability distribution function and thus discrete variables transform into continuous ones. The frequencies of candidate choices derive from a comparison of their performance according to a cost or utility function, which is the same as that the individuals use to derive their discrete choice. The cost of utility comparisons may involve elasticity, maturity and risk-reflecting parameters to capture preferences and behaviours. In this way, the model represents the heterogeneity of idiosyncratic behaviours and the varying decision-making circumstances within each class of building, thus addressing the representative-agent hypothesis.
Based on the above considerations, PRIMES-BuiMo formulates nested discrete choices based on discrete choice theory and embeds said choices into a dynamic programming framework, subject to constraints representing sources with a limited potential. Mathematically, the model solves a nonlinear complementarity problem within a dynamic programming problem (see Table 1 for the nomenclature of PRIMES-BuiMo).
The first part of the model projects useful energy demand into the future, using econometric functions which relate demand for useful energy services to macroeconomic, demographic and price variables that are exogenous projections. The useful energy categories comprise space heating, cooling, water heating, cooking, lighting, black appliances and white appliances, as well as other similar categories for the services sector.
The functions (1) to (3) project useful energy into the future as follows:
Index denotes time (years) and spans the building categories, which are defined as a combination of building type categories (geographic location, age, single or multi-family) and agent classes (income classes for households and sectors for the services). The formula represents the influence of macroeconomic (income for households and gross value added for the services sector) and demographic (or number of employees for the services sector) factors denoted by the symbol and the net annual cost of the useful energy service by , which adds operating and capital costs, inclusive of investment in building insulation. A log-linear function combines these factors and influences the projection of useful energy along a logistic curve with a varying upper bound , also expressed as a function of macroeconomic growth and demographics.
In the next step, the model projects into the future the buildings stock, based on historical trends and the influence of the rate of growth of macroeconomic and demographic factors, . A dynamic econometric Equation (4) projects the annual growth rate of new buildings, for replacing demolished buildings, based on an exogenous rate of demolition , and for increasing the stock of buildings , which tends dynamically to an optimal stock at a pace . The optimal stock is a latent, non-observable variable. The transfer of population or activity between categories of buildings, denoted by , follows a logistic growth curve using an exogenous rhythm and a maximum growth limit .
At this stage, the model formulates how the decision-maker meets the useful energy requirements. The building shell covers part of the heating and cooling useful energy depending on the degree of insulation. The model applies building codes (i.e., standards for heat losses) for new constructions and considers an exogenous rate of compliance to the codes. Innovation in old buildings to improve insulation is endogenous in the model, as explained below.
The measurement of heat losses of buildings follows the EN 13790:2008 [57], which considers the U-values, external temperatures and internal thermostat settings, which is an exogenous parameter. Renovation of buildings has various purposes, but the model only considers renovation for energy savings, which derive from the thermal performance driven by investment in insulation and other interventions.
The model classifies the various possible renovation plans in a discrete set of interventions sorted (denoted by ) in ascending order of thermal performance. Investment costs are also increasing following this order. The model aims to first calculate the timing and the degree or deepness of renovation (i.e., the choice of a renovation plan) for each building category. As the amount of investment and the burden of the renovation works are considerable, it is unlikely that a particular building undergoes renovation in a stepwise manner during its lifetime.
Consequently, a decision-maker has to choose a particular dynamic strategy with specific timing and deepness of renovation among a large variety of possibilities. Strategies with stepwise renovation interventions are by construction costlier than others that deliver the same degree of renovation but invest only once or twice during the building’s lifetime. The decision-maker needs to calculate the present value of cost streams to compare alternative dynamic strategies of renovation. The costs include investment expenditures for renovation, the cost of purchasing energy after the energy savings and other operating and maintenance costs.
The approach of modelling behaviours consists of including additional cost items to represent barriers. Hidden costs include costs to avoid disturbance to neighbouring flats, reflect complicated waste removal, expenditures due to architectural restrictions, etc. Other costs account for non-market barriers (e.g., subjective cost of capital, perceived costs due to lack of information or to uncertainties regarding the energy savings performance, lack of economies of scale, and others). Additional costs may apply in relation to the specificities of the building category (e.g., related to the geographic area, single or multi-family building, and others). Subsidies may also apply directly as an investment subsidy and reduction of debt interest rates, and indirectly as a penalty on the fuel prices for the consumption remaining after the savings. The penalty factor may represent non-identified policies that promote energy efficiency in buildings or apply required energy savings. White certificate systems also act as indirect penalties on fuel costs.
The model generates a large number of dynamic renovation strategies (denoted by or ) for each building type and calculates the present value of cost streams over a long period using a discount rate that reflects the subjective cost of equity and the cost of debt, eventually including risk premium factors which differ by income class [58].
In Equation (7) represents investment expenditures for renovation, which occur sporadically and include all kinds of indirect hidden costs and subsidies, whereas represents all kinds of annual costs of heating and cooling (including all cost items mentioned above and cost penalties).
A decision-maker would select a single renovation strategy based on the minimum value of . However, the model retains a number of the most economic renovation strategies, assigns different frequencies to them, and performs the calculation for each building and consumer class. In this way, the model captures idiosyncratic behaviours and heterogeneous building characteristics. The model assumes that the frequencies of renovation strategies per building category follow a Gumbel distribution function, [59,60,61,62], from which the shares of each renovation strategy derive, as in Equation (8).
The decision about renovation precedes the choice of heating and cooling equipment, while the optimal choice depends on the thermal performance of the building shell. Also, whenever a deep renovation takes place, the model requires the revision of the choice of heating and cooling equipment, irrespective of its age.
To determine economic optimality, the model calculates costs for the entire building (and not per unit, for example per sqm) and considers discrete power sizes of candidate equipment types as available in the market. A highly insulated building will need equipment of smaller power size than a poorly insulated one.
The model uses total costs inclusive of capital and hidden costs, as well as operating costs, to select among alternative heating and cooling equipment types. The hidden and perceived costs also relate to the conditions of the building category (e.g., the conditions of fuel supply in a geographical area, among others). Also, climatic conditions influence the costs, as electric heat pumps need burning gas as a complement in cold climate areas. To compare alternatives, the model calculates the present value of cost streams of candidate strategies, , which involve the choice of a particular equipment type and the timing of investment and scrappage.
The cost stream includes capital costs and operating costs for purchasing energy and maintaining the equipment; the calculation of present value uses a discount rate distinctly defined for decision-maker classes, notably for distinguishing between income classes, as opportunity costs of cash flow differ by income class [58].
The choice also depends on technology maturity factors, , expressing uncertainty perceived by the decision-maker for not yet mature technologies. As already explained, the cost of equipment in a strategy is conditional (denoted by ) on the choice of a renovation strategy . The model then applies a discrete choice formulation to calculate the frequency of choices of dynamic strategies referring to equipment.
The choice of equipment depends in the model on nested hierarchical choices of equipment types, on technology types (varying by energy efficiency performance, hence by purchasing cost) and on fuel types to be used by the equipment. All nesting levels calculate frequencies of selected options following a discrete choice formulation, which includes the relevant costs, inclusive of hidden and perceived cost components, as well as maturity factors. The cost of fuels depends on market prices, conditions of supply prevailing for the building category (availability of infrastructure and costs of distribution) and policy options that influence costs, such as taxes, subsidies, penalty or promotion factors related to policy targets concerning renewables, among others.
Furthermore, the model formulates cost impacts stemming from resources subject to an exhaustible potential. Examples are the construction industry capacities for renovation works, the availability of certain fuels, e.g., biomass, and the distribution system capacity. The case of non-availability of a particular distribution system such as district heating or gas in a given region implies non-availability of the corresponding option in the model. The formulation of resource constraints is explicit in the model, and the dual values of the constraints add to the cost variables (with a positive sign).
The model can handle system-wide policy targets in the same way. The model outcomes (i.e., the choices) will have to have implications, measured in policy target terms, that are equal or higher to the defined target; in this way, the model can handle system-wide energy efficiency, targets for renewables and other policies. The dual values of the policy target constraints add to cost variables in the form of benefits (i.e., with a negative sign). Finally, cost variables, adjusted by the positive or negative dual values of the resource or policy constraints, influence the choice of strategies, equipment types and fuels, until reaching an equilibrium in the sense of a mixed-complementarity problem. Being a fully dynamic model, PRIMES-BuiMo keeps track of all vintages of equipment and appliances.
The formulation of equipment choice and energy consumption is much simpler for lighting and electric appliances. The model emphasises the choice of technology type, by representing distinct classes depending on energy efficiency performance based on the eco-design regulations.
2.3. The Dataset
As far as the residential sector is concerned, the dataset classifies the households into 270 building categories, defined by:
- Types of buildings: single or multi-storey buildings.
- Age of construction: nine age bands covering the period 1920–2015. Historical data on the housing regarding demolition, new constructions and renovation draw on [9].
- Geographical regions: three stylised areas, namely urban, semi-urban and rural areas.
- Income classes: five income classes based on Eurostat statistics.
In the current model version, discount rates range between 10% and 14.1% for the residential sector and are in line with the lower-end of statistically-estimated discount rates for households [17,63,64].
The model distinguishes services sector into segments and formulates them separately, as shown below:
- Trade
- Commercial buildings
- Warehouses
- Cold Storage
- Market Services
- Private offices and other buildings in market services
- Hotels and restaurants
- Non-Market Services
- Public offices
- Hospitals and health institutions
- Schools and educational buildings
The buildings stock splits into classes following the age of construction, divided into nine age bands covering the period 1920–2015. Furthermore, the building classes distinguish among ventilation techniques, notably mechanically and naturally ventilated buildings.
The database for both sectors relies on data drawn from a variety of databases, surveys and studies [65,66,67,68,69,70,71,72,73].
Regarding the engineering information for the renovation sets, the model defines eight distinct renovation packages and draws data from [74]. The lightest package includes replacement of windows, and the deepest renovation package involves the installation of a thick insulation layer to reduce air permeability levels.
The dataset includes around 50 different types of equipment for space heating, air cooling and other heat uses (see Table A1 and Table A2), as well as 11 types of electric appliances. Data availability was not enough to represent full correspondence with the eco-design segmentation of appliances. The technology categories per type of equipment are defined according to energy efficiency and range from currently available technology to Best Not Available Technology (BNAT). The data on the technical-economic characteristics of equipment technologies (efficiency rate, technical and economic lifetime, investment cost, operation and maintenance costs and other variable non-fuel costs) draw on a large number of sources, as well as on a recent study, which reports on an extensive consultation with industrial stakeholders [74]. All technologies are supposed to follow a learning-by-doing process, which is exogenous to the model, and the learning achievement can vary by scenario.
3. Illustrative Model Applications
A structural model like PRIMES-BuiMo is suitable for projections and not for forecasts, as it lacks evidence based on statistical inference. The purpose of such models is to compare projections based on different policy options and draw policy recommendations from the comparison thereof. To this end, the model firstly quantifies a Baseline scenario which includes the policies aiming at achieving the EU targets for 2030 and does not include additional policies for the period after 2030. Contrasting scenarios, also quantified, include additional policies for the period after 2030 in an aim to achieve ambitious carbon emissions reduction targets until 2050. The comparison of projections based on the model is useful, as it illustrates whether the policies for 2030 are sufficient to achieve the targets for 2050, and if not, to evaluate the cost and policy implications of additional effort needed to reach the 2050 targets.
The baseline scenario includes the following targets for 2030, as proposed by the European Commission in the “Clean Energy for All Europeans” policy package [75]: (a) at least 40% reduction in GHG emissions (from 1990 levels), (b) at least 32% share for renewable energy in gross final energy consumption and (c) at least 32.5% lower primary and final energy consumption compared to a projection performed in 2007. The policy package foresees energy efficiency improvement of buildings as one of the major pillars, and for this reason, it includes several legislative initiatives, which mainly encompass:
- The Energy Performance of Buildings Directive (Directive (EU) 2018/844), which entered into force on 9 July 2018 [76], and according to which new buildings are assumed to be nearly zero-energy buildings as of 2020.
- The amended Energy Efficiency Directive (EED) [77].
- The revised Renewable Energy Directive [78].
The directives mentioned above cover only the period until 2030 and include provisions for monitoring and enforcing energy consumption reductions in the MS. The energy efficiency improvement in the buildings sector, foreseen by the directives, is ambitious. Article 7 of the EED mandates a 1.5% reduction in final energy consumption per year, applicable as a compound rate until 2030. It is at the discretion of the MS to put in place policies promoting efficiency investment.
However, the directive provides a mandatory menu of options, which include the promotion of energy service companies, the obligation of utilities to support energy savings at the premises of the customers and financial supporting schemes with a particular focus on consumer classes with poor fund-raising possibilities. The modelling of these legal provisions is straightforward in the PRIMES-BuiMo model, thanks to the representation of a large variety of policies and the high segmentation of building and consumer categories. The modelling of the obligation to reduce energy consumption relies on a penalty factor applying to the cost of energy in buildings. An increase in the value of penalty implies additional and deeper renovation of buildings to pay-off eventually. The value of the penalty coincides with the dual variable of the constraint representing the annual energy efficiency target until 2030. At the same time, several policies prescribed in the directive induce a reduction in perceived costs and technical uncertainties, and increase access to funding. In the modelling, reducing perceived cost factors and discount rates increases the deepness and frequency of building renovation.
Based on different cost structures and possibilities, the model results may suggest different energy-efficiency efforts by building class and MS. The country-specific models run iteratively until the energy efficiency performance for the entire EU reaches the desired target. In this way, the model can suggest how to allocate the energy efficiency effort to the MS optimally and respectfully of the specific potential and possibilities of the MS. To capture eventually limited capacity of the construction industry and avoid concentration of renovation investment in a short period, for example close to 2030, the model represents a feedback from the dual variable of the construction industry capacity potential to the cost of renovation, hence to the choice of timing of renovation within the candidate renovation strategies. In this manner, the model projects an escalation of renovation investment over time. The resulting renovation rates are, as expected, significantly above historical rates, but not excessively high yearly, thanks to the feedback of the construction industry capacity.
Energy efficiency improvement does not rely on renovation solely but also derives from the market uptake of advanced equipment and appliances. The modelling accommodates the provisions of the eco-design directive by raising penalty factors, discouraging adoption of non-compliant technology varieties and reducing perceived cost factors applied on advanced technology varieties. Electric heat pumps are among the preferred technology options. Consumers increasingly adopt heat pumps for heating and cooling following the growing trend of building renovation, while the magnification of the heat pump market induces cost and performance improvements. Thus, electrification develops, while energy efficiency improves.
Despite the ambitious development of energy efficiency in buildings until 2030, the projections based on the model show that the policies until 2030 are not in themselves sufficient to enhance the energy efficiency improvement post-2030, as needed to reach the ambitious emission reduction targets for 2050. The efficiency policies put in place until 2030 have long-lasting effects in the period after 2030, but the implied energy savings are not enough as the targets are also more ambitious for 2050 than for 2030.
Table 2 shows that the strong pace of renovation and energy savings until 2030 slows down considerably after 2030. However, the electrification trend continues without any disruptions and produces a relatively small slowdown of direct emission reduction post-2030.
The design of the alternative policy scenarios focuses on the period 2030–2050 and aim to achieve GHG emissions reduction above 80% by 2050 compared to emissions in the EU in 1990. The European Commission communicated in November 2018 a long-term strategy for the period 2030-2050 and compared various scenarios achieving the emission targets by 2050, see [75]. The strategy foresees, in all scenarios, a significant contribution of the buildings sector to the overall emissions reduction. The energy efficiency improvement is a major pillar of the strategy and an autonomous policy objective, as in the policy package until 2030. The reduction of energy consumption is a cost-effective way of reducing emissions and, via a rational use of electricity and fuels, it facilitates the energy supply sectors to address the risk of a shortage of low carbon resource possibilities. The power sector, in all scenarios of the strategy, achieves zero-carbon intensity by developing renewables, and in particular solar and wind, as other options, such as nuclear and carbon capture and storage (CCS), have limited potentials for several reasons. Also, electricity becomes the carrier of preference to reduce emissions in otherwise inflexible sectors, such as mobility and heat, and in some of the scenarios serves as a feedstock to the production of carbon-neutral hydrogen and hydrocarbons. Without strong energy efficiency improvement, electricity demand would increase excessively challenging the development of renewables and the balancing of stochastic variability.
The modelling analysis of the long-term strategy, based on the PRIMES model [75], quantified several scenarios for the EU until 2050 and used the PRIMES-BuiMo model for the buildings sector. The paper includes three of the scenarios of the strategy, which follow different assumptions while achieving ambitious carbon emissions reduction by 2050. All three scenarios share the policy assumptions of the baseline scenario for the period until 2030 and apply additional, but different policies during the period 2030–2050. More specifically:
- The Energy-Efficiency scenario involves policies that deliver very ambitious energy savings in the buildings sector and at the same time, projects further electrification of heat. The scenario does not include the development of carbon-neutral hydrogen and hydrocarbons.
- The Hydrogen and E-fuels scenario focuses on the supply-side of the energy system and assumes the development of climate-neutral fuels that can replace natural gas in distribution systems. The scenario assumes that ambitious energy savings take place to avoid the excessive increase in the volume of electricity needed to produce hydrogen and e-fuels. However, energy efficiency ambition is lower than in the previous scenario.
- The Combined scenario assumes a more ambitious emissions reduction target for 2050 compared to the previous two scenarios, aiming at carbon-neutrality by 2050. To this end, the scenario assumes development of very ambitious energy savings together with carbon-neutral hydrogen and e-fuels.
Climate-neutrality of a fuel, hydrogen or hydrocarbon, is meant for the entire chain of production and use, including for the energy inputs to the production of the fuel. Climate-neutral electricity producing hydrogen and CO2 captured from the air and biogenic sources can form climate-neutral methane and liquid hydrocarbons. Using CO2 captured from fossil-fuel combustion does not ensure carbon-neutrality as the CO2 is released into the air when combusting the synthetic hydrocarbon.
All three scenarios include energy-efficiency promoting policies that are of higher intensity in the period 2030–2050 than in 2020–2030, thus contrasting the policy assumptions of the Baseline Scenario. The policies include incentives to accelerate the pace and enhance the depth of energy renovation of buildings, stringent building codes accompanied by higher enforcement, and strict eco-design standards for equipment and appliances. The ambitious policy induces higher awareness about possibilities and benefits of energy efficiency, as well as financial and implementation facilitation of investment.
Consequently, perceived costs, risk premiums and other barriers reduce and are reflected onto the assumptions of the modelling. They imply a faster pace and enhanced deepness of investment in renovation, construction of passive buildings and uptake of highly efficient equipment. However, the Hydrogen and E-fuels scenario includes somehow less ambitious policies for energy efficiency, than the other two scenarios, as the carbon-neutral fuels present an attractive option for emissions reduction and thus consumers can afford moderating the energy efficiency ambition.
The rate of renovation of buildings is significantly higher in the strategy scenarios compared to the baseline scenario during the same period. By construction, the renovation rate is higher in the Energy Efficiency scenario, than in the other strategy scenarios and, similarly, the deepness of renovation is higher. The renovation effort of the strategy scenarios is slightly less intensive in the period 2030–2050 than in the period 2020–2030 (see Table 3) due to saturation effects, as the building stock becomes increasingly well-insulated and stringent building codes apply to new constructions.
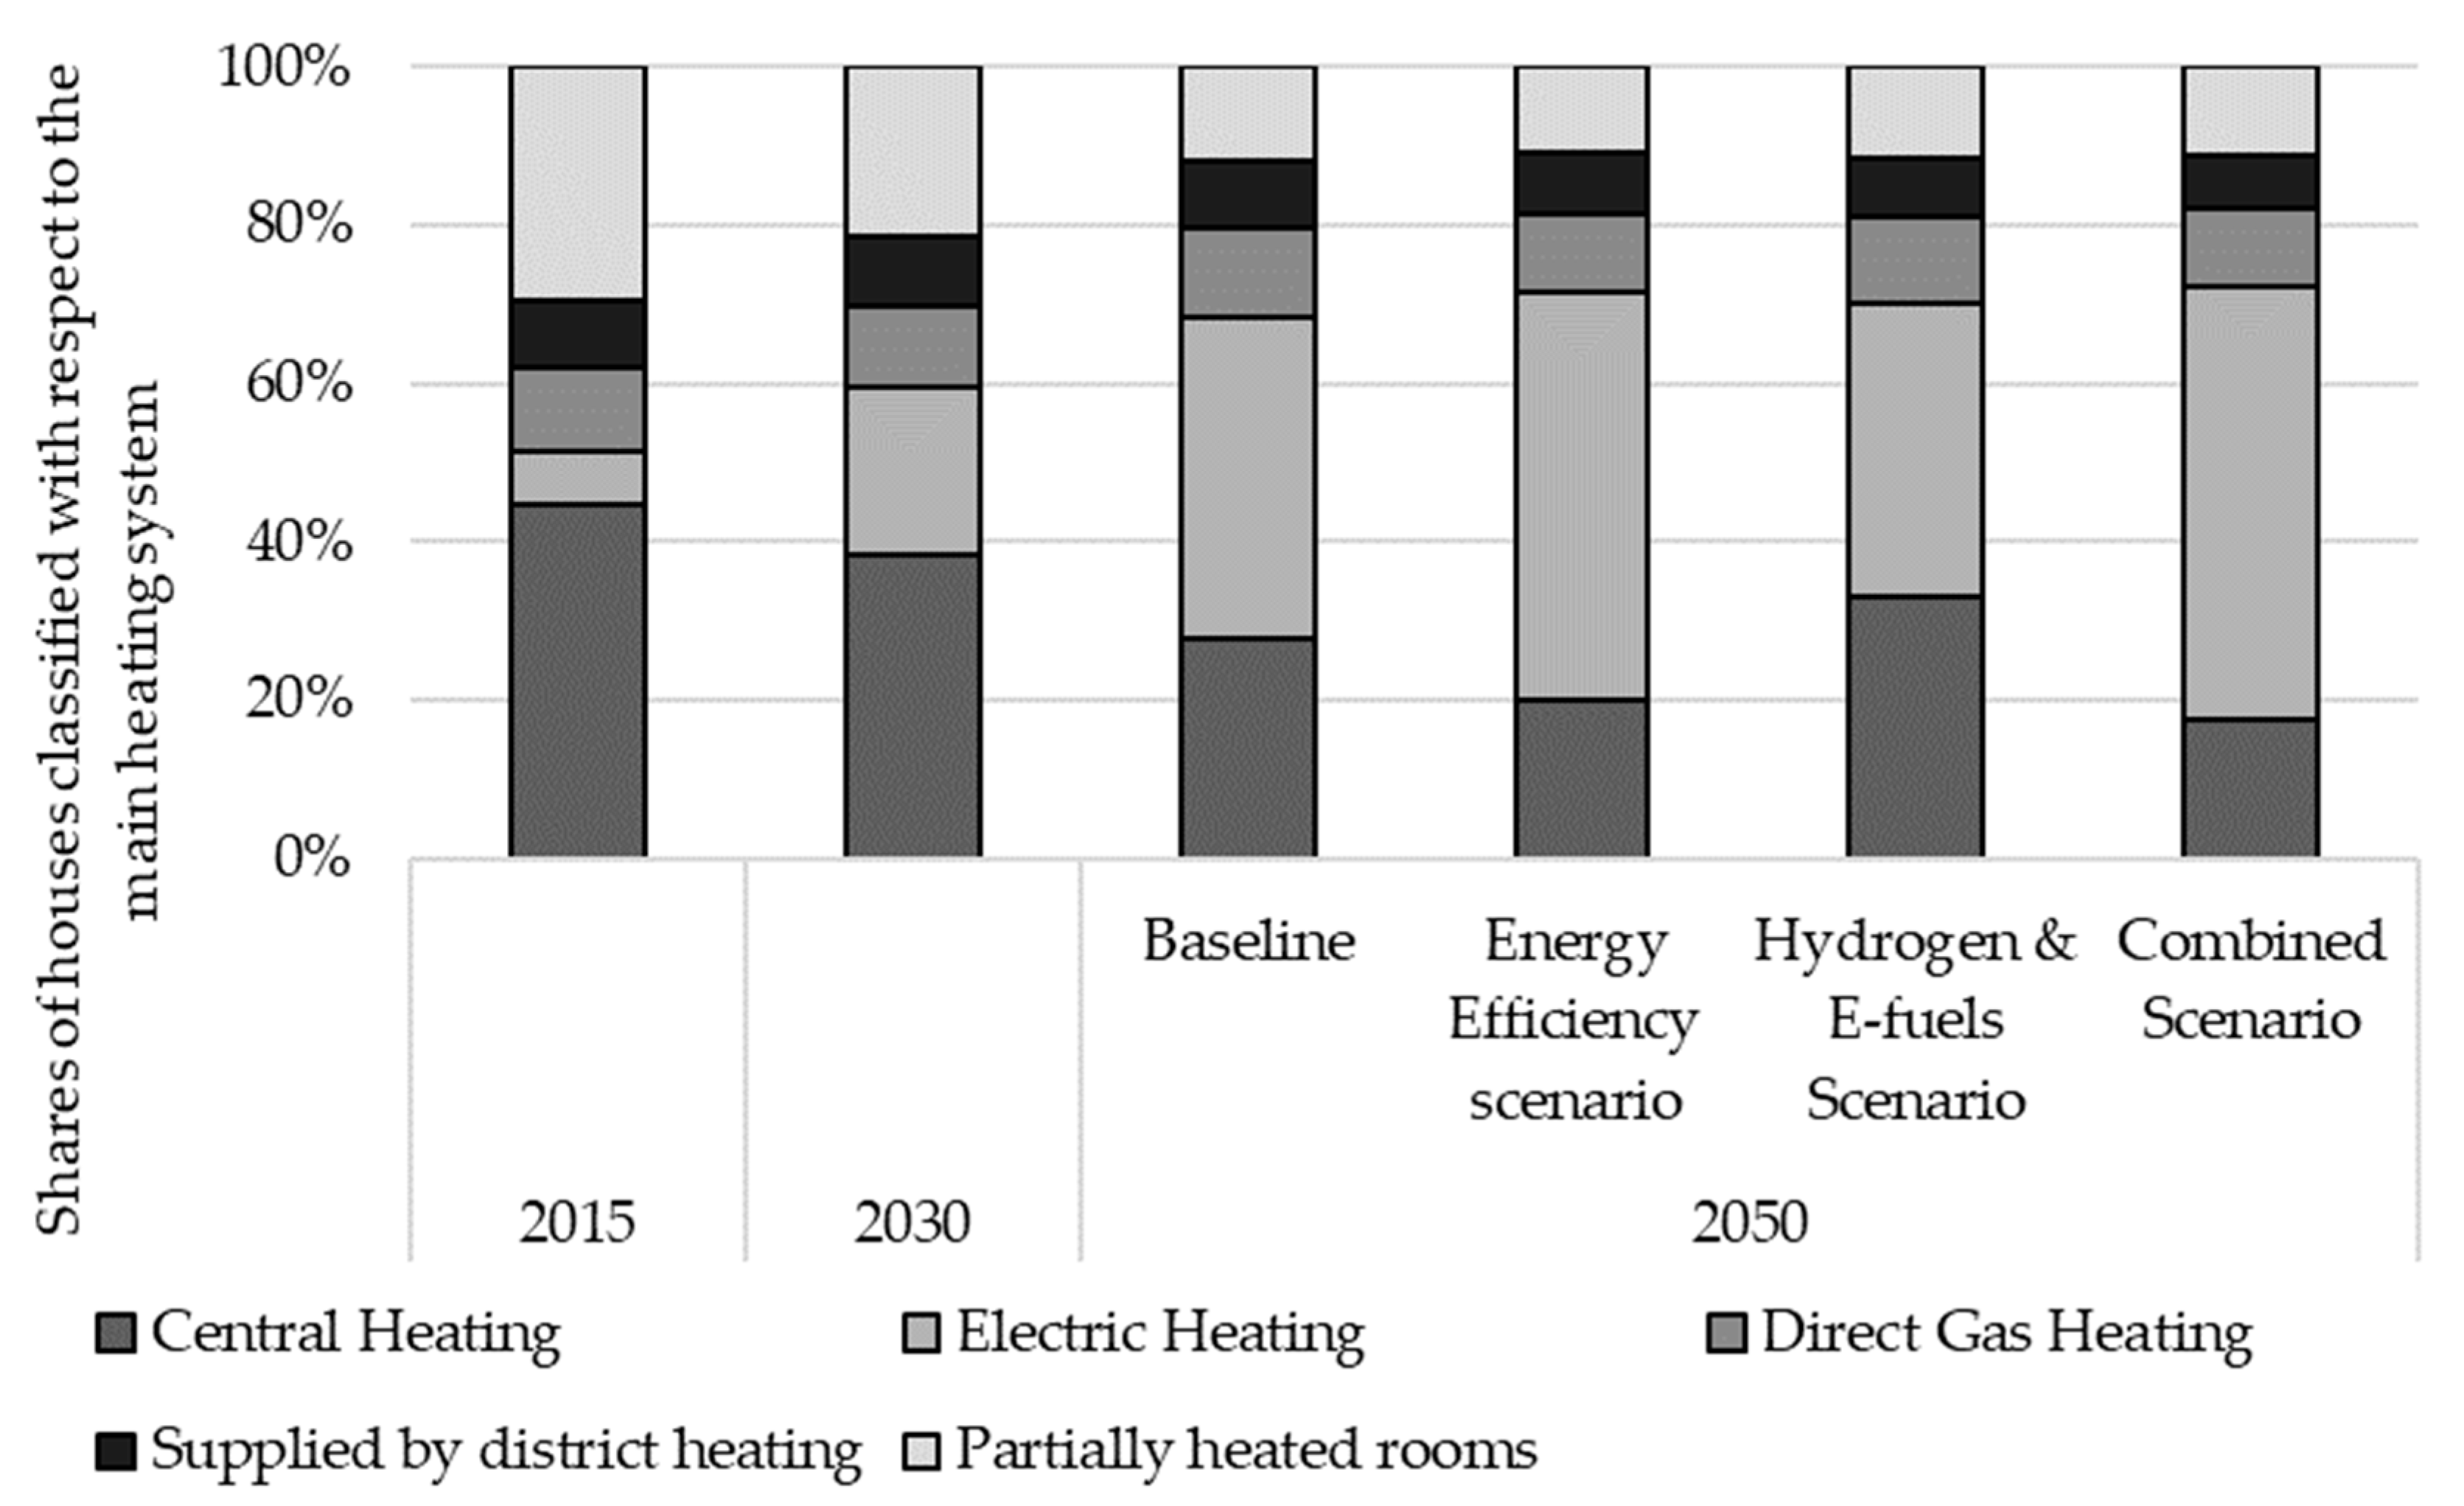
The penetration of electricity in the heat market tends to increase in the long-term, in all scenarios, as heat pumps are an economically rational choice for highly insulated buildings. Another driver to the benefit of heat pumps consists of promotional policies aiming at the renewables targets, given that beyond a certain value of the COP (coefficient of performance) the heat pumps are considered as renewables. Also, the positive anticipation of the increasing market size for heat pumps enables higher learning achievements and cost reductions leading to a further facilitation of their success in the heat market. However, the electrification is lower in the Hydrogen and E-fuels scenario as the carbon-neutral fuels can compete with electricity in this scenario.
Figure 2 illustrates trade-offs between electric heating and gas heating when for the latter carbon-neutral gaseous fuels are available. It is worth noticing that the Hydrogen and E-fuels scenario needs to exploit all options to achieve carbon neutrality in the buildings sector.
Because of the additional policies, the strategy scenarios succeed to reduce emissions by 2050 much below the levels in the baseline. The combined scenario is more ambitious than the other two scenarios and reaches almost full carbon neutrality by 2050 in the buildings sector. The scenario of Hydrogen and E-fuels achieves much lower emissions in 2050 than the Energy efficiency scenario because the former includes the carbon-neutral gaseous fuels in addition to other options. The energy efficiency scenario, having electricity as practically the only carbon-neutral carrier, cannot fully substitute gas and cannot abate emissions as much as when carbon-neutral gas is available. Limited potentials, inconveniences, as well as air pollution, of using biomass in buildings do not allow renewables to expand beyond certain limits and be alternative to carbon-neutral gas.
The combined scenario reaches carbon-neutrality by blending hydrogen up to 20%vol, biomethane up to 30%vol and e-methane in gas distribution, combined with very ambitious renovation of buildings and large market penetration of electricity.
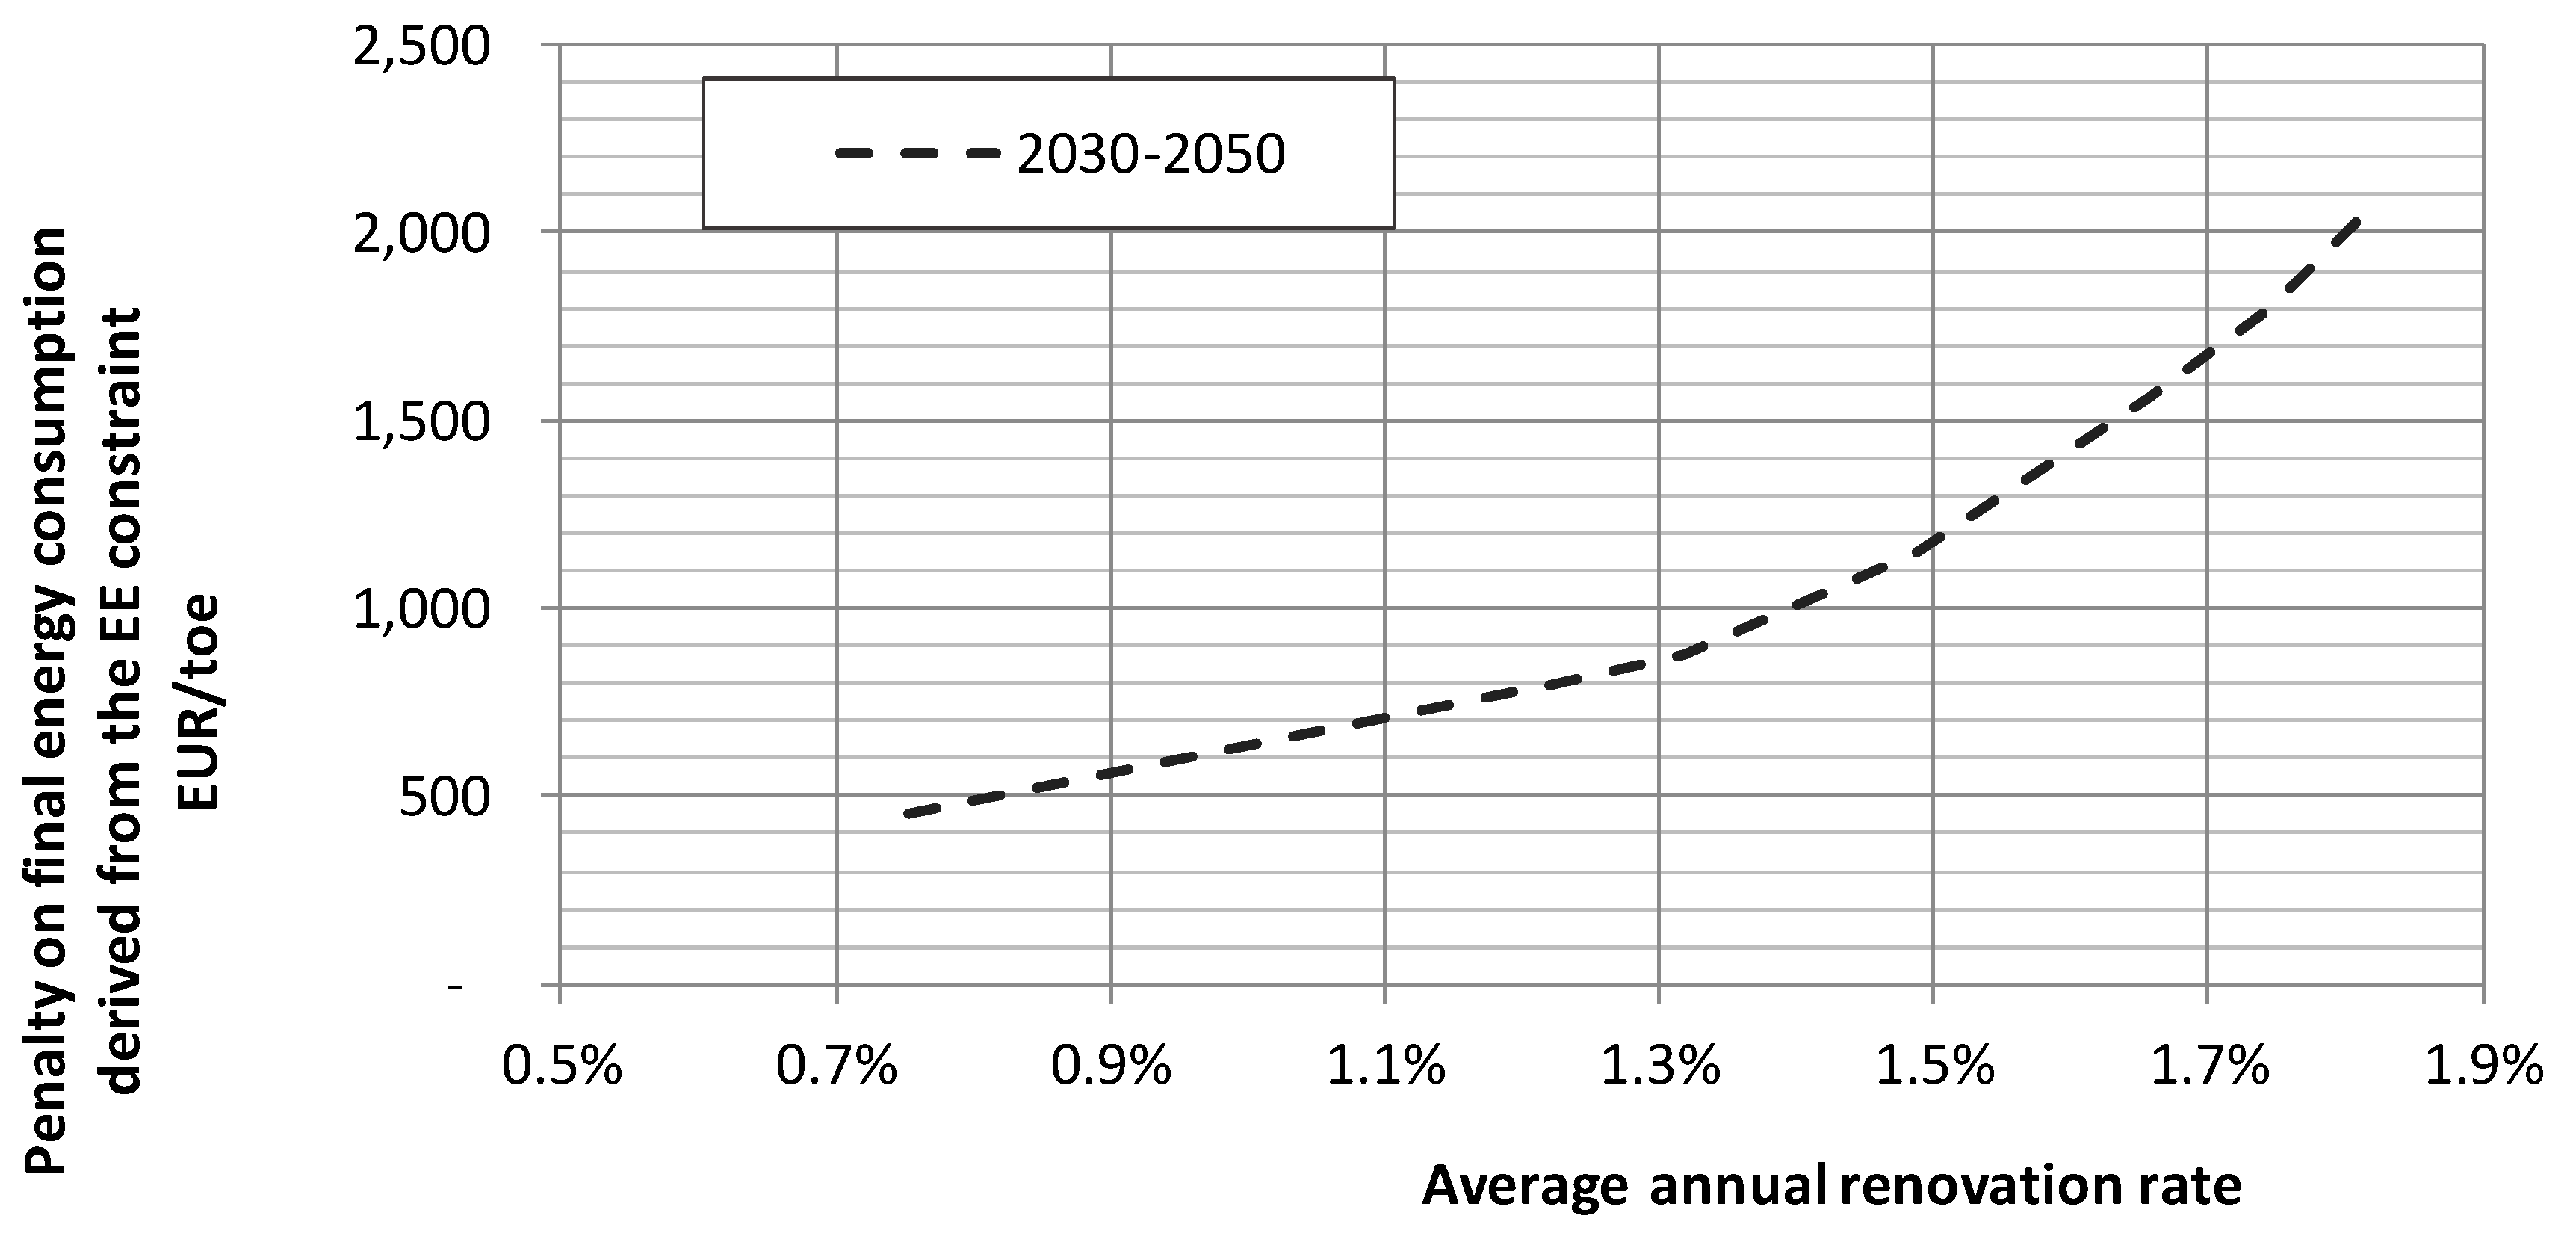
The model is able to handle energy efficiency targets in the buildings sector defined by policymaking. The target is included as an overall constraint in the mixed complementarity formulation of the model and influences the choices regarding renovation, equipment and appliances. Mathematically, the choices are influenced by the dual variable of the target constraint, which acts as a cost penalty on the consumption of final energy. In this manner, deep renovation options become attractive as the penalty reduces their pay back period. However, higher the uptake of deep renovation option, higher is the unit cost of renovation as the nonlinear cost-potential curves have increasing slopes. Figure 3 illustrates the relationship between the value of the penalty, hence the stringency of the energy efficiency target (denoted by EE constraint) and the average annual renovation rate calculated by the model.
Total final energy consumption in buildings is well below Baseline levels in 2050, in all three scenarios, and the demand for electricity is also lower despite the significant increase in the share of electricity in total energy consumption in buildings. The energy efficiency improvement implying a rational use of electricity helps maintaining demand for electricity at reasonable levels to the benefit of sustainability in the power sector.
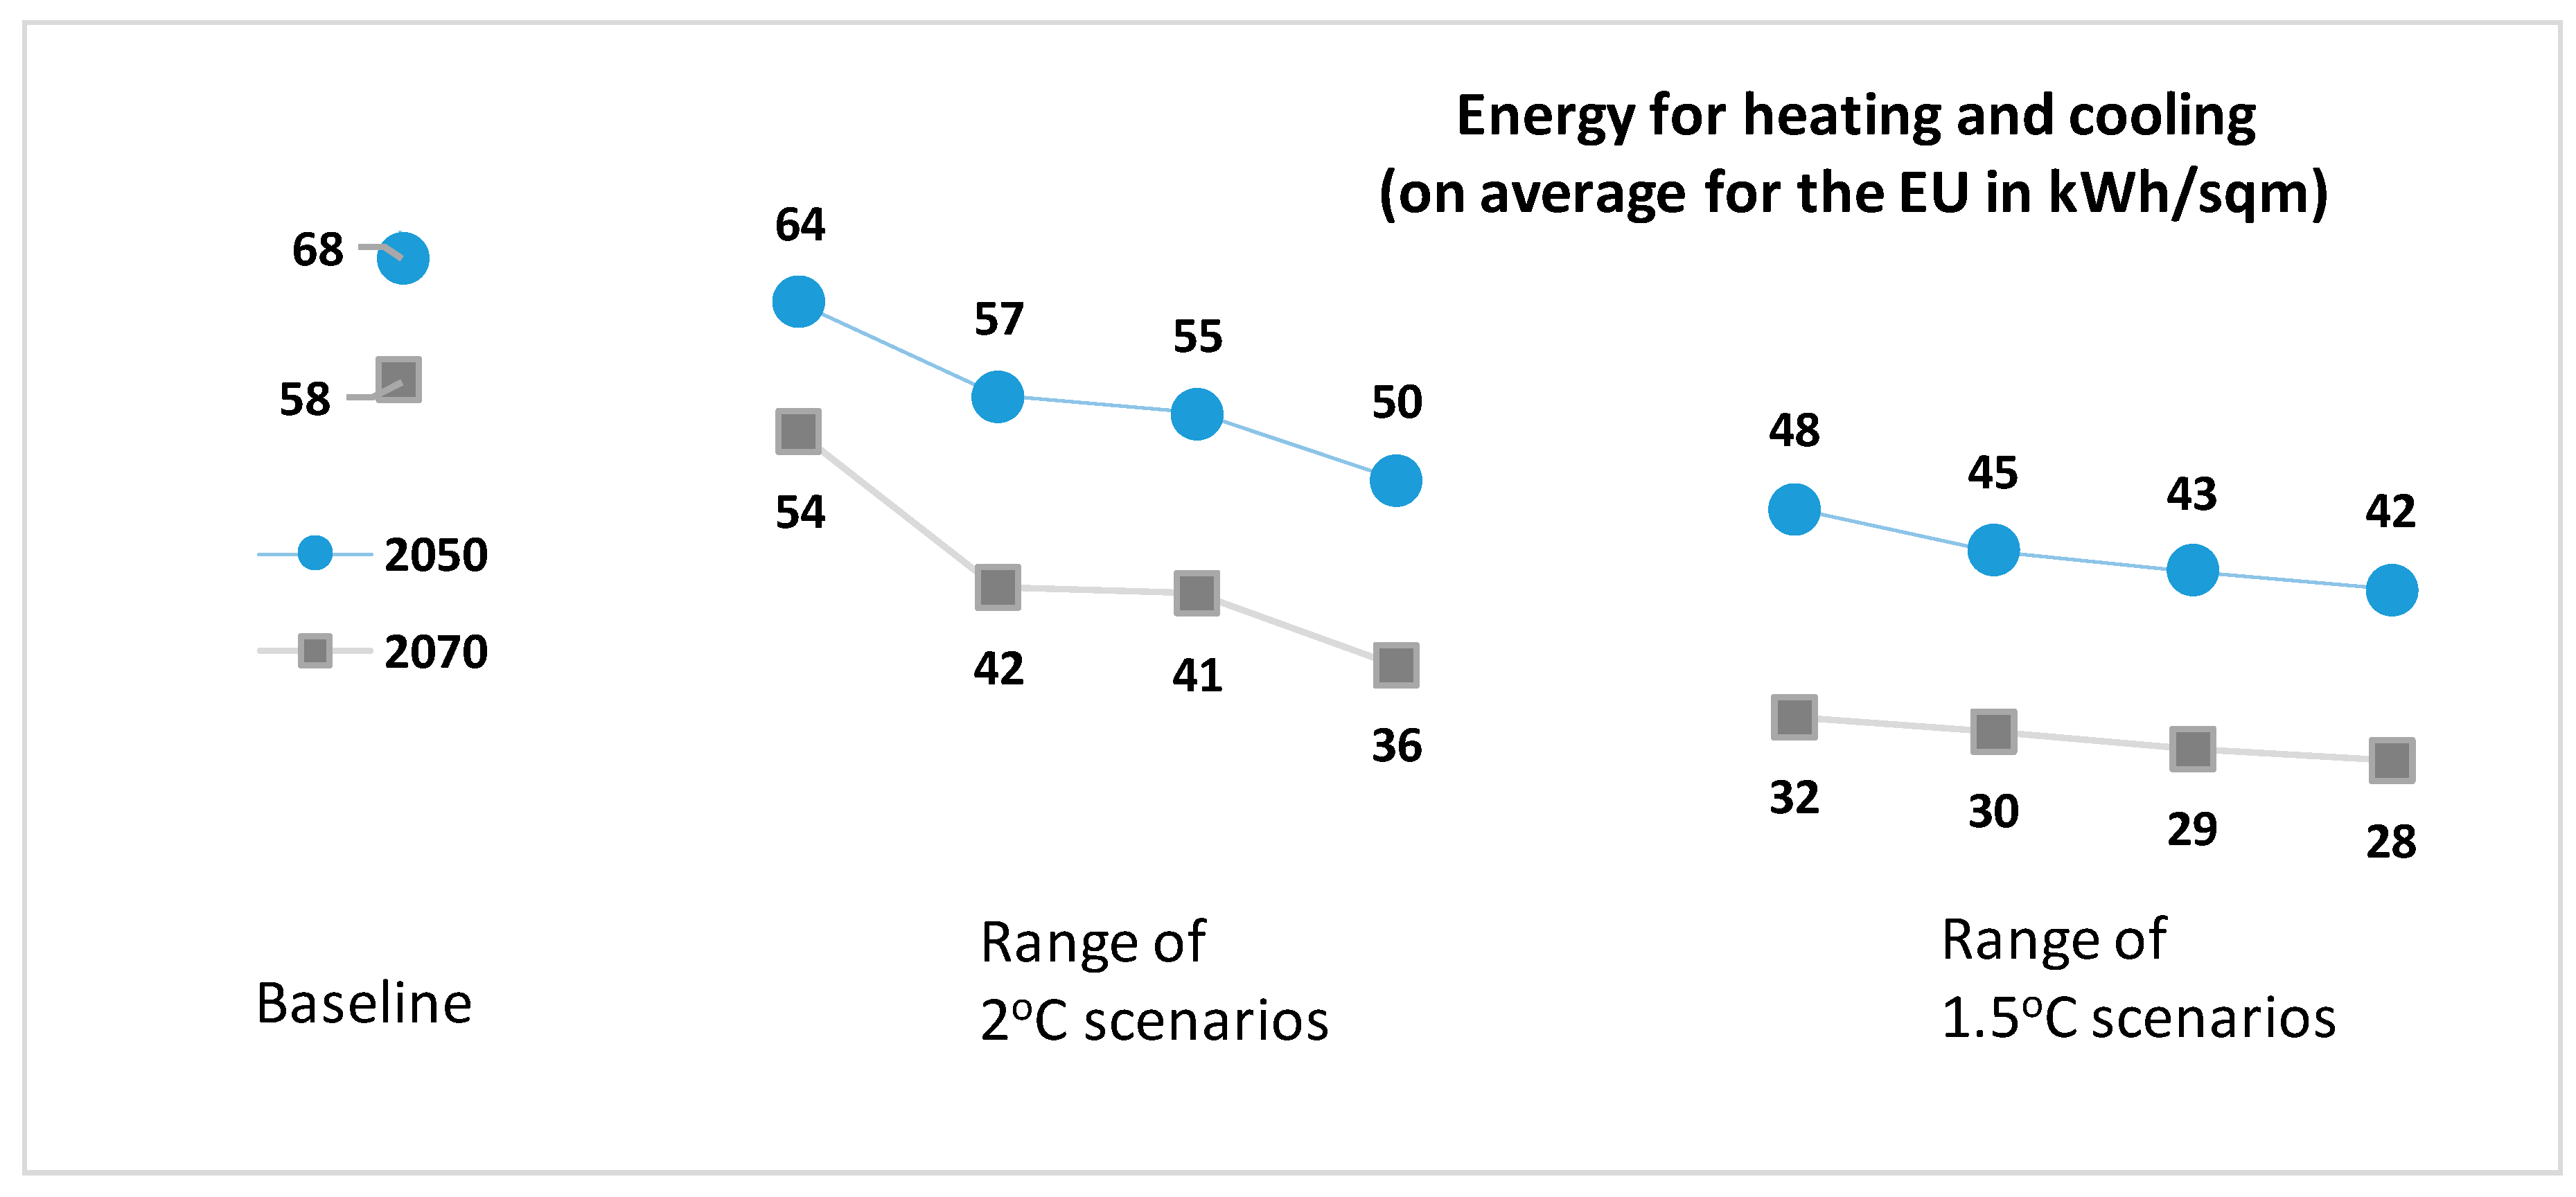
Figure 4 illustrates the dependence of final energy consumption for heating in houses on the climate policy for 2050 in the EU. The figure plots the model results from several scenario applications for various energy efficiency supporting policies and climate policy targets for 2050. Part of these scenarios foresee reaching 80% emission reduction in the EU by 2050; this target is considered to be compatible with a climate strategy limiting temperature rise to 2 °C. Other scenarios, which are compatible with a 1.5 °C climate strategy, adopt a target of reducing GHG emissions by more than 95% in 2050 compared to 1990 levels. Energy efficiency improvement is a major pillar in all these scenarios; however, the scenarios also differ regarding the intensity of energy efficiency policy for the buildings sector.
The model performs a detailed accounting of costs, which include capital expenditures (CAPEX) for insulating the building, and the purchasing of equipment and appliances, and operating expenditures (OPEX) for purchasing energy products and maintaining the equipment. In this way the model calculates total costs incurring to procure the useful energy services, with total costs being inclusive of expenditures for building insulation. The “total cost of energy services” can be used to compare the scenarios from a cost-effectiveness perspective, see [79].
The policies of the baseline scenario aiming at achieving the targets in 2030 imply significant increases in investment expenditures in the period 2020–2030, compared to historical trends, both for the intense insulation of buildings and the purchasing of efficiency equipment and appliances (see Table 4). The achievement of the 2030 targets implies that individuals and firms need to raise funding at a considerable extent, compared to common practices. The implementation policies will have to address the issue of affordability, and the ensuing adverse social impacts, for the consumer classes in the buildings sector that have poor access to debt and have limited cash flow. Sensitivity analysis using the model showed that increasing the discount rate to represent high opportunity costs of cash flow is significantly detrimental to the energy efficiency improvement pace. The financing barrier is sufficient to jeopardise the achievement of the targets.
Although the increase in the renovation of buildings saves energy and tends to reduce the bill of purchasing fuels, the results show an increase in OPEX, on average, in the period 2020–2030, compared to the period 2011–2020. The causes are primarily the shift of fuel mix towards electricity, which is more expensive than gas per unit of useful energy, and at a lesser extent the trend towards a slight increase in the gas prices after 2020, compared to the previous period.
Table 5 summarises the evaluation of costs for the long-term policy scenarios and the comparison to the baseline scenario for the period 2031–2050.
It is worth noticing that the Energy Efficiency scenario implies the same or slightly higher total costs of energy services in the buildings sector compared to the Baseline scenario, although the former scenario achieves very significant emissions reduction in 2050 (50% less in the long-term scenario). The significantly higher investment in the Energy Efficiency scenario succeeds to reduce costs of purchasing fuels compared to the Baseline, and the savings in the energy bill offsets the additional CAPEX. From a cost perspective, the Energy Efficiency scenario is the best among the three long-term scenarios. However, the implementation of such an ambitious renovation program is questionable.
The Hydrogen and E-fuels scenario relies less on energy efficiency and more on the possibility of using carbon-neutral distributed methane. Regarding convenience for consumers and avoidance of disruptions in the way energy is used and distributed in the buildings sector, the Hydrogen and E-fuels scenario is more reliable than the Energy Efficiency scenario. However, the total costs of energy are significantly higher. The main reason is that the distributed carbon-neutral methane is significantly costlier than the conventional fuels used in the Energy Efficiency scenario. The unit cost of purchasing energy products in the Energy Efficiency scenario in 2050 is 12% higher than in the Baseline, due to the higher use of electricity, but the unit cost of energy products in the Hydrogen and E-fuels scenario is close to 30% in 2050 more expensive than in the Baseline. The spending of lower amounts in CAPEX dedicated to efficiency does not fully compensate the increase in OPEX due to the expensive fuel mix, and thus total energy costs in the Hydrogen & E-fuels scenario are higher than in the Energy Efficiency scenario.
Nonetheless, the Hydrogen and E-fuels scenario is affordable if one considers the very significant drop of carbon emissions relative to the Baseline, as the former scenario implies only 4% higher total energy costs in the residential sector and 11% higher costs in the services sector (5% for the buildings sector as a whole) in cumulative terms in the period 2031–2050, compared to the costs in the Baseline Scenario. It is worth noticing that the CAPEX, hence the investment expenditures, do not increase in the Hydrogen & E-fuels scenario in the period 2031–2050, compared to the Baseline. The increase in costs is entire due to the increase in OPEX. In other words, the former scenario is robust regarding implementation, compared to scenarios with a significant increase in the investment effort, as the Energy Efficiency scenario, which needs 18% higher CAPEX than the Baseline. However, it should be noted that the scenario assumes tapping on the entire learning-by-doing potential of e-fuels. The cost structure of e-fuels is heavily dependent on the cost of electricity, as the cost shares of methanation (for gas) and Fischer-Troops (for liquids) become relatively small after exploiting the learning potential. However, significant uncertainty surrounds the costs of CO2 capture from the air and, to a lesser extent, from biogenic resources. The scenario assumptions are optimistic about these costs.
The Combined scenario is much more ambitious than the other two, for emissions reduction and is reasonably more expensive. Given the larger magnitude of emissions reduction, the scenario is also affordable as it implies only a 11%–12% increase in cumulative total energy costs in the period 2031–2050 compared to the Baseline for achieving carbon-neutrality. The Combined scenario is costlier both in investment expenditures and operating costs. High costs derive from the maximum use of all options as the scenario needs to reach carbon-neutrality. Both ambitious efficiency and large amounts of carbon-neutral gas are necessary to achieve drastic emissions reduction. The increase in CAPEX, compared to the Baseline, is significant (15% in the period 2031–2050), and is slightly below the levels in the Energy Efficiency scenario. The increase in OPEX, compared to the Baseline, is also significant (19% in the period 2031–2050) and is due to two factors: the gas for distribution is entirely free of natural gas, and the e-gas has a much higher share than hydrogen. By assumption, the gas mix in the Hydrogen and E-fuels scenario includes natural gas, a small share of e-gas and a high share of hydrogen. The gas mix in this scenario is significantly less expensive than the gas mix in the Combined scenario, as the e-gas is more expensive than hydrogen. Sensitivity analysis using the model has explored several other configurations for the scenarios that aim to achieve carbon-neutrality, as the Combined scenario, but lack of space does not allow presenting them in this paper.
Table 6 provides another perspective of the way the long-term scenarios achieve emissions reduction, compared to the baseline. The table compares cumulative figures in the period 2031–2050 and decomposes the emissions reduction relative to the baseline in a contribution due to the improvement of energy intensity and to the improvement of carbon intensity. The energy intensity is the ratio of final energy consumption over useful energy (including energy savings due to the thermal performance of the building shell). The carbon intensity is the ratio of direct CO2 emissions in the buildings sector over final energy consumption. The contribution of the former represents the effect of energy efficiency improvement, and the contribution of the latter represents the effect of decarbonising the fuel mix.
As shown in Table 6, the Energy Efficiency scenario mainly employs energy efficiency improvement to reduce carbon emissions, the Hydrogen and E-fuels scenario mainly employs decarbonisation of the fuel mix and the Combined scenario employs both options. However, in the latter scenario, the contribution of the decarbonised fuel mix is the largest as the scenario needs to deliver full carbon-neutrality.
4. Concluding Remarks
The energy-economy model of the buildings sector presented in this paper is novel regarding the mathematical formulation and the granularity of segmentation. Formulating dynamic programming of nested engineering-economic choices, tracking vintages of technologies and their learning, while capturing the heterogeneity of consumer behaviours and building conditions constitute the complexity of the model. The design also emphasised the representation of a multitude of policies, market and non-market based, as well as targets, and the inclusion of several barriers to rational choices in a monetised form. The numerical implementation of the model concerns all European countries, covers the residential and the services sector buildings, all split on many classes, and the time horizon until 2070, divided into five-year steps. The model has already a record of successful applications in the assessment of European policy options in the buildings sector regarding energy efficiency improvement, via renovation of old buildings and advanced equipment driven by eco-design standards, decarbonisation targets and fuel mix restructuring towards e-fuels.
The complex mathematics, the high granularity and the policy richness proved to be of great value in the assessment of the European policies because they aim to be specific by MS and able to evaluate specific policy instruments regarding cost-effectiveness and the possible social adverse effects. It would have been impossible to capture all the aspects required by the policy assessment without the complexity implemented in the model.
To improve the accuracy of the data and reduce computer time are among the priorities of the research in the short term. The model is highly data-intensive. However, new databases for the building stock of Europe are in preparation by Eurostat and the Joint Research Centre (JRC). Although the model runs on a cluster of high-end computers, the computer time is not satisfactory and has obliged us simplifying some parts of the model. Research is underway to linearise the nonlinear Logit and Weibull functions by delimiting the set of feasible choices via the tangents of the indifference curves. The approach underway also transforms the resource and learning functions in linear stepwise expressions. The aim is to run a large inter-temporal linear complementarity problem with continuous and binary variables, instead of the current nonlinear formulation. It is expected to improve computer time substantially, remove simplifications and be able to further increase the segmentation granularity, including time-of-use accounting of all energy forms and uses, without computer time penalisation.
The scenario analysis shows that very ambitious energy efficiency improvement and carbon emissions reduction are possible in the building sector of the EU at affordable costs both for 2030 and 2050. Key in the transition is the acceleration of the pace of renovation of old buildings and the enhancement of the deepness of insulation. Obstacles exist preventing rational exploitation of the cost-effective potential of buildings’ renovation. Removing barriers, mobilising investment funding and helping less endowed consumers are the main challenges that the policy needs to address. The potential of energy savings via the uptake of advanced equipment and appliances is also significant, and the eco-design policies need an enhancement to enable the progress further. Heat pumps are of particular interest in the transition, as they are the preferential option for highly insulated buildings, consume electricity very efficiently and can also contribute to the targets for renewables. The scenario projections confirm that ambitious energy-efficiency improvement pays-off and go together with increasing electrification of heat. However, achieving full carbon-neutrality in the building sector seems difficult with recourse to carbon-neutral fuels, such as hydrogen and e-gas, that replace natural gas in the distribution. The scenarios studied a trade-off between a strategy based on extreme energy efficiency, accompanied by electrification, and a strategy where the carbon-neutral distributed gas complements energy efficiency and electrification, which are less extreme but still high. The former strategy is overall less costly than the latter, but the latter has the merit of maintaining current infrastructure and convenience for consumers. The energy-efficiency strategy is particularly capital-intensive, and the e-fuels strategy is less capital-intensive but implies higher operating costs. The fuel mix in the e-fuels strategy remains costlier in the long-term than the conventional fuel mix, despite assuming full exploitation of the learning potential for hydrogen, methanation and CO2 capture from the air and biogenic sources. Implementation feasibility is the main uncertainty of the energy efficiency and electrification strategy, while high fuel cost is the main uncertainty of the strategy that complements energy efficiency and electrification with carbon-neutral gas. More detailed focus on technologies, implementation and learning potentials are objectives for further research concerning policy applications of the model.
Author Contributions
Conceptualization, T.F. and P.C.; Data curation, T.F., A.d.V. and P.C.; Methodology, T.F. and P.C.; Supervision, P.C.; Validation, T.F. and P.C.; Writing—original draft, T.F.; Writing—review & editing, A.d.V. and P.C.
Funding
The European Commission partially funded this research within a Long-Range Energy Modelling Framework contract.
Acknowledgments
The authors acknowledge the contribution of G. Kamaras and G. Polymenopoulos for the data and engineering analysis needs of the model building.
Conflicts of Interest
The authors declare no conflict of interest. The opinions expressed in this article are those of the authors and do not necessarily reflect the views of the European Commission.
Appendix A

Table A1.
Space heating and cooling technologies and associated fuels.
| Use | Type of Fuel | Technology |
| Space Heating | Diesel Oil | Conventional Boiler |
| Condensing Boiler | ||
| Natural Gas | Conventional Boiler | |
| Condensing Boiler | ||
| Micro-Cogeneration (CHP) Internal combustion engine | ||
| Micro-CHP CCGT (Combined Cycle Gas Turbine) | ||
| Micro-CHP Fuel Cell | ||
| Gas Heat Pump (air to water) | ||
| Autonomous Gas heater | ||
| Biomass | Wood Pellets Boiler | |
| Electricity | Air-Source Heat Pump (air to water) | |
| Water Source Heat pumps (water to water/air) | ||
| Ground-Source Heat Pump (brine to water/air) | ||
| Electrical space heater | ||
| Solar | Thermal Solar | |
| Steam | Distributed Heat | |
| Geothermal | Geothermal Ponds | |
| Solids | Stove for solid fuels | |
| LPG | Autonomous LPG heater | |
| Stove for liquid fuels | ||
| Space Cooling | Electricity | Air-Source Heat Pump (air to water) |
| Water Source Heat pumps (water to water/air) | ||
| Ground-Source Heat Pump (brine to water/air) | ||
| Split system air condition | ||
| Centralized cooling systems | ||
| Natural Gas | Gas Heat Pump (air) | |
| Absorption Chiller | ||
| Adsorption Chiller | ||
| Steam | District Cooling |
Table A2.
Water heating and cooking technologies and associated fuels.
| Use | Type of Fuel | Technology |
| Water Heating | Diesel Oil | Conventional Boiler |
| Condensing Boiler | ||
| Natural Gas | Conventional Boiler | |
| Condensing Boiler | ||
| Micro-CHP Internal combustion engine | ||
| Micro-CHP CCGT | ||
| Micro-CHP Fuel Cell | ||
| Gas Heat Pump (air to water) | ||
| Autonomous Gas heater | ||
| Biomass | Wood Pellets Boiler | |
| Electricity | Air-Source Heat Pump (air to water) | |
| Water Source Heat pumps (water to water/air) | ||
| Ground-Source Heat Pump (brine to water/air) | ||
| Heat Pump Water Heater | ||
| Simple electrical water heater | ||
| Solar | Thermal Solar | |
| Steam | Distributed Heat | |
| Geothermal | Geothermal Ponds | |
| Solids | Stove for solid fuels | |
| LPG | Autonomous LPG heater | |
| Cooking | Natural Gas | Gas Cookers |
| Biomass | Solid/Biomass Cookers | |
| Electricity | Electric Cookers | |
| LPG | Liquid Cookers |
References
- Eurostat Energy Balances. Available online: https://ec.europa.eu/eurostat/web/energy/data/energy-balances (accessed on 28 May 2019).
- Fleiter, T.; Steinbach, J.; Ragwitz, M.; Dengler, J.; Köhler, B.; Reitze, F.; Tuille, F.; Hartner, M.; Kranzl, L.; Forthuber, S. Mapping and analyses of the current and future (2020–2030) heating/cooling fuel deployment (fossil/renewables). Work Package 2016, 1, 1–156. [Google Scholar]
- IEA. Energy Efficiency 2018; Market Report Series; IEA/OECD Publications: Paris, France, 2018. [Google Scholar]
- European Parliament. Directive 2010/31/EU of the European Parliament and of the Council of 19 May 2010 on the Energy Performance of Buildings. Available online: https://eur-lex.europa.eu/legal-content/EN/TXT/PDF/?uri=CELEX:32010L0031&from=EN (accessed on 28 May 2019).
- Hermelink, A.; Schimschar, S.; Boermans, T.; Pagliano, L.; Zangheri, P.; Armani, R.; Voss, K.; Musall, E. Towards Nearly Zero-Energy Buildings Definition of Common Principles under the EPBD—Final Report. In Proceedings of the 2013 European Council for an Energy Efficient Economy, Brussels, Belgium, 14 February 2013. [Google Scholar]
- Economidou, M. Energy performance requirements for buildings in Europe. REHVA J. 2012, March, 16–21. [Google Scholar]
- Jamieson, M.; Brajterman, O.; Verstraeten, Y.; Arbon, J.; Lonsdale, J.; Allington, M. International Energy Performance of Buildings Directive (EPBD) Compliance Study: Final Report, Study for the European Commission; Directorate-General for Energy Publications Office: Luxembourg, 2015; ISBN 978-92-79-54219-0. [Google Scholar]
- Economidou, M.; Atanasiu, B.; Despret, C.; Maio, J.; Nolte, I.; Rapf, O. Europe’s buildings under the microscope. A Country-by-Country Review of the Energy Performance of Buildings; Buildings Performance Institute Europe (BPIE): Bruxelles, Belgium, 2011; ISBN 9789491143014. [Google Scholar]
- Meijer, F.; Visscher, H. Jobs Creation Through Energy Renovation of the Housing Stock. Neujobs Working Paper D14.2. December 2012. Available online: http://conference.iza.org/conference_files/neujobs_2014/4.pdf (accessed on 16 July 2019).
- European Parliament. Regulation (EU) 2017/1369 of the European Parliament and of the Council-of 4 July 2017—Setting a Framework for Energy Labelling and Repealing Directive 2010/30/EU. Available online: https://eur-lex.europa.eu/legal-content/EN/TXT/PDF/?uri=CELEX:32017R1369&rid=1 (accessed on 28 May 2019).
- IEA. Achievements of Appliance Energy Efficiency Standards and Labelling Programs: A Global Assessment; IEA/OECD Publications: Paris, France, 2015. [Google Scholar]
- van Delft, Y.; de Kler, R. Matching Processes with Electrification Technologies; Final Report of the E-Match Project; ECN-E-17-008; ECN: Petten, The Netherlands, 2017. [Google Scholar]
- Brown, M.A. Market failures and barriers as a basis for clean energy policies. Energy Policy 2001, 29, 1197–1207. [Google Scholar] [CrossRef]
- Golove, W.H.; Eto, J.H. Market Barriers to Energy Efficiency: A Critical Reappraisal of the Rationale for Public Policies to Promote Energy Efficiency; Energy & Environment Division, Lawrence Berkeley National Laboratory: Berkeley, CA, USA, 1996; No. LBL-38059. [Google Scholar]
- Valentová, M. Barriers to Energy Efficiency—Focus on Transaction Costs. Acta Polytech. 2010, 50, 4. [Google Scholar]
- Hausman, J.A. Individual Discount Rates and the Purchase and Utilization of Energy-Using Durables. Bell J. Econ. 1979, 10, 33–54. [Google Scholar] [CrossRef]
- Howarth, R.B.; Sanstad, A.H. Discount Rates and Energy Efficiency. Contemp. Econ. Policy 1995, 13, 101–109. [Google Scholar] [CrossRef]
- Kavgic, M.; Mavrogianni, A.; Mumovic, D.; Summerfield, A.; Stevanovic, Z.; Djurovic-Petrovic, M. A review of bottom-up building stock models for energy consumption in the residential sector. Build. Environ. 2010, 45, 1683–1697. [Google Scholar] [CrossRef]
- Charlier, D.; Mosiño, A.; Pommeret, A. Energy-saving technology adoption under uncertainty in the residential sector. Annales d’Economie et Statistiques 2011, 103–104, 43–70. [Google Scholar] [CrossRef]
- Bhattacharyya, S.C.; Timilsina, G.R. Energy Demand Models for Policy Formulation: A Comparative Study of Energy Demand Models; Development Research Group Environment and Energy Team, The World Bank: Washington, DC, USA, 2009. [Google Scholar]
- Clinch, J.P.; Healy, J.D.; King, C. Modelling improvements in domestic energy efficiency. Environ. Model. Softw. 2001, 16, 87–106. [Google Scholar] [CrossRef]
- Coffy, B.; Borgeson, S.; Selkowitz, S.; Apte, J.; Mathew, P.; Haves, P. Towards a very low-energy building stock: Modelling the US commercial building sector to support policy and innovation planning. Build. Res. Inf. 2009, 37, 610–624. [Google Scholar] [CrossRef]
- Bernard, J.T. An Integrated Total Energy Demand Model for the Province of Québec; Département D’économie, Université Laval: Sainte-Foy, QC, Canada, 1996. [Google Scholar]
- Dong, B.; Li, Z.; Rahman, S.M.; Vega, R. A hybrid model approach for forecasting future residential electricity consumption. Energy Build. 2016, 117, 341–351. [Google Scholar] [CrossRef]
- Weiss, M.; Patel, M.K.; Junginger, M.; Blok, K. Analyzing price and efficiency dynamics of large appliances with the experience curve approach. Energy Policy 2010, 38, 770–783. [Google Scholar] [CrossRef]
- Aydinalp, M.; Ugursal, V.I.; Fung, A.S. Modeling of the space and domestic hot-water heating energy-consumption in the residential sector using neural networks. Appl. Energy 2004, 79, 159–178. [Google Scholar] [CrossRef]
- Dinan, T.M.; Miranowski, J.A. Estimating the implicit price of energy efficiency improvements in the residential housing market: A hedonic approach. J. Urban Econ. 1989, 25, 52–67. [Google Scholar] [CrossRef]
- Swan, L.G.; Ugursal, V.I. Modeling of end-use energy consumption in the residential sector: A review of modeling techniques. Renew. Sustain. Energy Rev. 2009, 13, 1819–1835. [Google Scholar] [CrossRef]
- Aydinalp, M.; Ugursal, V.I.; Fung, A.S. Modeling of the appliance, lighting, and space-cooling energy consumptions in the residential sector using neural networks. Appl. Energy 2002, 71, 87–110. [Google Scholar] [CrossRef]
- Daioglou, V.; Van Ruijven, B.J.; Van Vuuren, D.P. Model projections for household energy use in developing countries. Energy 2012, 37, 601–615. [Google Scholar] [CrossRef] [Green Version]
- Shorrock, L.D.; Dunster, J.E. The physically-based model BREHOMES and its use in deriving scenarios for the energy use and carbon dioxide emissions of the UK housing stock. Energy Policy 1997, 25, 1027–1037. [Google Scholar] [CrossRef]
- Anderson, B.R.; Chapman, P.F.; Cutland, N.G.; Dickson, C.M.; Henderson, G.; Henderson, J.H.; Iles, P.J.; Kosmina, L.; Shorrock, L.D. BREDEM-12 Model Description; Building Research Establishment: Watford, UK, 1996. [Google Scholar]
- Natarajan, S.; Levermore, G.J. Predicting future UK housing stock and carbon emissions. Energy Policy 2007, 35, 5719–5727. [Google Scholar] [CrossRef]
- Pout, C.H. N-DEEM: The national nondomestic buildings energy and emissions model. Environ. Plan. B Plan. Des. 2000, 27, 721–732. [Google Scholar] [CrossRef]
- Nemry, F.; Uihlein, A.; Colodel, C.M.; Wittstock, B.; Braune, A.; Wetzel, C.; Hasan, I.; Niemeier, S.; Frech, Y.; Kreissig, J.; et al. Environmental Improvement Potentials of Residential Buildings (IMPRO-Building); JRC Report; European Communities: Brussels, Belgium, 2008. [Google Scholar]
- Uihein, A.; Eder, P. Towards Additional Policies to Improve the Environmental Performance of Buildings; European Communities: Brussels, Belgium, 2009. [Google Scholar]
- Arpano, M.R.; Sassi, P. A multi-stage approach to low carbon housing renovations. In Proceedings of the 30th International Plea Conference, CEPT University, Ahmedabd, India, 16–18 December 2014. [Google Scholar]
- Skaran, A.M. Typologies and Energy Demand Modelling of the Norwegian Building Stock—Part 2, Project Work; Norwegian University of Science and Technology: Trondheim, Norway, 2013. [Google Scholar]
- Chateau, B.; Lapillonne, B. Long term energy demand forecasting: A new approach. Energy Policy 1978, 6, 140–157. [Google Scholar] [CrossRef]
- IAEA. Model for Analysis of Energy Demand, (MAED-2), Manual 18; International Atomic Energy Agency: Vienna, Austria, 2006. [Google Scholar]
- Tanatvanit, S.; Limmeechokchai, B.; Chungpaibulpatana, S. Sustainable energy development strategies: Implications of energy demand management and renewable energy in Thailand. Renew. Sustain. Energy Rev. 2003, 7, 367–395. [Google Scholar] [CrossRef]
- Swan, L.G.; Ugursal, V.I.; Beausoleil-Morrison, I. Hybrid residential end-use energy and greenhouse gas emissions model-development and verification for Canada. J. Build. Perform. Simul. 2013, 6, 1–23. [Google Scholar] [CrossRef]
- Swan, L.G. Residential Sector Energy and GHG Emissions Model for the Assessment of New Technologies. Ph.D. Thesis, Dalhousie University, Halifax, NS, Canada, 2010. [Google Scholar]
- Wills, A.D. On the Modelling and Analysis of Converting Existing Canadian Residential Communities to Net-Zero Energy. Ph.D. Thesis, Carleton University, Ottawa, ON, Canada, 2018. [Google Scholar] [Green Version]
- EIA, D. Residential Demand Module of the National Energy Modeling System Model Documentation Report; US Energy Information Administation: Washington, DC, USA, 2013. [Google Scholar]
- Bataille, C.G.F. Design and Application of a Technologically Explicit Hybrid Energy-Economy Policy Model with Micro and Macroeconomic Dynamics. Ph.D. Thesis, School of Resource and Environmental Management-Simon Fraser University, Burnaby, BC, Canada, 2005. [Google Scholar]
- Sadler, M. Home energy preferences & policy: Applying stated choice modeling to a hybrid energy economy model. Ph.D. Thesis, Environment School of Resource and Environmental Management, Burnaby, BC, Canada, 2003. [Google Scholar]
- Kannan, R.; Strachan, N. Modelling the UK residential energy sector under long-term decarbonisation scenarios: Comparison between energy systems and sectoral modelling approaches. Appl. Energy 2009, 86, 416–428. [Google Scholar] [CrossRef]
- Stecley, S.G.; Meade, D.S.; Lenox, C.S.; Hoffman, K.C.; Reid, D.H.; Schoener, B.C. Energy demand analytics using coupled technological and economic models. Energy J. 2011, 173–191. [Google Scholar] [CrossRef]
- Friege, J.; Chappin, E. Modelling decisions on energy-efficient renovations: A review. Renew. Sustain. Energy Rev. 2014, 39, 196–208. [Google Scholar] [CrossRef] [Green Version]
- Jakob, M. Modeling the choice of renovation modes of single-family home owners with respect to energy-efficiency. In Proceedings of the 15th EAERE Annual Conference, University of Macedonia, Thessaloniki, Greece, 30 June 2007; pp. 27–30. [Google Scholar]
- Friege, J.; Chappin, E. Simulating the influence of socio-spatial structures on energy-efficient renovations. In Proceedings of the Social Simulation Conference, Barcelona, Spain, 1–5 September 2014. [Google Scholar]
- Clinch, J.P.; Healy, J.D. Valuing improvements in comfort from domestic energy-efficiency retrofits using a trade-off simulation model. Energy Econ. 2003, 25, 565–583. [Google Scholar] [CrossRef]
- Ximenes, R.; Ferrao, P. Energy Demand Model to Support the Definition of Sustainable Energy Systems: Residential Sector. Master’s Thesis, Tecnico Lisboa, Portugal, 2015. [Google Scholar]
- Lutzenhiser, L.; Moezzi, M.; Hungerford, D.; Friedmann, R. Sticky points in modeling household energy consumption. In Proceedings of the 2010 ACEEE Summer Study on Energy Efficiency in Buildings, Pacific Grove, CA, USA, 15–20 August 2010. [Google Scholar]
- Train, K. Discrete Choice Methods with Simulation; Cambridge University Press: Cambridge, UK, 2003. [Google Scholar]
- Loga, T.; Diefenbach, N. TABULA Calculation Method—Energy Use for Heating and Domestic Hot Water. TABULA Proj. 2013. Available online: http://episcope.eu/fileadmin/tabula/public/docs/report/TABULA_CommonCalculationMethod.pdf (accessed on 17 July 2019).
- Ameli, N.; Brandt, N. What impedes household investment in energy efficiency and renewable energy? Int. Rev. Environ. Resour. Econ. 2014, 8, 101–138. [Google Scholar] [CrossRef]
- Deaton, A.; Muellbauer, J. Economics and Consumer Behaviour; Cambridge University Press: Cambridge, UK, 1980; ISBN 0521296765. [Google Scholar]
- Jehle, G.A.; Reny, P.J. Advanced Microeconomic Theory, 3rd ed.; Financial Times, Prentice Hall: Harlow, UK, 2011; ISBN 978-0-273-73191-7. [Google Scholar]
- Chipman, J.S. Aggregation and Estimation in the Theory of Demand. Hist. Polit. Econ. 2006, 38, 106–129. [Google Scholar] [CrossRef]
- Rosen, H.S. Applied welfare economics with discrete choice models. Econometrica 1981, 49, 105–130. [Google Scholar]
- Claudy, M.; O’Driscoll, A. Beyond Economics: A Behavioural Approach to Energy Efficiency in Domestic Buildings. J. Sustain. Energy Dev. Policy 2008, 1, 27–40. [Google Scholar]
- Sanstad, A.H.; McMahon, J.E. Aspects of Consumers’ and Firms’ Energy Decision-Making: A Review and Recommendations for the National Energy Modelling System (NEMS); Lawrence Berkeley National Laboratory: Berkeley, CA, USA, 2008. [Google Scholar]
- Loga, T.; Stein, B.; Diefenbach, N. TABULA building typologies in 20 European countries—Making energy-related features of residential building stocks comparable. Energy Build. 2016, 132, 4–12. [Google Scholar] [CrossRef]
- Schimschar, S.; Grözinger, J.; Korte, H.; Boermans, T.; Lilova, V.; Bhar, R. Panorama of the European Non-Residential Construction Sector. ECOFYS, Report to European Copper Institute. 2011. Available online: http://leonardo-energy.pl/wp-content/uploads/2018/03/Europejski-sektor-budownictwa-niemieszkalnego.pdf (accessed on 17 July 2019).
- Fleiter, T.; Braungardt, S.; Sohaib, T.; Schlomann, B.; Eichhammer, W.; Elsland, R.; Kranzl, L.; Jakob, M. Assessing the impact of the EU Ecodesign Directive on a member state level monitoring. In Proceedings of the Summer study on Energy Efficiency (ECEEE 2015), Hyères, France, 1–6 June 2015. [Google Scholar]
- Eurostat. Average Number of Rooms Per Person by Degree of Urbanization. Available online: http://appsso.eurostat.ec.europa.eu/nui/show.do?dataset=ilc_lvho04d&lang=en (accessed on 28 May 2019).
- Eurostat. Household Characteristics by Degree of Urbanisation. Available online: http://appsso.eurostat.ec.europa.eu/nui/show.do?dataset=hbs_car_t315&lang=en (accessed on 28 May 2019).
- Eurostat. Living Conditions Cities and Greater Cities. Available online: http://appsso.eurostat.ec.europa.eu/nui/show.do?dataset=urb_clivcon&lang=en (accessed on 28 May 2019).
- Dol, K.; Haffner, M. Housing Statistics in the European Union 2010; Delft University of Technology: Delft, The Netherlands, 2010. [Google Scholar]
- Birchall, S.; Wallis, I.; Churcher, D.; Pezzutto, S.; Fedrizzi, R.; Causse, E. Survey on the Energy Needs and Architectural Features of the EU Building Stock; BSRIA: Bracknell, UK, 2014. [Google Scholar]
- Arran, J.; Slowe, J. 2050 Pathways for Domestic Heat Final Report; Delta Energy & Environment Ltd.: Edinburgh, UK, 2012. [Google Scholar]
- De Vita, A.; Kielichowska, I.; Mandatowa, P. Technology Pathways in Decarbonisation Scenarios, ASSET Project Report. July 2018. Available online: https://ec.europa.eu/energy/sites/ener/files/documents/2018_06_27_technology_pathways_-_finalreportmain2.pdf (accessed on 28 May 2019).
- European Commission. Clean Energy for All Europeans Policy Package. November 2016. Available online: https://ec.europa.eu/energy/en/topics/energy-strategy-and-energy-union/clean-energy-all-europeans (accessed on 28 May 2019).
- European Parliament. Directive (EU) 2018/844 of the European Parliament and of the Council of 30 May 2018 Amending Directive 2010/31/EU on the Energy Performance of Buildings and Directive 2012/27/EU on Energy Efficiency. 30 May 2018. Available online: https://eur-lex.europa.eu/legal-content/EN/TXT/?uri=uriserv%3AOJ.L_.2018.156.01.0075.01.ENG (accessed on 28 May 2019).
- European Parliament. Directive (EU) 2018/2002 of the European Parliament and of the Council of 11 December 2018 Amending Directive 2012/27/EU on Energy Efficiency. 11 December 2018. Available online: https://eur-lex.europa.eu/legal-content/EN/TXT/?uri=uriserv%3AOJ.L_.2018.328.01.0210.01.ENG (accessed on 28 May 2019).
- European Parliament. Directive (EU) 2018/2001 of the European Parliament and of the Council of 11 December 2018 on the Promotion of the Use of Energy from Renewable Sources. 11 December 2018. Available online: https://eur-lex.europa.eu/legal-content/EN/TXT/?uri=uriserv:OJ.L_.2018.328.01.0082.01.ENG&toc=OJ:L:2018:328:TOC (accessed on 28 May 2019).
- Paltsev, S.; Capros, P. Cost Concepts for Climate Change Mitigation. Clim. Change Econ. 2013, 4, 1340003. [Google Scholar] [CrossRef]
Figure 1.
Flowchart of the PRIMES-BuiMo model.

Figure 2.
Split of households according to the type of heating system, in the EU.

Figure 3.
Non-linear increase of the dual variable of the annual energy efficiency constraint with increasing average annual renovation rate in the period 2030–2050.
Figure 3.
Non-linear increase of the dual variable of the annual energy efficiency constraint with increasing average annual renovation rate in the period 2030–2050.

Figure 4.
Variation of final energy consumption for heating per square meter of house surface depending on the climate target in 2050.
Figure 4.
Variation of final energy consumption for heating per square meter of house surface depending on the climate target in 2050.

Table 1.
Nomenclature for PRIMES-BuiMo.
| Nomenclature | |
|---|---|
| Sets | |
| Time (years) within a time horizon | |
| Building categories | |
| Discrete set of dynamic renovation strategies | |
| Discrete set of dynamic equipment strategies | |
| Parameters | |
| Macroeconomic factors | |
| Net annual cost (operating and capital costs, inclusive of investment for building insulation) for the useful energy demand | |
| Log-linear function for the steady-state relationship between the useful energy and the explanatory factors | |
| Upper bound of the logistic curve for useful energy demand | |
| Scale parameter of the logistic curve for useful energy demand | |
| Slope parameter of logistic curve for useful energy demand | |
| Exogenous rate of demolition of the buildings stock | |
| Annual growth rate of macroeconomic and demographic factors | |
| Pace at which dynamically tends to an optimal buildings stock | |
| Exogenous rhythm of transfer of population from building category to | |
| Maximum growth limit of transfer of population from to | |
| Discount rate reflecting the subjective cost of equity and the cost of debt | |
| Technology maturity factors | |
| Variables | |
| Econometrically estimated useful energy demand for the specific end-uses | |
| Stock of building | |
| Annual growth rate of buildings stock | |
| Annual growth rate of new buildings | |
| Transfer of population from to | |
| Annual growth rate of transfer of population from to | |
| Investment expenditures for renovation (i.e., investment costs, hidden costs and/or subsidies) | |
| Annual costs of renovation (i.e., variable fuel and non-fuel costs) | |
| Present value of cost streams to compare alternative renovation strategies | |
| Frequency of choice of equipment strategies per building category | |
| Investment expenditures for energy using equipment (i.e., investment costs, hidden costs and/or subsidies) | |
| Annual costs of energy using equipment (i.e., variable fuel and non-fuel costs, and fixed operation and maintenance costs) | |
| Present value of cost streams to compare alternative dynamic strategies of energy using equipment | |
| Frequency of choice of equipment strategies per building category | |
Table 2.
Baseline scenario projections for the European Union (EU).
| Baseline Scenario, EU | 2015 | 2030 | 2050 |
|---|---|---|---|
| Residential sector | |||
| Average renovation rate per year (%) | 0.84% | 2.04% | 1.00% |
| Energy deepness of renovation (%) | 12% | 66% | 34% |
| Final energy consumption (Mtoe) | 300 | 224 | 192 |
| of which solid and liquid fossil fuels | 48 | 6 | 1 |
| of which natural gas | 113 | 82 | 55 |
| of which renewables | 43 | 32 | 20 |
| of which district heating | 24 | 17 | 12 |
| of which electricity | 72 | 87 | 105 |
| Share of electricity in total consumption (%) | 24% | 39% | 55% |
| Annual rate of energy savings (%) | - | 1.9% | 0.8% |
| Direct CO2 emissions (MtCO2) | 423 | 214 | 130 |
| Annual rate of change of direct CO2 emissions | - | −3.7% | −2.5% |
| Services sector | |||
| Average renovation rate per year (%) | 0.46% | 1.98% | 0.62% |
| Average energy savings per year, due to renovation (%) | 16% | 60% | 23% |
| Final energy consumption (Mtoe) | 161 | 127 | 133 |
| of which solid and liquid fossil fuels | 20 | 2 | 0 |
| of which natural gas | 52 | 32 | 17 |
| of which renewables | 5 | 4 | 3 |
| of which district heating | 11 | 8 | 7 |
| of which electricity | 73 | 81 | 105 |
| Share of electricity in total consumption (%) | 45% | 64% | 79% |
| Annual rate of energy savings (%) | - | 1.6% | −0.2% |
| Direct CO2 emissions (MtCO2) | 184 | 82 | 40 |
| Annual rate of change of direct CO2 emissions | - | −5.2% | −3.5% |
Note: energy deepness of renovation is measured as the amount of energy saved over energy consumption without renovation.
Table 3.
Long-term strategy scenario projections for the EU.
| Year 2050 | Energy Efficiency Scenario | Hydrogen and E-Fuels Scenario | Combined Scenario |
|---|---|---|---|
| Residential sector | |||
| Average renovation rate per year (%) | 1.77% | 1.21% | 1.59% |
| Energy deepness of renovation (%) | 55% | 42% | 52% |
| Final energy consumption (Mtoe) | 137 | 183 | 142 |
| of which solid and liquid fossil fuels | 0 | 0 | 0 |
| of which natural gas | 30 | 57 | 29 |
| of which renewables | 13 | 18 | 14 |
| of which district heating | 9 | 11 | 8 |
| of which electricity | 84 | 97 | 90 |
| Share of electricity in total consumption (%) | 61% | 53% | 63% |
| Energy savings from Baseline (%) | 28% | 5% | 26% |
| Direct CO2 emissions (MtCO2) | 60 | 45 | 12 |
| Change of direct CO2emissions from Baseline | −54% | −65% | −91% |
| Services sector | |||
| Average renovation rate per year (%) | 1.35% | 0.92% | 1.18% |
| Average energy savings per year, due to renovation (%) | 48% | 37% | 45% |
| Final energy consumption (Mtoe) | 89 | 123 | 96 |
| of which solid and liquid fossil fuels | 0 | 0 | 0 |
| of which natural gas | 12 | 17 | 11 |
| of which renewables | 2 | 3 | 3 |
| of which district heating | 5 | 7 | 6 |
| of which electricity | 69 | 97 | 76 |
| Share of electricity in total consumption (%) | 78% | 78% | 79% |
| Energy savings from Baseline (%) | 33% | 7% | 28% |
| Direct CO2 emissions (MtCO2) | 23 | 13 | 4 |
| Change of direct CO2emissions from Baseline | −42% | −68% | −90% |
Table 4.
Costs in the buildings sector, in the baseline scenario.
| Baseline Scenario, EU | 2011–2020 | 2021–2030 | 2031–2050 |
|---|---|---|---|
| Residential sector | |||
| Investment expenditure (Bn €) | 1161 | 1989 | 3988 |
| For the building shell | 201 | 479 | 641 |
| For equipment and appliances | 960 | 1510 | 3346 |
| Annuity capital payment (annual, on average, Bn €) | 204 | 347 | 461 |
| For the building shell | 10 | 53 | 101 |
| For equipment and appliances | 194 | 294 | 360 |
| Cost of purchasing energy products (annual, on average, Bn €) | 362 | 398 | 349 |
| Total cost of energy services (annual, on average, Bn €) | 566 | 745 | 811 |
| % change of operating expenditures (OPEX), from 2011–2020 | - | 10% | −4% |
| % change of capital expenditures (CAPEX), from 2011–2020 | - | 71% | 72% |
| Services sector | |||
| Investment expenditure (Bn €) | 384 | 607 | 1042 |
| For the building shell | 81 | 163 | 214 |
| For equipment and appliances | 303 | 444 | 828 |
| Annuity capital payment (annual, on average, Bn €) | 41 | 91 | 127 |
| For the building shell | 5 | 19 | 38 |
| For equipment and appliances | 36 | 73 | 89 |
| Cost of purchasing energy products (annual, on average, Bn €) | 188 | 213 | 216 |
| Total cost of energy services (annual, on average, Bn €) | 229 | 305 | 344 |
| % change of OPEX, from 2011–2020 | - | 14% | 15% |
| % change of CAPEX, from 2011–2020 | - | 58% | 36% |
Table 5.
Costs in the buildings sector, in the long-term policy scenarios.
| Average or Cumulative Values, in the Period 2031–2050 for the EU | Energy Efficiency Scenario | Hydrogen and E-Fuels Scenario | Combined Scenario |
|---|---|---|---|
| Residential sector | |||
| Investment Expenditures (Bn €) | 4703 | 3955 | 4520 |
| For the Building shell | 1045 | 692 | 890 |
| For Equipment and Appliances | 3658 | 3263 | 3629 |
| Annuity capital payment (annual, on average, Bn €) | 497 | 458 | 480 |
| For the Building shell | 118 | 103 | 111 |
| For Equipment and Appliances | 378 | 355 | 370 |
| Cost of purchasing energy products (annual, on average, Bn €) | 323 | 389 | 421 |
| Total cost of energy services (annual, on average, Bn €) | 820 | 846 | 902 |
| % change of OPEX, from the Baseline, in 2031–2050 | −7% | 11% | 21% |
| % change of CAPEX, from the Baseline, in 2031–2050 | 18% | −1% | 13% |
| Services sector | |||
| Investment Expenditures (Bn €) | 1227 | 1064 | 1226 |
| For the Building shell | 337 | 240 | 309 |
| For Equipment and Appliances | 890 | 824 | 917 |
| Annuity capital payment (annual, on average, Bn €) | 135 | 128 | 135 |
| For the Building shell | 43 | 39 | 43 |
| For Equipment and Appliances | 92 | 89 | 92 |
| Cost of purchasing energy products (annual, on average, Bn €) | 210 | 242 | 250 |
| Total cost of energy services (annual, on average, Bn €) | 345 | 369 | 385 |
| % change of OPEX, from the Baseline, in 2031–2050 | −3% | 12% | 15% |
| % change of CAPEX, from the Baseline, in 2031–2050 | 18% | 2% | 18% |
Table 6.
Structure of emissions reduction in the long-term policy scenarios.
| Calculated Using Cumulative Figures in the Period 2031–2050, in the EU | Energy Efficiency Scenario | Hydrogen and E-fuels Scenario | Combined Scenario |
|---|---|---|---|
| Residential sector | |||
| % contribution of Energy intensity to Emissions reduction from Baseline | 73% | 4% | 21% |
| % contribution of Carbon intensity to Emissions reduction from Baseline | 27% | 96% | 79% |
| % change of cumulative energy consumption from the Baseline | −12% | −1% | −11% |
| % change of cumulative CO2 emissions from the Baseline | −16% | −28% | −42% |
| % change of cumulative total energy costs from the Baseline | 1% | 4% | 11% |
| Services sector | |||
| % contribution of Energy intensity to Emissions reduction from Baseline | 89% | 7% | 27% |
| % contribution of Carbon intensity to Emissions reduction from Baseline | 11% | 93% | 73% |
| % change of cumulative energy consumption from the Baseline | −11% | −2% | −13% |
| % change of cumulative CO2 emissions from the Baseline | −12% | −28% | −41% |
| % change of cumulative total energy costs from the Baseline | 0% | 7% | 12% |
© 2019 by the authors. Licensee MDPI, Basel, Switzerland. This article is an open access article distributed under the terms and conditions of the Creative Commons Attribution (CC BY) license (http://creativecommons.org/licenses/by/4.0/).
Share and Cite
MDPI and ACS Style
Fotiou, T.; de Vita, A.; Capros, P. Economic-Engineering Modelling of the Buildings Sector to Study the Transition towards Deep Decarbonisation in the EU. Energies 2019, 12, 2745. https://doi.org/10.3390/en12142745
AMA Style
Fotiou T, de Vita A, Capros P. Economic-Engineering Modelling of the Buildings Sector to Study the Transition towards Deep Decarbonisation in the EU. Energies. 2019; 12(14):2745. https://doi.org/10.3390/en12142745
Chicago/Turabian StyleFotiou, Theofano, Alessia de Vita, and Pantelis Capros. 2019. "Economic-Engineering Modelling of the Buildings Sector to Study the Transition towards Deep Decarbonisation in the EU" Energies 12, no. 14: 2745. https://doi.org/10.3390/en12142745
Note that from the first issue of 2016, this journal uses article numbers instead of page numbers. See further details here.