Factors Influencing Electric Vehicle Penetration in the EU by 2030: A Model-Based Policy Assessment

E3MLab, Department of Electrical and Computer Engineering, National Technical University of Athens, 9 Iroon Politechniou Street, Zografou Campus, 15773 Athens, Greece
*
Author to whom correspondence should be addressed.
Energies 2019, 12(14), 2739; https://doi.org/10.3390/en12142739
Submission received: 21 June 2019
/
Revised: 10 July 2019
/
Accepted: 11 July 2019
/
Published: 17 July 2019
(This article belongs to the Special Issue Climate Changes and Energy Markets)
Abstract
:The European Commission (EC) has set ambitious CO2 emission reduction objectives for the transport sector by 2050. In this context, most decarbonisation scenarios for transport foresee large market penetration of electric vehicles in 2030 and 2050. The emergence of electrified car mobility is, however, uncertain due to various barriers such as battery costs, range anxiety and dependence on battery recharging networks. Those barriers need to be addressed in the 2020–2030 decade, as this is key to achieving electrification at a large scale in the longer term. The paper explores the uncertainties prevailing in the first decade and the mix of policies to overcome the barriers by quantifying a series of sensitivity analysis scenarios of the evolution of the car markets in the EU Member States and the impacts of each barrier individually. The model used is PRIMES-TREMOVE, which has been developed by E3MLab and constitutes a detailed energy-economic model for the transport sector. Based on model results, the paper assesses the market, energy, emission and cost impacts of various CO2 car standards, infrastructure development plans with different geographic coverage and a range of battery cost reductions driven by learning and mass industrial production. The assessment draws on the comparison of 29 sensitivity scenarios for the EU, which show that removing the barriers in the decade 2020–2030 is important for electrification emergence. The results show that difficult policy dilemmas exist between adopting stringent standards and infrastructure of wide coverage to push technology and market development and adverse effects on costs, in case the high cost of batteries persists. However, if the pace of battery cost reductions is fast, a weak policy for standards and infrastructure is not cost-effective and sub-optimal. These policies are shown to have impacts on the competition between pure electric and plug-in hybrid vehicles. Drivers that facilitate electrification also favour the uptake of the former technology, the latter being a reasonable choice only in case the barriers persist and obstruct electrification.
1. Introduction
In its Clean Planet for all [1] and European Strategy for low-emission mobility [2] initiatives, the European Commission (EC) confirmed the adoption of ambitious CO2 emission reduction objectives for the transport sector to 2050. The EC strategy aims at reaching at least a 60% reduction in greenhouse gas (GHG) emissions in transport by 2050 relative to 1990. This target was originally set in the White Paper [3]. Electrification of mobility is a valid option for supporting decarbonisation in the transport sector if electricity generation is also low in carbon emissions. Both options are part of the European strategy for energy and climate policies.
Electric vehicles, including battery electric vehicles (BEVs), plug-in hybrids (PHEVs) and range extenders (REEVs), started to slowly emerge in the markets during the last decade. The sales recorded an increase from 436.9 thousand units in 2017 to 636.5 thousand units in 2018, according to the European Alternative Fuels Observatory [4]. The increase in sales is noticeable, but there is room for improvement. Car manufacturers need to invest further to be able to deliver affordable alternatives to the EU car market, within a transition aiming at achieving CO2 emission reduction targets by 2030. The current planning foresees a reduction of average CO2 emissions of new car registrations in 2030 by 37.5% relative to 2021.
Several long-term scenarios foresee electrification of car mobility at least in the period after 2030 as a cost-effective option for decarbonisation in the EU and other countries. The usual scenarios combine electrification with a drop of battery costs driven by massive production and development of a large network for battery recharging [5,6,7,8,9,10].
Although the long-term picture seems clear enough according to studies found in the literature, the developments anticipated to take place in the early stages still remain uncertain. The decade 2020-2030 is crucial in preparing the grounds for the massive transition towards electrification. Investments in recharging infrastructure have to start as soon as possible, as its existence is important for the adoption of electric cars by consumers and range anxiety is considered a major obstacle. The battery industry needs to undergo technological restructuring, at least in the EU, and also invest in the learning potential. Decreasing battery costs is also decisive for consumers, as at present, electric cars are expensive compared to conventional technologies. Policy interventions intended to trigger the technology adoption process are also uncertain and seem costly in case it is decided to rely on car subsidisation.
The present paper explores the decade 2020–2030 while focusing on factors that may lead to successes or failures for the launching of the electric car market. Overcoming barriers deserves to become a policy priority, as it is of high importance, especially in the early stages of the electrification. A vast literature identified and analysed such barriers, including cost barriers [11,12], technical features of cars implying range anxiety [13,14,15,16] and dependence on availability and coverage of battery recharging networks [17,18]. The analysis presented in [19] confirmed that the barriers negatively impact on consumers’ perception of electric cars, causing uncertainty and reluctance to invest. Fiscal measures (i.e., subsidies) to incentivise the adoption of electric vehicles are proposed in the literature [20,21] together with innovative business models [22] for car marketing and the development of the recharging infrastructure [23,24,25].
Research and development policies and public-private partnerships are also important for tapping into the learning potential of batteries [26]. CO2 car standards, if anticipated to decrease over time, is an appropriate policy measure for building confidence about the development of a large market for batteries and electric cars in the future. Long-term visibility is the major precondition for the industry to embark in massive investment in new technologies and transform the car manufacturing sector on a large scale [27]. The development of battery recharging networks is at the discretion of public policy, either directly, in case investment is made by bodies subject to public regulation (e.g., distribution system operators and other licensed bodies), or indirectly, in case the state adopts the relevant legislative framework, also allowing private bodies to invest. All the factors mentioned in this paragraph require successful coordination and appropriate timeliness of decisions and construction works, in an aim to avoid market coordination failures, which are usual in such large endeavours.
This paper aims to provide a quantitative analysis of the factors influencing electric vehicle penetration in the EU in 2030. Model-based analyses of this type often assess the impacts of individual barriers or policy instruments [28,29,30,31]. However, there is a lack of comparative impact assessments of all the barriers/factors that influence the market uptake of electro-mobility technology.
The quantitative assessment uses a large set of scenarios-sensitivities (projection for the EU until 2030) performed using the PRIMES-TREMOVE energy economic model, developed by E3MLab. The model allows for an evaluation of the impacts of each barrier type on the market, and of the cost-benefit of policies that could remove those barriers. The analysis covers all 28 EU member states (MS), but the results presented in this paper are for the EU28, as a whole.
The barriers under consideration are split into: (1) Techno-economic uncertainty factors such as battery costs and vehicle range autonomy; (2) recharging infrastructure regarding coverage and timeliness of development. The model runs for a sensitivity analysis assuming different learning rates for the reduction of capital costs of batteries, which rely on data drawn from the literature.
The analysis considers three alternative trajectories for the development of the recharging infrastructure until 2030. The minimum case assumes development only in urban areas and almost no coverage outside of highly populated areas. The maximum case assumes a timely development of recharging infrastructure also outside the urban zones, mainly using fast recharging stations.
Regarding policy options, the paper uses the model to evaluate the impacts of various levels of CO2 standards on cars until 2030. The comparative assessment of model results (in total 29 cases) focuses on costs from the perspective of consumers and emission reductions on the horizon of 2030.
2. Methodology: Brief Presentation of the PRIMES-TREMOVE Transport Model
PRIMES-TREMOVE [32] is a large-scale economic-engineering model of passenger and freight transport and is part of the PRIMES modelling suite, a family of linked models covering all aspects of the energy system and the demand and supply sectors (see [33]). Recent applications of the PRIMES-TREMOVE model are found in [34,35]. PRIMES-TREMOVE projects are in future transport activity, the allocation of mobility to various transport modes (both road and non-road), the choice of technology for the dynamic renewal of the transport fleet, the use of the fleet in various trip types, the consumption of energy, emissions and costs. The dynamic projections cover the period until 2050 and 2070 by 5-year steps and for each European MS. The base year of the model is 2015. Figure 1 shows a schematic flowchart illustrating the interactions of the actors related to passenger transportation of households, as modelled in PRIMES-TREMOVE.
PRIMES-TREMOVE solves an equilibrium problem with equilibrium constraints and involves individual models for the demand of mobility and the supply by transport services and self-supply using private cars. The model solves a structural microeconomic optimisation problem for each decision-maker, with embedded technical constraints referring to transport engineering and behavioural parameters reflecting preferences, as well as to policy-related parameters that influence decisions. The decision-making problem runs dynamically in a sequential manner keeping track of all vintages of transport technologies.
Based on evolving technical and economic features of technologies and under the influence of policies, decision makers may purchase new transport means by making choices over a variety of candidate technologies and fuels, and may also consider a scrappage of old vintages. The demanders of mobility follow nested choices to allocate mobility and trip types to the transport modes, determine their rate of use and select technologies for investment. The choice controlling functions follow the discrete choice theory to adequately depict the heterogeneity of behaviours and decision circumstances and thus overcome the limitations of the representative agent hypothesis. The choice functions use utility and cost functions as arguments, which embed several parameters used to reflect behavioural factors (uncertainty, perceived costs, risk perception), as well as penalty factors to reflect technical, infrastructural and resource limitations, and policy-reflecting parameters.
The model simulates the balancing of demand and supply of transport services and self-mobility, through the concept of the generalised cost of transport which includes congestion (time of use), externalities and other factors along with costs. The model solves a mixed complementarity equilibrium problem, using the generalised cost of transport as a dual variable associated with the demand-supply balance. In a way, the model varies the generalised cost, which in turn influences the demand and supply behavioural modelling until reaching a balance. The cost of transport also includes transport fares that the model calculates endogenously on a cost-plus basis, eventually including subsidies for certain public transport means. The mixed complementarity equilibrium also includes overall policy constraints, reflecting policy targets, and uses the associated dual variables to influence demand and supply. The targets may concern emissions, efficiency and renewable energy targets.
Households are modelled to choose new vehicle equipment from a set of fleet and fuel choices provided by car manufacturers. Vehicle purchasing prices, as set by the manufacturing industry, change dynamically following cost-efficiency improvement curves that draw from engineering studies. Car manufacturers price their portfolio of electric vehicles (EVs) depending on the evolution of battery costs. Households compare costs, convenience and congestion to make a decision which also depends on penalty factors in case the density and coverage of refuelling/recharging infrastructure are not adequate. The model also includes subjective factors as additional costs. In this manner, the model captures travelling inconvenience (range anxiety), technical risk perceptions (regarding maintenance and performance), imperfect information and the opportunity cost of funding capital costs to reflect the consumer conservatism towards choosing a new technology like an EV. The various cost elements constitute components of the generalised unit cost of transport services.
The model represents public policy based on fiscal instruments (e.g., subsidies, tax exemptions, etc.), tolling and congestion pricing, CO2 or efficiency standards applying on vehicle manufacturing, overall policy targets and the extent and timeliness of infrastructure development. The model applies a penalty mechanism specifically by vehicle technology type, to discourage the production of vehicle varieties that do not comply with the standard, CO2 or efficiency or both. The model captures the effects of the refuelling and recharging infrastructure by splitting the trip types into stylised geographic areas (i.e., metropolitan, other urban, highways, and other roads). In addition, the model includes public policy, e.g., campaigns aiming to increase the awareness of the new technology and reduce the subjective surcharges and thus enable the emergence of the new technology in the markets.
3. Business-As-Usual Scenario
3.1. BAU Scenario Background
The business-as-usual scenario (BAU) projects the development of the EU passenger transport system following trends which assume the implementation of currently adopted national and EU policies and measures, but no new measures in the future. The set of policies and measures included in the BAU scenario is in line with the Reference Scenario 2016 of the European Commission [36].
In particular, the BAU scenario does not include the most recent policies targeting car manufacturers (i.e., the post-2020 targets on car manufacturers). The projections of the business-as-usual scenario also consider member state-specific policies, such as mandatory blending obligations of biofuels, as well as incentives for the promotion of vehicles with advanced powertrains, such as subsidies, lower taxation and premiums and plans to support the electrification in private road transport. The BAU scenario follows the technology cost assumptions of the Reference Scenario 2016 and assumes a relatively pessimistic trajectory by 2030 (i.e., they are assumed to reach approx. 300 $/kWh by 2030). These assumptions are generally in line with the least optimistic developments from the analysis in [26].
3.2. BAU Scenario Results
Table 1 shows the main results of the business-as-usual (BAU) scenario related to passenger activity, energy consumption and CO2 emissions from passenger cars. The activity of passenger cars increases by 0.8% p.a., driven by income growth and increased motorisation rates in the low-income EU Member States. The projection assumes that car manufacturers comply with the CO2 emission standards, by marketing vehicles based on advanced internal combustion engines (ICE) and some of them equipped with a hybrid system on their powertrain. The share of vehicles with conventional ICE powertrains reduces in the BAU, mainly because of the penetration of full hybrids and to a less extent, plug-in hybrids. Despite a relative decline in their use, conventional ICE powertrains remain dominant in the market until 2030, as the scenario assumes no additional policies.
The policies promoting electrification are weak in the BAU scenario, and remain at the discretion of national governments. Thus, they are not sufficient to drive the penetration of electric cars in the BAU scenario, and in 2030, electrification remains a niche market with a maximum penetration of 7% for passenger mobility in the EU. The stock of EV vehicles represents only 5% of the entire fleet of passenger cars in 2030.
The demand for oil products for cars decreases by 1.5% p.a. in the period from 2010 to 2030, mainly due to currently applied car standards. The share of biofuels in the energy mix is mainly driven by the legally binding target of 10% renewable energy in the transport sector (RES-T target) and by the reduction target mandated by the Fuel Quality Directive, and its amendment as in the ILUC Directive (EU 2015/1513). The legislation drives an increase in biofuels, which succeed to cover only 7% of the energy consumption of private cars by 2020. Beyond 2020, the amounts of biofuels remain relatively stable, assuming no further tightening of the RES-T targets in the BAU scenario. CO2 emissions from passenger cars decrease over time (1.3% p.a.), driven by the efficiency gains driven by the current car standards. The reductions seem to slow down after 2020, as the scenario assumes no new policies.
4. Sensitivity Analysis Runs: Design and Results
4.1. Design of the Scenarios
The model runs for sensitivity analysis which are variants of the main transport decarbonisation scenarios. The general policy context of a decarbonisation scenario assumes that all decision-makers in all sectors, including the transport sector, are aware of ambitious emission reduction targets for 2050 and anticipate structural changes in technology choices and energy markets. This awareness may induce a removal of non-market barriers, at least partially, and the easiness of market uptake of clean and advanced technologies in all sectors. It also induces good visibility of enlarged future markets for new technologies, which enables tapping into the potential of learning by manufacturers and technology developers. In this context, battery manufacturing also benefits and expects a high potential of cost reduction in the future, accompanied by an improvement of performance. At the same time, positive anticipation of electrification incites private investors and public policy-makers to develop a recharging and refuelling infrastructure for clean alternative fuels with adequate timeliness and sufficient coverage of urban and non-urban areas. Hence, current barriers impeding market uptake of EVs are alleviated.
Although the long-term prospects seem robust, the transition during the early stages of the process appear to be uncertain from various points of view. To explore these uncertainties, the paper quantifies several sensitivity analysis scenarios which evaluate the impacts of market barriers related to infrastructure availability and battery costs, as well as several policy options for CO2 standards. In particular, the paper discusses the impacts of different battery cost trajectories and varying degrees of coverage, and electricity recharging network availability in the presence of different CO2 standards for car manufacturers. The sensitivities consider three different time series of CO2 standards for the period until 2030, all foreseeing a decrease in the standard over time. The three standard cases are different from those presented in the announcements of the European Commission for the CO2 standard for cars until 2030.
The assumptions on the evolution of the market barriers in the respective scenarios-sensitivities are discussed in more detail below.
4.1.1. Assumptions on the Development of Battery Costs
The evolution of battery costs is a key factor for market acceptance of electric vehicles by the consumers since batteries can considerably increase the purchasing price of the vehicle. The literature suggests that there is high uncertainty with regards to the cost reduction possibilities of the battery unit cost (usually expressed in terms of €/kWh). However, recent publications suggest that the learning potential may be higher than the estimated levels, as a considerable reduction of battery costs has taken place over the last 2–3 years, at a much faster pace than anticipated a few years ago.
This study considered three alternative trajectories regarding the development of battery costs until 2030, assuming optimistic, pessimistic and expected battery costs. The data draw on [26]. Battery costs decrease from 2020 onwards and influence market sales in the EU car fleet mainly between 2025 and 2030. In the pessimistic scenario (low learning case), battery costs reduce down to approximately 300 $/kWh in 2030 (same as in the BAU scenario). In the most optimistic scenario (high learning case), the cost is assumed to approach 120 $/kWh. The medium trajectory (medium learning case) assumes that costs decrease to 200 $/kWh in 2030. The battery costs appear in the model in the form of additional costs for the BEVs and PHEVs.
4.1.2. Assumptions on the Development of Recharging Infrastructure
The market uptake of electric vehicles strongly depends on future availability of recharging infrastructure and the degree of its coverage. A well-developed network of recharging points is likely to increase consumer acceptance of electric vehicles by reducing uncertainty regarding range anxiety. The model distinguishes the following cases regarding the development of the recharging infrastructure:
- Level I: Slow home charging points (3 kW AC), providing a full charge usually within 8 h. They are designed to equip the homes of EV users and can provide a full charge of the vehicle overnight.
- Level II: Semi-fast (22 kW AC) public charging points, located at parking lots and supermarkets and providing a full charge with 2-4 h, and
- Level III: Fast (50 kW DC) charging points, providing a full charge within approx. 15–20 min. Fast charging points aim to provide vehicle users with additional battery autonomy for longer trips and with charging times as close as possible to the duration of a typical refuelling at a conventional petrol station. These points are more likely to be located on central nodes outside metropolitan areas.
The scenario design considers three alternative options for the coverage of the recharging infrastructure until 2030.
- (i)
- In the worst case scenario, users of electric vehicles can charge their vehicles mainly at their residences (i.e., Level-I charging points), as there is only minimum coverage of other places in urban areas, and almost no coverage outside highly populated areas.
- (ii)
- The medium case assumes that the coverage of the recharging infrastructure develops in clusters within urban areas (mostly Level-II charging stations). The users driving within urban areas do not face recharging limitations, however, the coverage outside urban zones is minimum.
- (iii)
- In the best case scenario, there is also a timely development of recharging infrastructure, but coverage is much broader also outside the urban zones, mainly based on fast recharging stations (Level-III stations).
The model uses data ratios of the number of electric cars being served by type of recharging point, drawn from the literature [37,38]. The size of the recharging infrastructure is endogenous in the model depending on the assumptions about the pace of investment and the geographic priorities of development, in conjunction with the size of the EV car market and its distribution by geographic area. For this calculation, the model makes the following typical assumptions:
- Level-I private home chargers, mainly deploying in urban areas, can serve 4 EVs per 3 chargers on average, as in highly populated regions space limitations apply.
- Level-II charging stations can serve 20 EVs per station in the early stages of infrastructure development and can serve 17 EVs per station when the infrastructure is large.
- The Level-III charging stations can serve approx. 100 EVs per station.
- The assumed ratios consider the possibility that the EVs owners may not fully recharge their car at home but only partially. Τhey may also use Level-II charging stations to serve commuting and leisure mobility travelling. A broad development of the infrastructure can facilitate fast recharging and thus it can include the development of Level-III charging stations. Fast DC charging points mainly facilitate inter-urban mobility for EV cars.
The model includes the electricity recharging infrastructure costs as part of the total transport system costs and the total investment expenditures. The recovery of infrastructure costs is endogenously modelled. An additional fee is added to the prices of electricity for consumers charging the batteries. The authors assume a business model for the infrastructure that applies tariffs based on the calculation of the present value of a regulated asset basis divided by the present value of expected demand for electricity for battery recharging over a long period. In this way, a levelized unit cost of the infrastructure that is fully recouped by the fee applying on electricity prices can be calculated. The same approach is applied for the recovery of incremental investment expenditures needed to reinforce the electricity distribution system to accommodate the additional demand due to the recharging of batteries. An additional fee for the grid reinforcements applies on electricity prices for electric car users, defined so as to recoup the corresponding investment expenditures.
4.1.3. Sensitivity Analysis on the Policy Intervention
The European Commission has clearly announced the evolution of CO2 emission standards that apply, on average, to the sales of car manufacturers in the EU. The policy foresees a reduction in the value of the standard (i.e., 37% reduction in 2030 relative to 2021). The application of the standard refers to a recently revised test cycle of emission measurements (WLTP, Worldwide Harmonised Light Vehicle Test Procedure, which replaced the NEDC, New European Driving Cycle).
For analytical purposes, the modelling considers different reduction paces of CO2 car standards, to assess the relationship between the standards and the barriers, which concern battery costs, range anxiety and infrastructure availability.
Table 2 summarises the assumptions about the standards in the various cases modelled. The targets assumed by the model are based on the NEDC test cycle and not on the WLTP test cycle. The most optimistic scenario assumes a standard of 70 gCO2/km in 2030, while the least optimistic a standard of 80 gCO2/km. As already stated, the scenario that represents a business-as-usual case assumes the same target throughout the projection period.
Table 3 defines sensitivity scenarios as combinations of policy intensity for infrastructure, battery cost reduction and CO2 car standards. The table also shows the scenario acronyms.
4.2. Model Results
4.2.1. Impacts on Market Shares of EVs
The model projects the EV market shares until 2030 by scenario depending on the assumptions of each scenario, as shown in Table 3.
Figure 2, based on the model results, illustrates how several combinations of CO2 car standards, infrastructure coverage and cost reduction of batteries drive the market share of EV cars in the EU in 2030. The variation range of the share is large. The minimum is 7% and the maximum is 18%. The drivers do matter for the share of EVs and the model projections go further until 2050. Due to lack of space, this paper does not show the projections after 2030. Nevertheless, it becomes clear that the share achieved in 2030 also matters for the share in the period after 2030, and at least until 2040. Therefore, it is proposed that the policy choices behind the three drivers are of strategic importance for car mobility electrification.
High infrastructure coverage and high reduction of battery costs can lead to the highest EV market share in 2030 when combined with the most stringent CO2 standard. Conversely, the lowest EV market share in 2030 occurs when the pessimistic assumptions prevail for both the infrastructure and the battery costs, while the less stringent CO2 standard also applies.
Based on the model’s results, it is inferred that the tightening of the CO2 regulation on car manufacturers is a strong driver of EV market penetration in all cases assumed in the scenarios, irrespective of the particular assumptions made for costs and infrastructure. More specifically, the EVs reach 18% of the total car fleet in 2030 under the assumptions of the best-case scenario, assuming the tightest regulation (70 gCO2/km). The model’s results show that the stock of BEVs and PHEVs increases by 2.6 percentage points and 2.0 percentage points respectively in 2030, when tightening the standard to 65 gCO2/km compared to a scenario with a 70 gCO2/km standard.
The model’s results show that the combination of stringent CO2 car standards and high battery cost reduction can lead to similar levels of penetration of electric vehicles under high battery cost reduction and high infrastructure coverage, but only when combined with low policy intervention (i.e., 80 gCO2/km). However, the adoption of strict standards (i.e., 70 gCO2/km) is the main driver of market penetration of EVs and is effective even when the coverage of infrastructure is low (only in urban zones). In this case, EV cars conquer the urban mobility markets.
In case of a low reduction of battery costs, adopting more stringent CO2 standards, i.e., from 80 to 70 gCO2/km, can add six percentage points to the share of EVs in 2030, irrespective of the infrastructure coverage. Low coverage of the infrastructure leads to a drop of EV shares of 2–3 percentage points, on average across the scenarios. When the standard is set at 80 gCO2/km, the other two factors imply that the EV shares have a maximum variation of 8 percentage points. However, when the standard is at 70gCO2/km, the variation in terms of EV share is 3 percentage points.
All three factors appear to have significant impacts on the market uptake of electric cars by 2030 in the EU. The authors consider the model’s results for 2030 as a sample of meta-data that are used for statistical analysis.
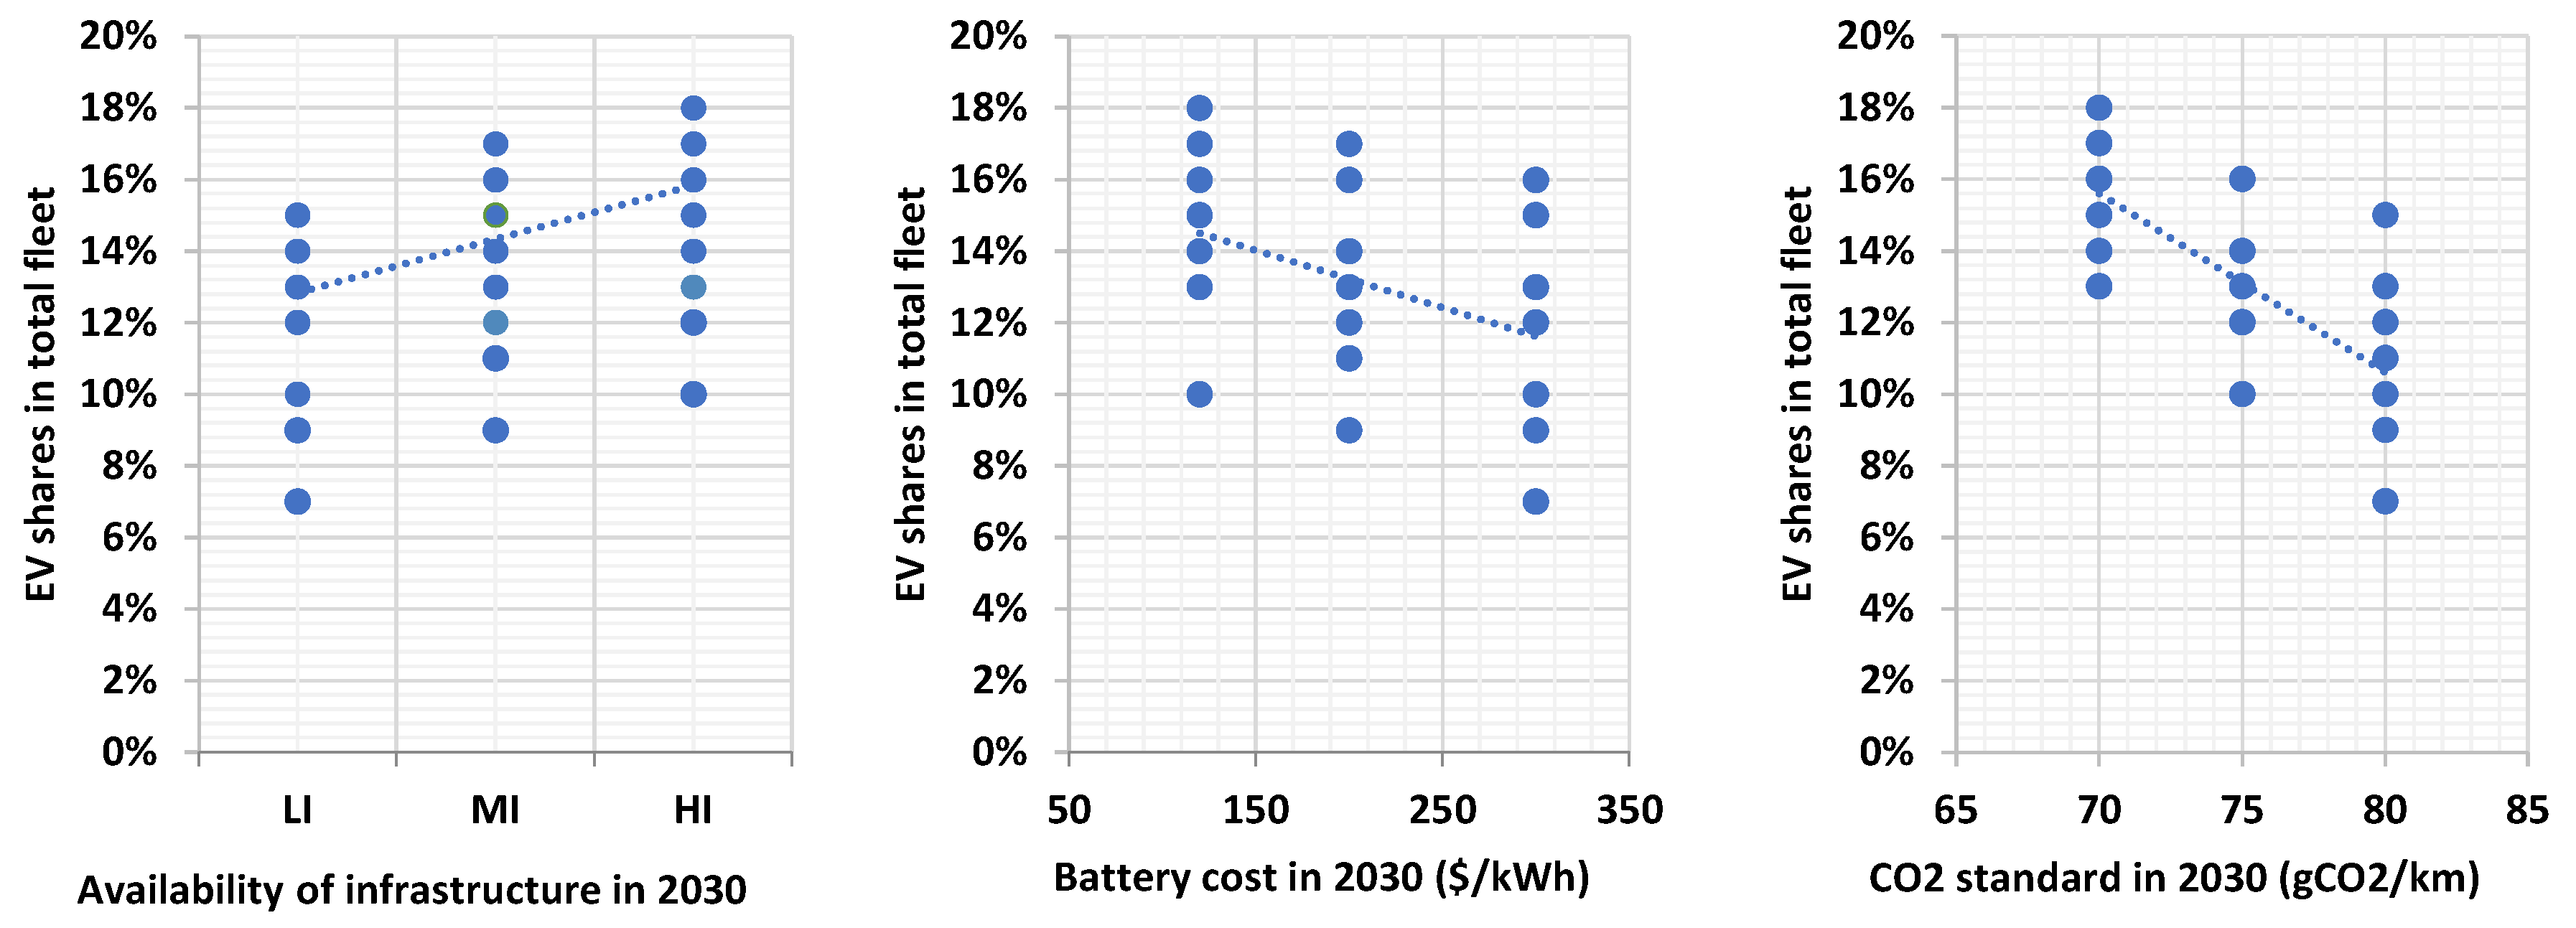
Based on the meta-data, the CO2 standard seems to have the largest impact, as the range of the median values of EV shares reach 6 pp. in 2030. The same range reaches 3 pp. for the infrastructure and battery costs. Figure 3 illustrates the effect of the three factors on the share of EVs in 2030, by plotting each factor alone. The dots represent EV market shares in 2030 for the various model runs.
To get a better insight into the simultaneous effects of the three factors on EV shares in 2030, a multiple regression estimation is performed which attempts to explain the EV market share through the logarithms of the values of the three factors. For the regression, the authors use the number of recharging points for the infrastructure, the unit cost of batteries and the value of the CO2 car standard in 2030. As shown in Table 4, all three factors are highly significant statistically, as also is the multiple regression. The elasticity values (ratio of percentage changes) derived from a log-linear model are 0.23 for the infrastructure, −0.26 for the cost of batteries and −3.01 for the value of the CO2 car standard.
CO2 standards are highly important as stringent standards may eliminate EV competitors. Improved ICE engines and mainly the use of (non-plugin) hybrids can compete with EVs only up to a certain extent and can lose shares in the market if the CO2 standard is below a certain threshold. At the same time, other alternatives to EVs such as fuel cell cars or ICE cars, using entirely carbon-neutral fuels (e.g., e-fuels, or fully fungible advanced biofuels), are not expected to be mature or available in the market until 2030. According to the results shown above, a policy ambitiously combining the three factors can induce 2–3 times the higher market share of the EVs in 2030, compared to a weak policy for all the three factors. A policy implication is that the decade 2020–2030 is important for successfully launching the EV car market regarding infrastructure development and the achievement of cost reduction in the battery industry, while stringent CO2 car standards need to accompany structural policies during the same decade.
4.2.2. Impacts on the Relative Sales of Battery Electric Vehicles and Plug-in Hybrids
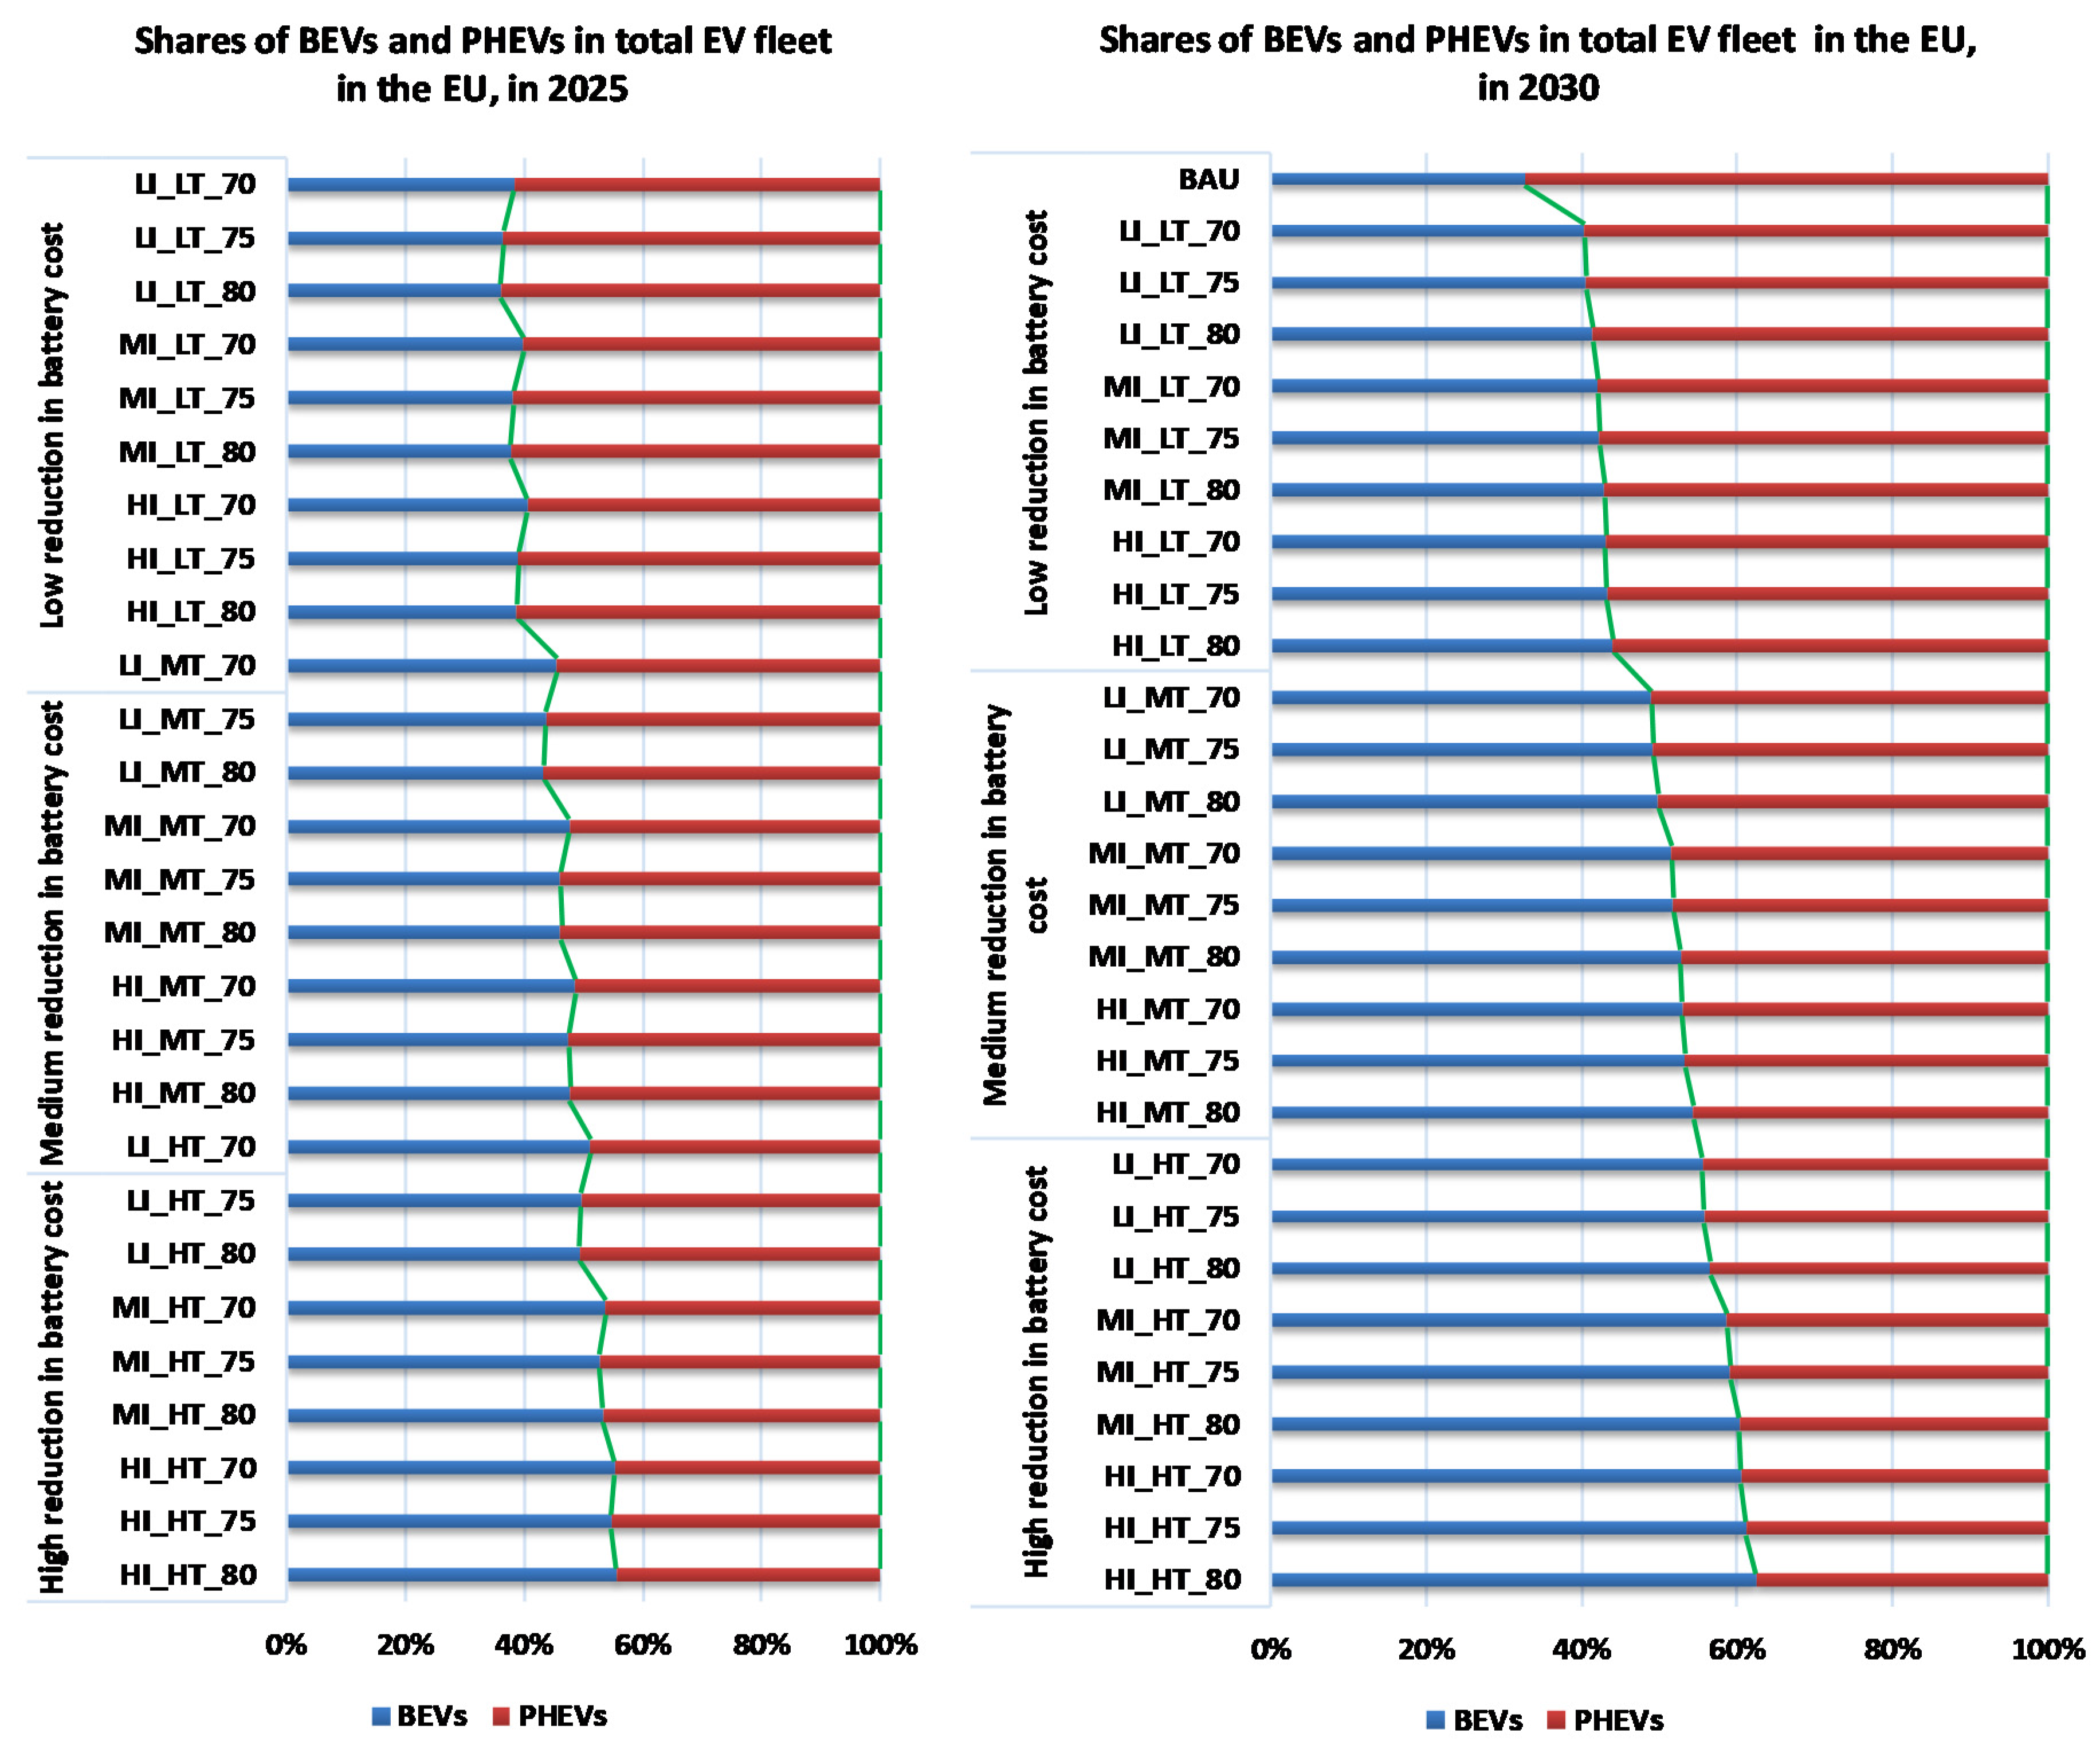
The choice of the type of electric vehicles, i.e., the uptake of BEVs versus PHEVs, also depends on the three factors that vary among the scenarios. The model’s results seem to indicate that the most important factor influencing the choice of the type of electric vehicle is the cost of batteries, as they evolve in the future. In scenarios including high battery cost reduction, the share of BEVs in the total fleet of electric vehicles is high, to the detriment of PHEVs. Inverse shares occur in scenarios that include low battery cost reductions. Figure 4 presents the relative shares of BEVs and PHEVs across all scenarios for 2025 and 2030.
BEVs are likely to get the lowest shares in the BAU scenario (27% and 33% for 2025 and 2030, respectively) in comparison to PHEVs, which get two-thirds of the market for electric cars. The BAU conditions, i.e., lowest end for all three factors, are detrimental to the market uptake of BEVs. Their shares in the BAU are the lowest among all scenarios.
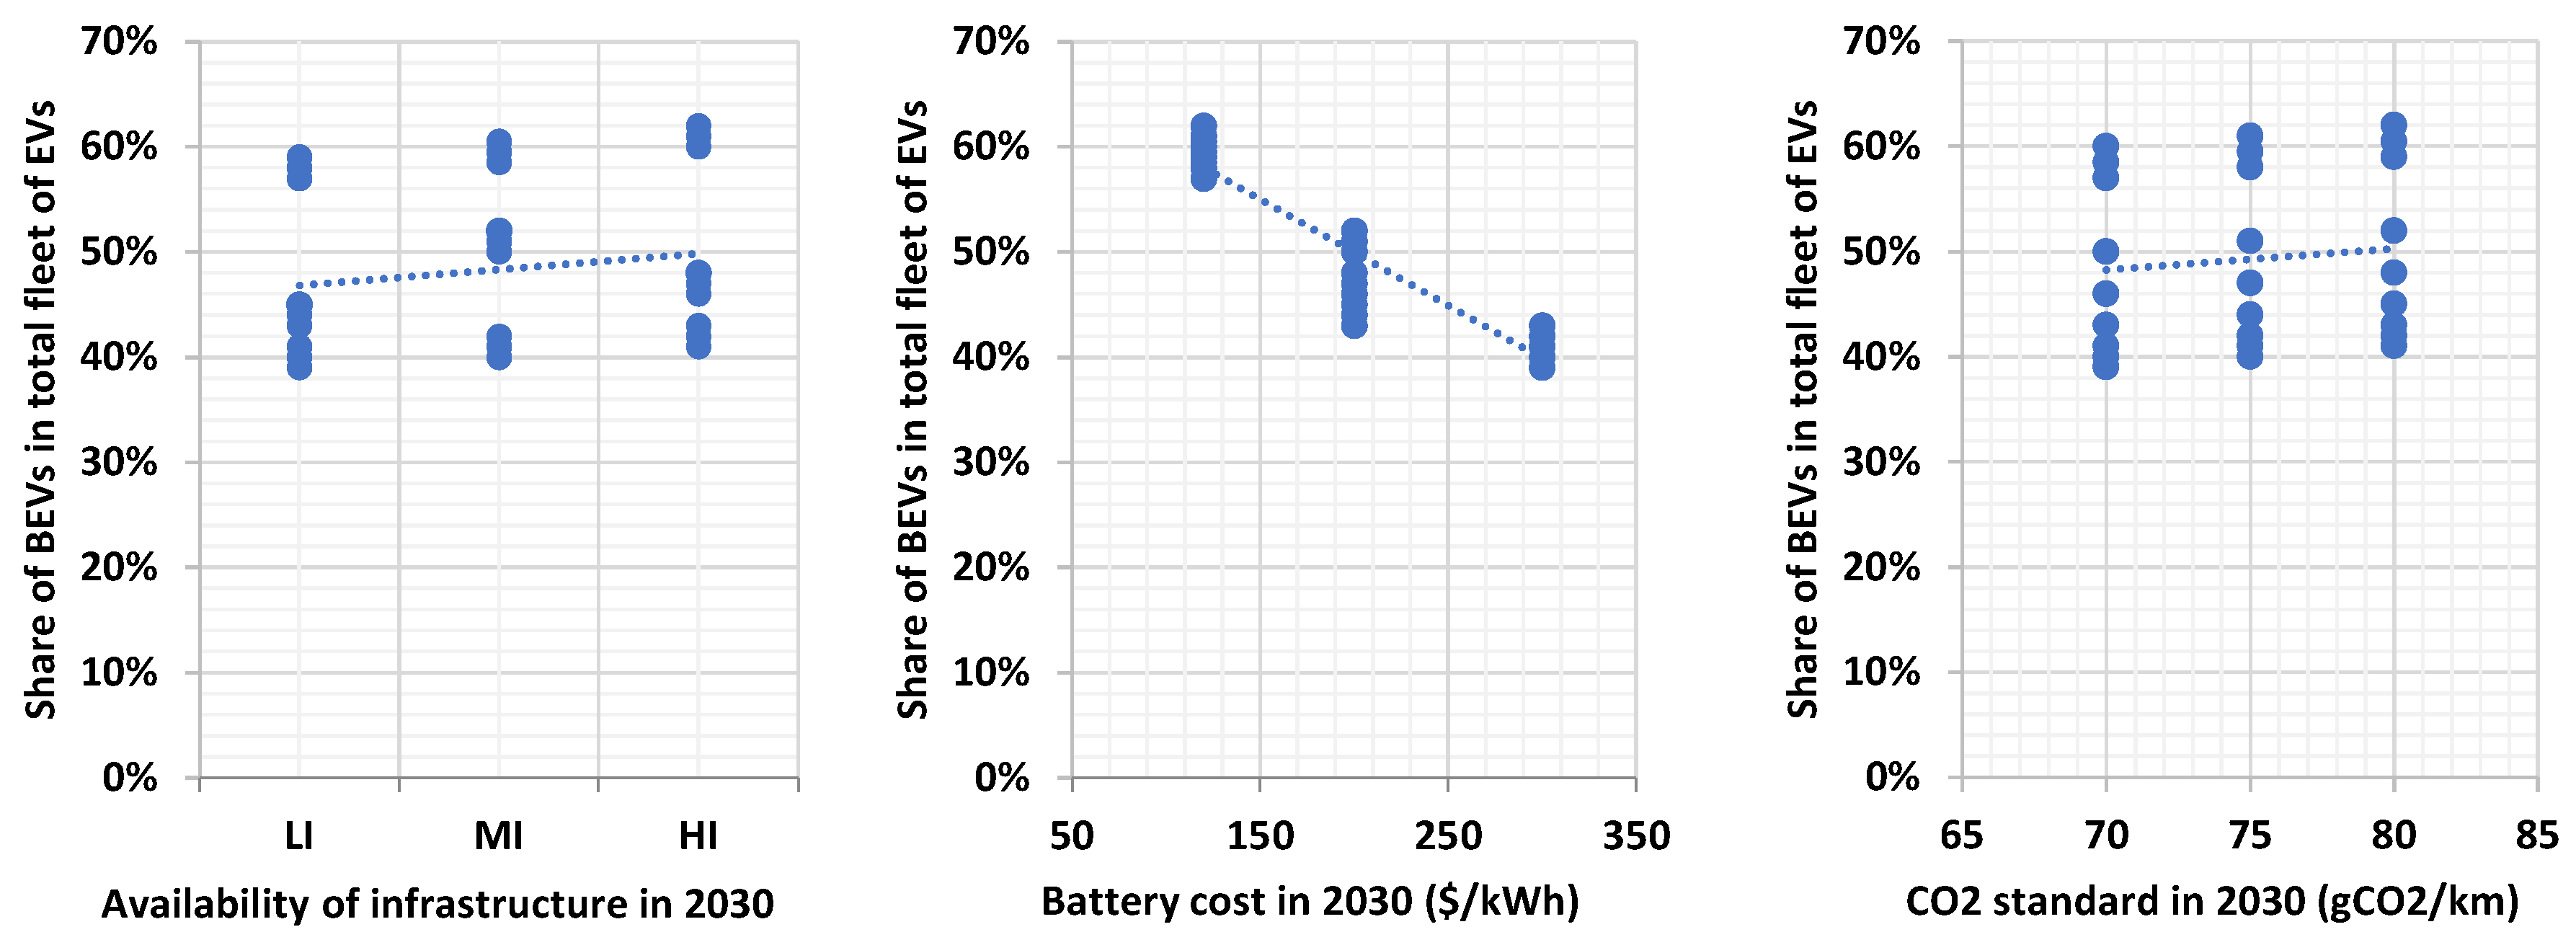
The maximum share of BEVs in the total stock of EVs in 2030 occurs when the cost of batteries achieves the lowest values, and when infrastructure develops at the highest possible coverage. The reason is that BEVs can achieve significant savings in fuel expenditures compared to any other technology (including PHEVs), and this advantage pays off when capital costs are the lowest possible due to the decrease in battery costs. Range anxiety is also the lowest possible, due to the maximum possible development of the infrastructure. In the most optimistic battery cost reduction scenarios, the relative share of BEVs compared to PHEVs is likely to range from 56% to 67% in 2030.
Contrastingly, when capital costs are less competitive for the BEVs due to the high battery costs and range anxiety is significant due to the low density of the infrastructure, the shares of the BEVs in the total fleet of EVs is low. They could reach a share of 50% in the case of medium developments for battery costs and infrastructure, and even less than 40% in the most pessimistic developments scenario for battery costs and infrastructure. The contrast between shares in 2030 is much lower in 2025, as the electric vehicles market is still small.
As expected, the stringency of CO2 standards is more beneficial for the BEVs as they are purely electric and emit no carbon dioxide compared to the PHEVs. However, as the CO2 standards in 2030 are not yet below the threshold that can eliminate PHEVs, the impact on the choice of electric car types is limited compared to the effects of the other two factors.
The plots in Figure 5 show that the shares of BEVs in the total fleet of electric cars in 2030 are strongly and negatively correlated with battery costs, albeit weakly correlated with the development of infrastructure and the stringency of CO2 standards. The authors further perform a multiple regression of the share of BEVs in the fleet of electric cars in 2030 explained by the three factors. Table 5 shows the statistical results. The regression is highly significant in statistical terms, but the battery costs are the only variable for which there is full statistical confidence. Statistically, the other two factors are of small significance. Therefore, the statistical analysis confirms that for 2030, the cost of batteries is the decisive factor for the market success of pure electric cars to the detriment of plug-in electric hybrid cars. The value of elasticity of the share of pure electric cars within the fleet of electric cars in 2030, depending on battery costs, is roughly −0.40. The stringency of CO2 standards has a positive influence for the promotion of the BEVs to the detriment of the plug-in technology, as found in the statistical analysis, but the statistical significance of the coefficient is doubtful. This is related, however, to the range of CO2 standards assumed in the scenarios, as it does not include highly stringent standards because they are not relevant for the horizon until 2030.
4.2.3. Impacts on Final Energy Demand
As expected, in the BAU scenario, the petroleum products dominate fuel consumption by cars in the EU by 2030, maintaining a share close to 90% of the total, as restructuring policies are by this assumption weak in this scenario. Electrification is promoted in all alternative scenarios, albeit with policies of different intensity. Achieving maturity in the market for battery-based vehicles is a tedious process and cannot happen in a short interval (e.g., ten years), as building the infrastructure and achieving battery cost reductions need significant development time.
Consequently, the share of electricity in total energy consumption of cars remains relatively modest in the alternative scenarios for 2030 and range between 2–6%, depending on the intensity of the supporting policies. However, the consumption of electricity increases between 60% and 260% in the scenarios compared to the levels of BAU in 2030, as shown in Table 6. The range of the increase appears to be small at a first glance, but getting close to the high end of this range is important in cases where this is seen as the basis for launching the full transition to the electrification of cars in the period after 2030. Also, electric cars are roughly three times more efficient than ICE cars, and thus the relatively modest amounts of electricity consumption are not indicative of the share of EVs in the total stock of cars in 2030 in the alternative scenarios.
As shown in Table 6, the reduction in the consumption of petroleum products ranges between 6% and 16% in 2030 compared to the BAU, and of course, the largest decrease corresponds to the maximum intensity of the policies, which at the same time induce the highest demand for electricity among the sensitivity scenarios.
The decrease in consumption of petroleum products also implies a reduction in the consumption of biofuels, as, by assumption, biofuels develop as liquid fuels blended with mineral oil fuels by 2030. It seems difficult to develop fungible advanced biofuels, at least on a significant scale, on the 2030 horizon, as the production technologies have not yet reached the necessary technology readiness level. Electricity, therefore, seems to displace biofuels, albeit modestly, in the sensitivity scenarios, which is paradoxical from a climate policy perspective, but at the same time also explicable, due to the lack of advanced biofuel technologies. The stringency of the CO2 car standards also drives an increase in the consumption of gaseous fuels in 2030, as the emission factor is slightly lower than petroleum products (at least for natural gas).
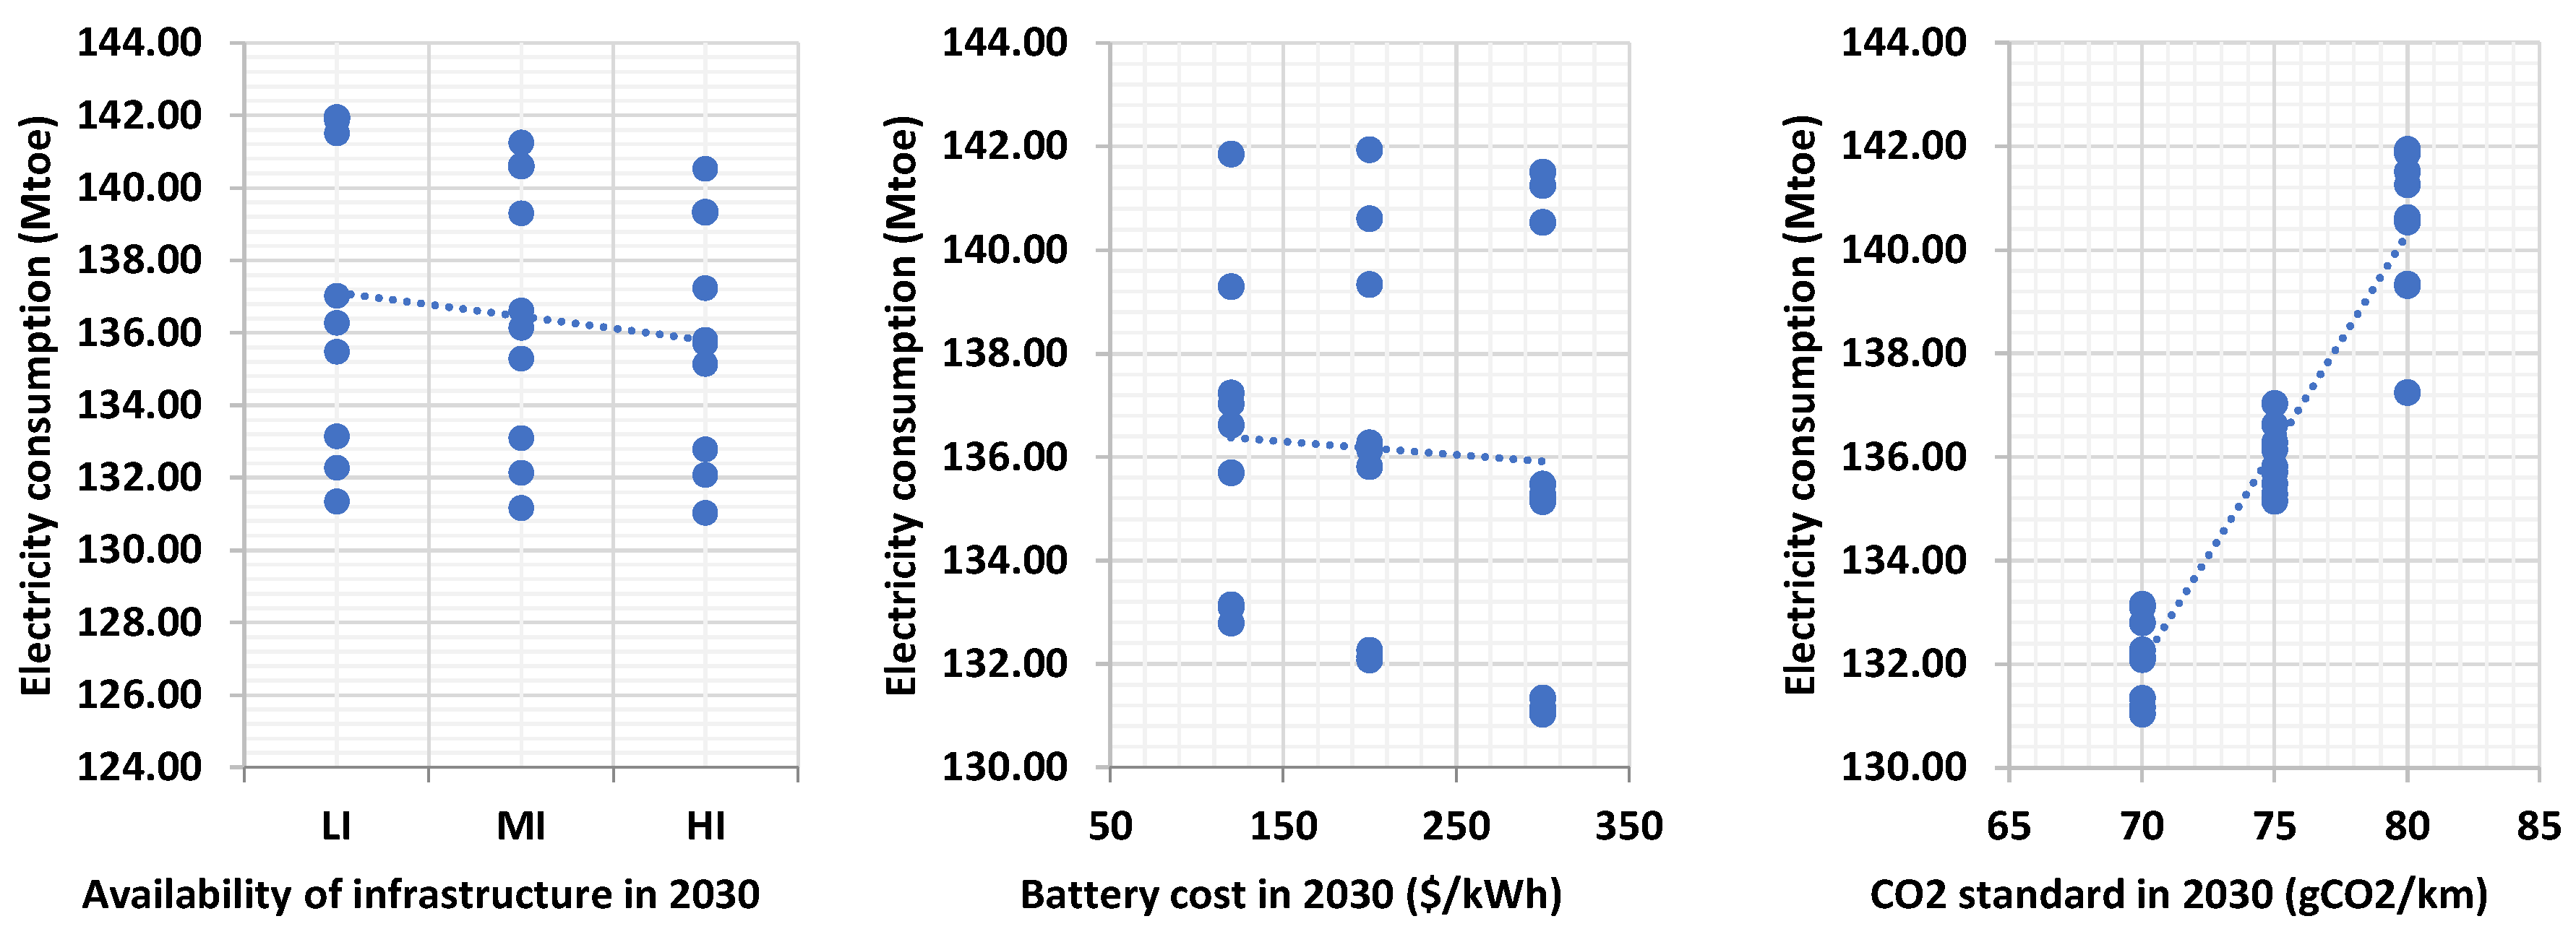
The meta-data generated by the model for the sensitivity analysis scenarios allowed a statistical analysis of the dependence of electricity consumption on the three factors analysed in this paper, namely infrastructure, battery costs and CO2 car standards.
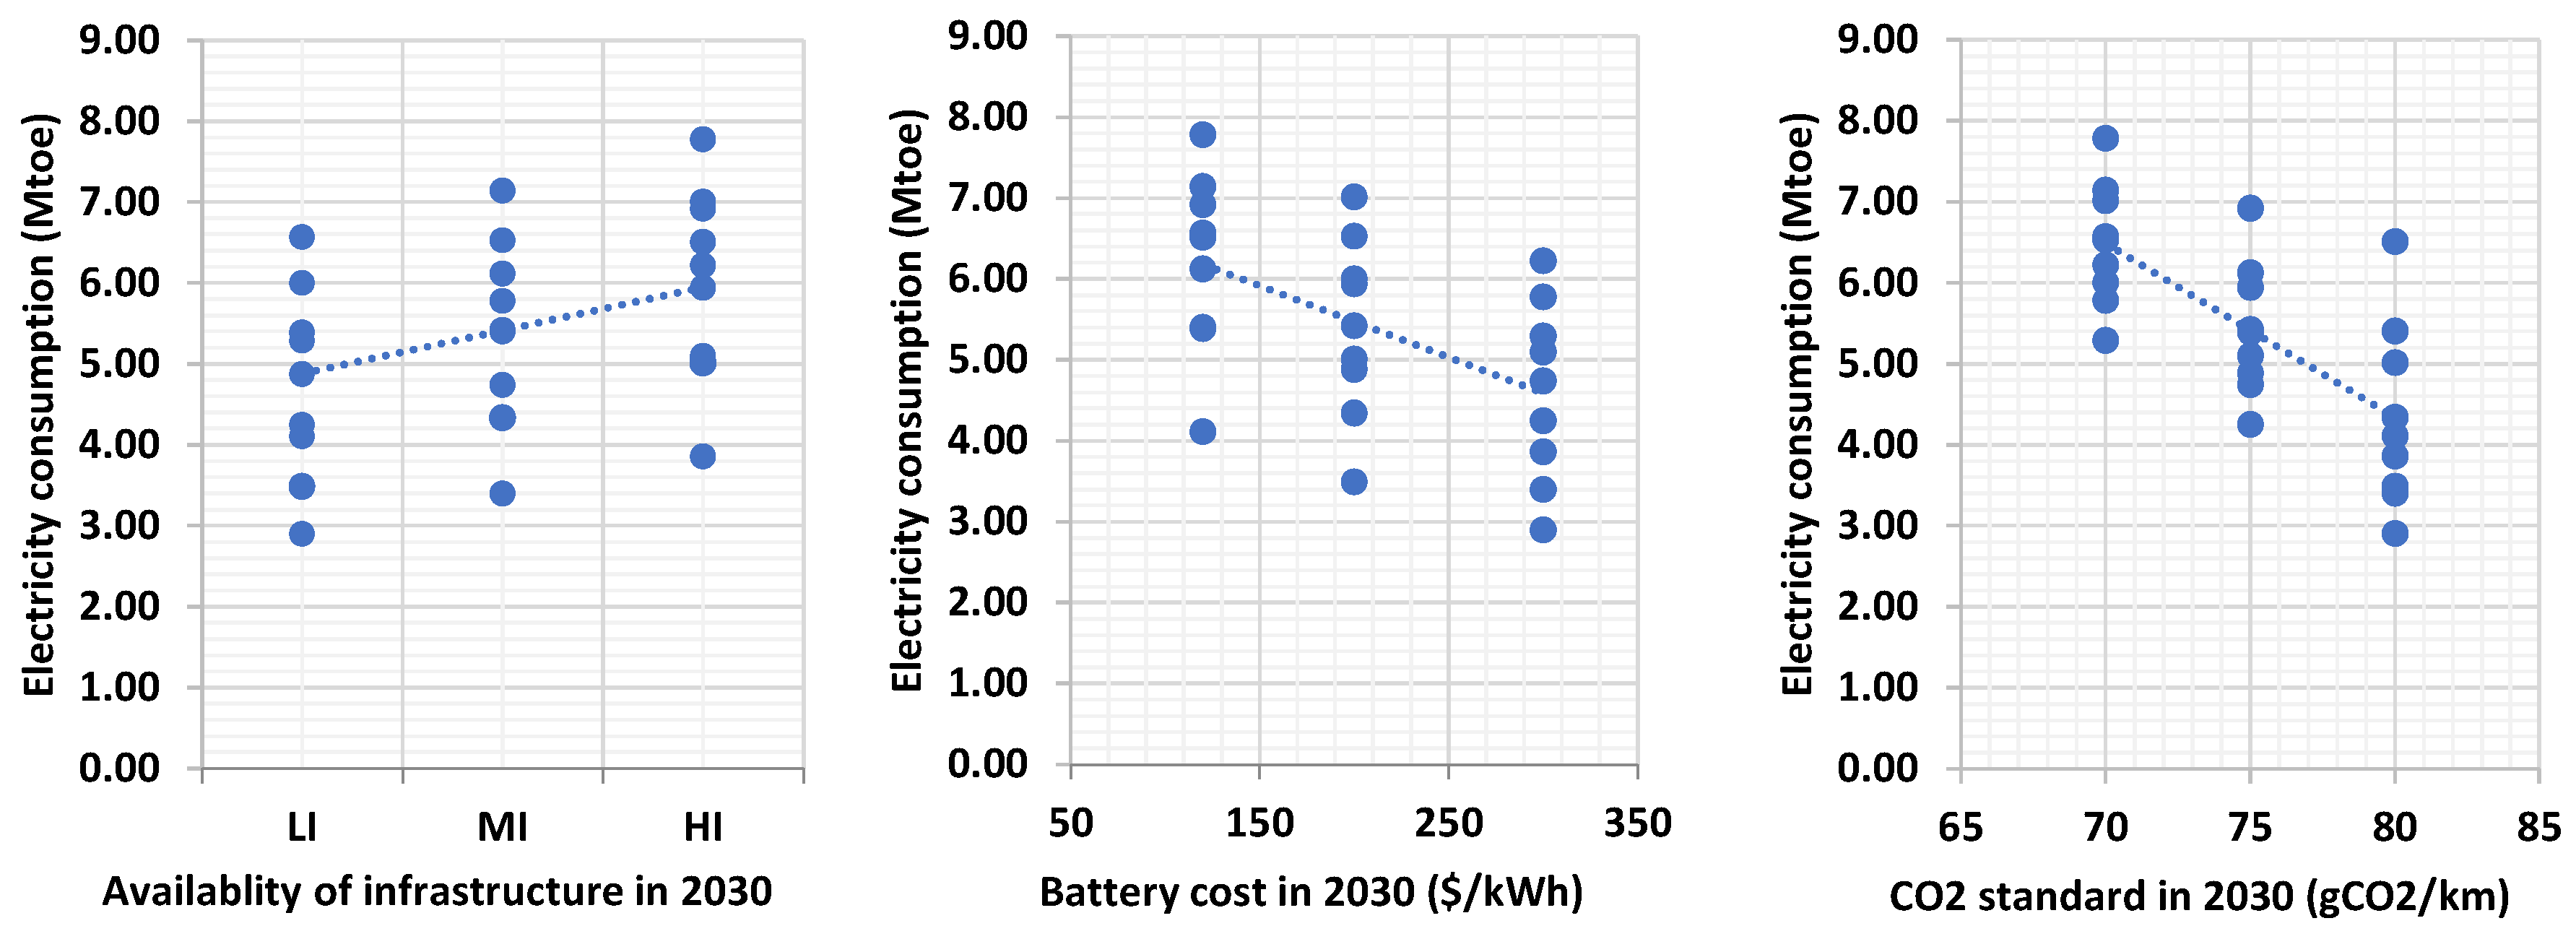
As shown in Figure 6, all three factors appear to exert a significant influence on electricity consumption in 2030. The increase in the coverage of the recharging infrastructure influences electricity consumption positively. The infrastructure alone can induce 1.3 Mtoe in 2030 of additional electricity demand compared to the BAU. The reduction in battery costs is also an important driver pushing consumption of electricity upwards. Battery cost reductions can drive 1.8 Mtoe of additional electricity demand. The largest positive effect on electricity consumption derives from the CO2 standards, which alone can increase demand for electricity by 2.0 Mtoe on average.
The statistical analysis for the market shares of battery-based cars, as presented above in Table 4, has led to similar conclusions, showing, in fact, there is a strong positive correlation (value of elasticity 1.05) between the consumption of electricity and the market share of electric cars in 2030. However, a similar analysis, presented in Table 5, concerning the market share or the BEVs has found a weak correlation of the shares with demand for electricity, probably because the BEV technology is very efficient in the consumption of electricity.
The multiple regression of electricity consumption, as seen in Table 7, using the three factors as independent variables, confirms that the CO2 car standard exerts the highest inducement of electricity demand reduction among the three factors. The statistical significance of the regression is robust and the statistical confidence is very high for all the estimated coefficients. The values of the coefficients coincide with elasticity values, the most important of which is the elasticity for CO2 car standards.
It is worth examining statistically the correlation of the three policy factors with total energy consumption by cars in 2030, with the aim of evaluating the implications for energy efficiency, which is among the main objectives of the EU policy during the period until 2030.
As depicted in Figure 7, the distributions seen separately for each of the factors clearly indicate that only the stringency of the CO2 car standards has a robust causality with total final energy consumption of cars in 2030, towards improving the energy efficiency of car transport as a whole. The various car standards considered in the analysis imply a range of impacts on energy consumption that varies by 10 Mtoe in 2030 in the EU. The other two factors seem to be poorly correlated with total energy consumption of cars in 2030. The multiple regression, presented in Table 8, confirms the same statistical inference. Both the infrastructure and the battery costs are not statistically significant regarding the effects on total final energy consumption by cars in 2030, whereas there is strong statistical confidence regarding CO2 car standards. According to this estimation, the value of elasticity of total final energy consumption with respect to the stringency of the CO2 car standards is 0.45, which is noticeable despite the relatively small penetration of electric cars in the total car fleet by 2030. Thus, CO2 standards are also beneficial for the energy efficiency policy target.
4.2.4. Impacts on CO2 Emissions
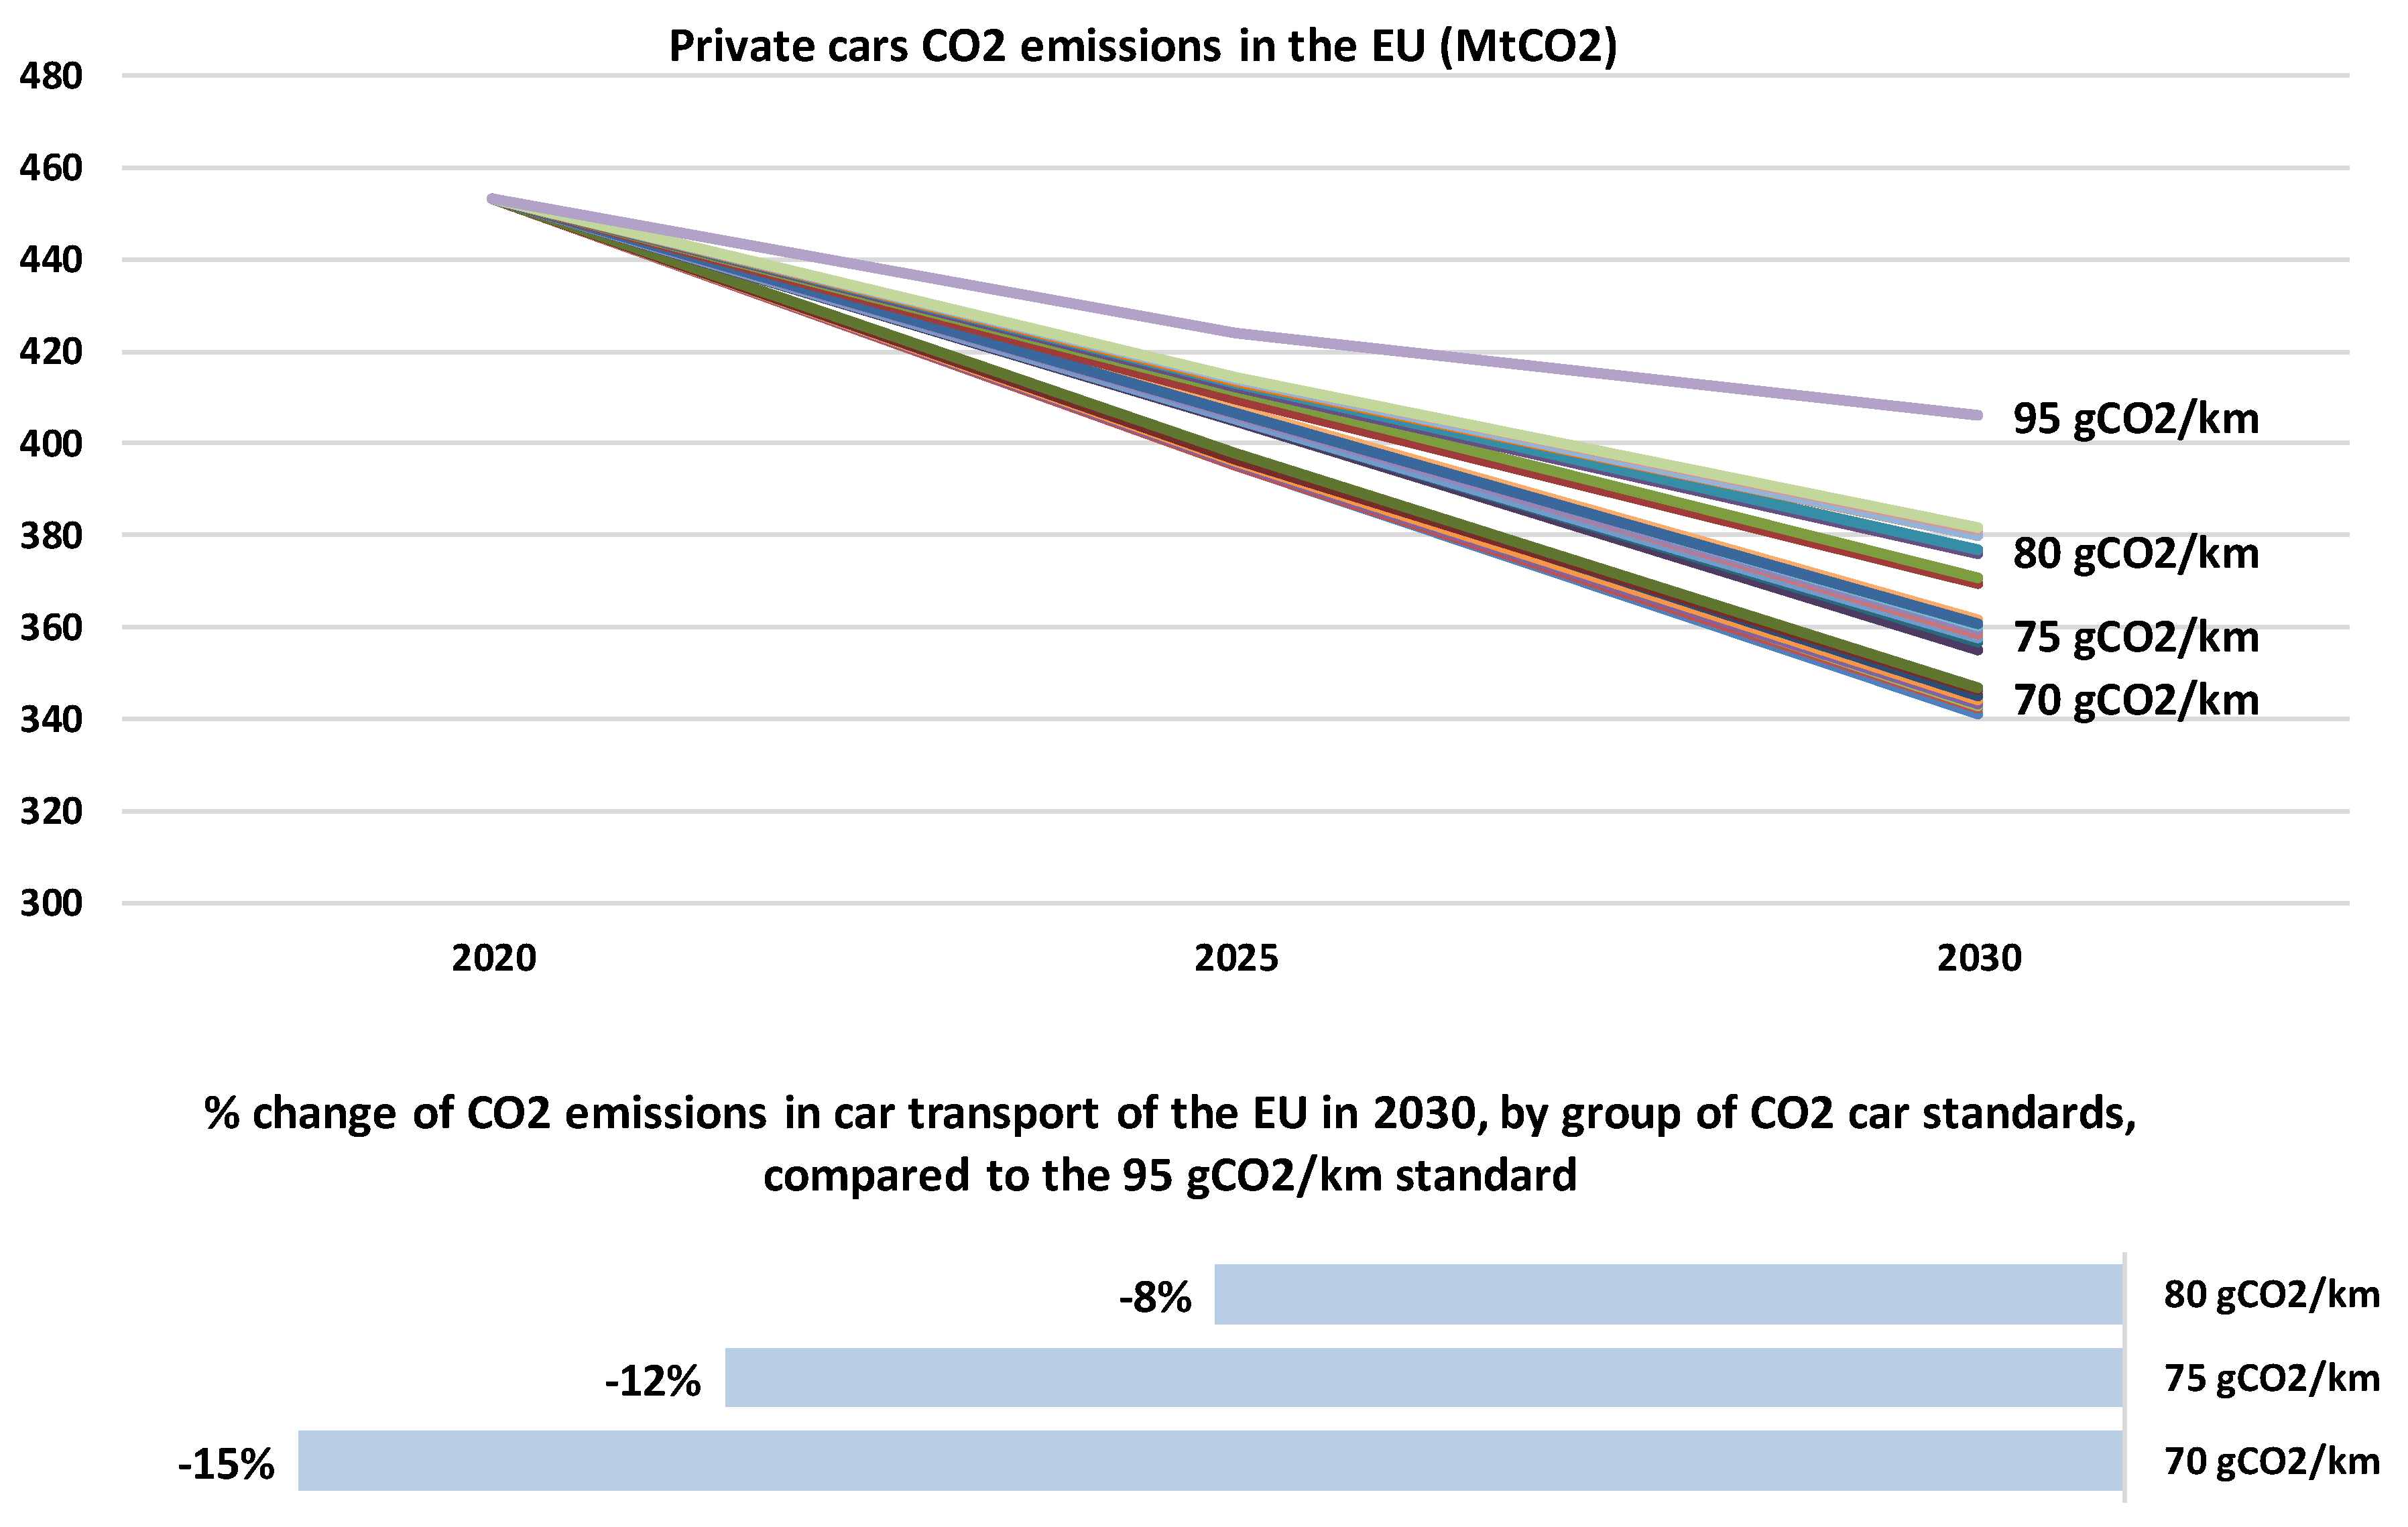
The changes in fleet composition and fuel consumption imply corresponding changes in the CO2 emissions calculated as tank-to-wheel (TTW) emissions. The reduction in CO2 emissions is a common feature of all sensitivity scenarios, in comparison to the BAU scenario, which by assumption includes a non-stringent CO2 car standard set at 95 gCO2/km for the entire period until 2030. Figure 8 shows the decline of CO2 emissions in 2030 in the sensitivity analysis scenarios.
The main driver of emissions reduction is the stringency of the CO2 car emissions since, as already explained, the level of the standard is a major driver for the increase in electricity demand and at the same time, reduction in total energy consumption. The standards enable energy efficiency improvement both via electrification and the uptake of highly efficient conventional cars. As electricity has zero direct emissions in final demand uses, a reduction in carbon emissions follows the increase in the demand for electricity. The set of scenarios assuming low stringency (80 gCO2/km) involve a range of reductions in CO2 emissions, namely 8% in the car segment, compared to BAU, whereas the highest stringency (70 gCO2/km) approximately doubles emission reductions in 2030, i.e., 15% less than in the BAU, in 2030.
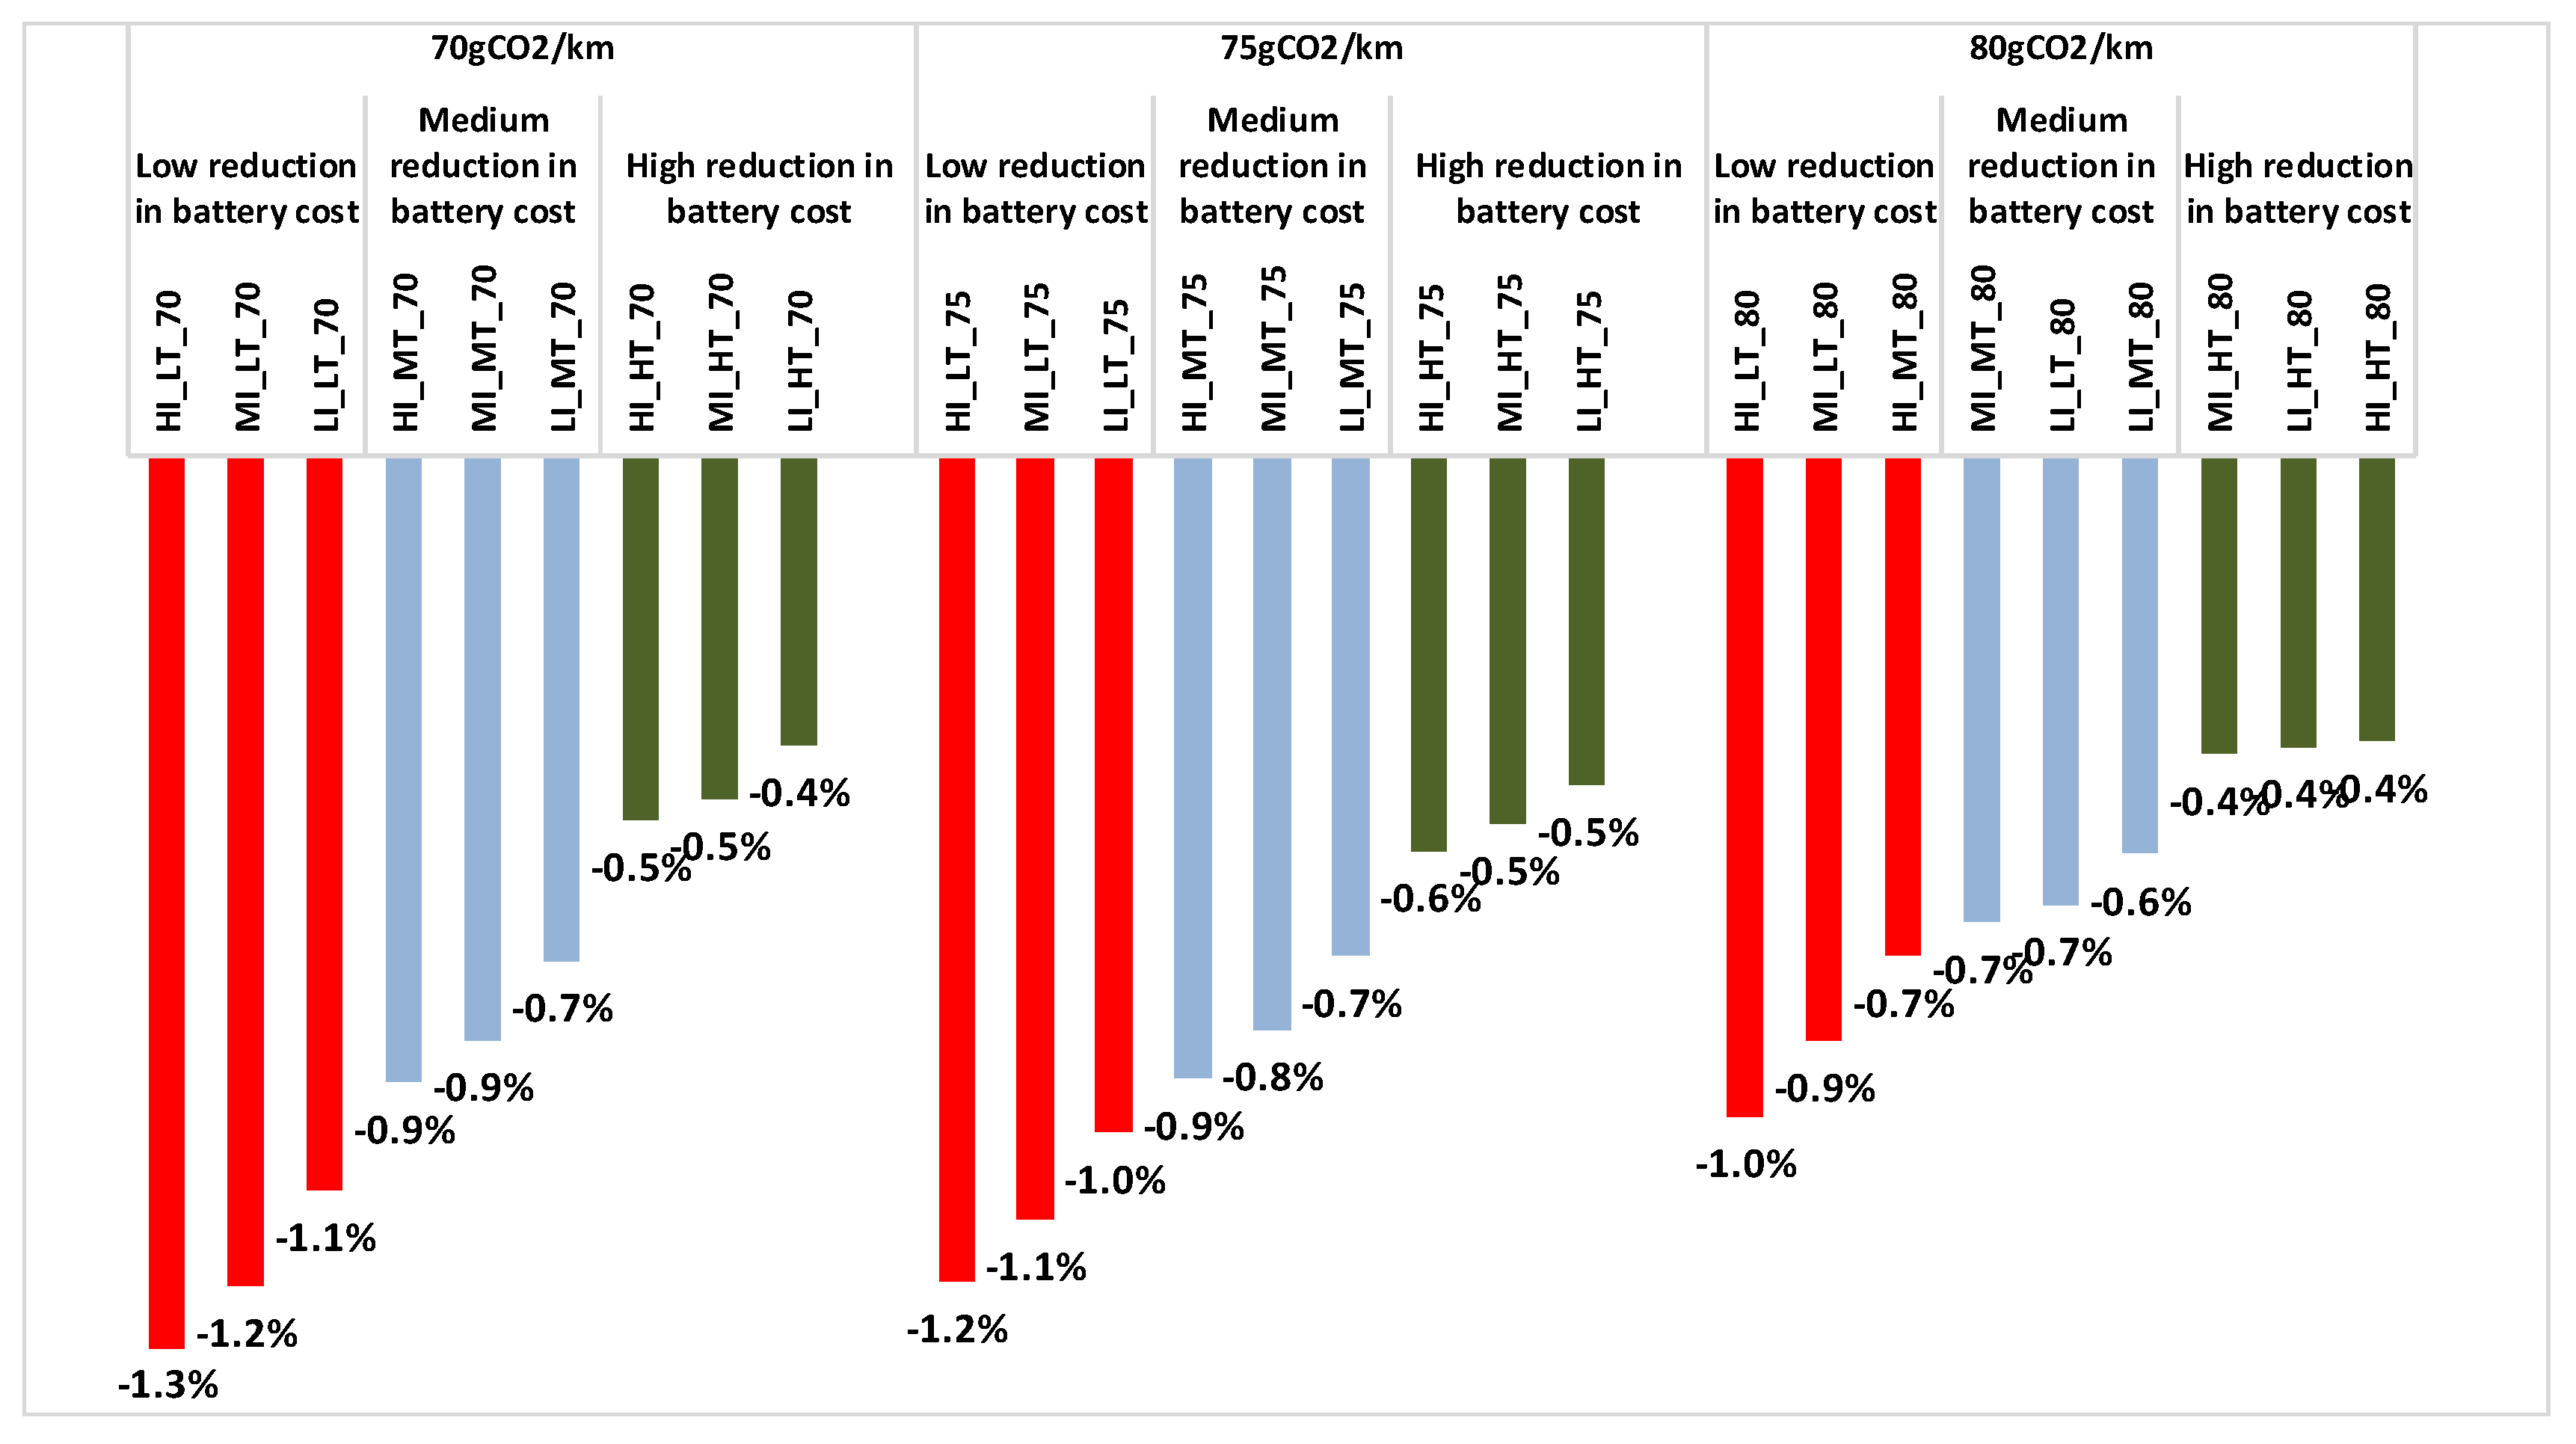
4.2.5. Impacts on Car Mobility
The increasing stringency of CO2 car standards drives the uptake of electric and more efficient cars, which are more expensive than conventional technologies, at least during the period until 2030. If at the same time the technology progress of batteries is not sufficiently strong, battery costs are expected to be high, and thus the high purchasing costs of electric cars increase the cost of mobility by cars as borne by consumers. According to the model’s logic, an increase in the cost of transport by car implies a reduction of car transport activity, as consumers shift towards public transport and possibly also to less mobility if the cost impact is significant.
Conversely, if the adequate reduction in battery costs accompanies the stringency of the CO2 car standards, then the impact on transport costs by car is alleviated, and the reaction of consumers away from cars is mitigated.
Consequently, successfully tapping into the learning potential of batteries during the period until 2030 is an important condition for the acceptance of public policy targeting stringent CO2 standards in the same period. A mismatch between battery costs and CO2 standards can increase car transport costs for consumers. The ensuing social and economic adverse effects may challenge the policy-setting of standards.
The model results show, as depicted in Figure 9, that in the scenarios involving the highest reduction in battery costs, activity of car transportation reduces by only 0.4% to 0.5% down from activity levels in the BAU, irrespective of the intensity of the rest of the driving policies. In contrast, the lowest reduction in battery costs could imply a reduction in car transport activity above 1% in 2030, compared to the BAU, if at the same time policy-making adopts the most stringent CO2 car standards. However, if the policy adopts less stringent CO2 car standards (80 gCO2/km), the reduction in car transport activity is expected to be limited to 0.4% in 2030, compared to the BAU.
Thus, the sensitivity scenario results suggest that it is important to coordinate the expected pace of battery cost reduction and the rhythm of the decrease in the CO2 car standard. This is difficult to achieve in practice, as high uncertainty surrounds technological progress. From a different angle, it is important for investors in technology and industry development of batteries and electric cars to have a clear long-term visibility of the rhythm of a decrease in CO2 car standards, in order to make long-term investment commitments which are necessary to enable a fast pace technology cost reduction. Therefore, policy-makers have a challenging dilemma regarding standards, as they commit ambitiously, decreasing standards and risk facing adverse social effects, or moderate the stringency and the time length of commitments addressing concerns about economic and social impacts, and risk not being sufficient in order to enable technology progress and industrial development at full potential.
4.3. Comparison of Policy-Options Regarding Cost-Effectiveness
Each sensitivity scenario includes a different combination of policies regarding the three factors examined in this paper. Using the model’s results per scenario, it is worth evaluating the cost-effectiveness of the various combinations of the policy options. As far as costs are concerned, total transport costs are studied, and as far as effectiveness is concerned, CO2 emissions are considered. The comparisons are meant as relative changes of costs and emissions compared to the BAU. The total transport cost calculation includes annuity payments for capital (for the purchasing of vehicles) and operating costs comprising fuel purchasing costs, as well as variable non-fuel and fixed operation and maintenance costs.
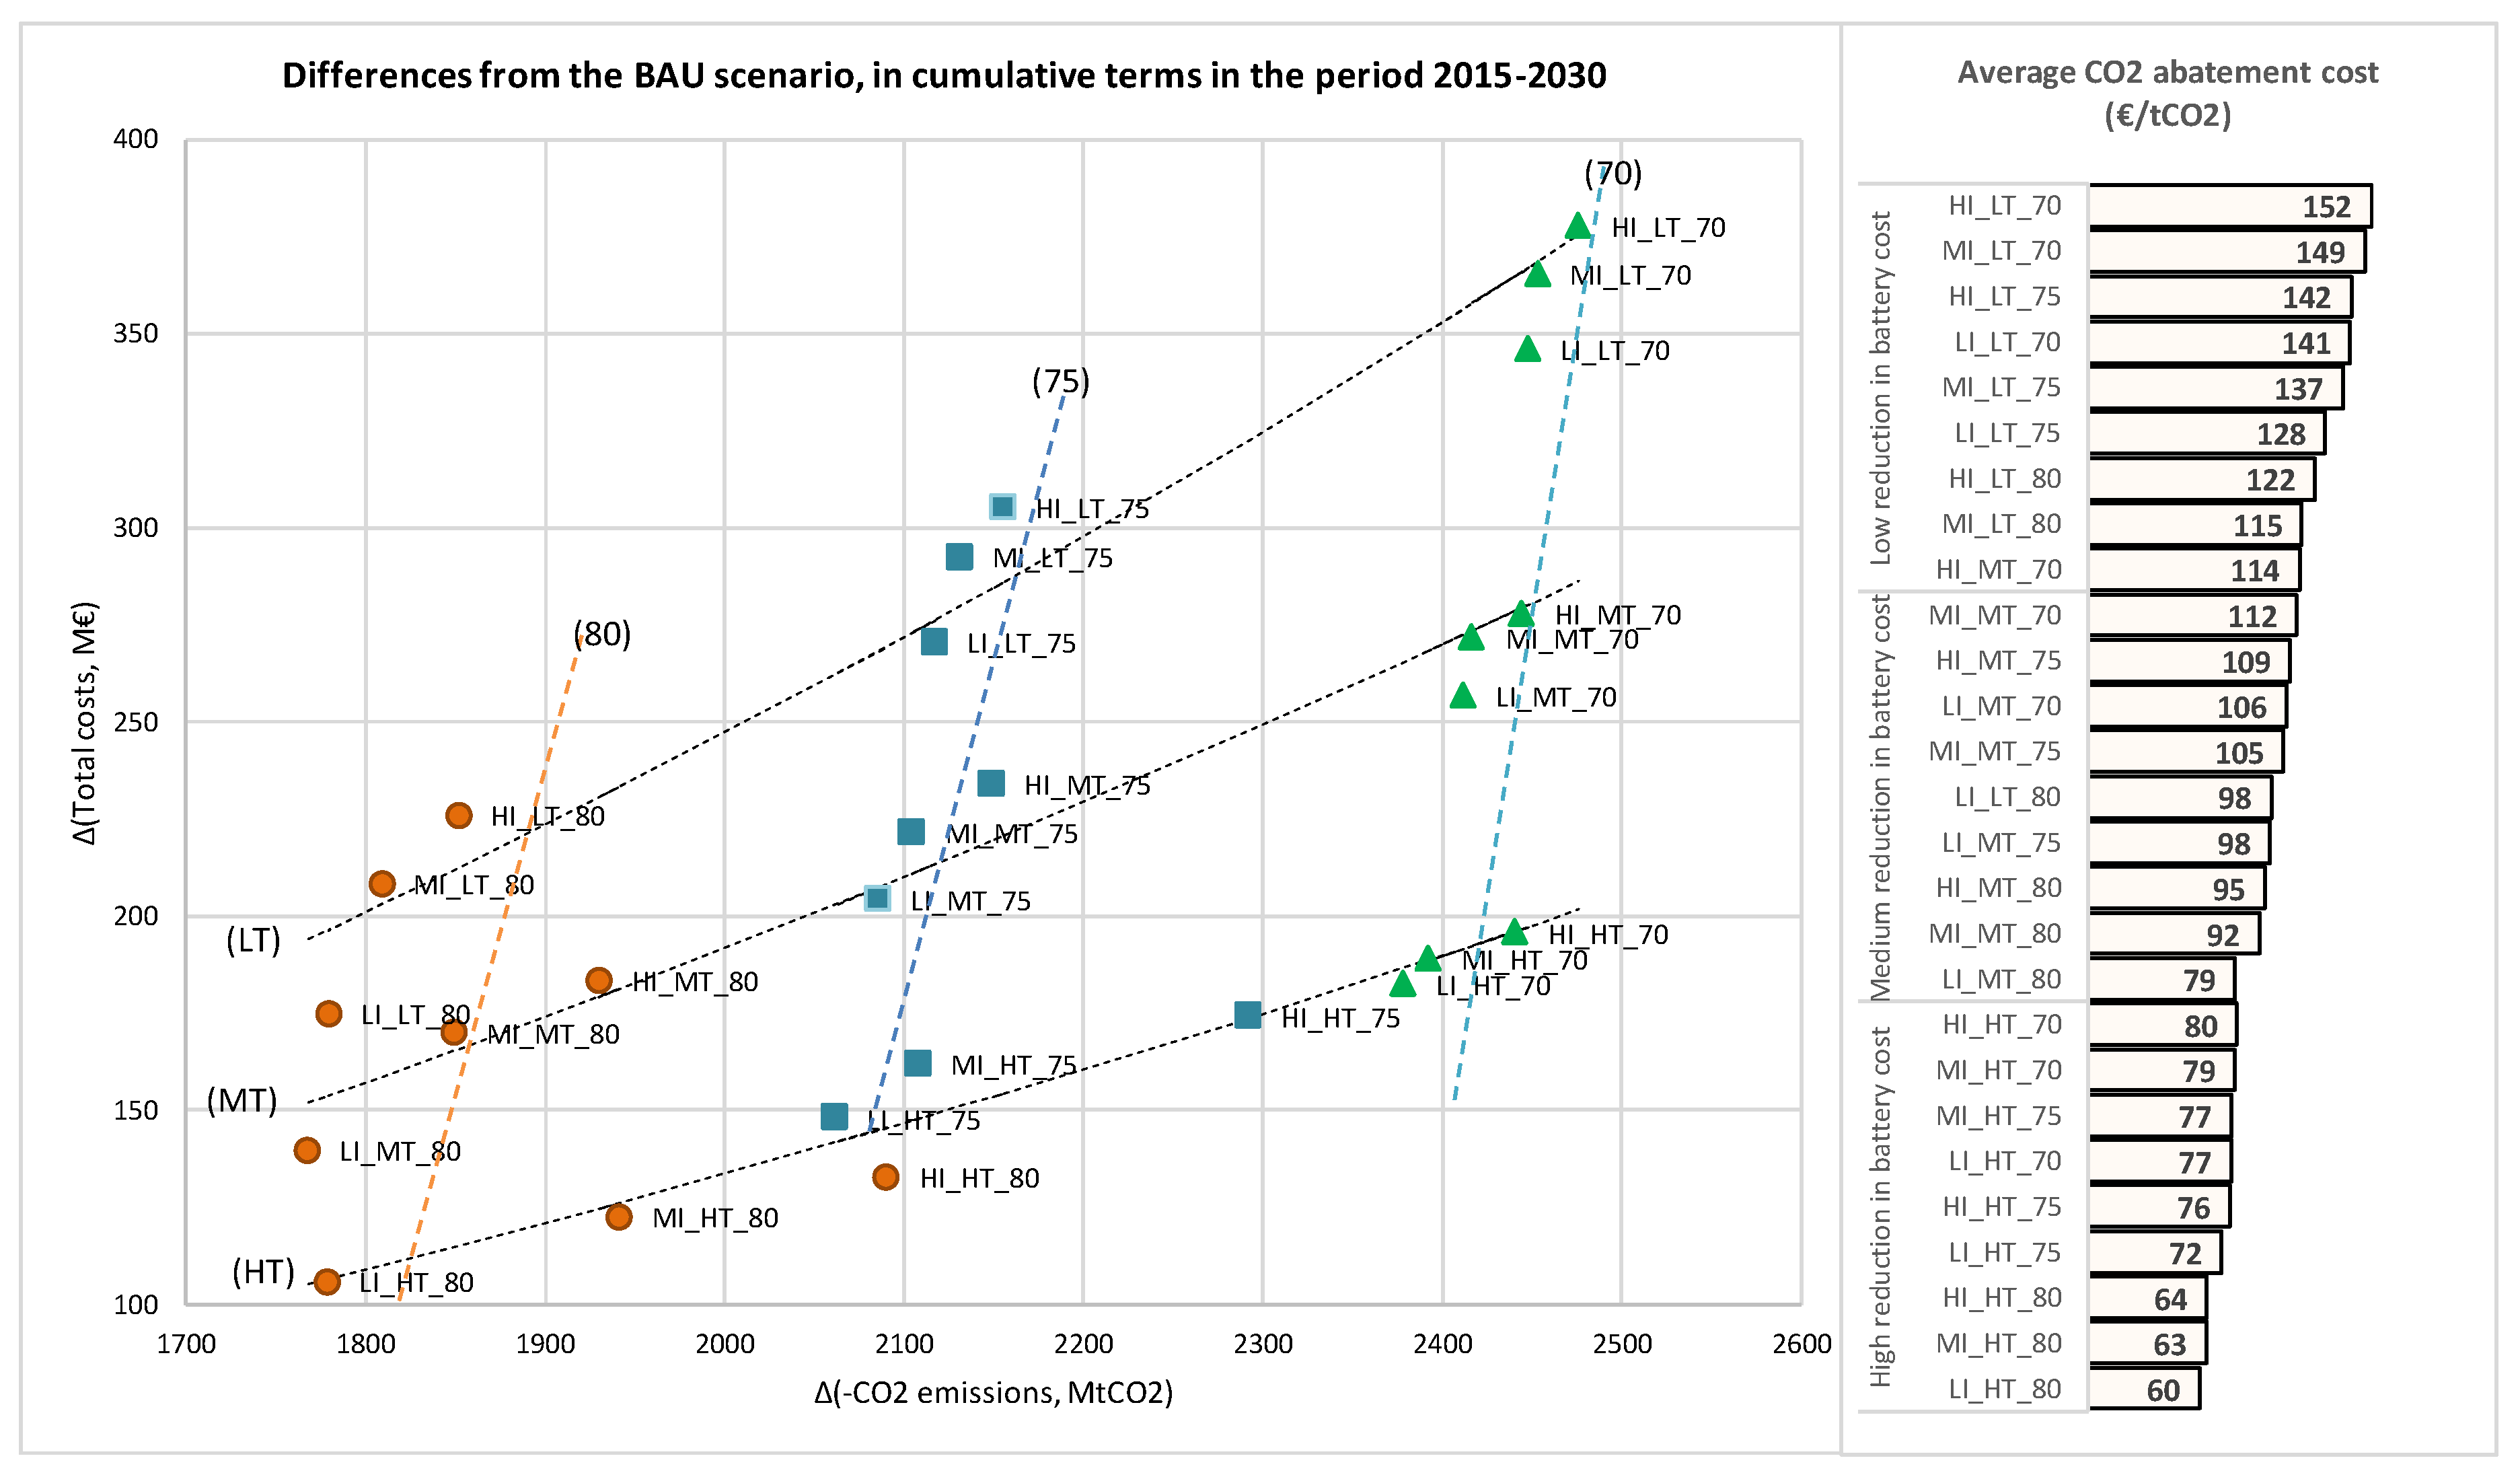
Theoretically, cost and effectiveness are inversely related to each other, as higher emission abatement usually implies higher costs. The results of the sensitivity scenarios plotted in Figure 10 confirm that the correlation between costs and effectiveness is negative. The figure shows cumulative cost differences from the BAU and cumulative emission abatement, compared to the BAU, during the period 2015–2040.
An obvious statement, illustrated in Figure 10, is that the higher the cost reduction in battery costs, the higher the cost-effectiveness of emissions abatement. The graph shows three district lines grouping the different cases regarding cost reduction in battery costs. The lines move downwards when the cost reduction is higher. Further, their slope decreases when cost reduction is higher, which implies that the cost increase per unit of emission abatement (i.e., the marginal cost of abatement) is lower when battery cost reduction is high, compared to the cases where battery cost reduction is low.
The same graph shows three lines which group the cases regarding the level of the standard. The CO2 standard becoming more stringent implies higher emission abatement, as the line moves to the right in the figure. At the same time, the lines shift upwards, which means that the costs increase per unit of emissions abated when the standard becomes more stringent.
If scenario A (i.e., a policy combination) leads to higher emissions and higher costs than scenario B, it is inferred that the former is inferior to the latter from a cost-effectiveness perspective and should therefore not be taken into consideration.
For example, the high development of infrastructure and high reduction in battery costs is a more cost-effective combination than a medium or low development of infrastructure and a medium reduction of battery costs. However, as the policy instruments cannot guarantee certainty about the reduction pace of battery costs, the cost-effectiveness comparisons conditionally on the battery cost improvement need to be performed. There is no clear winner among the scenarios assuming a low reduction of battery costs, as increasing the development of infrastructure implies higher costs but also lower emissions.
A similar trade-off holds for the group of scenarios applying a medium development of infrastructure and for those applying a high development of infrastructure. The comparison of cost-effectiveness across the three groups with different paces of cost reduction of batteries indicates that successful technology progress can be very beneficial for both costs and emissions. The benefits in both dimensions are much larger than the range of trade-offs that concern the development of infrastructure. In other words, the most important factor enabling high cost-effectiveness is the pace of the reduction of battery costs.
The right-hand side graph in Figure 10 confirms that battery costs are of crucial importance for costs needed to reduce emissions of CO2 in car transportation. A low pace of cost reductions for batteries imply a two times higher average cost of CO2 emission abatement compared to the pace of cost reduction when it is high. The differences in average abatement costs due to the extent of infrastructure development are much smaller than cost differences due to battery costs. Only the battery cost factor can sort the average abatement costs in monotone order. The value of the standard cannot drive alone a monotone order of average abatement costs, which implies that the optimum choice of the standard is conditional on the reduction achievement for battery costs.
5. Conclusions
This paper quantitatively assessed the impacts of three key factors that drive market penetration of electric cars, in the medium term, until 2030. These factors are battery costs, the coverage of the recharging infrastructure network and the CO2 car standards. All three factors depend on policy choices, both directly and indirectly. The future cost of batteries depends on the volume of investment in technology improvement and massive industrial production, while the volume of investment crucially depends on the long-term visibility of the market size, which in turn also depends on the policy. The development of infrastructure depends on policy directly, when developed by regulated bodies, and indirectly, as conditions influenced by policy may or may not attract private investment in infrastructure. Finally, the CO2 car standards, directly set by policy, are of high importance when it is anticipated that they will further reduce with regulatory certainty in the future.
To analyse the impact of these factors on EV market shares, the PRIMES-TREMOVE energy economic model was used for the transport sector, and a large number of projections were quantified which assumed different combinations for the three driving factors. Moreover, the model’s results were used as meta-data to perform comparisons and statistical inferences regarding causalities.
The authors conclude that all three factors have a non-negligible influence on the market shares of electric cars in the EU for the year 2030. Statistical analysis of the meta-data derived from the sensitivity scenarios shows that all three factors have a statistically significant impact on the market share of electric vehicles. The impacted range of EVs shares, as driven by the three factors, is large, namely between 7% and 18% in 2030.
The factor with the comparatively larger influence is the reduction of battery costs. High reduction implies a high share of EVs, irrespective of the intensity of the two other factors. A low reduction implies that even if the two other factors are at their maximum intensity (among the options examined in this analysis), the market share of EVs remains lower than in the case of a high reduction of costs. However, high intensity of policies implies 3 to 5 percentage points higher shares of EVs, compared to a policy of low intensity. Therefore, given the uncertainty surrounding future battery costs, it is worth increasing the intensity of policies for infrastructure and standards as a hedging instrument in case the policy targets electrification of car mobility. However, if cost reduction in battery costs proves to be low and at the same time the policy on standards is stringent, there may be non-negligible cost increases for consumers of car transportation. However, if policymakers refrain from adopting stringent standards to avoid the risk of affordability, the signal to technology and infrastructure developers is expected to be weak, and therefore the risk of low progress in both developments is likely to be high. Policy-making needs to balance the risks of cost increases and non-enabling technology progress. However, if the pace of battery cost reductions was known to be fast, a weak policy for standards and infrastructure is not cost-effective and sub-optimal with respect to the potential benefits from electrification. To investigate further the influence of possible reduction of battery costs, this study quantified an additional sensitivity scenario assuming high development of the recharging infrastructure, 70 gCO2/km for the standards and battery costs reaching as low as 73 $/kWh in 2030 [39]. The results show that total EV share reaches 21% in 2030 i.e., 3 pp. higher compared the HI_HT_70 scenario. BEVs increase their share by 1.7%, while PHEVs by 1.3%. Therefore, faster progress of the battery technology, compared to the assumptions used in the model-based analysis, can be a decisive factor for the market share of electric cars in 2030. A policy combining the three factors ambitiously can induce 2–3 times a higher market share of EVs in 2030, compared to a weak policy for all the three factors. A policy implication is that the decade 2020–2030 is important for successfully launching the EV car market regarding the infrastructure development and the achievement of cost reduction in the battery industry, while stringent CO2 car standards need to accompany structural policies during the same decade.
Regarding the competition between BEVs and PHEVs, under specific conditions, the two electric vehicle types can represent two respective vehicle options that target different market segments.
- Due to their currently low range autonomy and limited coverage of recharging infrastructure, BEVs fit better urban transport commuting trips. PHEVs, on the contrary, inherit the benefits of the ICE conventional cars and can provide long-range trips running on the ICE when electricity depletes. Unconstrained mobility constitutes an advantage of PHEVs over BEVs, as the latter increasingly depend on the existence of a network of charging points.
- PHEVs are also cheaper, as they have a lower battery capacity compared to BEVs. The model’s findings show that once BEVs overcome their competitive disadvantage over PHEVs (low range, much higher purchasing price), they may become the dominant technology type (between the two). The dominance of BEVs over PHEVs, however, require a transition period before the former reaches adequate maturity. The transition period may vary from 5 to 10 or even more years, depending on the level of technical progress of the battery technology.
The low coverage of recharging infrastructure (i.e., mostly home charging points) acts as a stronger market barrier to BEVs, which are fully dependent on the existence of a well-developed network of charging points. PHEVs are also influenced but to a lower extent. The authors, therefore, conclude that the policies addressing the three barriers have impacts on the competition between pure electric and plug-in hybrid vehicles. Drivers that facilitate electrification also favour the uptake of the former technology, the latter being a reasonable choice only in case the barriers persist and obstruct electrification.
Furthermore, it has been shown that electrification is beneficial for energy efficiency. The analysis found that CO2 car standards are an effective instrument for inducing the reduction of energy consumption in car transportation. The scenarios showed that standards were also an effective instrument for reduction of CO2 emissions, as expected. Stringent standards can achieve above 15% of CO2 emission reductions in the EU by 2030, compared to the BAU scenario.
Recent model-based studies for the car market in the EU find similar results. An application of the TIMES model in [40] has shown that the CO2 car standards played an important role in emission reduction and promoted electrification, while in particular a stringent standard at 70 gCO2/km may effectively reduce emissions significantly, already in 2030. Other model-based studies [7,29,31,40,41] differ in their results regarding which type of electric vehicle, i.e., BEV or PHEV, is likely to be the dominant choice in the future. However, they all share the view, which is also similar to our results, that factors such as battery cost reduction, removal of range anxiety and efficiency promotion greatly favour the choice of BEV.
The successful market uptake of EVs needs to also overcome barriers, other than economic and technological, which are related to the reluctance and conservatism of consumers. While the functional forms and the structure of the model allow the simulation of such factors, the authors acknowledge that further research needs to be carried out to quantify these factors and estimate which policy measures would effectively overcome consumer conservatism and reluctance in the uptake of EVs.
Finally, it should be stated that the authors acknowledge certain limitations in their analysis. An important limitation is the relatively low spatial resolution of the model (currently four region types), since the model employed is not a transport network model. Moreover, range anxiety mostly applies to inter-urban trips of higher distance (in km), and therefore, a higher resolution would represent dependence on range anxiety in a more accurate manner.
Author Contributions
Conceptualization, P.C. and P.S.; Methodology, P.C., P.S. and S.S.; Software, S.S. and Y.M.; Validation, G.Z., P.C. and P.S.; Formal Analysis, S.S. and Y.M.; Investigation, S.S.; Data Curation, P.S. and S.S.; Writing-Original Draft Preparation, P.C., P.S. and S.S.; Writing-Review & Editing, P.C.; Visualization, G.Z. and S.S.; Supervision, P.S. and P.C.
Funding
This research received no external funding.
Acknowledgments
This research did not receive any specific grant from funding agencies in the public, commercial, or not-for-profit sectors.
Conflicts of Interest
The authors declare no conflict of interest.
References
- European Commission. Clean Planet for all A European Long-Term Strategic Vision for a Prosperous, Modern, Competitive and Climate Neutral Economy, In-Depth Analysis in Support of the Commission Communication. COM/2018/773 A. 2018. Available online: https://ec.europa.eu/clima/sites/clima/files/docs/pages/com_2018_733_analysis_in_support_en_0.pdf (accessed on 12 July 2019).
- European Commission. A European Strategy for Low-Emission Mobility. Communication from the Commission to the EuRopean Parliament, the Council, the European Economic and Social Committee and the Committee of the Regions. Brussels, 2016. Available online: https://ec.europa.eu/transparency/regdoc/rep/1/2016/EN/1-2016-501-EN-F1-1.PDF (accessed on 12 July 2019).
- European Commission. WHITE PAPER- Roadmap to a Single European Transport Area Towards a Competitive and Resource Efficient Transport System. Brussels, 2011. Available online: https://ec.europa.eu/transport/sites/transport/files/themes/strategies/doc/2011_white_paper/white-paper-illustrated-brochure_en.pdf (accessed on 12 July 2019).
- European Alternative Fuels Observatory. Available online: https://www.eafo.eu/vehicles-and-fleet/m1 (accessed on 21 June 2019).
- McCollum, D.; Krey, V.; Kolp, P.; Nagai, Y.; Riahi, K. Transport electrification: A key element for energy system transformation and climate stabilization. Clim. Chang. 2014, 123, 651–664. [Google Scholar] [CrossRef]
- Pietzcker, R.C.; Longden, T.; Chen, W.; Fu, S.; Kriegler, E.; Kyle, P.; Luderer, G. Long-term transport energy demand and climate policy: Alternative visions on transport decarbonisation in energy-economy models. Energy 2014, 64, 95–108. [Google Scholar] [CrossRef]
- Anandarajah, G.; MCDowall, W.; Ekins, P. Decarbonising road transport with hydrogen and electricity: Long term global technology learning scenarios. Int. J. Hydrog. Energy 2013, 38, 3419–3432. [Google Scholar] [CrossRef]
- Bosetti, V.; Longden, T. Light duty vehicle transportation and global climate policy: The importance of electric drive vehicles. Energy Policy 2013, 58, 209–219. [Google Scholar] [CrossRef] [Green Version]
- Pasaoglu, G.; Honselaar, M.; Thiel, C. Potential vehicle fleet CO2 reductions and cost implications for various vehicle technology deployment scenarios in Europe. Energy Policy 2012, 40, 404–421. [Google Scholar] [CrossRef]
- Siskos, P.; Capros, P.; De Vita, A. CO2 and energy efficiency car standards in the EU in the context of a decarbonisation strategy: A model-based policy assessment. Energy Policy 2015, 84, 22–34. [Google Scholar] [CrossRef]
- Plotkin, S.E.; Singh, M.K. Multi-Path Transportation Futures Study: Vehicle Characterization and Scenario Analyses (No. ANL/ESD/09-5). Argonne National Laboratory, 2009. Available online: https://publications.anl.gov/anlpubs/2009/11/65560.pdf (accessed on 11 June 2019).
- Karplus, V.J.; Paltsev, S.; Reilly, J.M. Prospects for plug-in hybrid electric vehicles in the United States and Japan: A general equilibrium analysis. Transp. Res. Part A Policy Pract. 2010, 44, 620–641. [Google Scholar] [CrossRef] [Green Version]
- Axsen, J.; Kurani, K.S. Hybrid, plug-in hybrid, or electric—What do car buyers want? Energy Policy 2013, 61, 532–543. [Google Scholar] [CrossRef]
- Carley, S.; Krause, R.M.; Lane, B.W.; Graham, J.D. Intent to purchase a plug-in electric vehicle: A survey of early impressions in large US cities. Transp. Res. Part D Transp. Environ. 2013, 18, 39–45. [Google Scholar] [CrossRef]
- Hong, S.; Kuby, M. A threshold covering flow-based location model to build a critical mass of alternative-fuel stations. J. Transp. Geogr. 2016, 56, 128–137. [Google Scholar] [CrossRef]
- Melaina, M.; Bremson, J.; Solo, K. Consumer Convenience and the availability of retail stations as a market barrier for alternative fuel vehicles. In Proceedings of the 31st USAEE/IAEE North American Conference, Austin, TX, USA, 4–7 November 2012. [Google Scholar]
- Reddy, S.; Painuly, J. Diffusion of renewable energy technologies-barriers and stakeholders’ perspectives. Renew. Energy 2004, 29, 1431–1447. [Google Scholar] [CrossRef]
- Tseng, P.; Lee, J.; Friley, P. A hydrogen economy: opportunities and challenges. Energy 2005, 30, 2703–2720. [Google Scholar] [CrossRef]
- Rezvani, Z.; Jansson, J.; Bodin, J. Advances in consumer electric vehicle adoption research: A review and re-search agenda. Transp. Res. Part D Transp. Environ. 2015, 34, 122–136. [Google Scholar] [CrossRef]
- Tran, M.; Banister, D.; Bishop, J.D.; McCulloch, M.D. Simulating early adoption of alternative fuel vehicles for sustainability. Technol. Forecast. Soc. Chang. 2013, 80, 865–875. [Google Scholar] [CrossRef]
- Bjerkan, K.Y.; Nørbech, T.E.; Nordtømme, M.E. Incentives for promoting battery electric vehicle (BEV) adoption in Norway. Transp. Res. Part D Transp. Environ. 2016, 43, 169–180. [Google Scholar] [CrossRef]
- Haddadian, G.; Khodayar, M.; Shahidehpour, M. Accelerating the Global Adoption of Electric Vehicles: Barriers and Drivers. Electr. J. 2015, 28, 53–68. [Google Scholar] [CrossRef]
- Wan, Z.; Sperling, D.; Wang, Y. China’s electric car frustrations. Transp. Res. Part D Transp. Environ. 2015, 34, 116–121. [Google Scholar] [CrossRef]
- Sierzchula, W. Factors influencing fleet manager adoption of electric vehicles. Transp. Res. Part D Transp. Environ. 2014, 31, 126–134. [Google Scholar] [CrossRef]
- Dijk, M.; Orsato, R.J.; Kemp, R. The emergence of an electric mobility trajectory. Energy Policy 2013, 52, 135–145. [Google Scholar] [CrossRef]
- Nykvist, B.; Nilsson, M. Rapidly falling costs of battery packs for electric vehicles. Nat. Clim. Chang. 2015, 5, 329–332. [Google Scholar] [CrossRef]
- Nilsson, M.; Nykvist, B. Governing the electric vehicle transition–Near term interventions to support a green energy economy. Appl. Energy 2016, 179, 1360–1371. [Google Scholar] [CrossRef]
- Thiel, C.; Nijs, W.; Simoes, S.; Schmidt, J.; van Zyl, A.; Schmid, E. The impact of the EU car CO2 regulation on the energy system and the role of electro-mobility to achieve transport decarbonisation. Energy Policy 2016, 96, 153–166. [Google Scholar] [CrossRef]
- Seixas, J.; Simões, S.; Dias, L.; Kanudia, A.; Fortes, P.; Gargiulo, M. Assessing the cost-effectiveness of electric vehicles in European countries using integrated modelling. Energy Policy 2015, 80, 165–176. [Google Scholar] [CrossRef]
- Paltsev, S.; Chen, Y.H.; Karplus, V.; Kishimoto, P.; Reilly, J. Impacts of CO2 Mandates for New Cars in the European Union. 2015. Available online: https://globalchange.mit.edu/sites/default/files/MITJPSPGC_Rpt281.pdf (accessed on 11 June 2019).
- Rösler, H.; van der Zwaan, B.; Keppo, I.; Bruggink, J. Electricity versus hydrogen for passenger cars under stringent climate change control. Sustain. Energy Technol. Assess. 2014, 5, 106–118. [Google Scholar] [CrossRef] [Green Version]
- E3MLab. PRIMES-TREMOVE Transport Model 2013–2014. Detailed Model Description. E3MLab/ICCS. Available online: http://www.e3mlab.eu/e3mlab/PRIMES%20Manual/The%20PRIMES-TREMOVE%20MODEL%202013-2014.pdf (accessed on 11 June 2019).
- Capros, P.; Tasios, N.; De Vita, A.; Mantzos, L.; Paroussos, L. Model-based analysis of decarbonising the EU economy in the time horizon to 2050. Energy Strateg. Rev. 2012, 1, 76–84. [Google Scholar] [CrossRef]
- Siskos, P.; Zazias, G.; Petropoulos, A.; Evangelopoulou, S.; Capros, P. Implications of delaying transport decarbonisation in the EU: A systems analysis using the PRIMES model. Energy Policy 2018, 121, 48–60. [Google Scholar] [CrossRef]
- Karkatsoulis, P.; Siskos, P.; Paroussos, L.; Capros, P. Simulating deep CO2 emission reduction in transport in a general equilibrium framework: The GEM-E3T model. Transp. Res. Part D Transp. Environ. 2017, 55, 343–358. [Google Scholar] [CrossRef]
- Capros, P.; De Vita, A.; Tasios, N.; Siskos, P.; Kannavou, M.; Petropoulos, A.; Evangelopoulou, S.; Paroussos, L.; Fragiadakis, K.; Tsani, S.; et al. EU ENERGY, TRANSPORT AND GHG EMISSIONS-TRENDS TO 2050, Reference Scenario 2016, European Commission, Directorate-General for Energy, Directorate-General for Climate Action and Directorate-General for Mobility and Transport; Publications Office of the European Union: Luxembourg, 2016. [Google Scholar]
- U.S. DEPARTMET OF ENERGY. National Plug-In Electric Vehicle Infrastructure Analysis. 2017. Available online: https://www.energy.gov/sites/prod/files/2017/09/f36/NationalPlugInElectricVehicleInfrastructureAnalysis_Sept2017.pdf (accessed on 7 July 2019).
- Morrissey, P.; Weldon, P.; O’Mahony, M. Informing the Strategic Rollout of Fast Electric Vehicle Charging Networks with User Charging Behavior Data Analysis. Transp. Res. Rec. 2016, 2572, 9–19. [Google Scholar] [CrossRef]
- The Union of Concerned Scientists. Electric Vehicle Battery: Materials, Cost, Lifespan. 2018. Available online: https://www.ucsusa.org/clean-vehicles/electric-vehicles/electric-cars-battery-life-materials-cost (accessed on 4 July 2019).
- Ichinoe, M.; Endo, E. Analysis of the vehicle mix in the passenger-car sector in Japan for CO2 emissions reduction by a MARKAL model. Appl. Energy 2006, 83, 1047–1061. [Google Scholar] [CrossRef]
- Bahn, O.; Marcy, M.; Vaillancourt, K.; Waaub, J.-P. Electrification of the Canadian road transportation sector: A 2050 outlook with TIMES-Canada. Energy Policy 2013, 62, 593–606. [Google Scholar] [CrossRef]
Figure 1.
Schematic representation of the structure of modelling passenger transportation.

Figure 2.
Shares of electric vehicles in the total car fleet in the EU by 2030, in various scenarios.
Figure 2.
Shares of electric vehicles in the total car fleet in the EU by 2030, in various scenarios.

Figure 3.
The distribution of the electric vehicle (EV) market shares in the EU in 2030.

Figure 4.
Market shares of BEVs and PHEVs in the total fleet of electric cars.

Figure 5.
The distribution of the shares of BEVs in the total fleet of EVs in the EU in 2030.

Figure 6.
The distribution of electricity consumption of cars in the EU in 2030.

Figure 7.
The distribution of final energy consumption of cars in the EU in 2030.

Figure 8.
Evolution of CO2 emissions in car transport by scenario in the EU.

Figure 9.
Change of passenger car transport activity, relative to the BAU, in the EU in 2030.

Figure 10.
(left-hand side): CO2 emission abatement versus change in total transport costs from BAU, for the EU cumulatively in 2015–2030; (right-hand side): Average cost of CO2 emissions abatement relative to the BAU. Notes: Line (LT) group cases with low reduction in battery costs, line (MT) for a medium reduction in battery costs, line (HT) for a high reduction in battery costs. Line (80) groups cases with a standard at 80 gCO2/km, line (75) for a standard at 75 gCO2/km and line (70) for a standard at 70 gCO2/km.


Table 1.
Key results of the business-as-usual scenario related to passenger cars.
| Transport Activity (Billion p-km) | 2010 | 2020 | 2025 | 2030 |
|---|---|---|---|---|
| Conventional diesel ICE | 2199 | 2380 | 2286 | 2216 |
| Full hybrid diesel | 2 | 168 | 367 | 488 |
| Plug-in diesel | 0 | 36 | 62 | 112 |
| Conventional gasoline ICE | 1979 | 1595 | 1378 | 1212 |
| Full hybrid gasoline | 4 | 174 | 345 | 460 |
| Plug-in gasoline | 0 | 43 | 74 | 121 |
| LPG/CNG/Flexi fuelled vehicles | 149 | 268 | 298 | 314 |
| Battery electric | 0 | 25 | 56 | 129 |
| Fuel cell | 0 | 0 | 2 | 9 |
| Total | 4333 | 4690 | 4867 | 5060 |
| Share of conventional ICE | 96% | 85% | 75% | 68% |
| Share of full hybrids | 0% | 7% | 15% | 19% |
| Share of LEV (*) | 0% | 2% | 4% | 7% |
| Energy consumption (Mtoe) | 2010 | 2020 | 2025 | 2030 |
| Gasoline | 86.0 | 61.5 | 54.9 | 50.5 |
| Diesel | 83.8 | 79.7 | 76.2 | 74.3 |
| LPG/CNG | 6.4 | 10.0 | 10.6 | 10.8 |
| Biofuels | 7.5 | 11.1 | 10.6 | 10.4 |
| Electricity | 0.0 | 0.6 | 1.1 | 2.1 |
| Hydrogen | 0.0 | 0.0 | 0.0 | 0.2 |
| Total | 183.6 | 162.9 | 153.3 | 148.3 |
| Share of diesel | 46% | 49% | 50% | 50% |
| Share of gasoline | 47% | 38% | 36% | 34% |
| Share of biofuels | 4% | 7% | 7% | 7% |
| CO2 emissions (million tons) | 2010 | 2020 | 2025 | 2030 |
| Total | 525 | 451 | 422 | 404 |
(*) Low Emission Vehicles (LEV) include Plug-in hybrids (PHEV), Battery Electric Vehicles (BEV) and hydrogen fuel-cell powered vehicles (FCEV).
Table 2.
Stringency of CO2 car standards.
| Policy Intensity for CO2 Car Standards (gCO2/km) | 2021 | 2025 | 2030 |
|---|---|---|---|
| High Stringency (70) | 95 | 80 | 70 |
| Medium Stringency (75) | 95 | 85 | 75 |
| Low Stringency (80) | 95 | 90 | 80 |
| BAU | 95 | 95 | 95 |
Table 3.
Overview of scenario configuration.
| Scenario Names | Infrastructure Coverage | Battery Costs and Performance | CO2 Car Standard in 2030 (gCO2/km) |
|---|---|---|---|
| MI_MT_80 | MI—Medium level | MT—medium learning | 80 |
| MI_MT_75 | MI—Medium level | MT—medium learning | 75 |
| MI_MT_70 | MI—Medium level | MT—medium learning | 70 |
| MI_LT_80 | MI—Medium level | LT—low learning | 80 |
| MI_LT_75 | MI—Medium level | LT—low learning | 75 |
| MI_LT_70 | MI—Medium level | LT—low learning | 70 |
| MI_HT_80 | MI—Medium level | HT—high learning | 80 |
| MI_HT_75 | MI—Medium level | HT—high learning | 75 |
| MI_HT_70 | MI—Medium level | HT—high learning | 70 |
| LI_MT_80 | LI—Low level | MT—medium learning | 80 |
| LI_MT_75 | LI—Low level | MT—medium learning | 75 |
| LI_MT_70 | LI—Low level | MT—medium learning | 70 |
| LI_LT_80 | LI—Low level | LT—low learning | 80 |
| LI_LT_75 | LI—Low level | LT—low learning | 75 |
| LI_LT_70 | LI—Low level | LT—low learning | 70 |
| LI_HT_80 | LI—Low level | HT—high learning | 80 |
| LI_HT_75 | LI—Low level | HT—high learning | 75 |
| LI_HT_70 | LI—Low level | HT—high learning | 70 |
| HI_MT_80 | HI—Low level | MT—medium learning | 80 |
| HI_MT_75 | HI—High level | MT—medium learning | 75 |
| HI_MT_70 | HI—High level | MT—medium learning | 70 |
| HI_LT_80 | HI—High level | LT—low learning | 80 |
| HI_LT_75 | HI—High level | LT—low learning | 75 |
| HI_LT_70 | HI—High level | LT—low learning | 70 |
| HI_HT_80 | HI—High level | HT—high learning | 80 |
| HI_HT_75 | HI—High level | HT—high learning | 75 |
| HI_HT_70 | HI—High level | HT—high learning | 70 |
| LI_LT_95 | LI—Low level | LT—low learning | 95 |
| HI_HT_65 | HI—High level | HT—high learning | 65 |
Table 4.
The results of multiple regression for the EV market shares in 2030.
| Coefficient | Standard Error | t-Statistic | Lower t0.025(23) | Upper t0.975(23) | p-Value | |
|---|---|---|---|---|---|---|
| Constant term | 1.766293 | 0.0828365 | 21.322655 | 1.594933 | 1.937654 | 0 |
| Infrastructure | 0.0282036 | 0.0022486 | 12.542546 | 0.0235519 | 0.0328552 | 9.10 × 10⁻¹² |
| Battery costs | −0.03139 | 0.0027207 | −11.537332 | −0.037018 | −0.025762 | 4.82 × 10⁻¹¹ |
| CO2 car standard | −0.374582 | 0.0187071 | −20.023536 | −0.413281 | −0.335884 | 4.44 × 10⁻¹⁶ |
| Adjusted R-squared = 0.964, F = 230.455825, p-value = 0.00000 | ||||||
Table 5.
The results of multiple regression for the shares of BEVs in total EVs in the EU in 2030.
| Coefficient | Standard Error | t-Statistic | Lower t0.025(23) | Upper t0.975(23) | p-Value | |
|---|---|---|---|---|---|---|
| Constant term | 0.779071 | 0.28181 | 2.764532 | 0.196104 | 1.362039 | 0.0110316 |
| Infrastructure | 0.0265788 | 0.0076499 | 3.474418 | 0.0107539 | 0.0424037 | 0.002052 |
| Battery costs | −0.203444 | 0.0092559 | −21.980087 | −0.222592 | −0.184297 | 0 |
| CO2 car standard | 0.149722 | 0.0636415 | 2.352582 | 0.0180694 | 0.281375 | 0.0275711 |
| Adjusted R-squared = 0.950, F = 166.910151, p-value = 8.88 × 10⁻¹⁶ | ||||||
Table 6.
Energy consumption of private cars in 2030 in the EU (difference and % change from BAU).
| Electricity | Biofuels | Petroleum Products | Gaseous Fuels | Total Fuels | ||||||
|---|---|---|---|---|---|---|---|---|---|---|
| Mtoe | % Change from BAU | Mtoe | % Change from BAU | Mtoe | % Change from BAU | Mtoe | % Change from BAU | Mtoe | % Change from BAU | |
| BAU | 2.14 | 10.39 | 131.86 | 3.93 | 148.32 | |||||
| LI_LT_80 | 2.90 | 36% | 10.65 | 2% | 123.46 | −6% | 4.49 | 14% | 141.51 | −5% |
| MI_LT_80 | 3.40 | 59% | 10.42 | 0% | 123.07 | −7% | 4.37 | 11% | 141.25 | −5% |
| LI_MT_80 | 3.49 | 63% | 10.45 | 1% | 123.66 | −6% | 4.34 | 10% | 141.94 | −4% |
| HI_LT_80 | 3.86 | 80% | 10.27 | −1% | 122.09 | −7% | 4.31 | 10% | 140.53 | −5% |
| LI_HT_80 | 4.11 | 92% | 10.30 | −1% | 123.23 | −7% | 4.23 | 8% | 141.86 | −4% |
| LI_LT_75 | 4.25 | 98% | 10.60 | 2% | 115.87 | −12% | 4.77 | 21% | 135.48 | −9% |
| MI_MT_80 | 4.34 | 103% | 10.17 | −2% | 121.85 | −8% | 4.24 | 8% | 140.61 | −5% |
| MI_LT_75 | 4.74 | 121% | 10.30 | −1% | 115.68 | −12% | 4.56 | 16% | 135.28 | −9% |
| LI_MT_75 | 4.88 | 128% | 10.34 | 0% | 116.50 | −12% | 4.56 | 16% | 136.27 | −8% |
| HI_MT_80 | 5.01 | 134% | 10.01 | −4% | 120.13 | −9% | 4.20 | 7% | 139.34 | −6% |
| HI_LT_75 | 5.10 | 138% | 10.12 | −3% | 115.46 | −12% | 4.45 | 13% | 135.14 | −9% |
| LI_LT_70 | 5.29 | 147% | 10.58 | 2% | 110.76 | −16% | 4.71 | 20% | 131.34 | −11% |
| LI_HT_75 | 5.39 | 152% | 10.16 | −2% | 117.09 | −11% | 4.39 | 12% | 137.03 | −8% |
| MI_HT_80 | 5.40 | 152% | 9.96 | −4% | 119.79 | −9% | 4.15 | 6% | 139.30 | −6% |
| MI_MT_75 | 5.42 | 153% | 10.03 | −3% | 116.34 | −12% | 4.34 | 11% | 136.14 | −8% |
| MI_LT_70 | 5.78 | 170% | 10.25 | −1% | 110.62 | −16% | 4.50 | 15% | 131.16 | −12% |
| HI_MT_75 | 5.94 | 178% | 9.85 | −5% | 115.78 | −12% | 4.24 | 8% | 135.81 | −8% |
| LI_MT_70 | 6.00 | 180% | 10.28 | −1% | 111.48 | −15% | 4.51 | 15% | 132.27 | −11% |
| MI_HT_75 | 6.12 | 186% | 9.84 | −5% | 116.47 | −12% | 4.19 | 7% | 136.62 | −8% |
| HI_LT_70 | 6.22 | 190% | 10.05 | −3% | 110.38 | −16% | 4.37 | 11% | 131.03 | −12% |
| HI_HT_80 | 6.51 | 204% | 9.71 | −6% | 116.92 | −11% | 4.10 | 4% | 137.24 | −7% |
| MI_MT_70 | 6.53 | 205% | 9.93 | −4% | 111.37 | −16% | 4.30 | 9% | 132.14 | −11% |
| LI_HT_70 | 6.57 | 207% | 10.06 | −3% | 112.15 | −15% | 4.37 | 11% | 133.15 | −10% |
| HI_HT_75 | 6.92 | 223% | 9.63 | −7% | 115.07 | −13% | 4.08 | 4% | 135.70 | −9% |
| HI_MT_70 | 7.01 | 227% | 9.74 | −6% | 111.15 | −16% | 4.18 | 6% | 132.08 | −11% |
| MI_HT_70 | 7.14 | 233% | 9.72 | −6% | 112.09 | −15% | 4.16 | 6% | 133.10 | −10% |
| HI_HT_70 | 7.78 | 263% | 9.52 | −8% | 111.45 | −15% | 4.04 | 3% | 132.79 | −10% |
Table 7.
The results of multiple regression for electricity consumption by cars in the EU in 2030.
| Coefficient | Standard Error | t-Statistic | Lower t0.025(23) | Upper t0.975(23) | p-Value | |
|---|---|---|---|---|---|---|
| Constant term | 15.968025 | 1.045763 | 15.269256 | 13.804699 | 18.131351 | 1.57 × 10⁻¹³ |
| Infrastructure | 0.222129 | 0.0283877 | 7.824837 | 0.163405 | 0.280854 | 6.26 × 10⁻⁸ |
| Battery costs | −0.335291 | 0.0343474 | −9.761768 | −0.406345 | −0.264238 | 1.20 × 10⁻⁹ |
| CO2 car standard | −3.173947 | 0.236167 | −13.439442 | −3.662494 | −2.685399 | 2.23 × 10⁻¹² |
| Adjusted R-squared = 0.928, F(1,23) = 112.379595, p-value = 6.98 × 10⁻¹⁴ | ||||||
Table 8.
The results of multiple regression for total final energy consumption by cars in the EU in 2030.
Table 8.
The results of multiple regression for total final energy consumption by cars in the EU in 2030.
| Coefficient | Standard Error | t-Statistic | Lower t0.025(23) | Upper t0.975(23) | p-Value | |
|---|---|---|---|---|---|---|
| Constant term | 3.012871 | 0.107147 | 28.118948 | 2.79122 | 3.234522 | 0 |
| Infrastructure | −0.0079325 | 0.00290856 | −2.727291 | −0.0139493 | −0.00191568 | 0.0120103 |
| Battery costs | −0.00373267 | 0.00351919 | −1.060662 | −0.0110127 | 0.00354732 | 0.299855 |
| CO2 car standard | 0.454467 | 0.0241973 | 18.781744 | 0.404411 | 0.504523 | 1.89 × 10⁻¹⁵ |
| Adjusted R-squared = 0.932, F(1,24) = 179.162842, p-value = 3.77 × 10⁻¹⁵ | ||||||
© 2019 by the authors. Licensee MDPI, Basel, Switzerland. This article is an open access article distributed under the terms and conditions of the Creative Commons Attribution (CC BY) license (http://creativecommons.org/licenses/by/4.0/).
Share and Cite
MDPI and ACS Style
Statharas, S.; Moysoglou, Y.; Siskos, P.; Zazias, G.; Capros, P. Factors Influencing Electric Vehicle Penetration in the EU by 2030: A Model-Based Policy Assessment. Energies 2019, 12, 2739. https://doi.org/10.3390/en12142739
AMA Style
Statharas S, Moysoglou Y, Siskos P, Zazias G, Capros P. Factors Influencing Electric Vehicle Penetration in the EU by 2030: A Model-Based Policy Assessment. Energies. 2019; 12(14):2739. https://doi.org/10.3390/en12142739
Chicago/Turabian StyleStatharas, Stergios, Yannis Moysoglou, Pelopidas Siskos, Georgios Zazias, and Pantelis Capros. 2019. "Factors Influencing Electric Vehicle Penetration in the EU by 2030: A Model-Based Policy Assessment" Energies 12, no. 14: 2739. https://doi.org/10.3390/en12142739
Note that from the first issue of 2016, this journal uses article numbers instead of page numbers. See further details here.