H2O2-Enhanced Shale Gas Recovery under Different Thermal Conditions


1
School of Energy, Soochow University, Suzhou 215006, China
2
School of Aerospace Engineering, Xian Jiaotong University, Xi’an 710049, China
3
Texas A&M Transportation Institute, College Station, TX 77843, USA
*
Authors to whom correspondence should be addressed.
Energies 2019, 12(11), 2127; https://doi.org/10.3390/en12112127
Submission received: 22 March 2019
/
Revised: 28 April 2019
/
Accepted: 27 May 2019
/
Published: 3 June 2019
(This article belongs to the Special Issue Experimental Heat Transfer in Energy Systems)
Abstract
:The permeability of tight shale formations varies from micro-Darcy to nano-Darcy. Recently, hydrogen peroxide (H2O2) was tested as an oxidizer to remove the organic matter in the rock in order to increase shale permeability. In this study, shale particles were reacted with hydrogen peroxide solutions under different temperature and pressure conditions in order to “mimic” underground geology conditions. Then, low-temperature nitrogen adsorption and desorption experiments were conducted to measure the pore diameters and porosity of raw and treated shale samples. Moreover, scanning electron microscopy (SEM) images of the samples were analyzed to observe pore structure changes on the surface of shale samples. From the experiments, it was found that the organic matter, including extractable and solid organic matter, could react with H2O2 under high temperature and pressure conditions. The original blocked pores and pore throats were reopened after removing organic matter. With the increase of reaction temperature and pressure, the mean pore diameters of the shale samples decreased first and then increased afterwards. However, the volume and Brunauer–Emmett–Teller (BET) surface areas of the shale particles kept increasing with increasing reaction temperature and pressure. In addition to the effect of reaction temperature and pressure, the pore diameter increased significantly with the increasing reaction duration. As a result, H2O2 could be used to improve the shale permeability.
1. Introduction
Although there are tremendous shale gas resources in unconventional reservoirs, including tight gas shale and sandstone formations, these gas reservoirs have very low diffusivity and permeability, ranging from micro-Darcy to nano-Darcy [1,2,3]. Recently, the development of hydraulic fracturing technology and horizontal drilling has enabled large scale commercial extraction of natural gas from tight shale gas formations. They have been widely applied for shale oil and gas exploration in the United States and have helped keep natural gas prices at a low level. Typically, gas shale contains a collection of organic matter which is scattered through the mineral framework [4,5]. Organic matter in shale can be divided into two categories, extractable organic matter (e.g., residual bitumen) and solid organic matter [6,7]. Extractable organic matter could block and occupy the pores in the thermal mature shale [8]. Over a long geologic time, a network of nano-scale pores was developed in the organic matter for hydrocarbon storage and transportation during petroleum production and migration [9,10]. The intricate pore system in kerogens has large surface areas for gas adsorption. Pores in the kerogen are predominantly characterized as micropores (diameter <2 nm) and mesopores (diameter of 2–50 nm) [11]. Although some macropores (>50 nm) exist in shale matrix, the small size pore diameter, which is typically less than 10 nm for the shale formation, is one of the challenges for massive gas extraction in China [12]. Indeed, pore size and surface areas are the two main parameters affecting the mode of gas storage and mitigation [13]. Micropores and mesopores which have higher surface areas are considered to be potentially better methane adsorption sites, while macropores are conducive to free gas storage due to the large pore volume and less surface areas [13]. Since hydraulic fracturing technology represents a potential hazard to the ecological system and it is not suitable for the shale gas reservoirs with limited water resources, oxidation has been proposed as an alternative way to replace hydraulic fracturing technology. Organic-rich shale has high chemical reactivity and it is sensitive to oxidation reactions [14,15]. Chen et al. have used a high-temperature combustion method to remove organic matter in order to improve the shale matrix diffusivity [16,17].
In addition to high-temperature oxidation, low-temperature oxidation has also been applied to improve shale effective porosity in experiments. Oxidizers such as sodium hypochlorite (NaOCl), sodium peroxodisulfate (Na2S2O8), and hydrogen peroxide (H2O2) have been widely used to remove organic matter from soil [17,18,19]. In order to increase the pore volume and porosity of shale, chloroform (CH3Cl) was firstly used to remove extractable organic matter and then hydrogen peroxide was used to remove solid organic matters [20]. In addition, supercritical CO2 solutions and buffered sodium hypochlorite solutions were used to remove organic matter in the shale [21]. Because of its cost-effectiveness in the removal of organic matter, hydrogen peroxide has been tested as an oxidizer to remove organic matter. You et al. used 15 wt% hydrogen peroxide to remove organic matter from the black shale from the Lower Silurian Longmaxi formation under ambient conditions [22]. A significant increase in pore volume was found in the pores ranging from 10 to 500 nm in diameter of the treated shale. Chen et al also found that mean pore size and pore volume increased with increasing reaction duration with H2O2 under ambient conditions [17]. In practice, the reservoir temperature and pressure are greatly higher than under ambient conditions. Based on a literature review, few studies have been conducted to study the reactions of H2O2 with shale under high temperature and pressure conditions. According to the Energy Information Administration (EIA), the majority of the shale gas is produced from reservoirs from 1000 to 3000 m depth with temperatures of more than 50 °C and pressures between 10 and 30 MPa [23]. The reservoir temperature and pressure would be correspondingly higher. Thus, the reaction circumstances of the shale with H2O2 solutions could be totally different under extreme geothermal conditions with high temperature and pressure.
In this study, shale samples were obtained from the Yanshan area, in Northern China, which is located between the Zhangjiakou (west) and Beipiao (east) areas. The shale samples were heated in a reactor using H2O2 as oxidative solution under different high temperature and pressure conditions. The effect of reaction temperature and pressure on pore size changes was investigated and analyzed. Moreover, SEM images were employed to study pore structure changes on the surface of raw and treated samples.
2. Sample Preparation and Experiments
The shale samples used in this study were collected from the Yanshan area, in Northern China [17]. Before the experiment, samples were ground and screened to get small particles with sizes of 0.45–0.71 mm. Figure 1 shows the raw shale and crushed shale samples. The treated small particles were divided into six groups: one group was used as control group, and the other five groups were prepared by H2O2 treatment under high temperature and pressure.
2.1. Fuel Properties
Table 1 provides the proximate and ultimate analyses results, as well as the thermal conductivity for the shale samples. The total organic matter (TOC), including volatile matter (VM) and fixed carbon (FC), is 10.82% and the carbon content is about 6.24%.
2.2. Experimental Set up and Pressure
Figure 2 shows a diagram of the experimental set up. Before the experiment, about 3–5 g raw samples were first put into the reactor and then about 45 mL of H2O2 solution (containing 15 wt.% of H2O2) was injected into the reactor. The shale particles were immersed in the H2O2 solution at the bottom of the reactor. Afterwards, the reactor was sealed and heated above an electric heater. A thermocouple was inserted from the top of the reactor to measure the temperature of the H2O2 solution. In addition, a pressure sensor was installed on the cover of the reactor to monitor the internal pressure. With the increase of reactor internal temperature, the internal pressure was correspondingly raised. The sealed reactor was quickly heated up and reached steady state by adjusting the input power of the heater. The reactor was kept in steady state for a desired duration, during which the organic matter in the samples oxidized under high temperature and pressure conditions. The temperature and pressure inside the reactor were recorded during the experiments.
Table 3 gives the different experimental conditions of the shale samples. The samples were treated between 100 °C and 180 °C and the pressure inside the reactor was between 0.10 and 1.6 MPa.
2.3. Liquid Nitrogen Adsorption and Desorption Test
After the experiments, raw and treated samples were subjected to low-temperature liquid nitrogen adsorption and desorption test to analyze pore size. The tests were conducted using a Surface Area and Pore Size Analyzer (TriStar II 3020, Micromeritics, Norcross, GA, USA).
2.4. Uncertainty Analysis
The data used in this study such as temperature, pore size, and pressure are all measured values and thus have a degree of uncertainty. The uncertainty analysis of these experiments follows the example of Kegel [26]. Table 4 presents the uncertainties of the instruments used in the experiments according to the respective manufacturers.
3. Results and Discussions
3.1. Liquid Nitrogen Adsorption and Desorption Test Result
3.1.1. Adsorption and Desorption Isotherms
The low-temperature nitrogen adsorption-desorption isotherms of raw and combusted shale samples are shown in Figure 3.
According to the International Union of Pure and Applied Chemistry (IUPAC) classification, adsorption-desorption isotherms can be divided into six types (I to VI) [27]. The six adsorption-desorption isotherms in Figure 3 are all similar to IUPAC Type IV isotherms. Figure 3 shows the adsorbed nitrogen gas volume increases in the order of S-0 to S-5, indicating there is more space in the open pore of the treated shale samples. The existence of capillary condensation will separate the desorption isotherm from the adsorption isotherm and result in hysteresis loops [28,29,30,31,32,33]. The pores with different shapes will cause different shapes of hysteresis loops. Boer et al. classified hysteresis loops into five types (A to E), which can be used to describe the characteristics of corresponding pore shapes [34]. According to his definition, all of the six hysteresis loops in Figure 3 belong to Type B. These hysteresis loops appeared after the middle relative pressure zone (>0.4) with an obvious turning point, indicating extraordinary complex pore systems in the samples [29,32,33]. The adsorption branches increased rapidly at high relative pressure (>0.85), while desorption branches declined rapidly in the middle relative pressure (0.45–0.50). Thus, it can be concluded that there are many cylindrical capillary pores and these pores have a shape of flat narrow slit with all open sides in the samples [32,33].
3.1.2. Diameter Distributions of Shale Samples
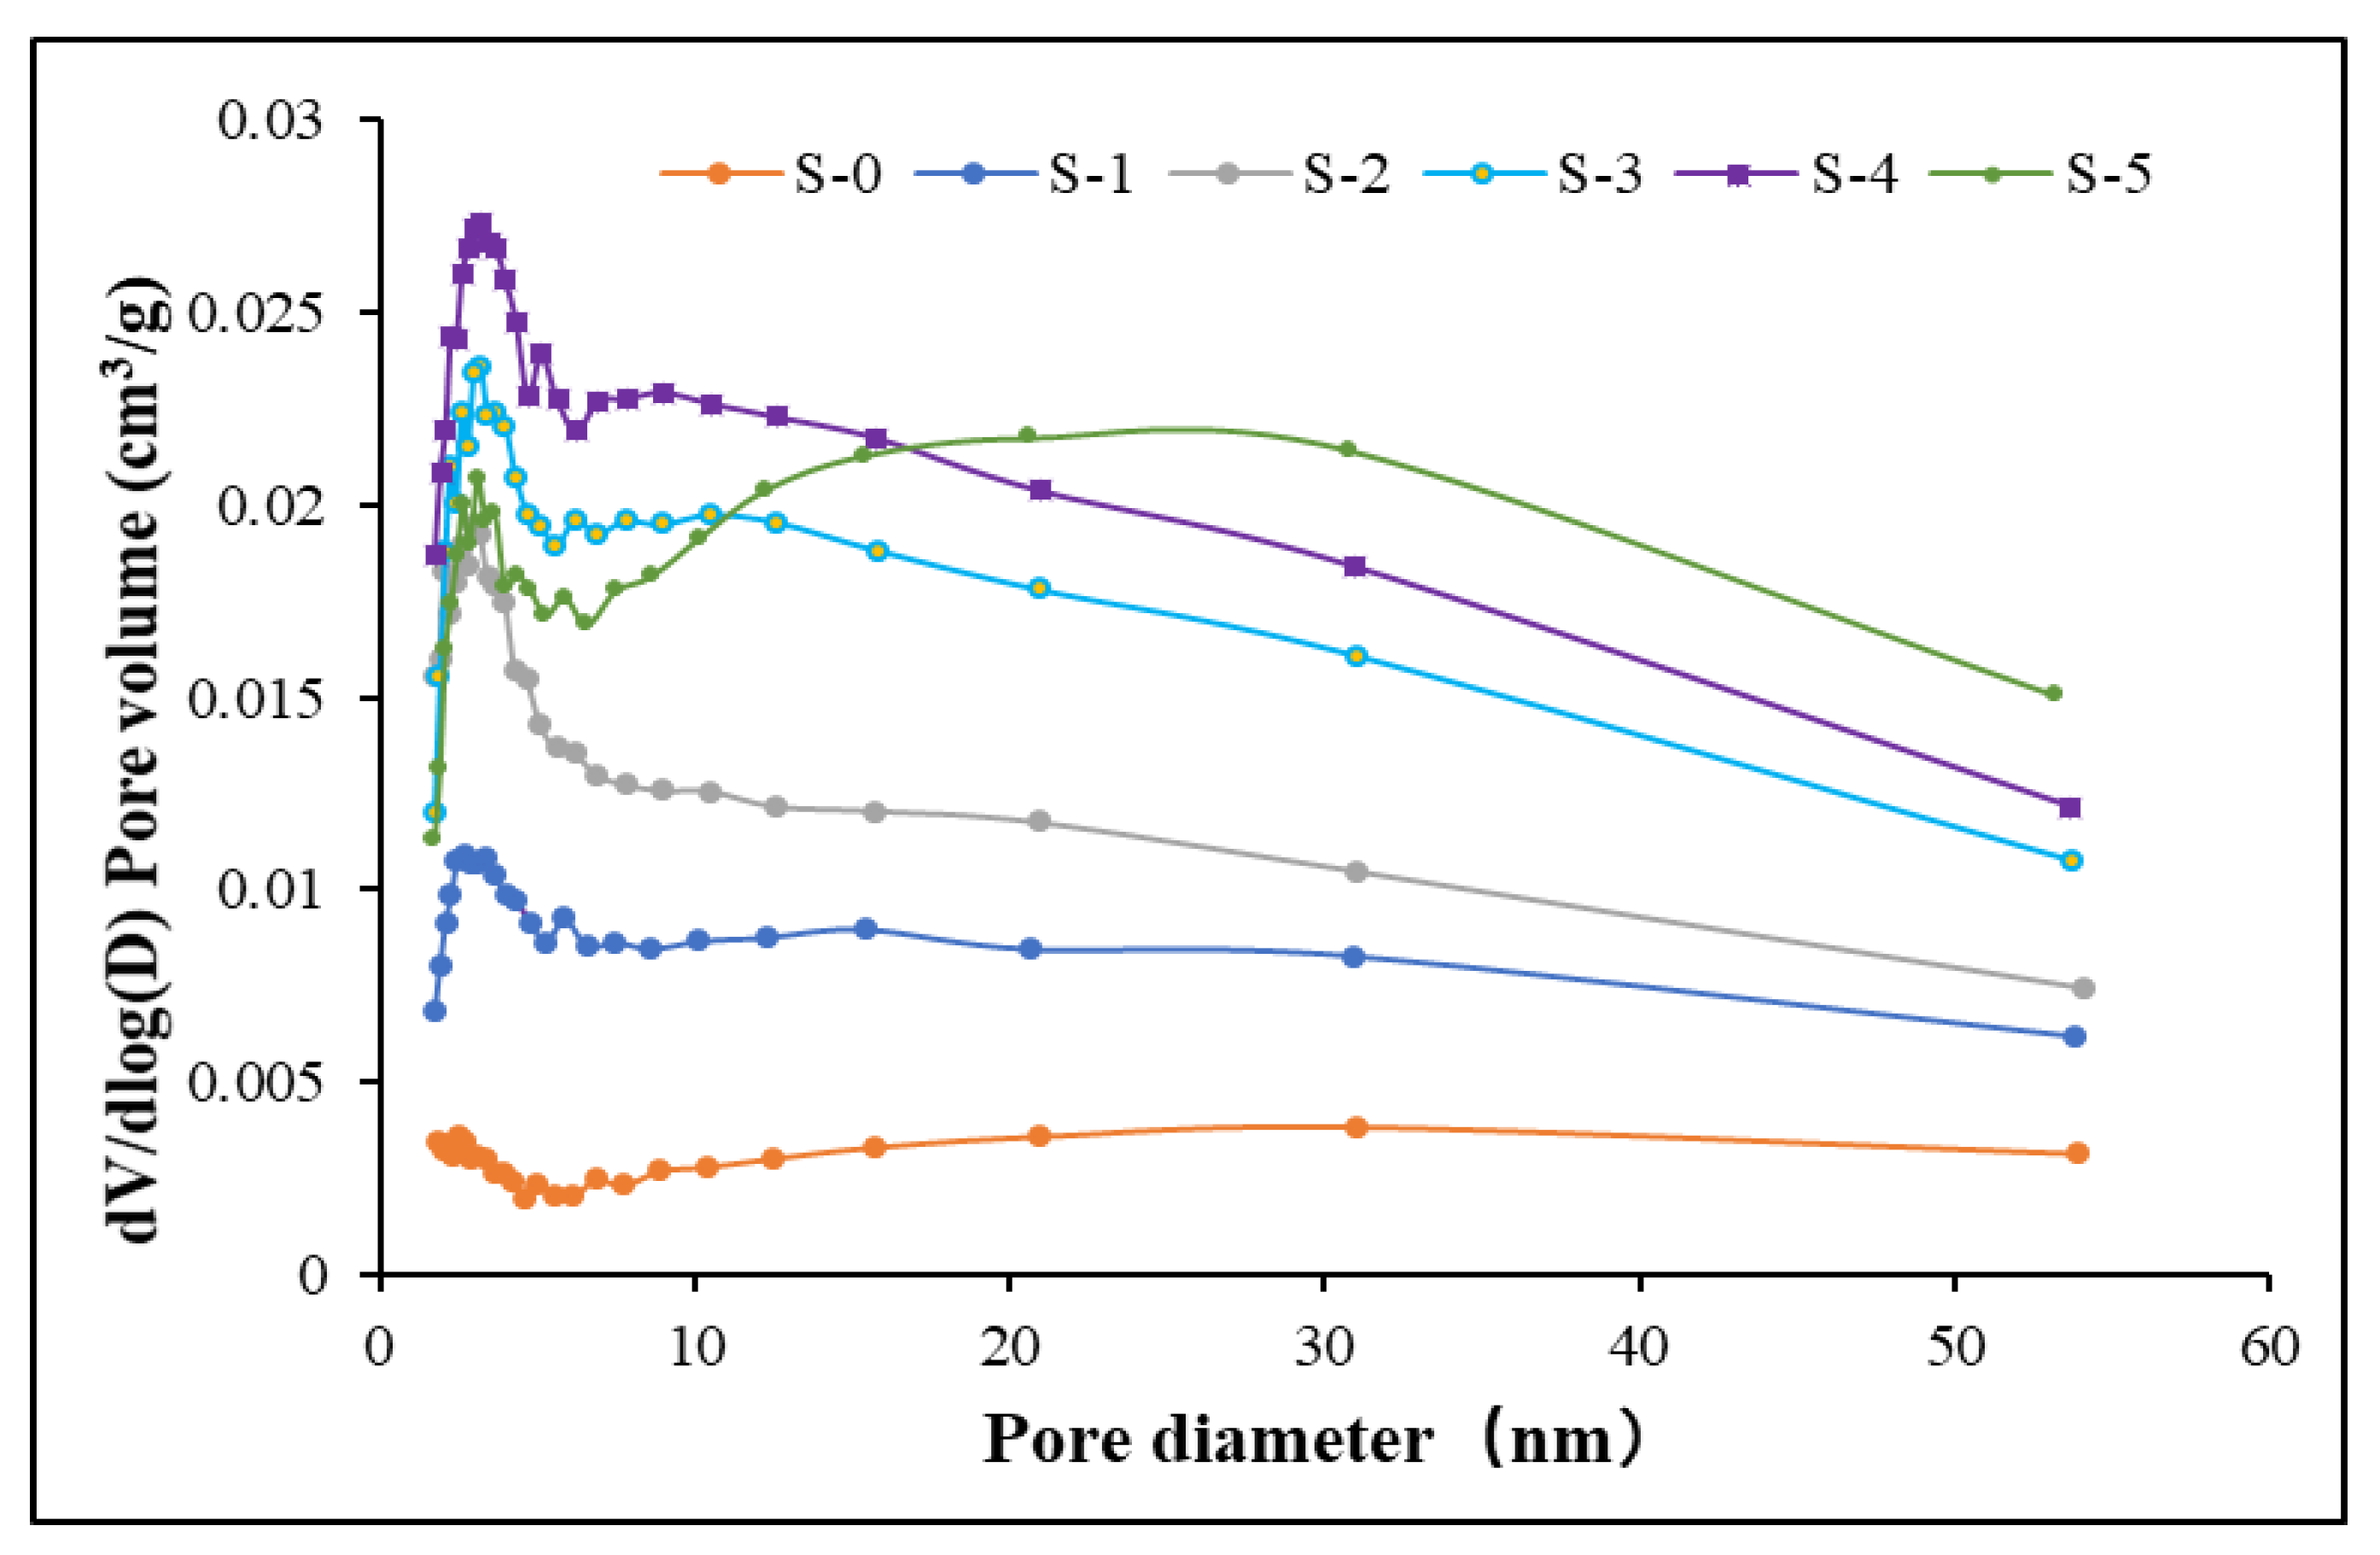
Figure 4 shows the pore volume distribution of the shale particles used in the experiments. Based on the data from low temperature isothermal test, pores of the raw and treated samples were mainly located in the range from 2 nm to 55 nm, especially between 2 nm and 10 nm. For S-0 to S-4, as the reaction temperature and pressure in reactor increased, more organic matters in the shale were oxidized. With the heating going on, new pores were generated and the total pore volume was increased. After approaching steady state, the reaction temperature and pressure reached 180 °C and 1.58 MPa (S-5). Some small pores grew into larger ones with further removal of organic matter. For example, S-5 had more large pores and less small pores. Therefore, more gas was absorbed during low temperature nitrogen adsorption/desorption isothermal experiments. Because of the small pore diameter, the Knudsen number (Kn = λ/Rh) of the gas was greater than 8, where λ is the mean free path of the gas and Rh is the characteristic pore diameter [17]. A large Knudsen number indicates the flow transportation inside the samples is mainly free molecular diffusion, in which case the larger the pore diameter is, the stronger the flow transportation would be. Porosity is normally defined as the percentage of pore volume or void space within rock that can retain fluids while permeability was use to describe the ability of shale rock to transmit fluids [17]. Normally, the increased porosity would result in enhancing permeability [35]. Porosity includes effective porosity (inter-connective pore system) and ineffective porosity (blocked pores). Thus, effective porosity is typically contributed to rock permeability. With the reaction (H2O2 and organic matter) going on, more organic matter was removed. The original blocked pores were reopened which resulted in increasing of the interconnectivity of the pore system. Furthermore, the interconnectivity of the pore system could increase the effective porosity. The increase of effective porosity (eg., interconnected pore system in a rock) contributes to fluid to flow in a reservoir and thus improve permeability.
Thus, under high temperature and pressure conditions using H2O2 as oxidant can improve the gas flow inside shale formation. Due to the limitations of the low temperature nitrogen adsorption/desorption isotherm data, mesopores and partial size of the micropores of macropores were calculated using the Barrett-Joyner-Halenda (BJH) method. More precise measurements of the micropores and macropores such as CO2 adsorption and mercury intrusion porosimetry will be conducted in the future and detailed results of each method will be published elsewhere.
3.1.3. Mean Diameter of Shale Samples
The mean diameters of the raw and treated samples are given in Figure 5. It is interesting that the mean diameters decrease first and then increase again with increasing temperature and pressure. At relatively low pressure and temperature (S-1 and S-2), more small pores (eg., micropores and mesopores) were generated by the removal of extractable organic matter. During this process, the originally blocked pore mouths in the organic matter were reopened by removing the organic matter from the pores and pore throats. Pores with small sizes are preferentially occupied and blocked by organic matter [36]. Pan et al found that shale with moderate maturity and pores with diameters of 2–20 nm were mainly occupied by extractable organic matter [37]. Thus, shale porosity can be promoted with the generation of more effective connected pores, by removal of the extractable organic matter which occupied and blocked the small pores [36]. Reopening of the small blocked pores could result in a lowering of the average pore diameter. Thus, the mean diameter decreased first at relatively high temperature and pressure. When the reaction temperature and pressure went up further, the mean diameter increased again. For example, the mean diameter of the sample increased to about 8 nm for S-5 after 60 minutes of treatment. This is because higher reaction temperature and pressure can speed up the organic matter reaction rate and longer reaction times consumed more organic matter. In this case, pores with larger diameters are created, which resulted in a larger mean diameter of the sample. Longer reaction experiments will be conducted in the future in order to increase shale pore volume and diameter.
3.1.4. BET Surface Areas of the Samples
The BET surface areas of the samples obtained from the low-temperature nitrogen tests are given in Figure 6. The shale samples have high surface areas in the network of pores in shale which was ranged from nanometers (10−9 m) to micrometers (10−6 m) [38]. It is not surprising that the total surface area of the samples (S-0 to S-4) went up with the increase of reaction temperature and pressure after 30 minutes of treatment. The surface area of micropores and mesopores also became larger compared to larger pores [39]. As discussed before, more micropores and mesopores were generated by removal of the original blocked pores during 30 minute treatment. Thus, not only the total surface areas but also surface areas of the micropores and mesopores increased from S-0 to S-4. However, when the shale sample was heated under 180 °C and 1.58 MPa for 60 minutes, the total surface areas as well as micropore areas and mesopore areas decreased. This can be explained by the fact that more pores with larger diameters (macropores) were formed due to the long time treatment by remove of more organic matter from the samples. According to Guo et al, the methane sorption capacity of the bitumen-extracted organic matter is much higher than that of the retaining bitumen [8]. Thus, the removal of extracted organic matter from the kerogen can reduce the shale adsorption capacity and promote the gas transportation capacity.
3.1.5. Pore Volume of the Samples
Figure 7 gives the pore volume distribution of six shale samples. The total pore volume, mesopore volume, micropore volume, and macropore volume increased from S-0 to S-4. Similar to the trend of surface area of micropores, the volume of micropores and mesopores increased first from S-0 to S-4 and decreased for S-5. This is because longer reaction time can result in removal of more organic matter from micropores and mesopores. Thus, the volume of micropores and macropores of the sample treated at 180 and 1.58 MPa for 60 minutes decreased. During the reactions, the exothermic reaction of H2O2 with organic matter generated gases such as CO2, which led to high fluid pressure in pores and protected pores from compaction [36]. Wei et al also found that solvent extraction of soluble bitumen from shale can open additional pore spaces and mesopore volume increased more in extracted samples [10]. With more extractable organic matter removed from the samples under the high temperature and pressure conditions, larger pores were created.
In this study, the shale sample size was in the range of 0.45–0.71 mm, which is much smaller than in the shale formations. Thus, it is most likely that a longer reaction time is needed for the H2O2 to enter the internal pore system of shale to react with the organic matter.
3.2. SEM Images of the Shale Samples
After the experiments, the surface topography of raw and treated shale samples was examined using a scanning electron microscope (SU8010, Hitachi, Tokyo, Japan). SEM images of samples are shown in Figure 8. Compared to raw samples (Figure 8a), it is apparent that there was a morphological evolution on H2O2 treated shale surface obtained under high temperature and pressure conditions. As the reaction temperature and pressure increased, the evolution became more obvious. Some organic matter were removed after being reacted with H2O2, and originally blocked pores and pore throats were reopened [40]. More pores (highlighted with red circles in the figures) and crevices were created on the surface of shale samples. Chen et al also found more pores were created on the shale after it was treated with H2O2 for several hours under ambient conditions [17]. Therefore, the increase of reaction temperature and pressure is beneficial for the improvement of shale porosity/permeability.
4. Conclusions
In this study, shale samples with particle sizes of 0.45-0.71 mm were treated with H2O2 solutions in a reactor under high temperature and pressure conditions in order to increase the shale permeability. The following conclusions were reached:
- 1)
- The pore diameter of the raw shale samples was in the range of 2 to 55 nm; most pore diameters ranged from 2 nm to 10 nm. The Knudsen number of the gas transportation was greater than 8 and free molecule diffusion was the main flow transportation mode inside the shale formation.
- 2)
- The mean diameter of the pores decreased first and increased again with the increase of reaction temperature and pressure. Compared to the sample under ambient condition, more micropores and mesopores were generated, which resulted in a decrease of mean pore diameter at 100 °C and 0.1 MPa. However, the diameter increased further with even higher reaction pressure and temperature.
- 3)
- Not only the total surface areas of samples but also the micropore and mesopore surface areas increased with temperature and pressure after 30 minutes of treatment. However, the total surface area decreased when the sample was heated at 180 °C and 1.58 MPa for 60 minutes. Higher temperature and pressure resulted in less small pores such as micropores and mesopores which have high surface area to volume ratio.
- 4)
- The total pore volume, mesopore volume, and macropore volume increased from the case S-1 to S5 due to the removal of organic matter. However, the volume of micropores increased from S-1 to S-4 first, and then decreased from S-4 to S-5.
As a result, H2O2 treatment of nanosized pore systems in a shale sample at high reaction temperature and pressure can help remove the organic matter from the sample. Longer reaction duration of H2O2 with shale under high temperature and pressure conditions is recommended. More experiments involving longer reaction times will be carried out in the near future.
Author Contributions
Conceptualization: W.C.; Methodology: W.C., W.Y.; Formal Analysis: W.C., J.L. and T.W.; Investigation: W.Y.; Writing—original draft preparation: W.Y.; Writing—review and editing: W.C., J.L. and T.W.; Supervision: W.C.; Funding acquisition: W.C.
Funding
The authors wish to acknowledge the financial support by Natural Science Foundation of Jiangsu Province [Grant No: BK20181170] and National Natural Science Foundation of China [Grant No. 51776132].
Acknowledgments
The authors would like to acknowledge the technical support from professor Yilin Chen and Jiafeng Sun.
Conflicts of Interest
The authors declare no conflict of interest and the funding sponsors had no role in the design of the study; in the collection, analyses, or interpretation of data; in the writing of the manuscript, and in the decision to publish the results.
Abbreviations
| BET | Brunauer–Emmett–Teller |
| EIA | Energy Information Administration |
| FC | Fixed carbon |
| IUPAC | International Union of Pure and Applied Chemistry |
| Ro | Vitrinite-like macerals reflectance |
| SEM | Scanning electron microscopy |
| TOC | Total organic carbon |
| VM | Volatile matter |
References
- Cui, X.; Bustin, A.; Bustin, R. Measurements of gas permeability and diffusivity of tight reservoir rocks: Different approaches and their applications. Geofluids 2009, 9, 208–223. [Google Scholar] [CrossRef]
- Zhou, Y.; Chen, W.; Lei, Y. Combustion Characteristics of Tight Sandstone. Energy Fuels 2018, 32, 6293–6299. [Google Scholar] [CrossRef]
- Liu, J.; Wang, J.; Leung, C.; Gao, F. A Fully Coupled Numerical Model for Microwave Heating Enhanced Shale Gas Recovery. Energies 2018, 11, 1608. [Google Scholar] [CrossRef]
- Lee, T.; Bocquet, L.; Coasne, B. Activated desorption at heterogeneous interfaces and long-time kinetics of hydrocarbon recovery from nanoporous media. Nat. Commun. 2016, 7, 11890. [Google Scholar] [CrossRef] [PubMed] [Green Version]
- Su, S.; Jiang, Z.; Xuanlong, S.; Zhang, C.; Zou, Q.; Li, Z.; Zhu, R. The effects of shale pore structure and mineral components on shale oil accumulation in the Zhanhua Sag, Jiyang Depression, Bohai Bay Basin, China. J. Petrol. Sci. Eng. 2018, 165, 365–374. [Google Scholar] [CrossRef]
- Curtis, M.E.; Cardott, B.J.; Sondergeld, C.H.; Rai, C.S. Development of organic porosity in the Woodford Shale with increasing thermal maturity. Int. J. Coal Geol. 2012, 103, 26–31. [Google Scholar] [CrossRef]
- Valenza, J.; Drenzek, N.; Marques, F.; Pagels, M.; Mastalerz, M. Geochemical controls on shale microstructure. Geology 2013, 41, 611–614. [Google Scholar] [CrossRef]
- Guo, H.; Jia, W.; Peng, P.a.; Lei, Y.; Luo, X.; Cheng, M.; Wang, X.; Zhang, L.; Jiang, C. The composition and its impact on the methane sorption of lacustrine shales from the Upper Triassic Yanchang Formation, Ordos Basin, China. Mar. Petrol. Geol. 2014, 57, 509–520. [Google Scholar] [CrossRef]
- Yang, J.; Hatcherian, J.; Hackley, P.C.; Pomerantz, A.E. Nanoscale geochemical and geomechanical characterization of organic matter in shale. Nat. Commun. 2017, 8, 2179. [Google Scholar] [CrossRef] [PubMed]
- Wei, L.; Mastalerz, M.; Schimmelmann, A.; Chen, Y. Influence of Soxhlet-extractable bitumen and oil on porosity in thermally maturing organic-rich shales. Int. J. Coal Geol. 2014, 132, 38–50. [Google Scholar] [CrossRef] [Green Version]
- Kuila, U.; Prasad, M.; Kazemi, H. Assessing Knudsen flow in gas-flow models of shale reservoirs. Can. Soc. Explor. Geophys. 2013, 38, 23–27. [Google Scholar]
- Adesida, A.G.; Akkutlu, I.; Resasco, D.E.; Rai, C.S. Characterization of Barnett Shale Kerogen Pore Size Distribution using DFT Analysis and Grand Canonical Monte Carlo Simulations. Soc. Petrol. Eng. 2011, 182, 401–417. [Google Scholar]
- Labani, M.; Rezaee, R. Petrophysical evaluation of gas shale reservoirs. In Fundamentals of Gas Shale Reverviors; Rezaee, R., Ed.; John Wiley& Sons Inc.: New Jersey, NJ, USA, 2015; pp. 117–138. [Google Scholar]
- Jin, L.; Mathur, R.; Rother, G.; Cole, D.; Bazilevskaya, E.; Williams, J.; Carone, A.; Brantley, S. Evolution of porosity and geochemistry in Marcellus Formation black shale during weathering. Chem. Geol. 2013, 356, 50–63. [Google Scholar] [CrossRef]
- Tamamura, S.; Ueno, A.; Aramaki, N.; Matsumoto, H.; Uchida, K.; Igarashi, T.; Kaneko, K. Effects of oxidative weathering on the composition of organic matter in coal and sedimentary rock. Org. Geochem. 2015, 81, 8–19. [Google Scholar] [CrossRef]
- Chen, W.; Lei, Y.; Ma, L.; Yang, L. Experimental Study of High Temperature Combustion for Enhanced Shale Gas Recovery. Energy Fuels 2017, 31, 10003–10010. [Google Scholar] [CrossRef]
- Zhou, Y.; Lei, Y.; Chen, W.; Yu, W. Enhance low temperature oxidization of shale gas recovery using hydrogen peroxide. J. Petrol. Sci. Eng. 2018, 164, 523–530. [Google Scholar] [CrossRef]
- Mikutta, R.; Kleber, M.; Kaiser, K.; Jahn, R. Review: Organic matter removal from soils using hydrogen peroxide, sodium hypochlorite, and disodium peroxodisulfate. Soil Sci. Soc. Am. J. 2005, 69, 120–135. [Google Scholar] [CrossRef]
- Zimmermann, M.; Leifeld, J.; Abiven, S.; Schmidt, M.W.I.; Fuhrer, J. Sodium hypochlorite separates an older soil organic matter fraction than acid hydrolysis. Geoderma 2007, 139, 171–179. [Google Scholar] [CrossRef]
- Wu, K.; Chen, Z.; Li, X.; Dong, X. Methane storage in nanoporous material at supercritical temperature over a wide range of pressures. Sci. Rep. 2016, 6, 33461. [Google Scholar] [CrossRef] [Green Version]
- Kuila, U.; McCarty, D.K.; Derkowski, A.; Fischer, T.B.; Topór, T.; Prasad, M. Nano-scale texture and porosity of organic matter and clay minerals in organic-rich mudrocks. Fuel 2014, 135, 359–373. [Google Scholar] [CrossRef] [Green Version]
- Chen, Q.; Kang, Y.; You, L.; Yang, P.; Zhang, X.; Cheng, Q. Change in composition and pore structure of Longmaxi black shale during oxidative dissolution. Int. J. Coal Geol. 2017, 172, 95–111. [Google Scholar] [CrossRef]
- EIA. Technically Recoverable Shale Oil and Shale Gas Resources: An Asessment of 137 Shale Formations in 41 Countries outside the United States; EIA: Washington, DC, USA, June 2013.
- Chen, W.; Lei, Y.; Chen, Y.; Sun, J. Pyrolysis and Combustion Enhance Recovery of Gas for Two China Shale Rocks. Energy Fuels 2016, 30, 10298–10305. [Google Scholar] [CrossRef]
- Pan, S.; Zou, C.; Yang, Z.; Dong, D.; Wang, Y.; Wang, S.; Wu, S.; Huang, J.; Liu, Q.; Wang, D.; et al. Methods for shale gas play assessment: A comparison between Silurian Longmaxi shale and Mississippian Barnett shale. J. Earth Sci. 2015, 26, 285–294. [Google Scholar] [CrossRef]
- Kegel, T.M. Basic measurement uncertainty. In Proceedings of the 71st International School of Hydrocarbon Measurement, Oklahoma City, OK, USA, 9–11 April 1996; pp. 1–7. [Google Scholar]
- Sing, K.S.W.; Everett, D.H.; Haul, R.A.W.; Moscou, L.; Pierotti, R.A.; Rouquérol, J.; Siemieniewska, T. Reporting physisorption data for gas or solid systems with special reference to the determination of surface area and porosity. Pure Appl. Chem. 1982, 54, 2201–2218. [Google Scholar] [CrossRef]
- Chen, Y.; Qin, Y.; Wei, C.; Huang, L.; Shi, Q.; Wu, C.; Zhang, X. Porosity changes in progressively pulverized anthracite subsamples: Implications for the study of closed pore distribution in coals. Fuel 2018, 225, 612–622. [Google Scholar] [CrossRef]
- Shan, C.; Zhang, T.; Guo, J.; Zhang, Z.; Yang, Y. Characterization of the micropore systems in the high-rank coal reservoirs of the southern Sichuan Basin, China. AAPG Bull. 2015, 99, 2099–2119. [Google Scholar] [CrossRef]
- Yao, Y.; Liu, D.; Tang, D.; Tang, S.; Huang, W. Fractal characterization of adsorption-pores of coals from North China: An investigation on CH4 adsorption capacity of coals. Int. J. Coal Geol. 2008, 73, 27–42. [Google Scholar] [CrossRef]
- Mastalerz, M.; He, L.; Melnichenko, Y.B.; Rupp, J.A. Porosity of Coal and Shale: Insights from Gas Adsorption and SANS/USANS Techniques. Energy Fuels 2012, 26, 5109–5120. [Google Scholar] [CrossRef]
- Nie, B.; Liu, X.; Yang, L.; Meng, J.; Li, X. Pore structure characterization of different rank coals using gas adsorption and scanning electron microscopy. Fuel 2015, 158, 908–917. [Google Scholar] [CrossRef]
- Chen, P.; Tang, X. The research on the adsorption of nitrogen in low temperature and micro-pore properties in coal. J. China Coal Soc. 2001, 5, 552–556. [Google Scholar]
- Deboer, J.H. The Structure and Properties of Porous Materials; Butterworths: London, UK, 1958; Volume 389. [Google Scholar]
- Kibodeaux, K.R. Evolution of porosity, permeability, and fluid saturations during thermal conversion of oil shale. Soc. Petrol. Eng. 2014. [Google Scholar] [CrossRef]
- Yang, Z.; Wang, W.; Dong, M.; Wang, J.; Li, Y.; Gong, H.; Sang, Q. A model of dynamic adsorption–diffusion for modeling gas transport and storage in shale. Fuel 2016, 173, 115–128. [Google Scholar] [CrossRef]
- Pan, L.; Xiao, X.; Zhou, Q. The influence of soluble organic matter on shale reservoir characterization. J. Nat. Gas Geosci 2016, 1, 243–249. [Google Scholar] [CrossRef] [Green Version]
- Javadpour, F.; Fisher, D.; Unsworth, M. Nanoscale Gas Flow in Shale Gas Sediments. J. Can. Petrol. Technol. 2007, 46. [Google Scholar] [CrossRef]
- Yang, F.; Ning, Z.; Zhang, R.; Zhao, H.; Krooss, B.M. Investigations on the methane sorption capacity of marine shales from Sichuan Basin, China. Int. J. Coal Geol. 2015, 146, 104–117. [Google Scholar] [CrossRef]
- Xiong, F.; Jiang, Z.; Chen, J.; Wang, X.; Huang, Z.; Liu, G.; Chen, F.; Li, Y.; Chen, L.; Zhang, L. The role of the residual bitumen in the gas storage capacity of mature lacustrine shale: A case study of the Triassic Yanchang shale, Ordos Basin, China. Mar. Petrol. Geol. 2016, 69, 205–215. [Google Scholar] [CrossRef]
Figure 1.
(a) raw shale sample; (b) crushed shale samples.

Figure 2.
Experimental set up.

Figure 3.
Adsorption-desorption isotherms of raw and treated shale particles.

Figure 4.
Pore volume distribution of raw and treated shale particles.

Figure 5.
The mean diameters of the raw and treated shale samples.

Figure 6.
Surface areas of six shale samples.

Figure 7.
Pore volumes of six shale samples.

Figure 8.
SEM images of the raw and treated shale samples: (a) Raw sample S-0; (b) Sample S-1; (c) Sample S-3; (d) Sample S-4.
Figure 8.
SEM images of the raw and treated shale samples: (a) Raw sample S-0; (b) Sample S-1; (c) Sample S-3; (d) Sample S-4.


Table 1.
Proximate and ultimate analysis (%) [24].
Table 1.
Proximate and ultimate analysis (%) [24].
| Moisture | 0.7 |
| Ash | 89.09 |
| VM | 8.11 |
| FC | 2.71 |
| Carbon | 6.24 |
| Oxygen | 3.09 |
| Hydrogen | 0.72 |
| Nitrogen | 0.16 |
| Sulfur | 0.63 |
| Thermal conductivity (kJ/m/s) | 1.56 |
Table 2.
Geochemical characteristics of the shale samples [24].
Table 2.
Geochemical characteristics of the shale samples [24].
| Samples | Exinite (%) | Vitrinite (%) | Inertinite (%) | Ro (%) | Organic Matter Type |
|---|---|---|---|---|---|
| Shale | 68 | 14 | 18 | 1.85 | II |
Table 3.
Experimental conditions of the shale samples.
| Sample | Time (Minute) | Temperature (°C) | Pressure (MPa) |
|---|---|---|---|
| S-1 | 30 | 100 | 0.10 |
| S-2 | 30 | 120 | 0.48 |
| S-3 | 30 | 130 | 0.55 |
| S-4 | 30 | 140 | 1.48 |
| S-5 | 60 | 180 | 1.58 |
Table 4.
Instrument Uncertainty.
| Instrument | Accuracy | Resolution | Units | Total Instrument Uncertainty |
|---|---|---|---|---|
| Thermocouple | ±1% | 0.1 | °C | 1.0% |
| Pore Size Analyzer | ±2% | 1.0 | nm | 2.0% |
| BET | ±2% | 0.01 | m2/g | 2.0% |
| Pressure sensor | ±0.5% | 0.1 | kPa | 0.51% |
© 2019 by the authors. Licensee MDPI, Basel, Switzerland. This article is an open access article distributed under the terms and conditions of the Creative Commons Attribution (CC BY) license (http://creativecommons.org/licenses/by/4.0/).
Share and Cite
MDPI and ACS Style
Yu, W.; Lei, J.; Wang, T.; Chen, W. H2O2-Enhanced Shale Gas Recovery under Different Thermal Conditions. Energies 2019, 12, 2127. https://doi.org/10.3390/en12112127
AMA Style
Yu W, Lei J, Wang T, Chen W. H2O2-Enhanced Shale Gas Recovery under Different Thermal Conditions. Energies. 2019; 12(11):2127. https://doi.org/10.3390/en12112127
Chicago/Turabian StyleYu, WeiGang, Jiang Lei, Tengxi Wang, and Wei Chen. 2019. "H2O2-Enhanced Shale Gas Recovery under Different Thermal Conditions" Energies 12, no. 11: 2127. https://doi.org/10.3390/en12112127
Note that from the first issue of 2016, this journal uses article numbers instead of page numbers. See further details here.