Prediction of Bubble Departure in Forced Convection Boiling with a Mechanistic Model That Considers Dynamic Contact Angle and Base Expansion


Abstract
:1. Introduction
Bubble Dynamics
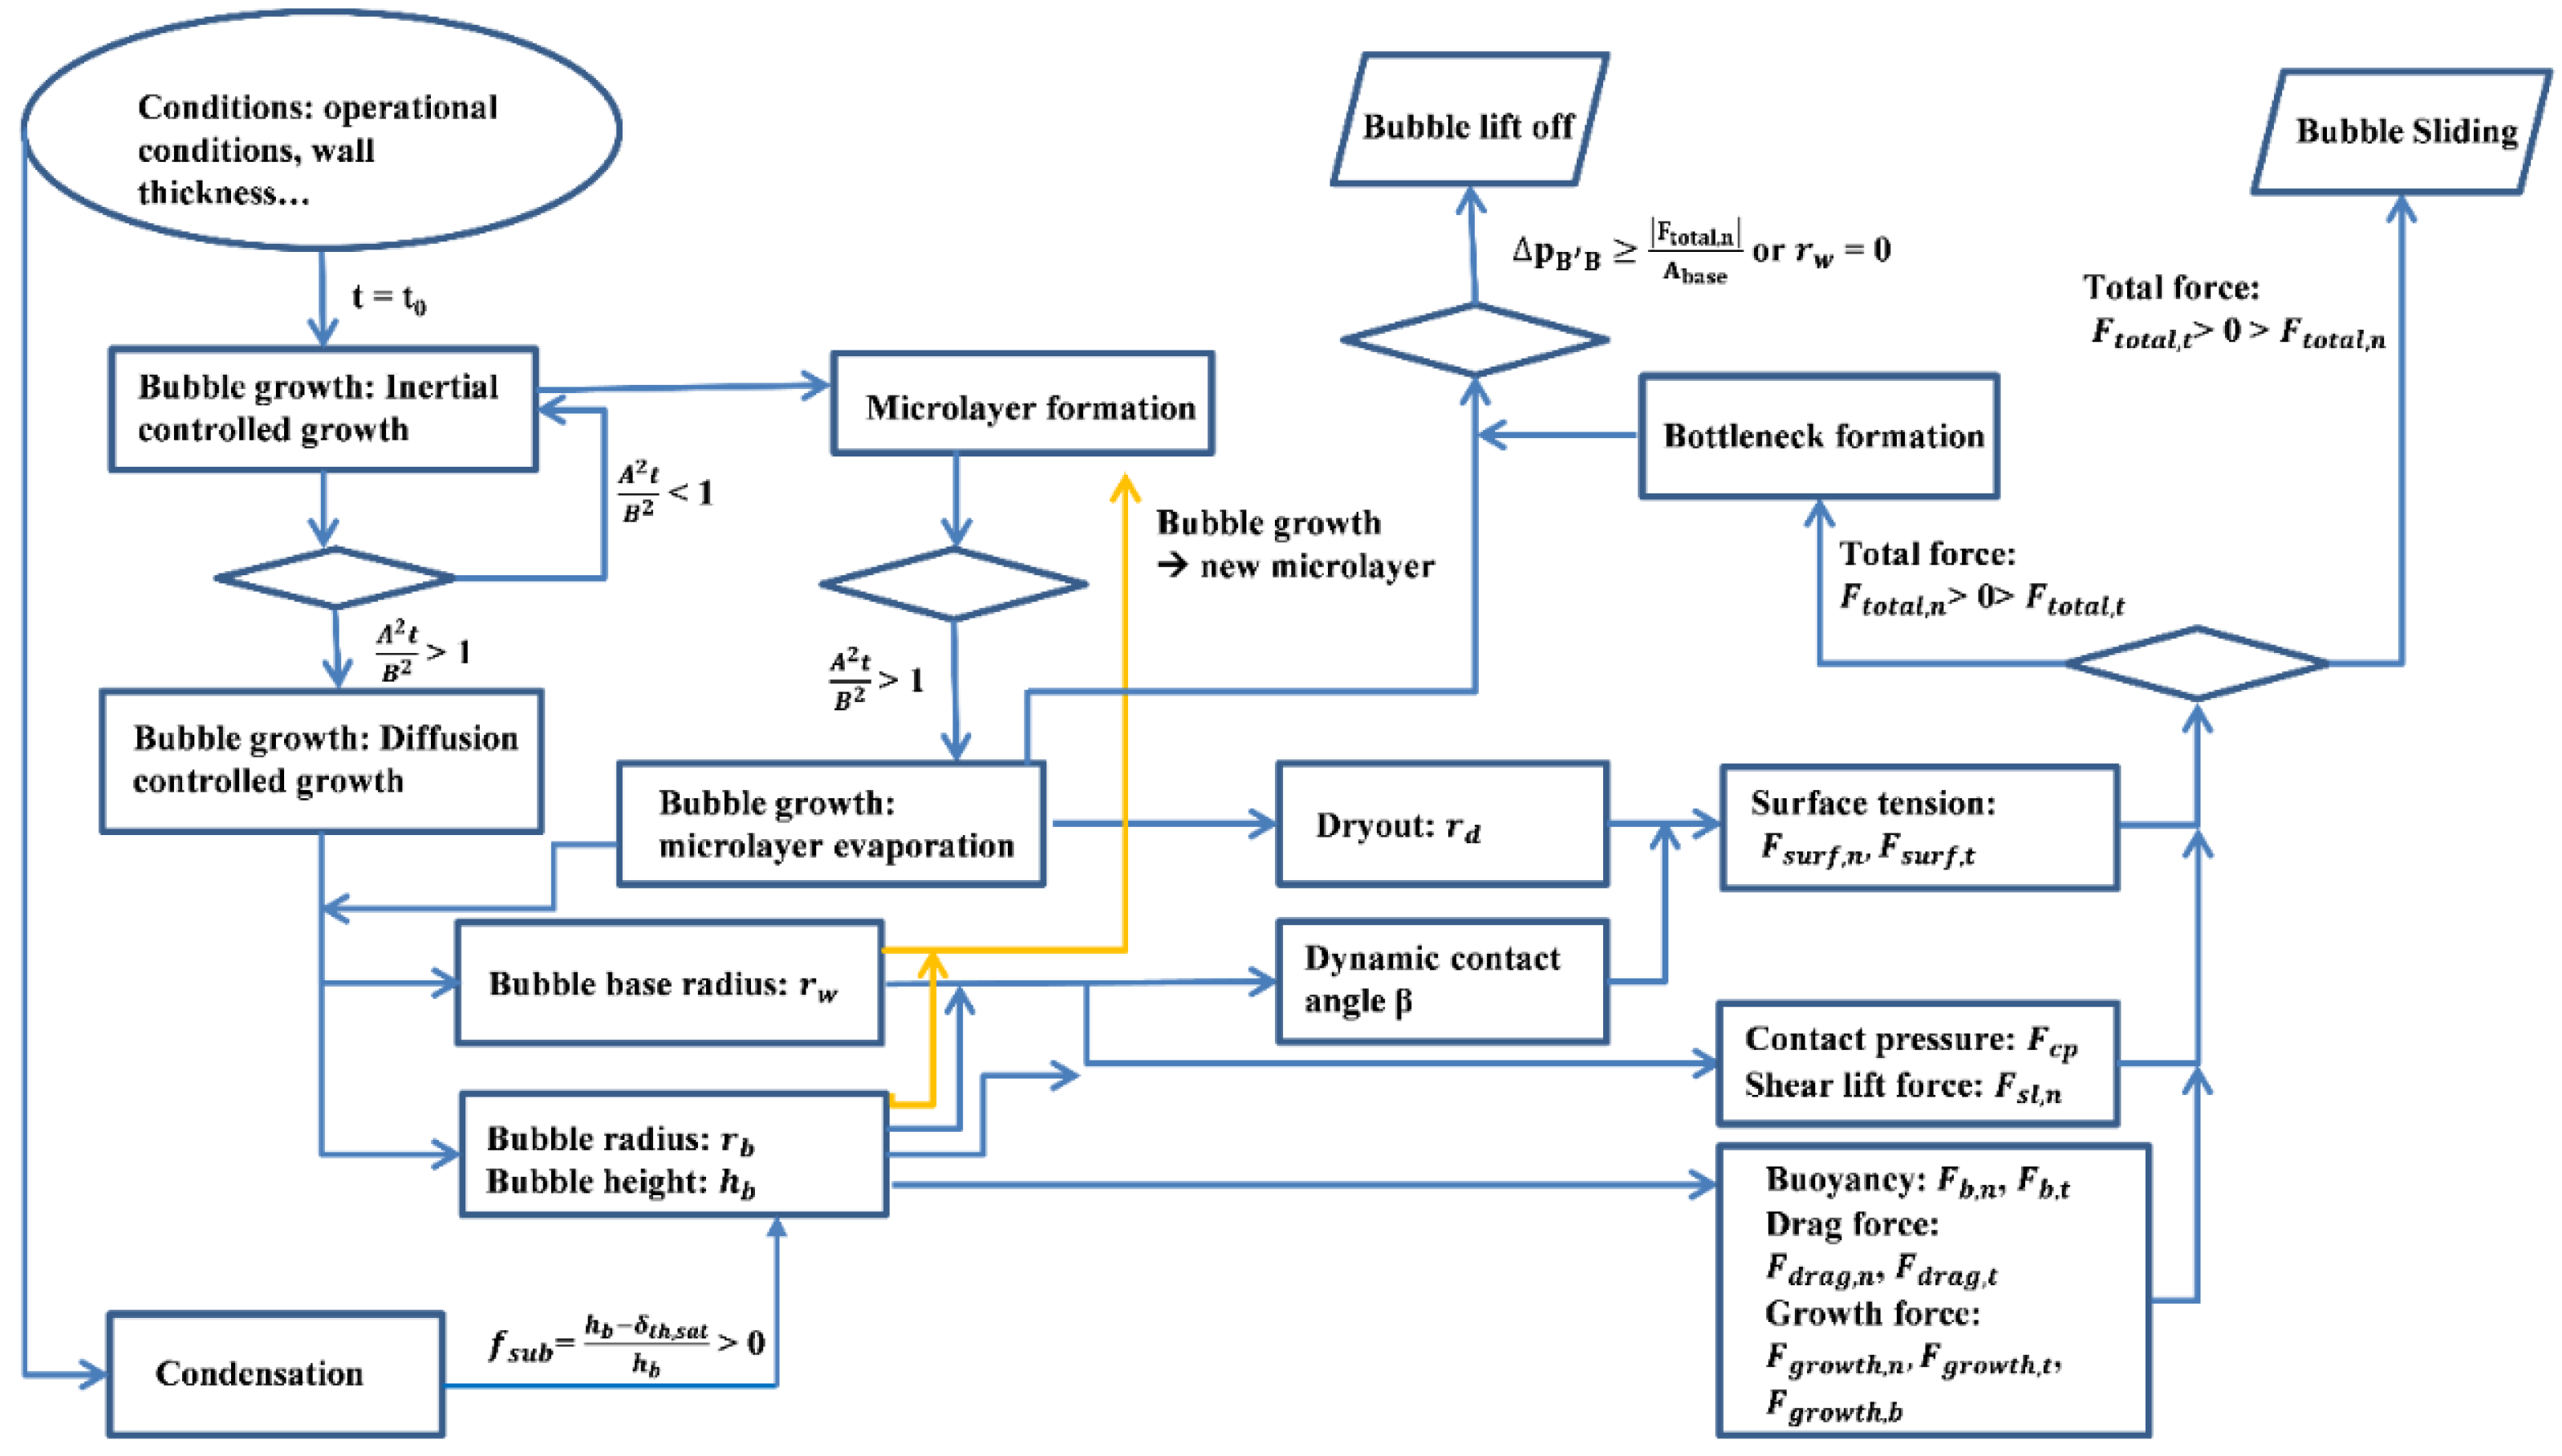
2. Bubble Growth and Detachment Models
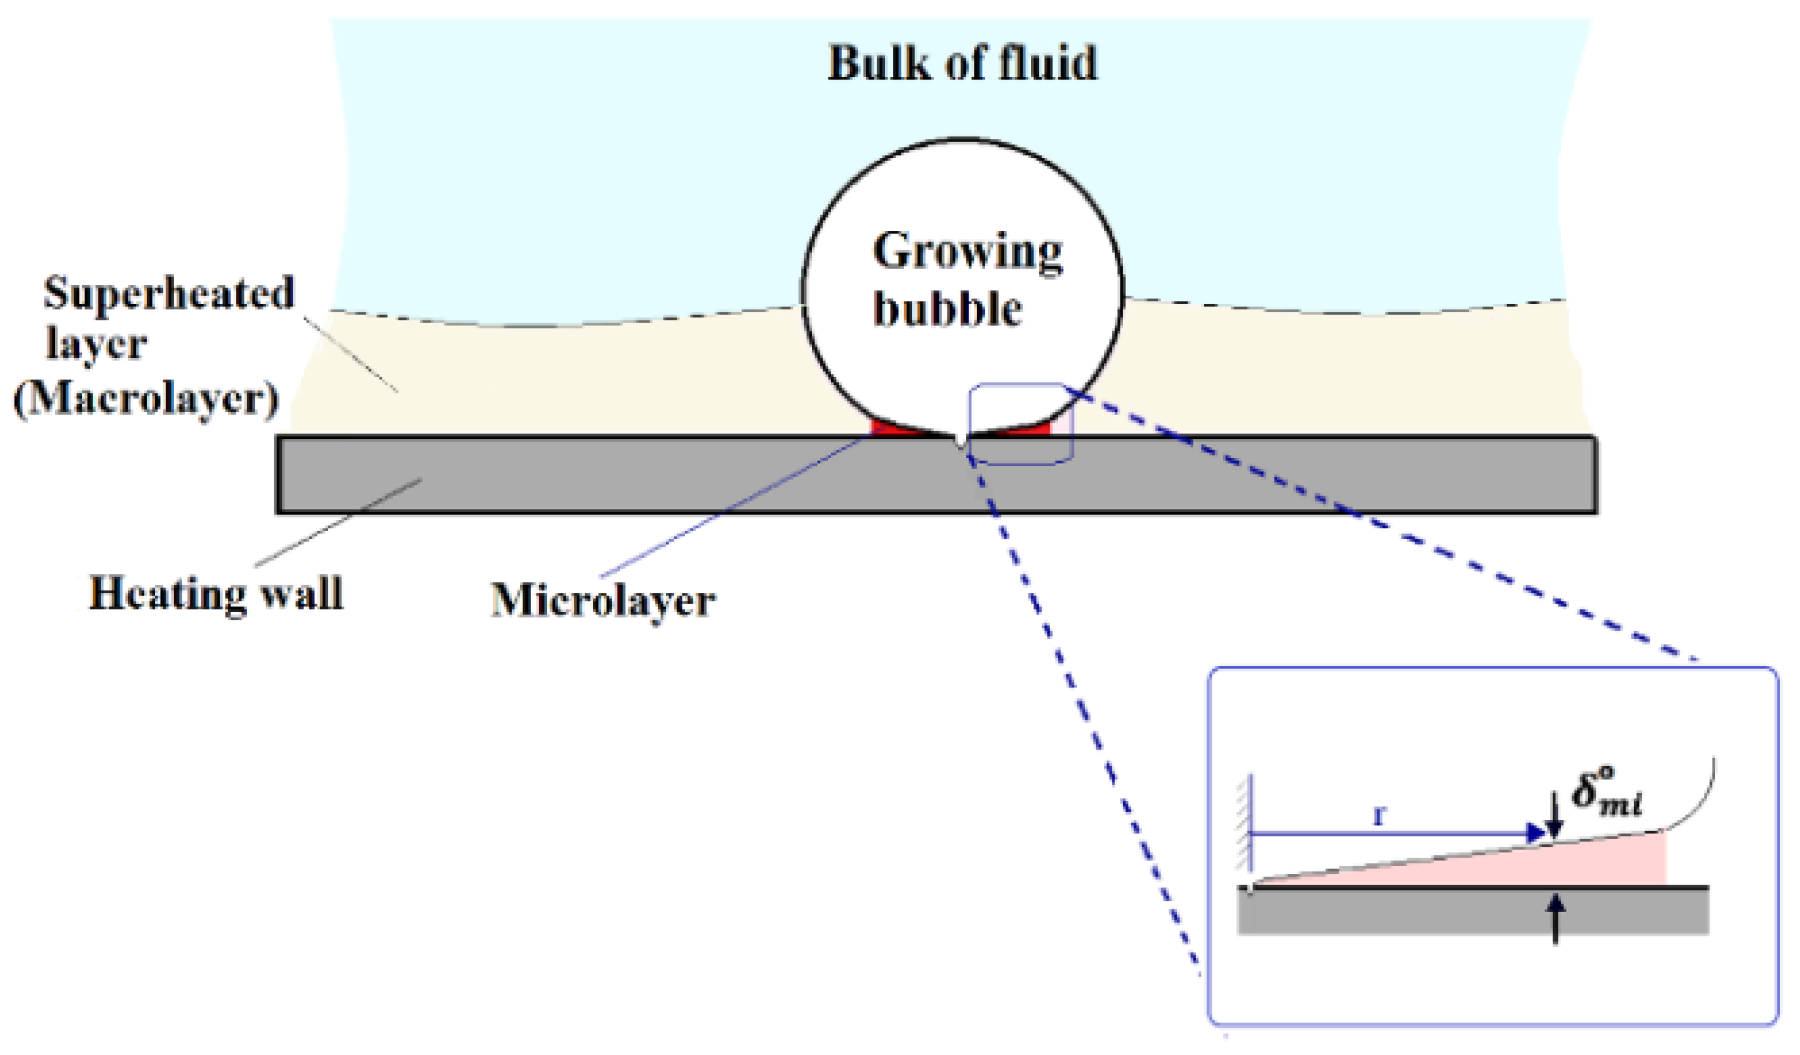
2.1. Bubble Growth Rate
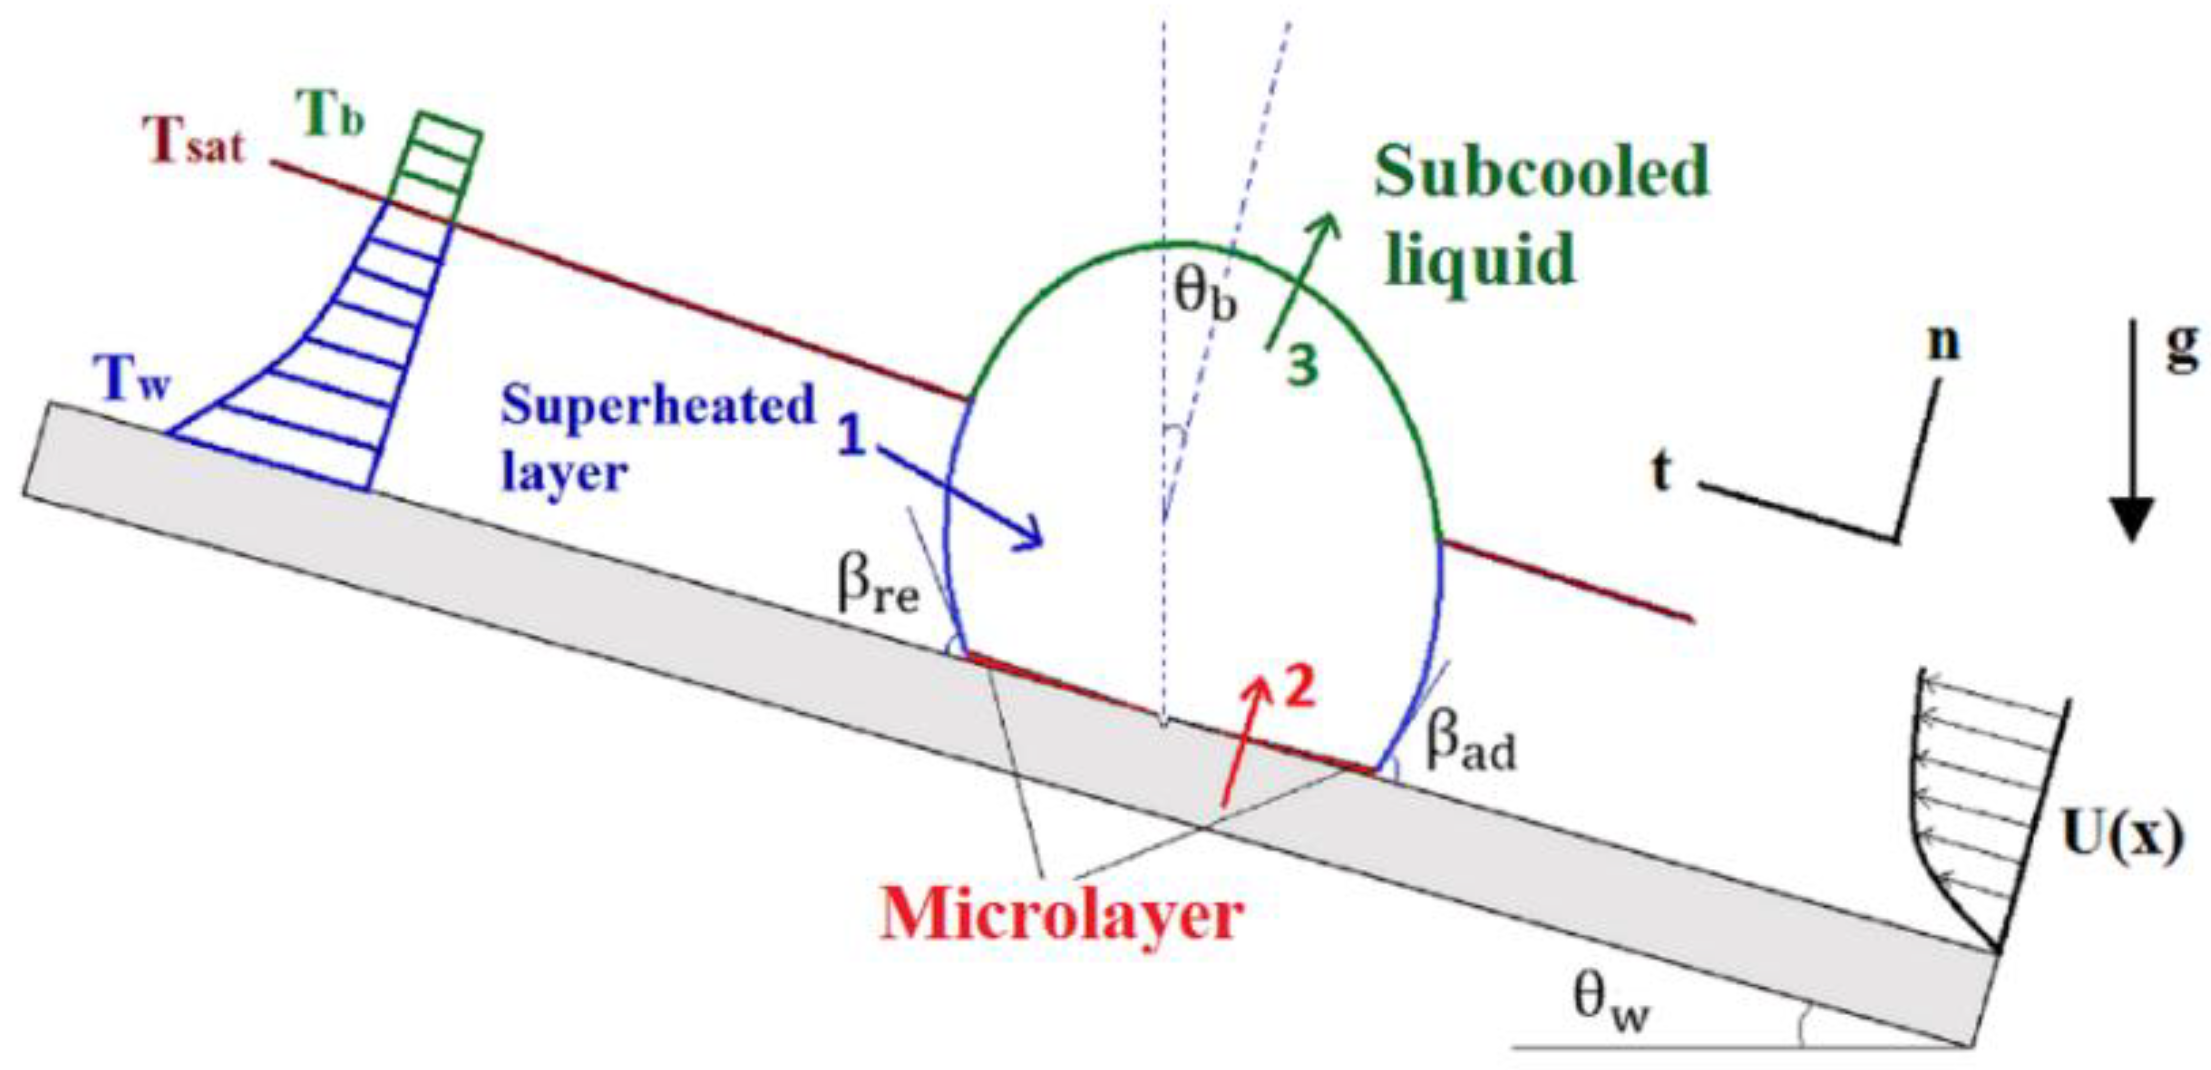
2.2. Forces Acting on a Growing Bubble
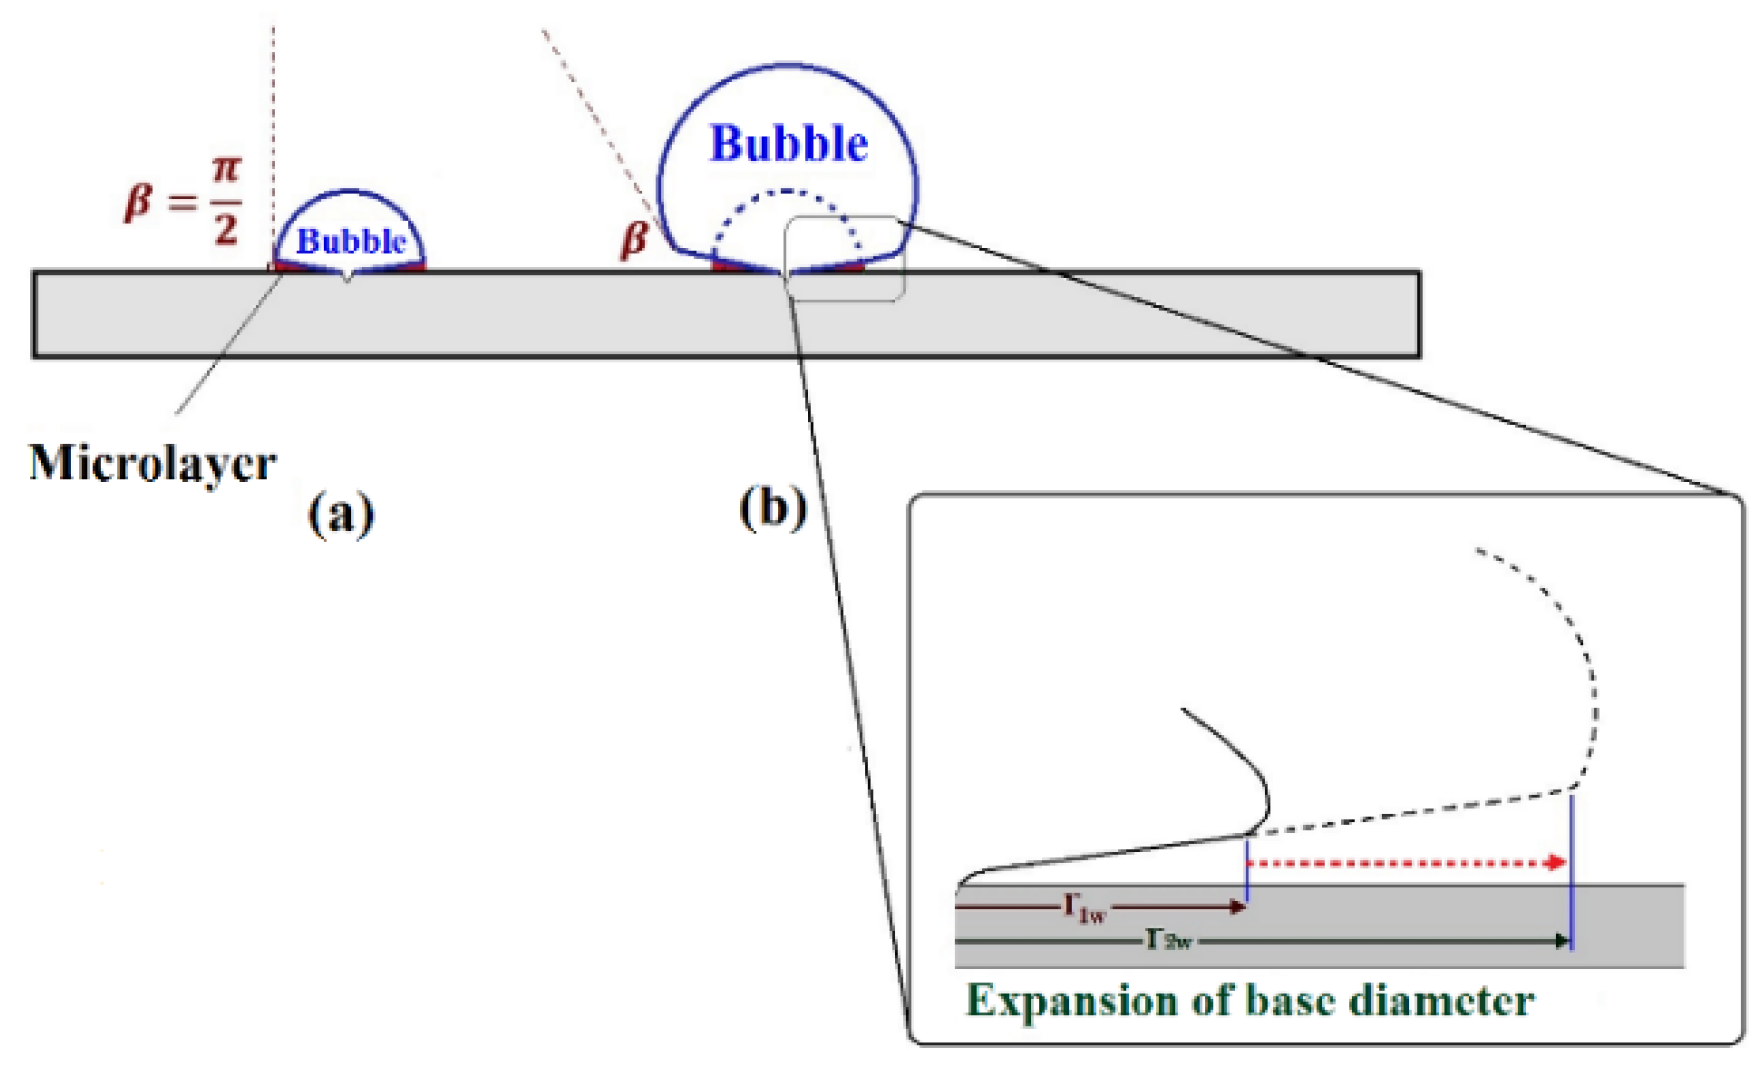
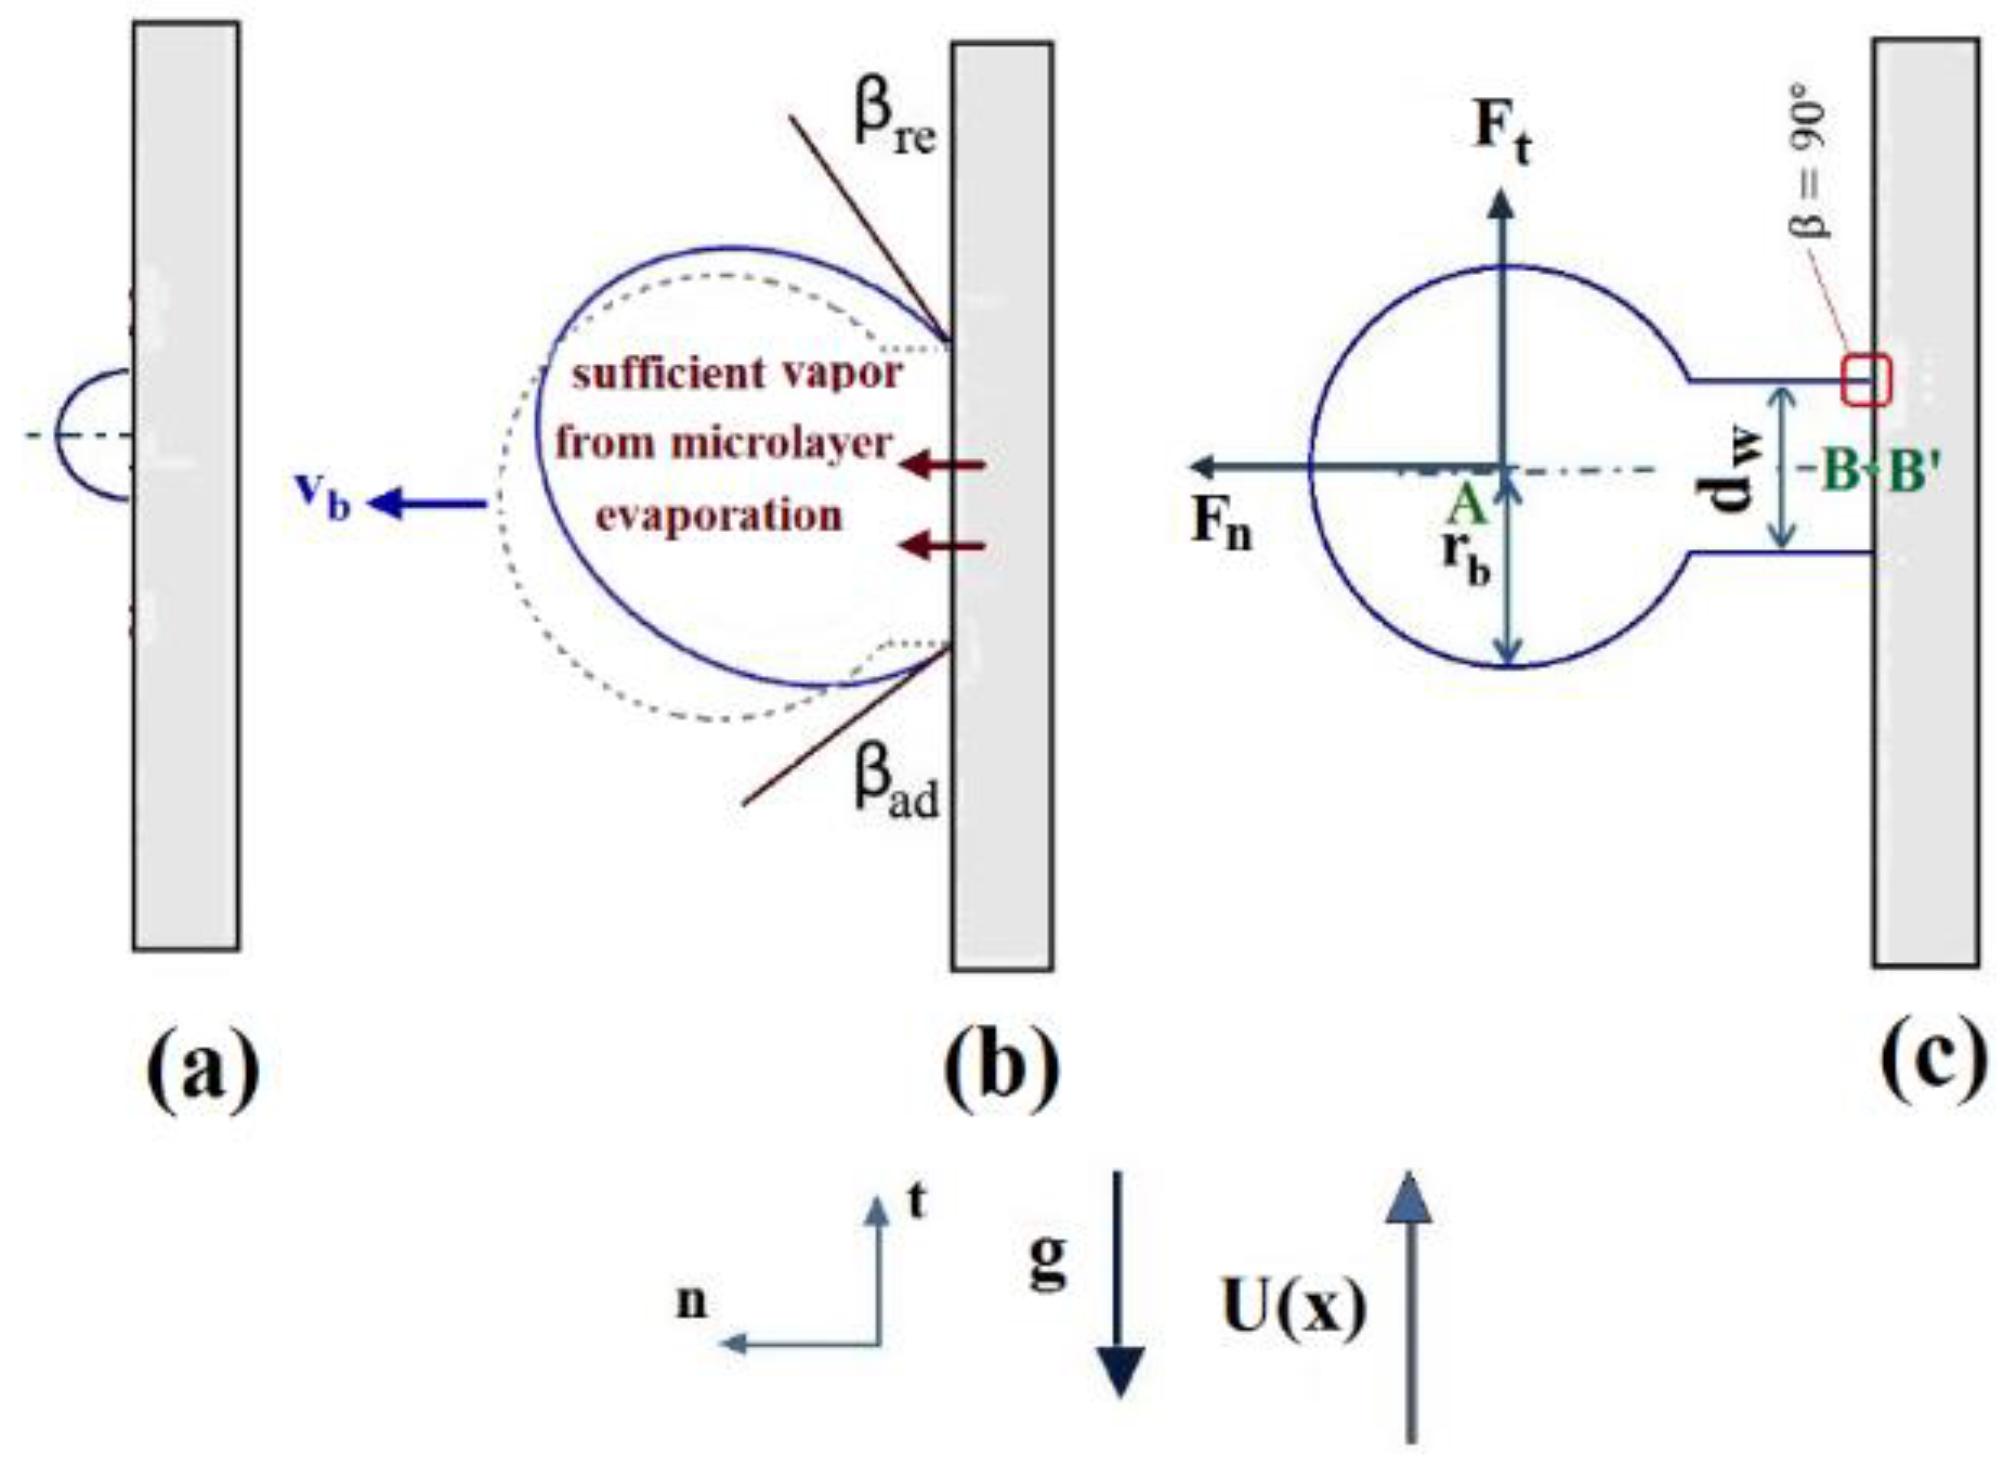
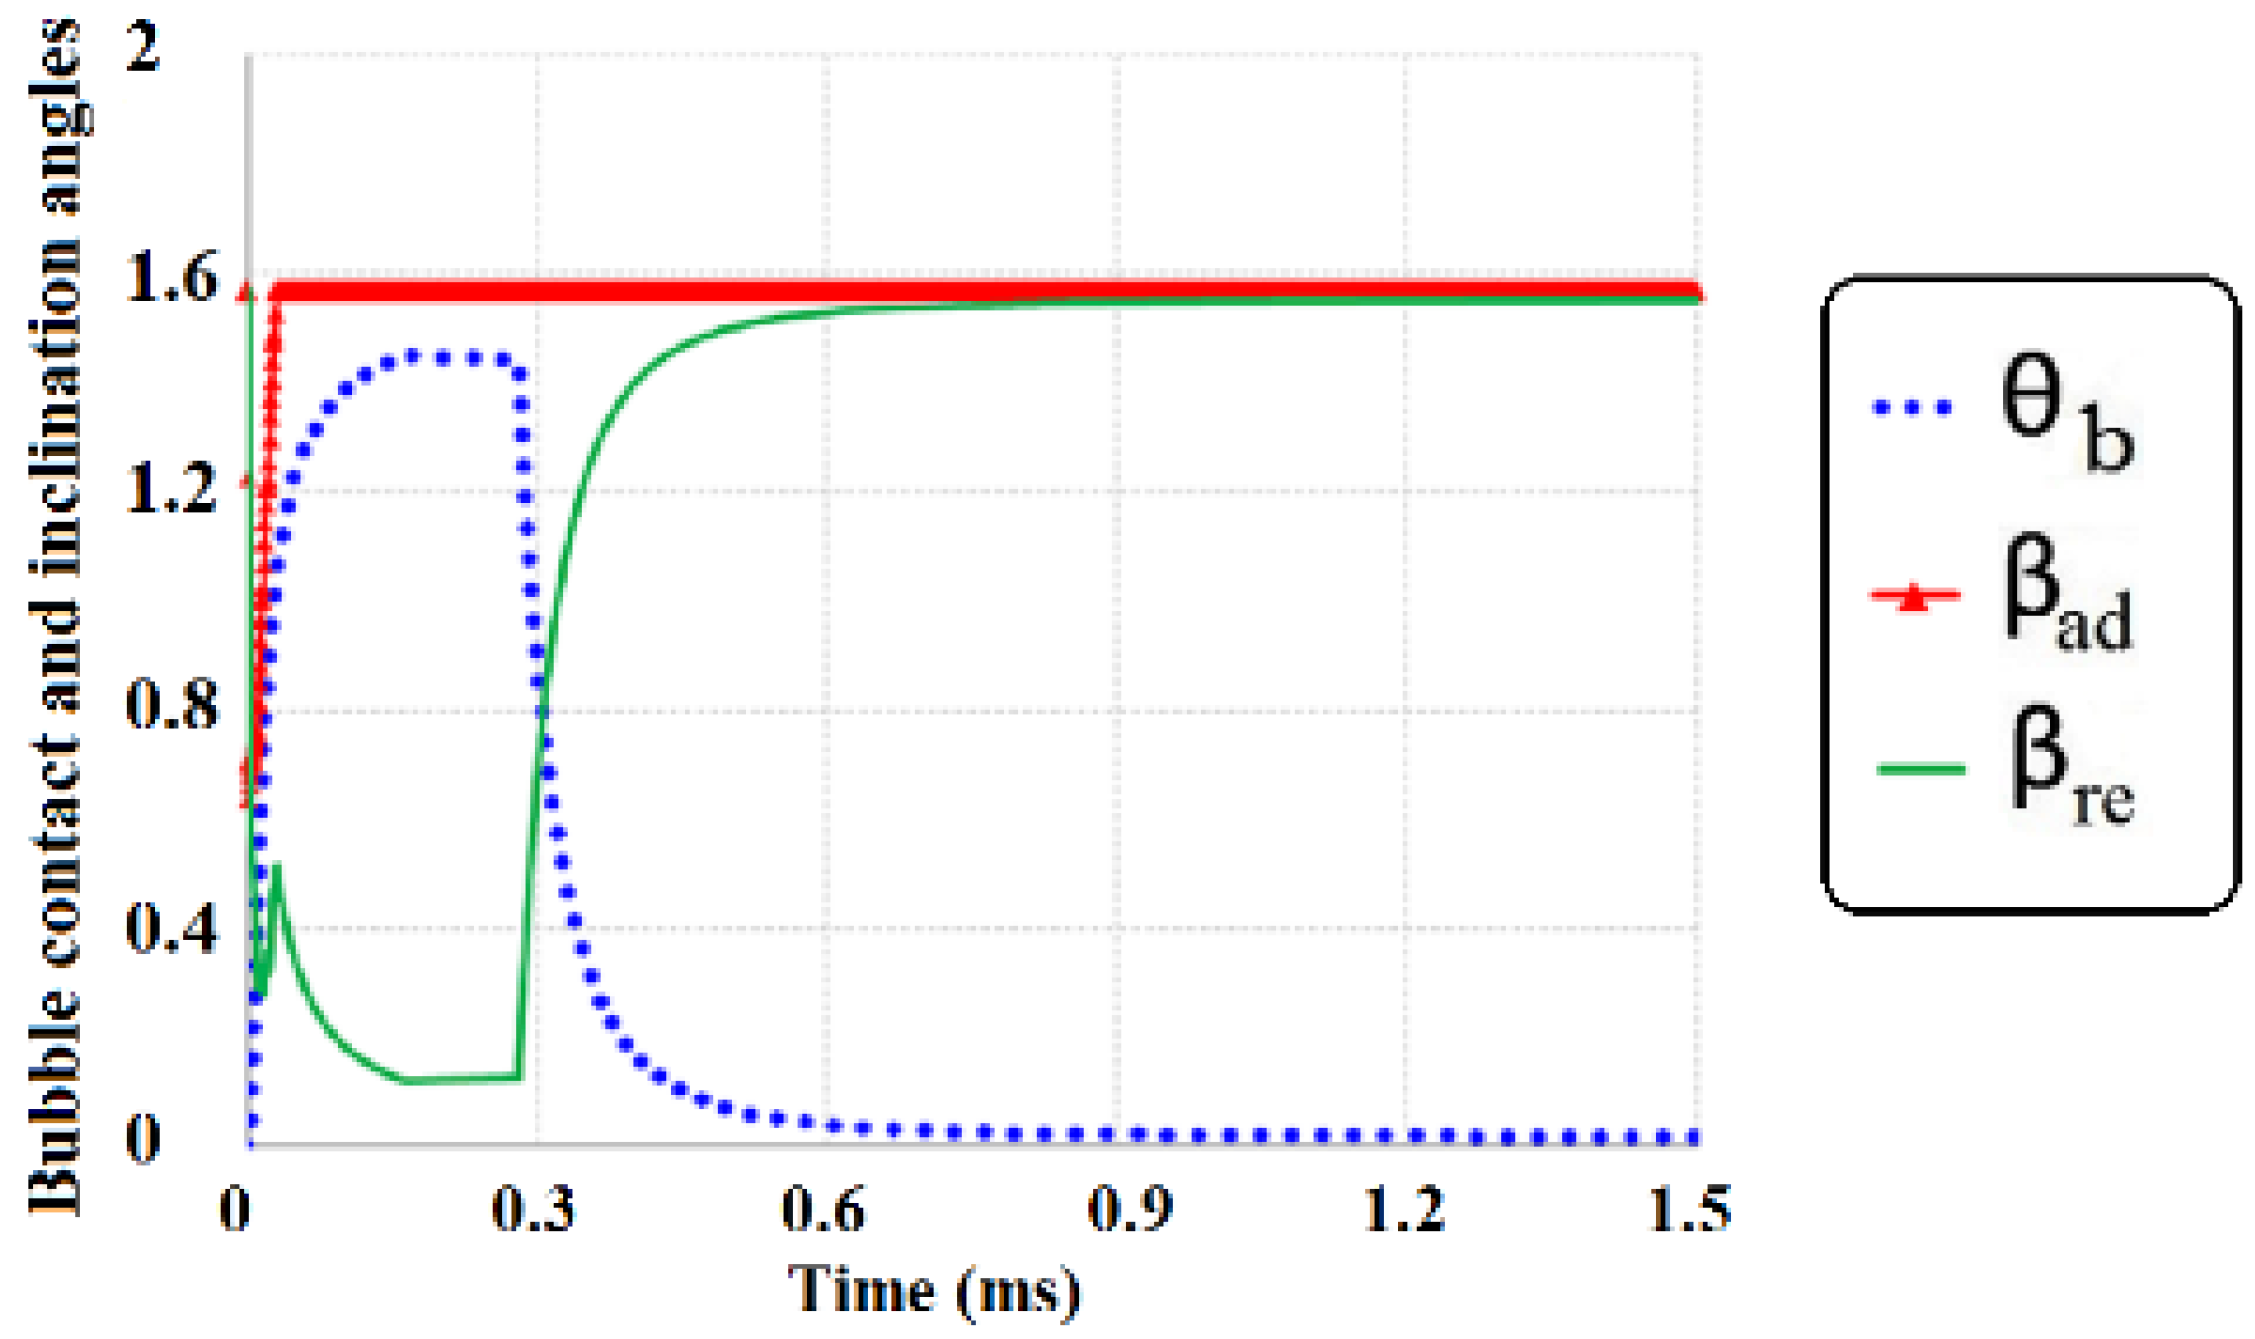
2.3. Bubble Contact, Inclination Angles and Bottleneck
2.3.1. Bubble Contact Angle () and Inclination Angle ()
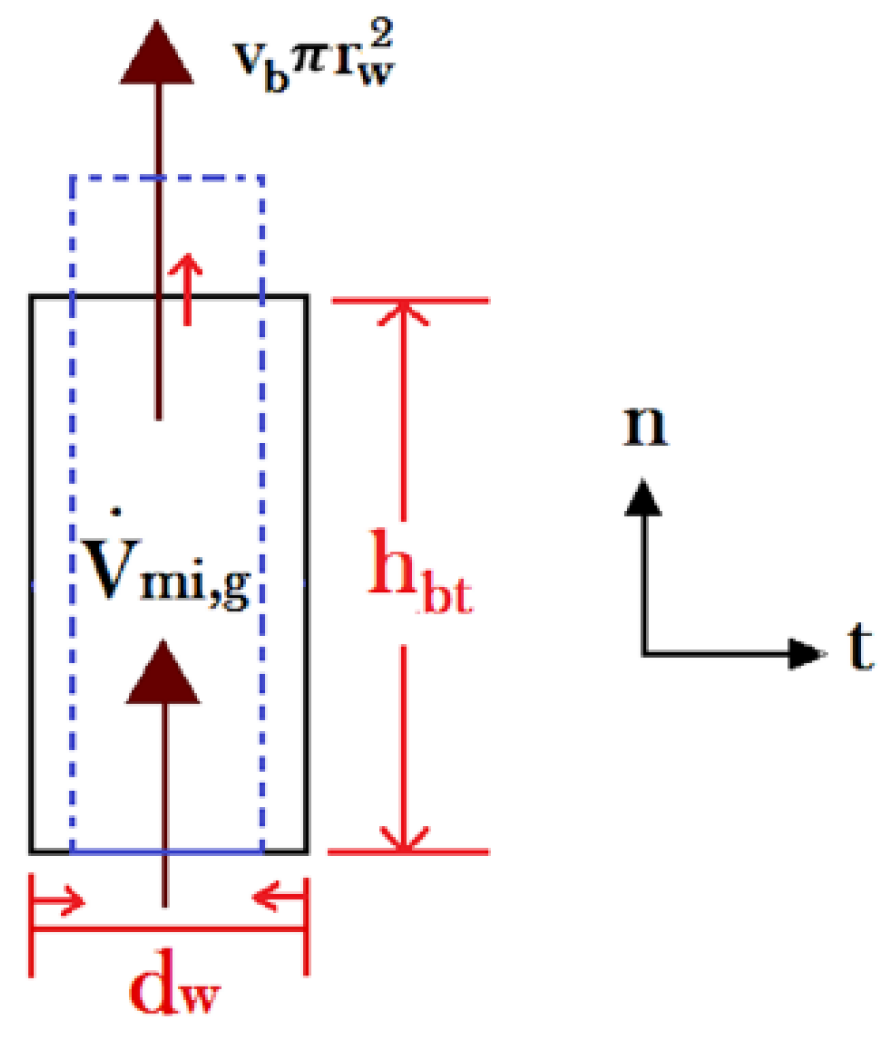
2.3.2. Bottleneck
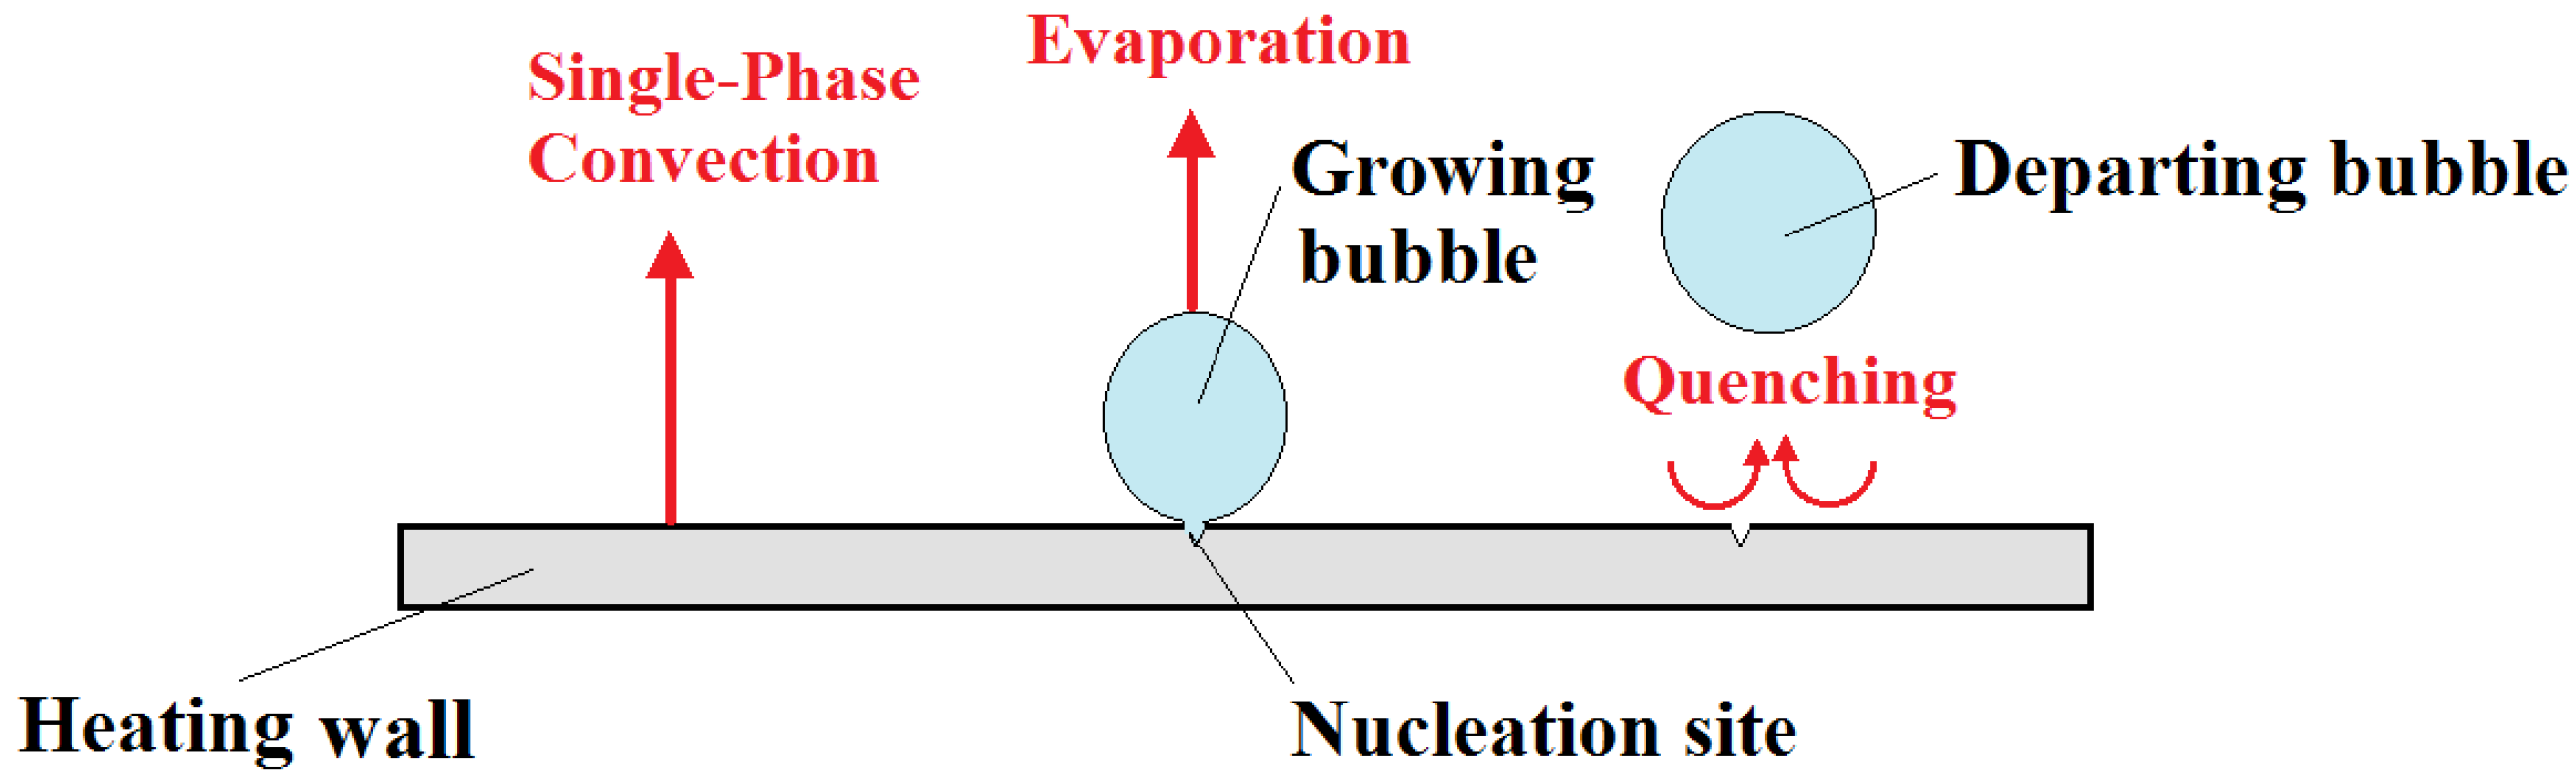
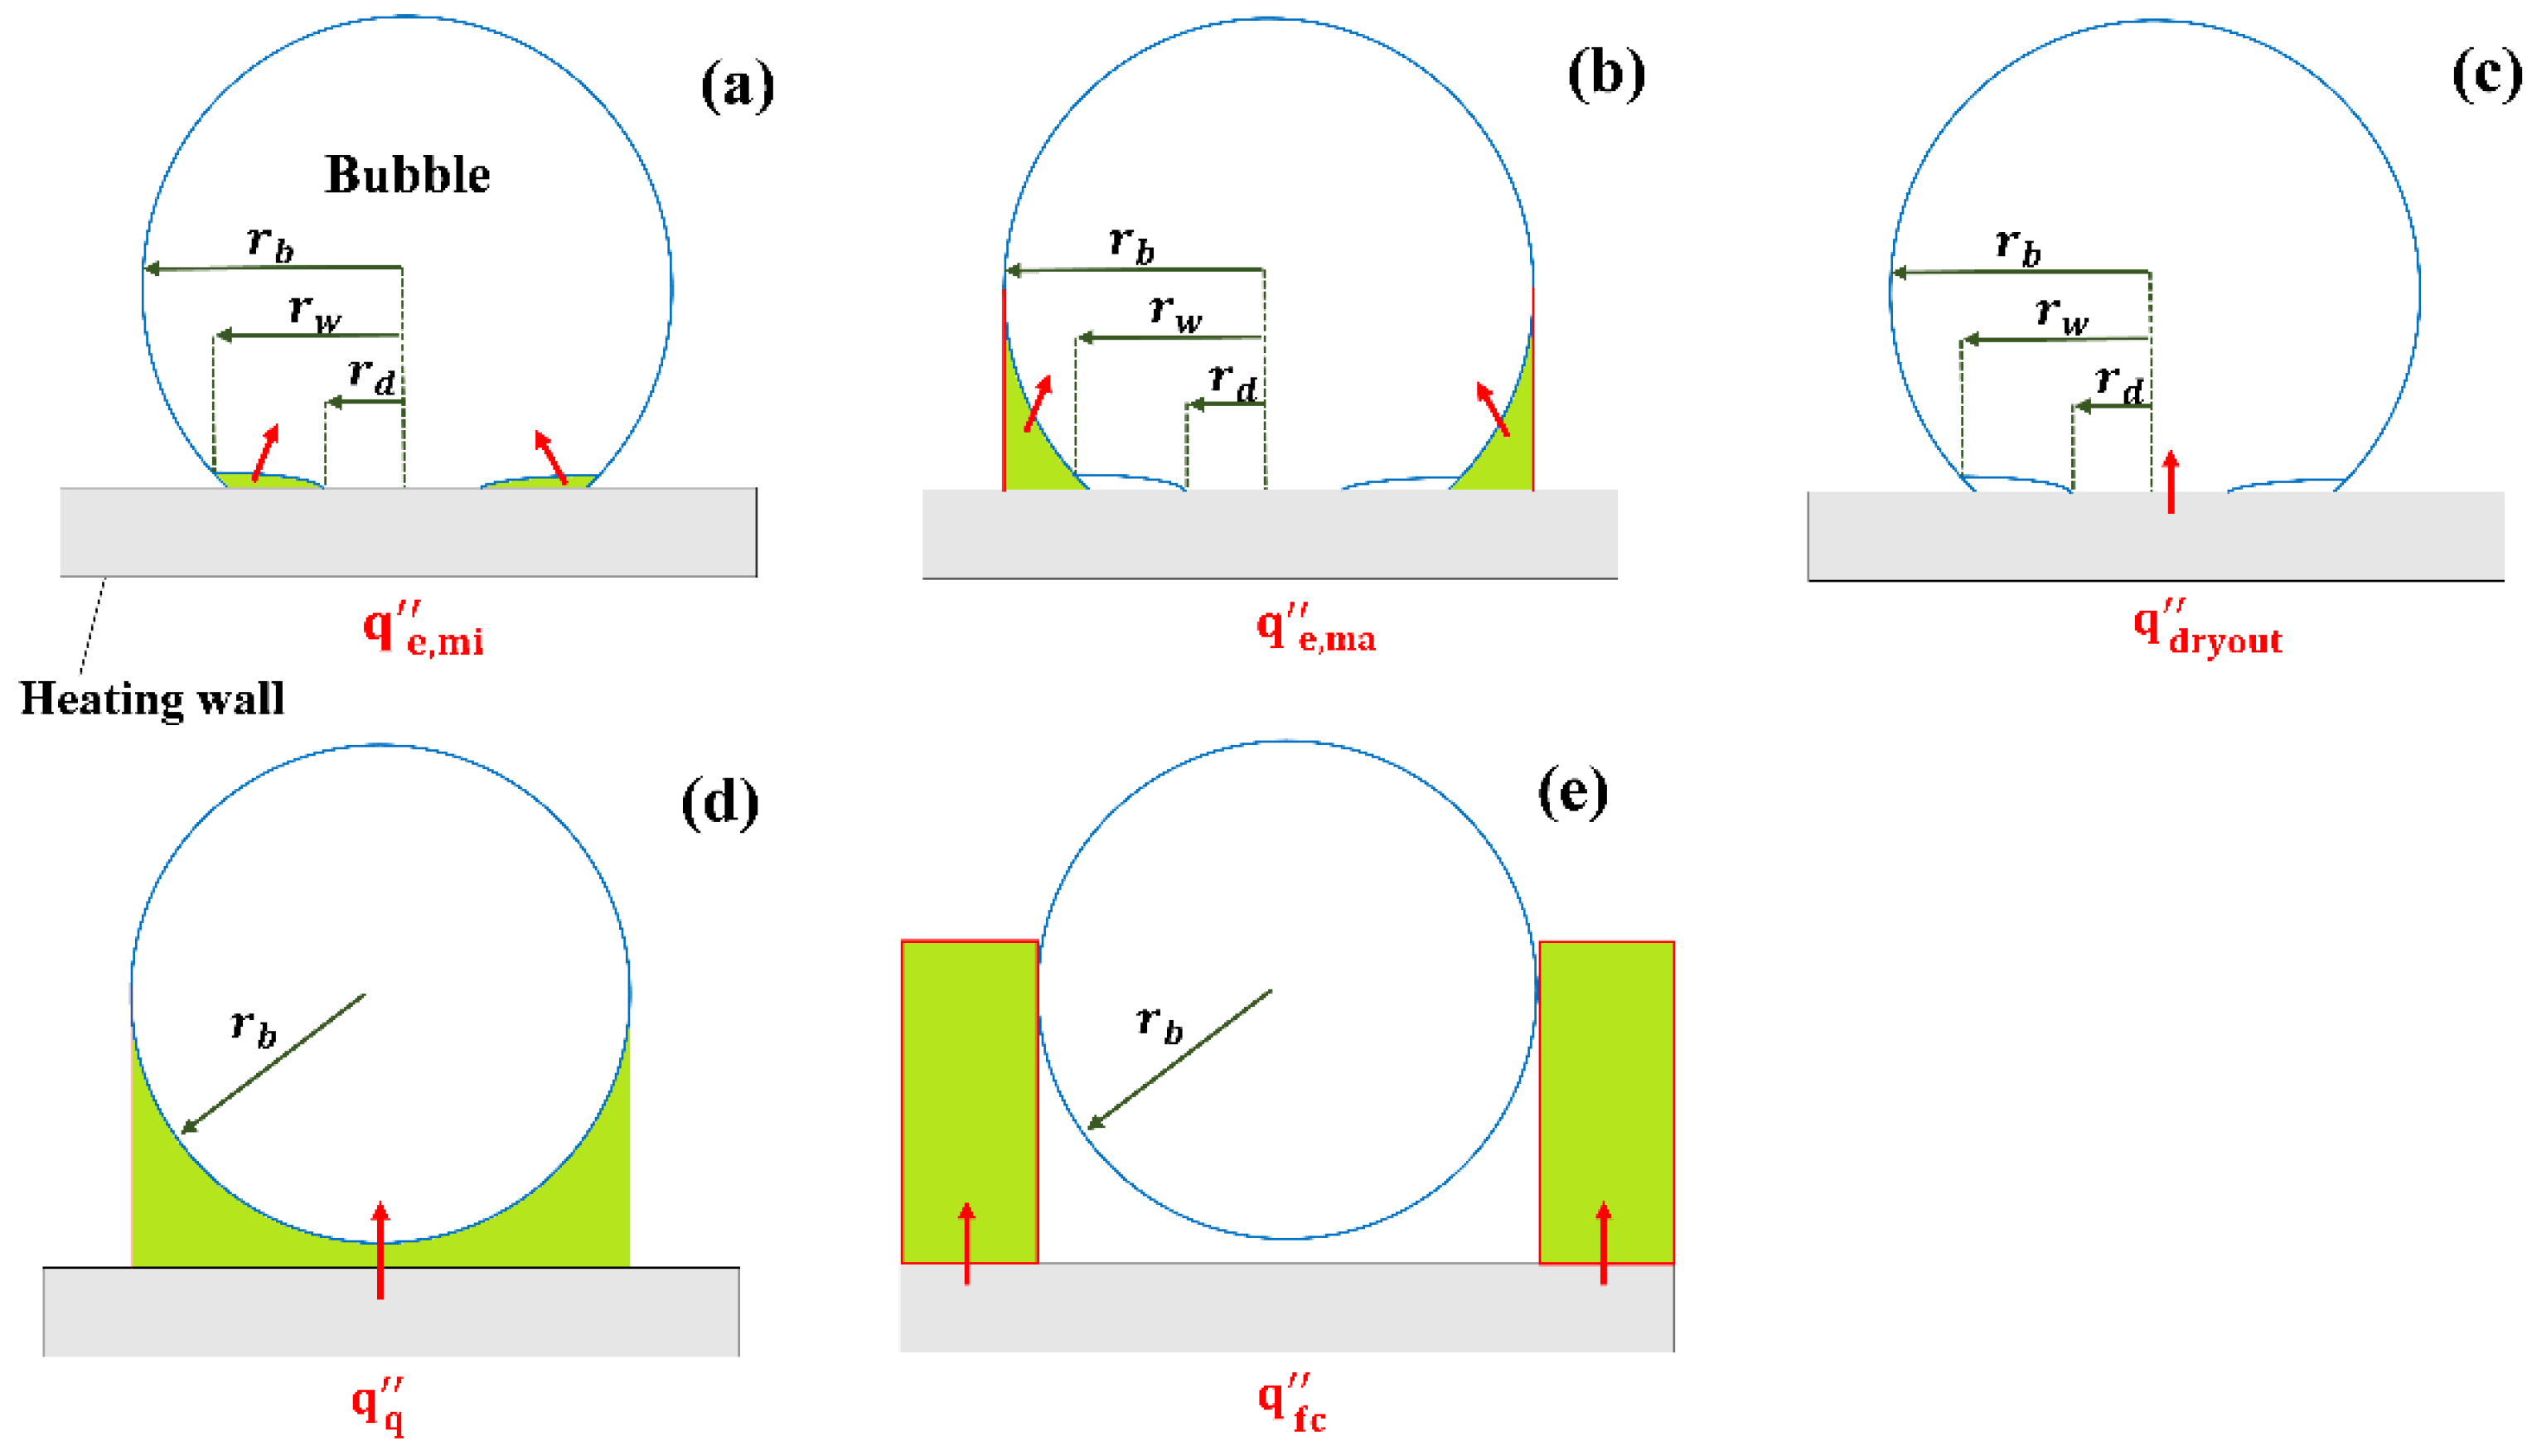
2.4. Heat Flux
2.4.1. Heat Transfer from Heating Wall to Liquid
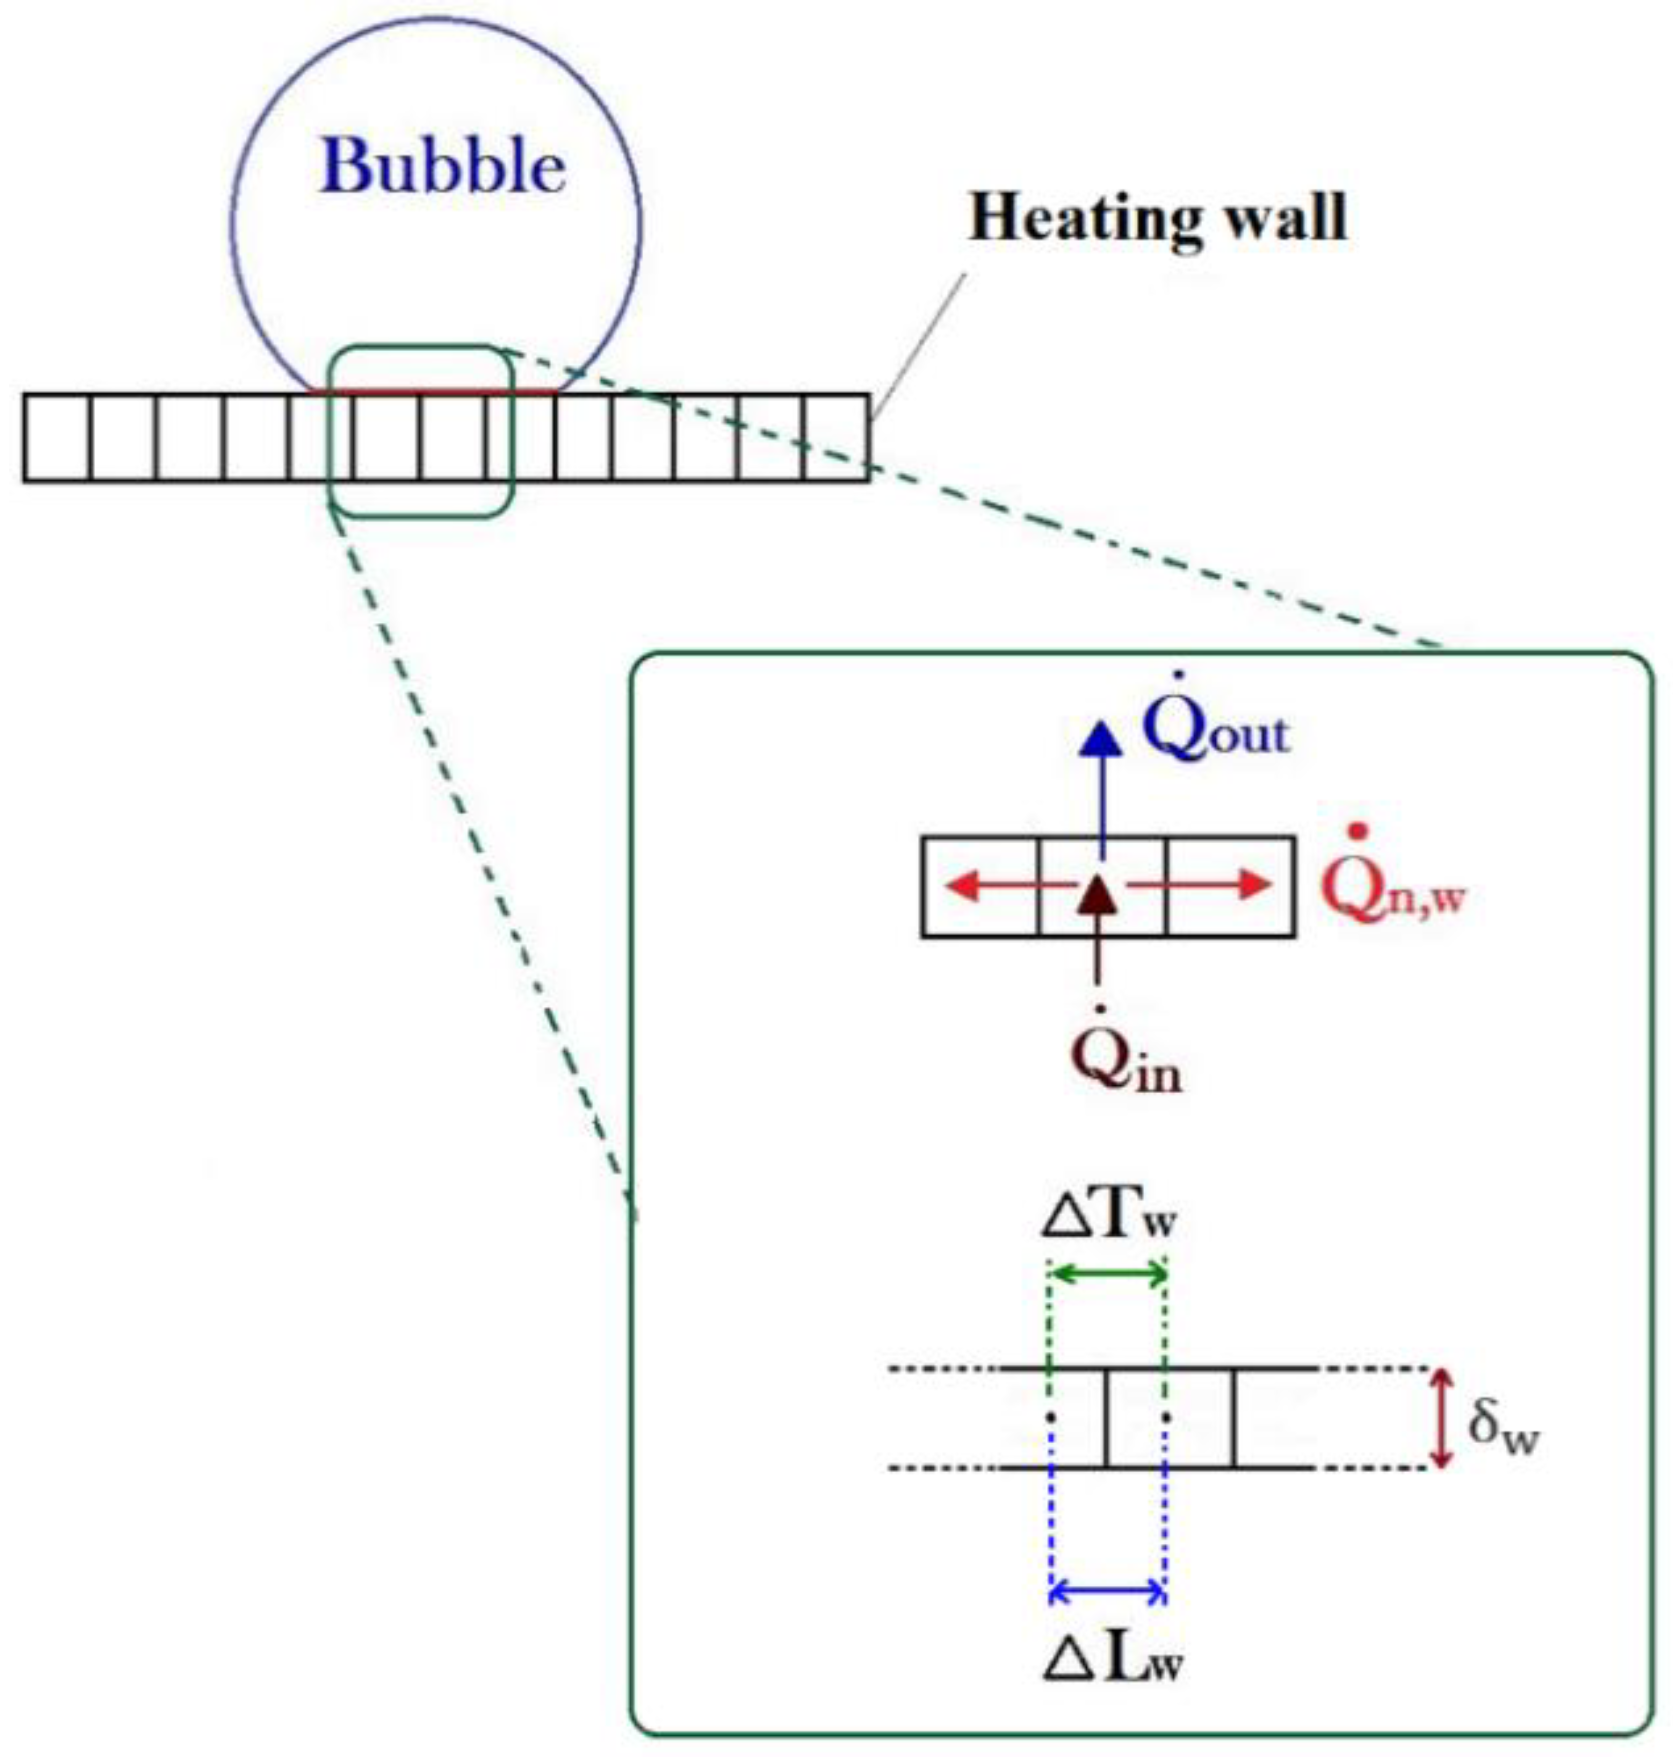
2.4.2. Heat Transfer in the Heating Wall
3. Results and Discussion
3.1. Discretization Dependency Study
3.2. Experimental Database
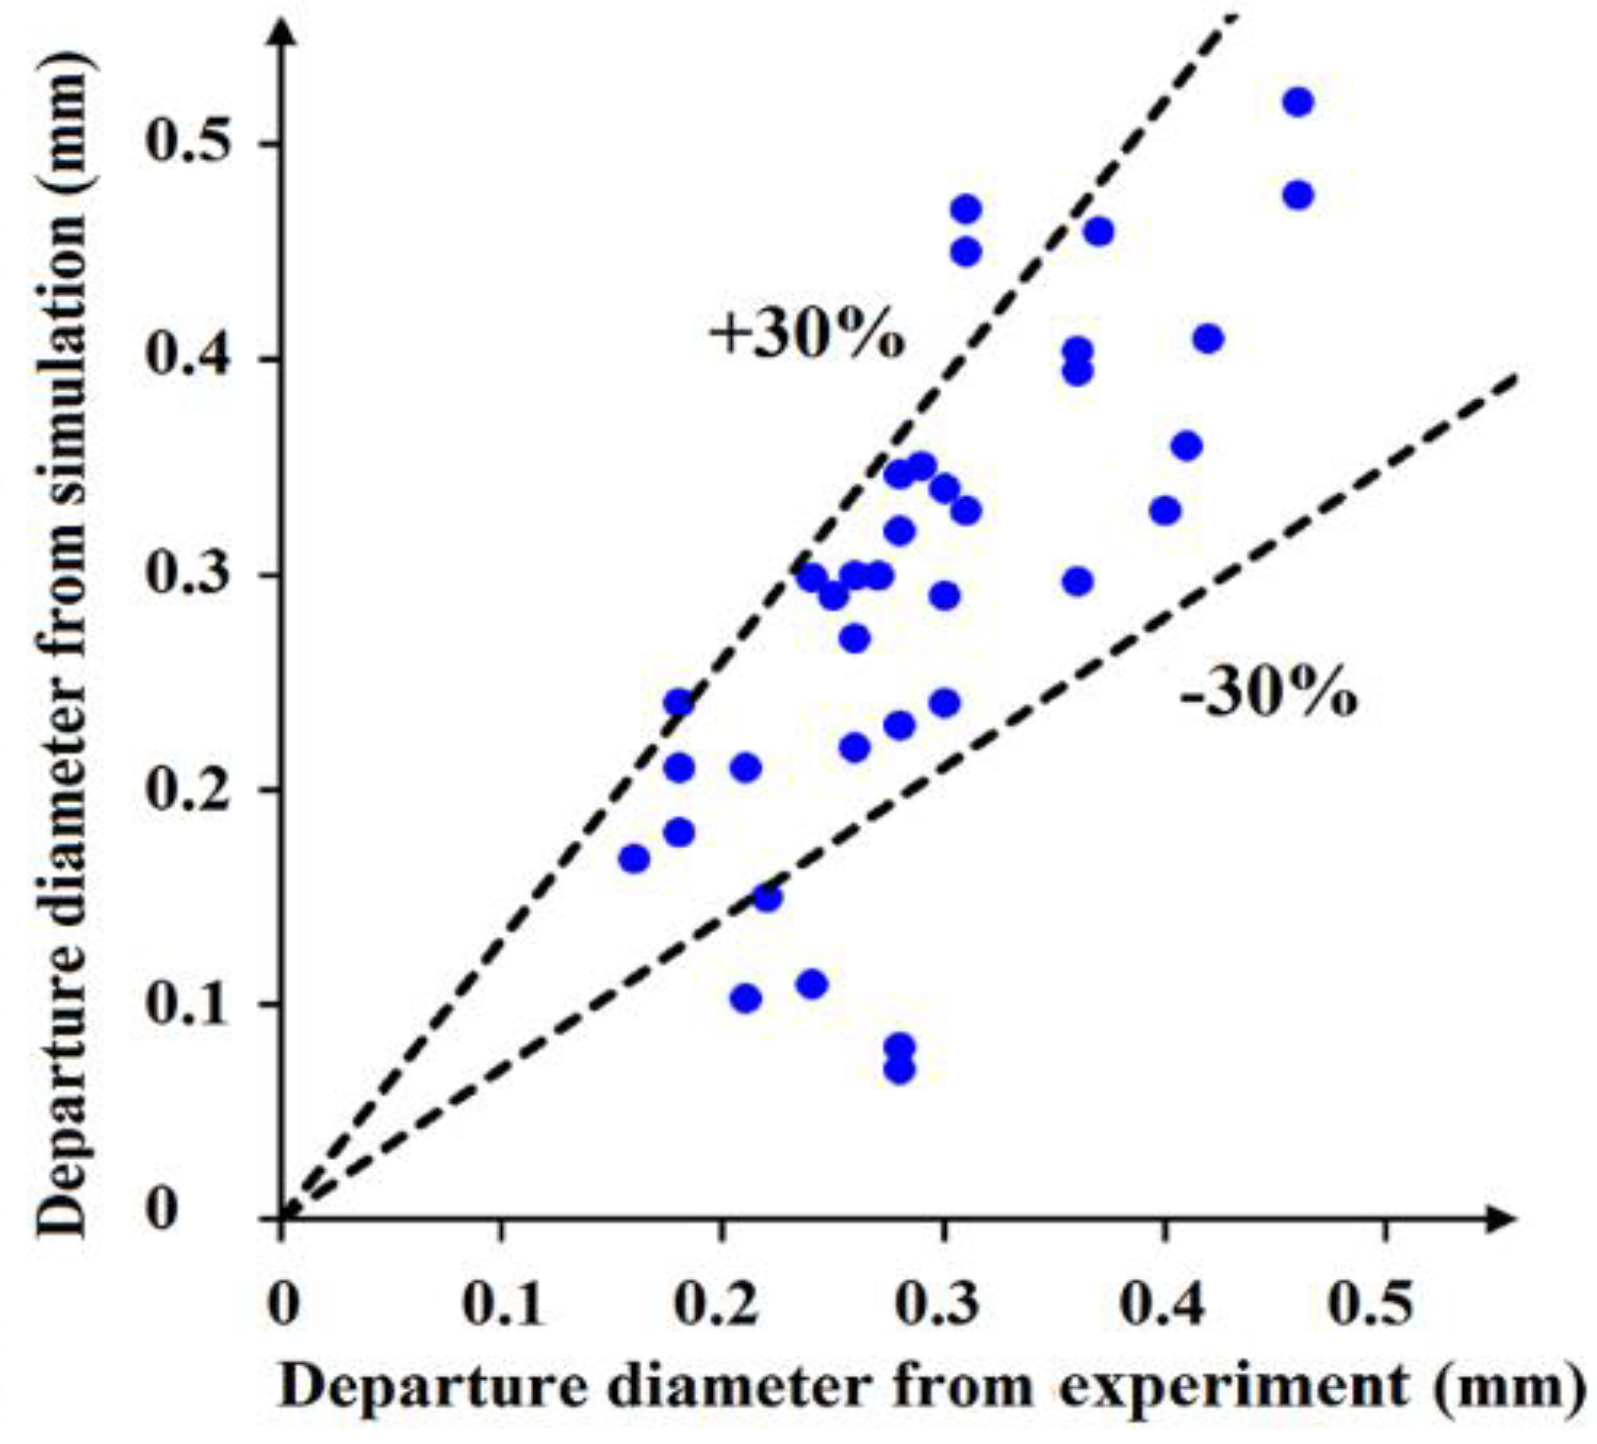
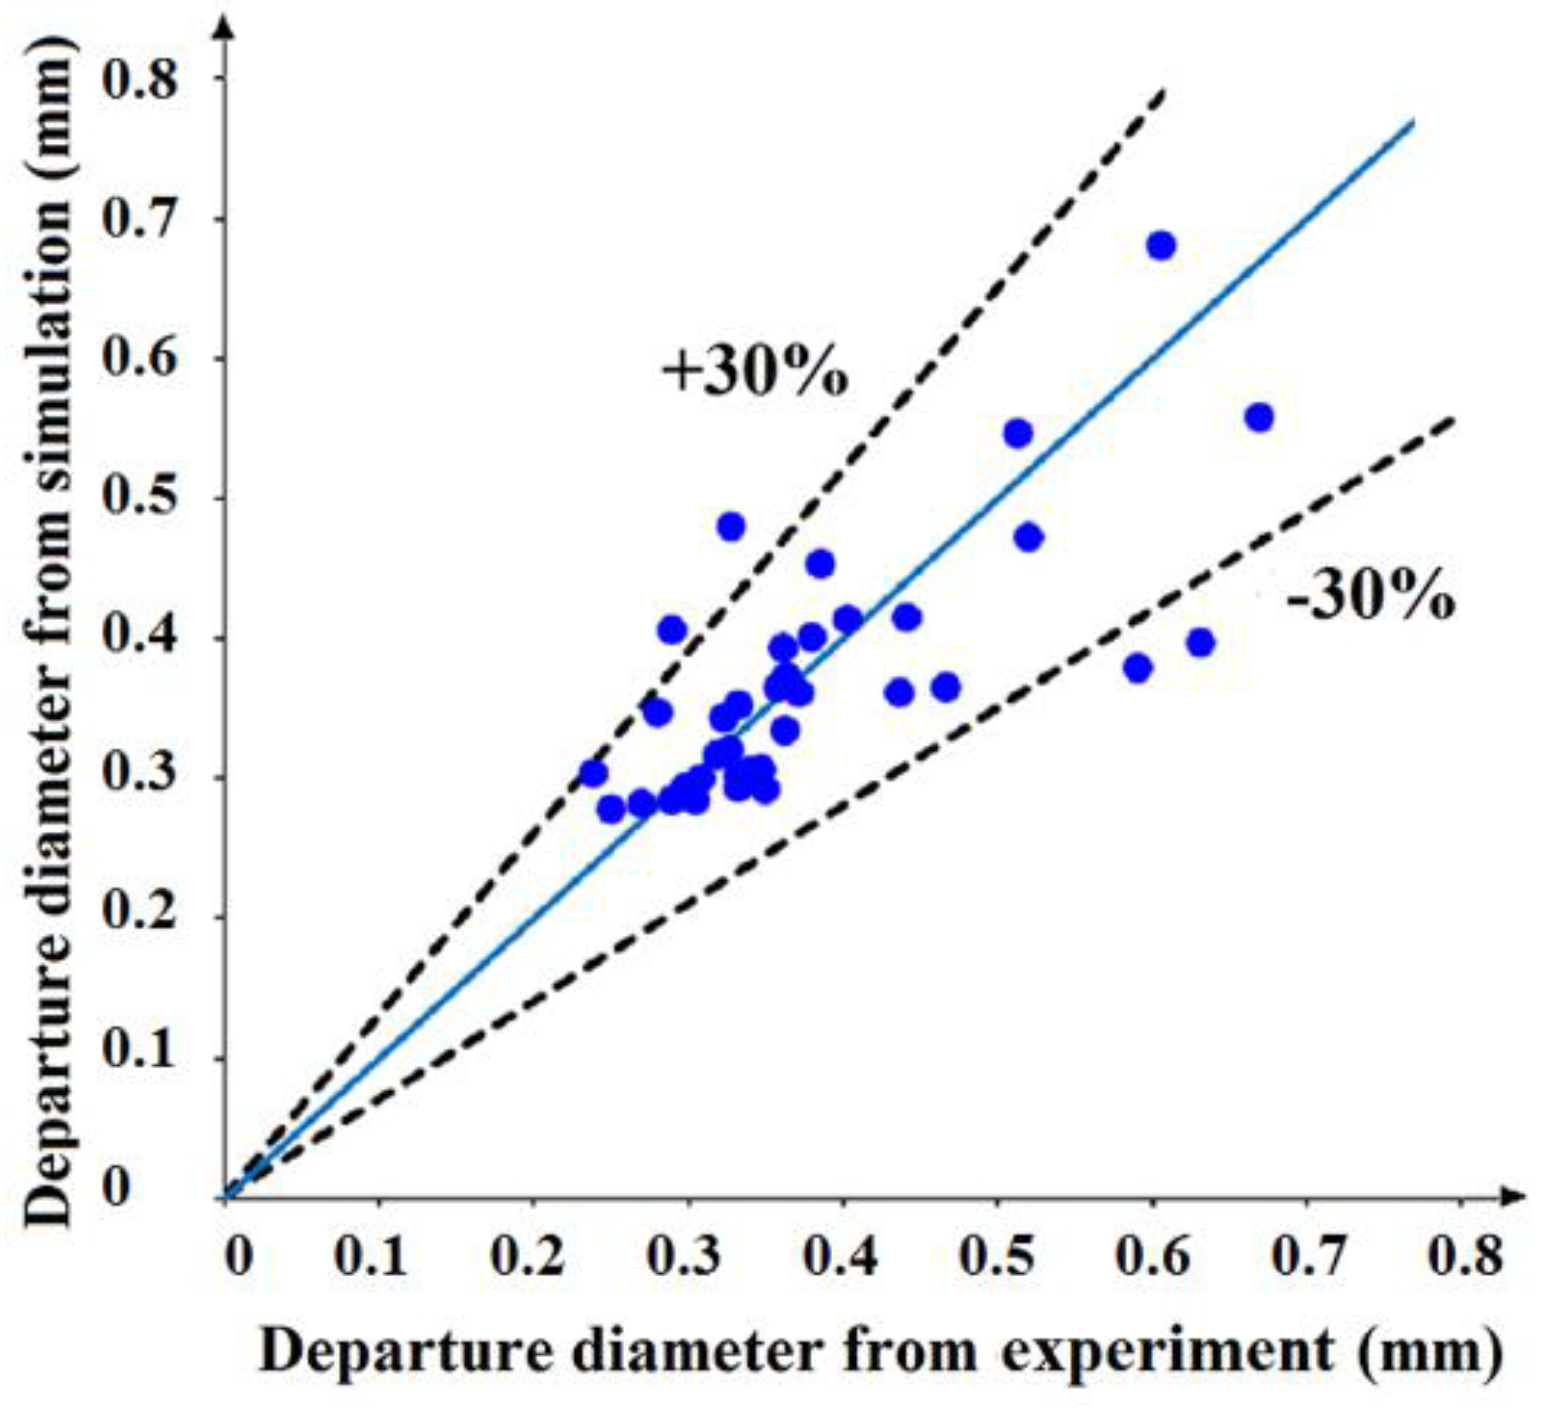
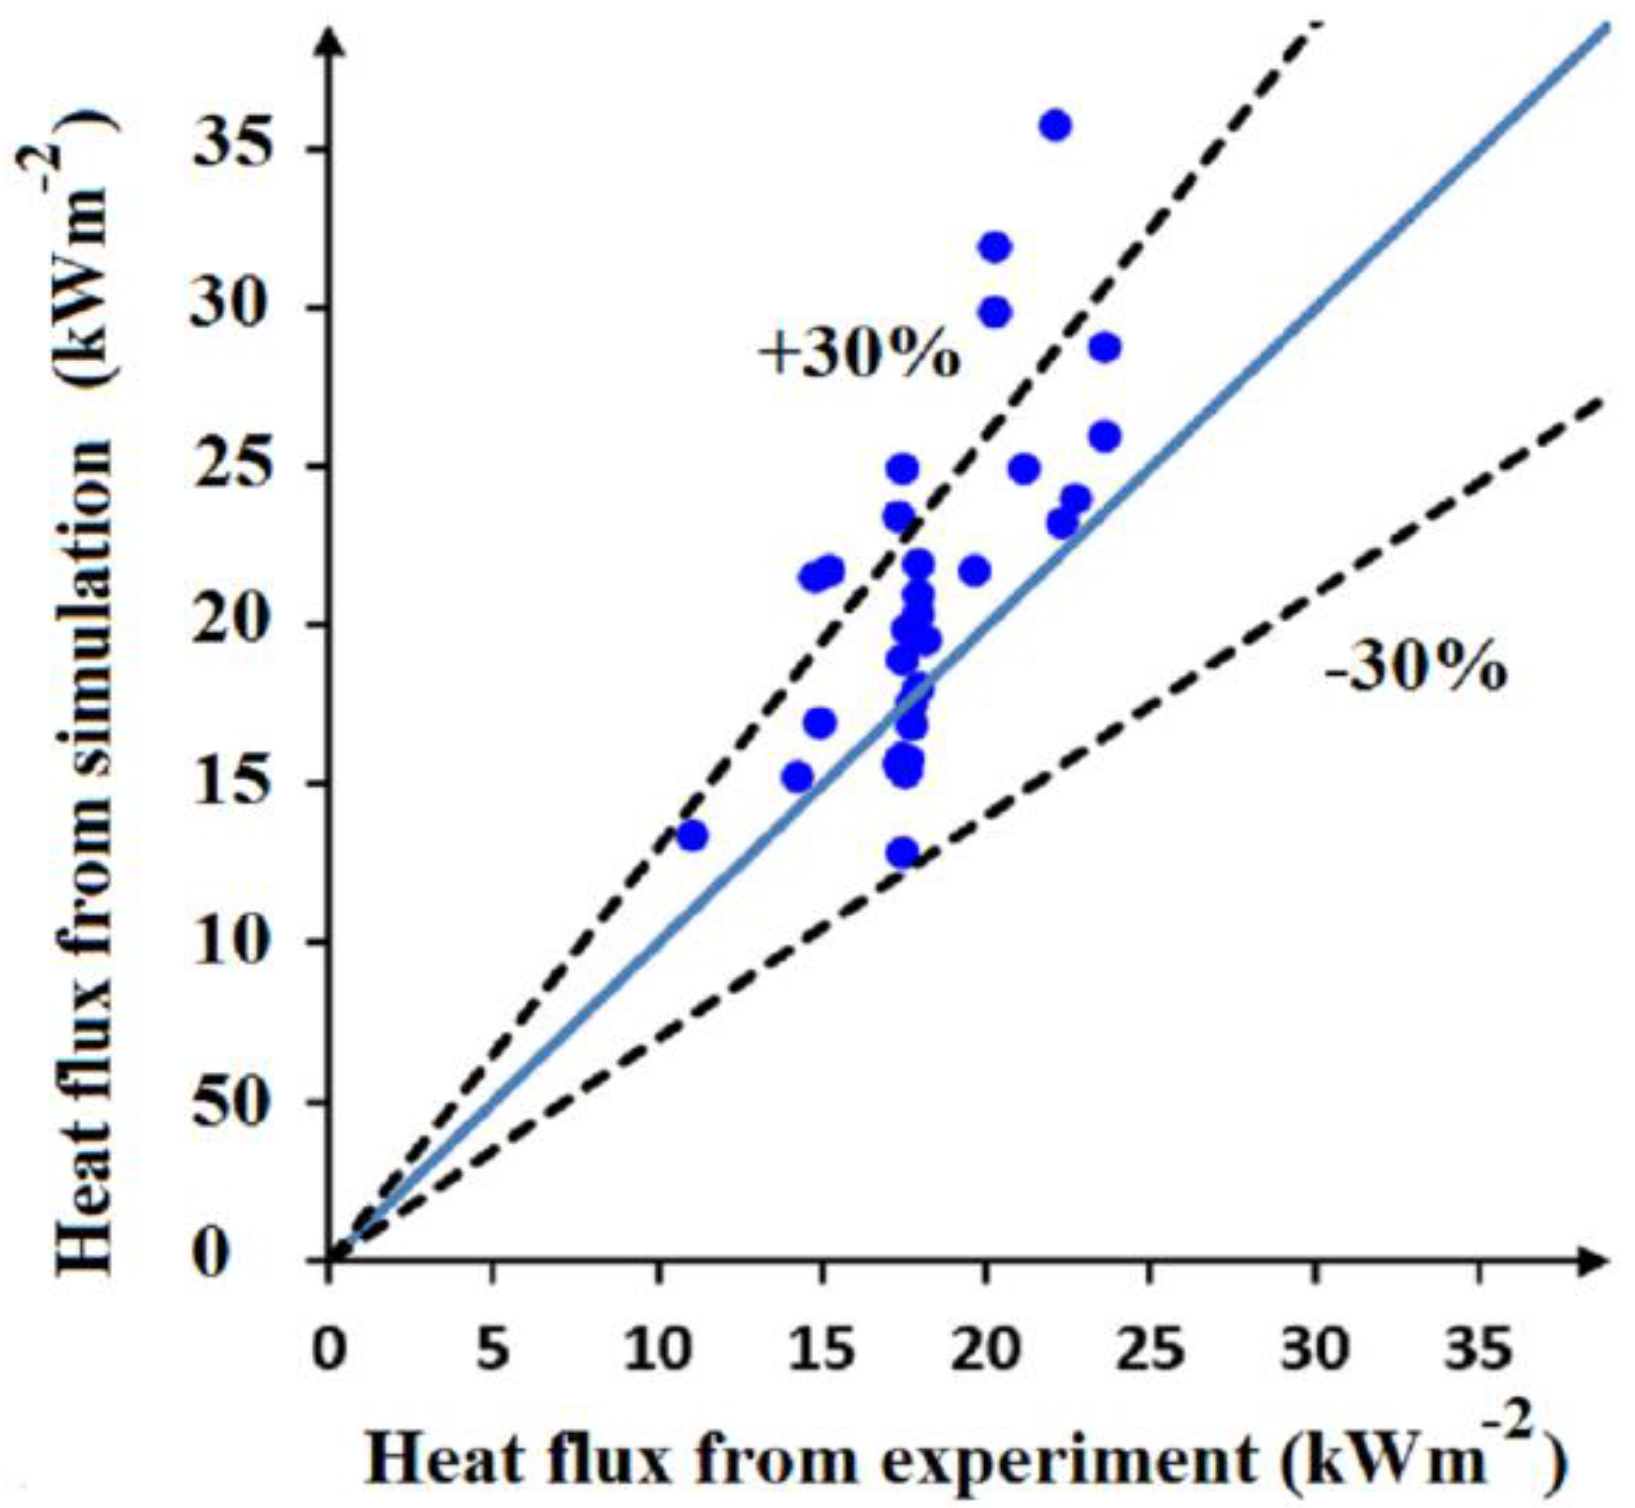
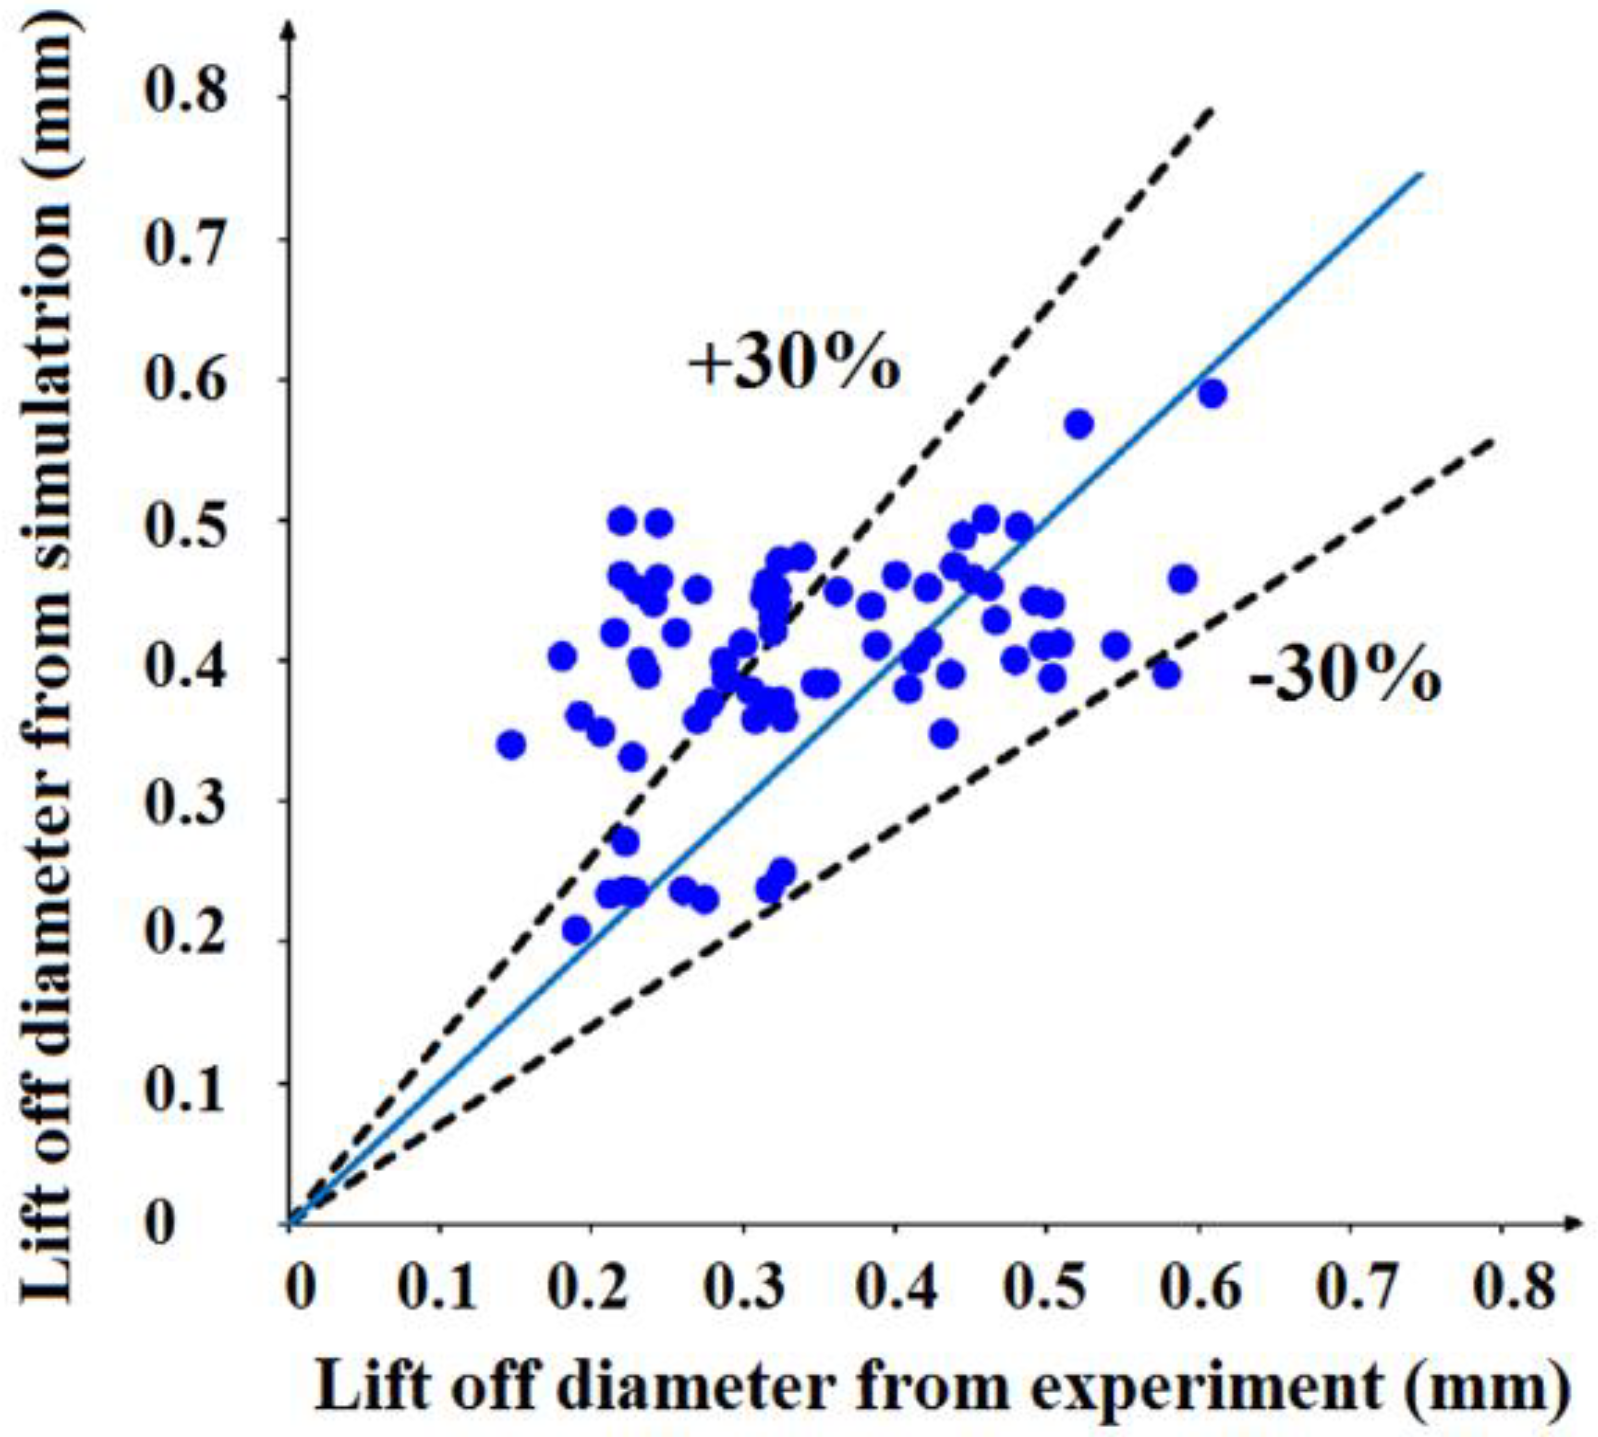
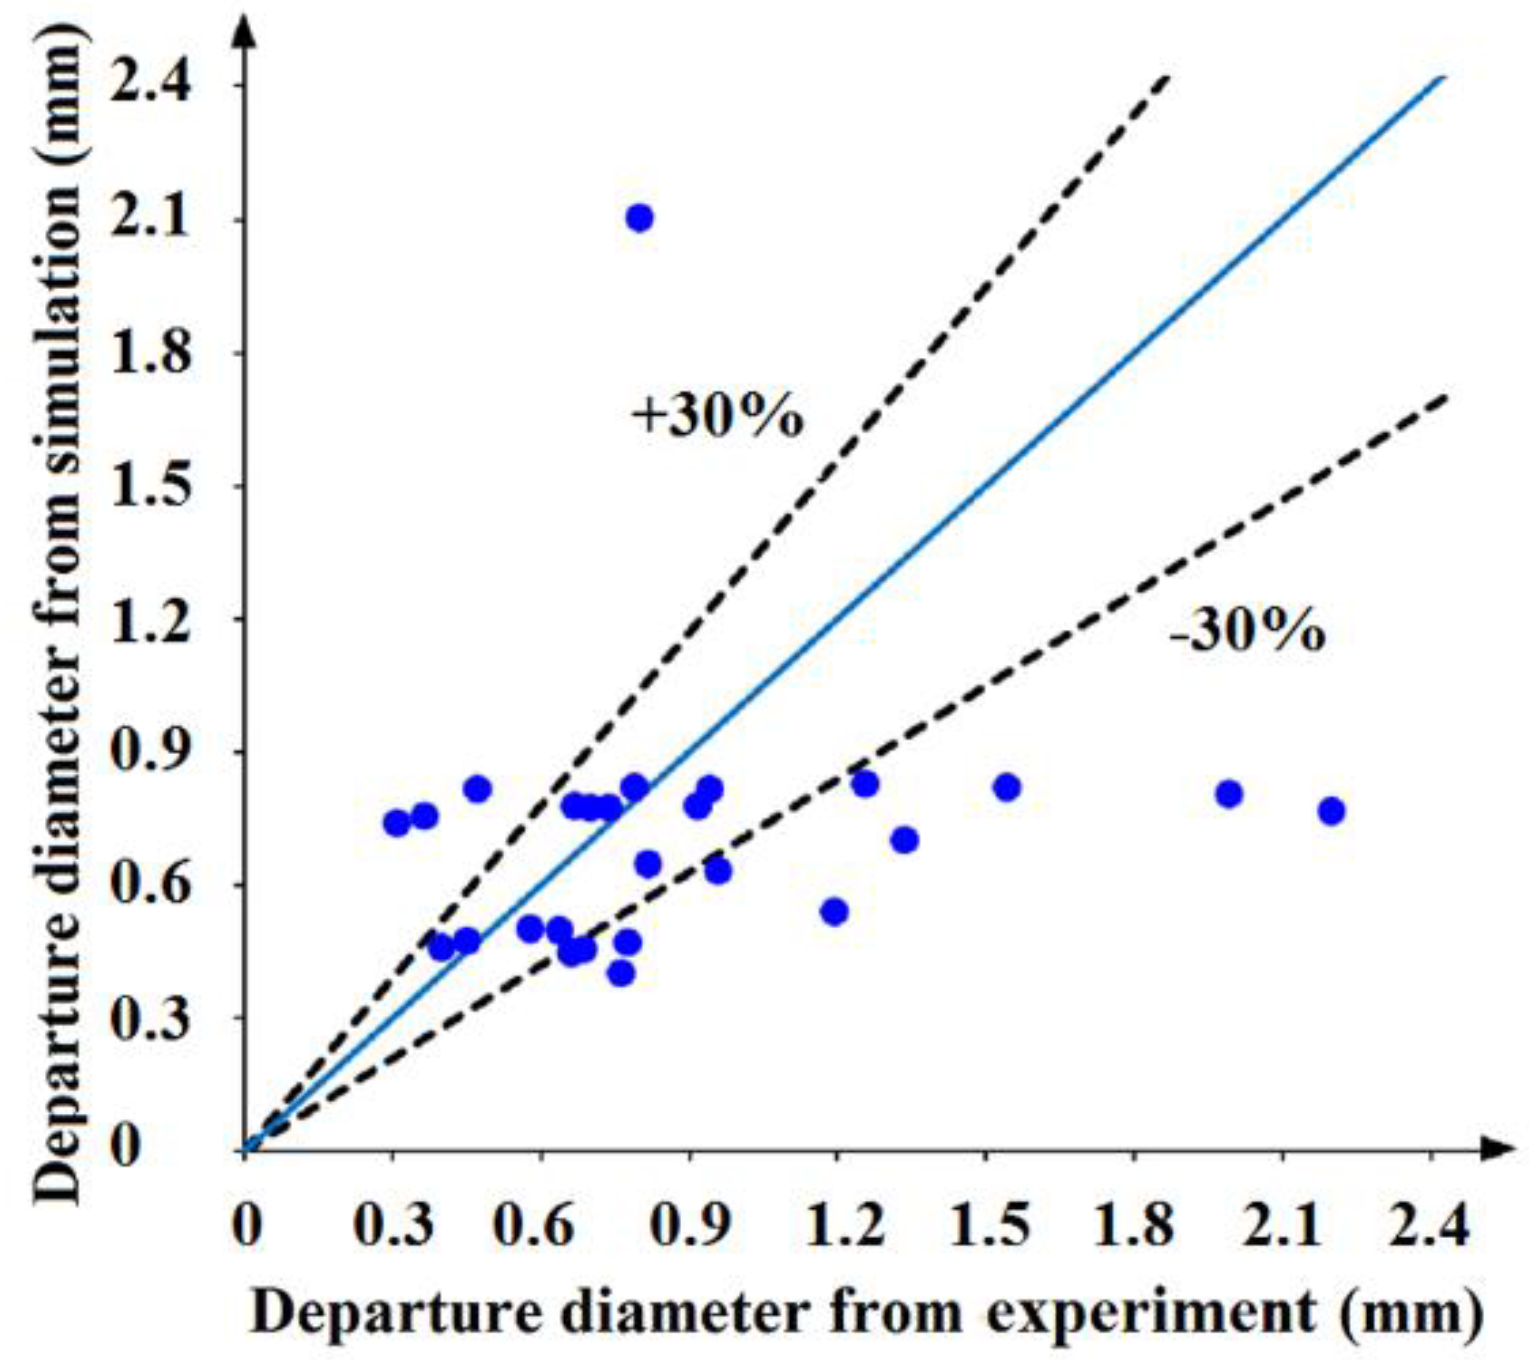
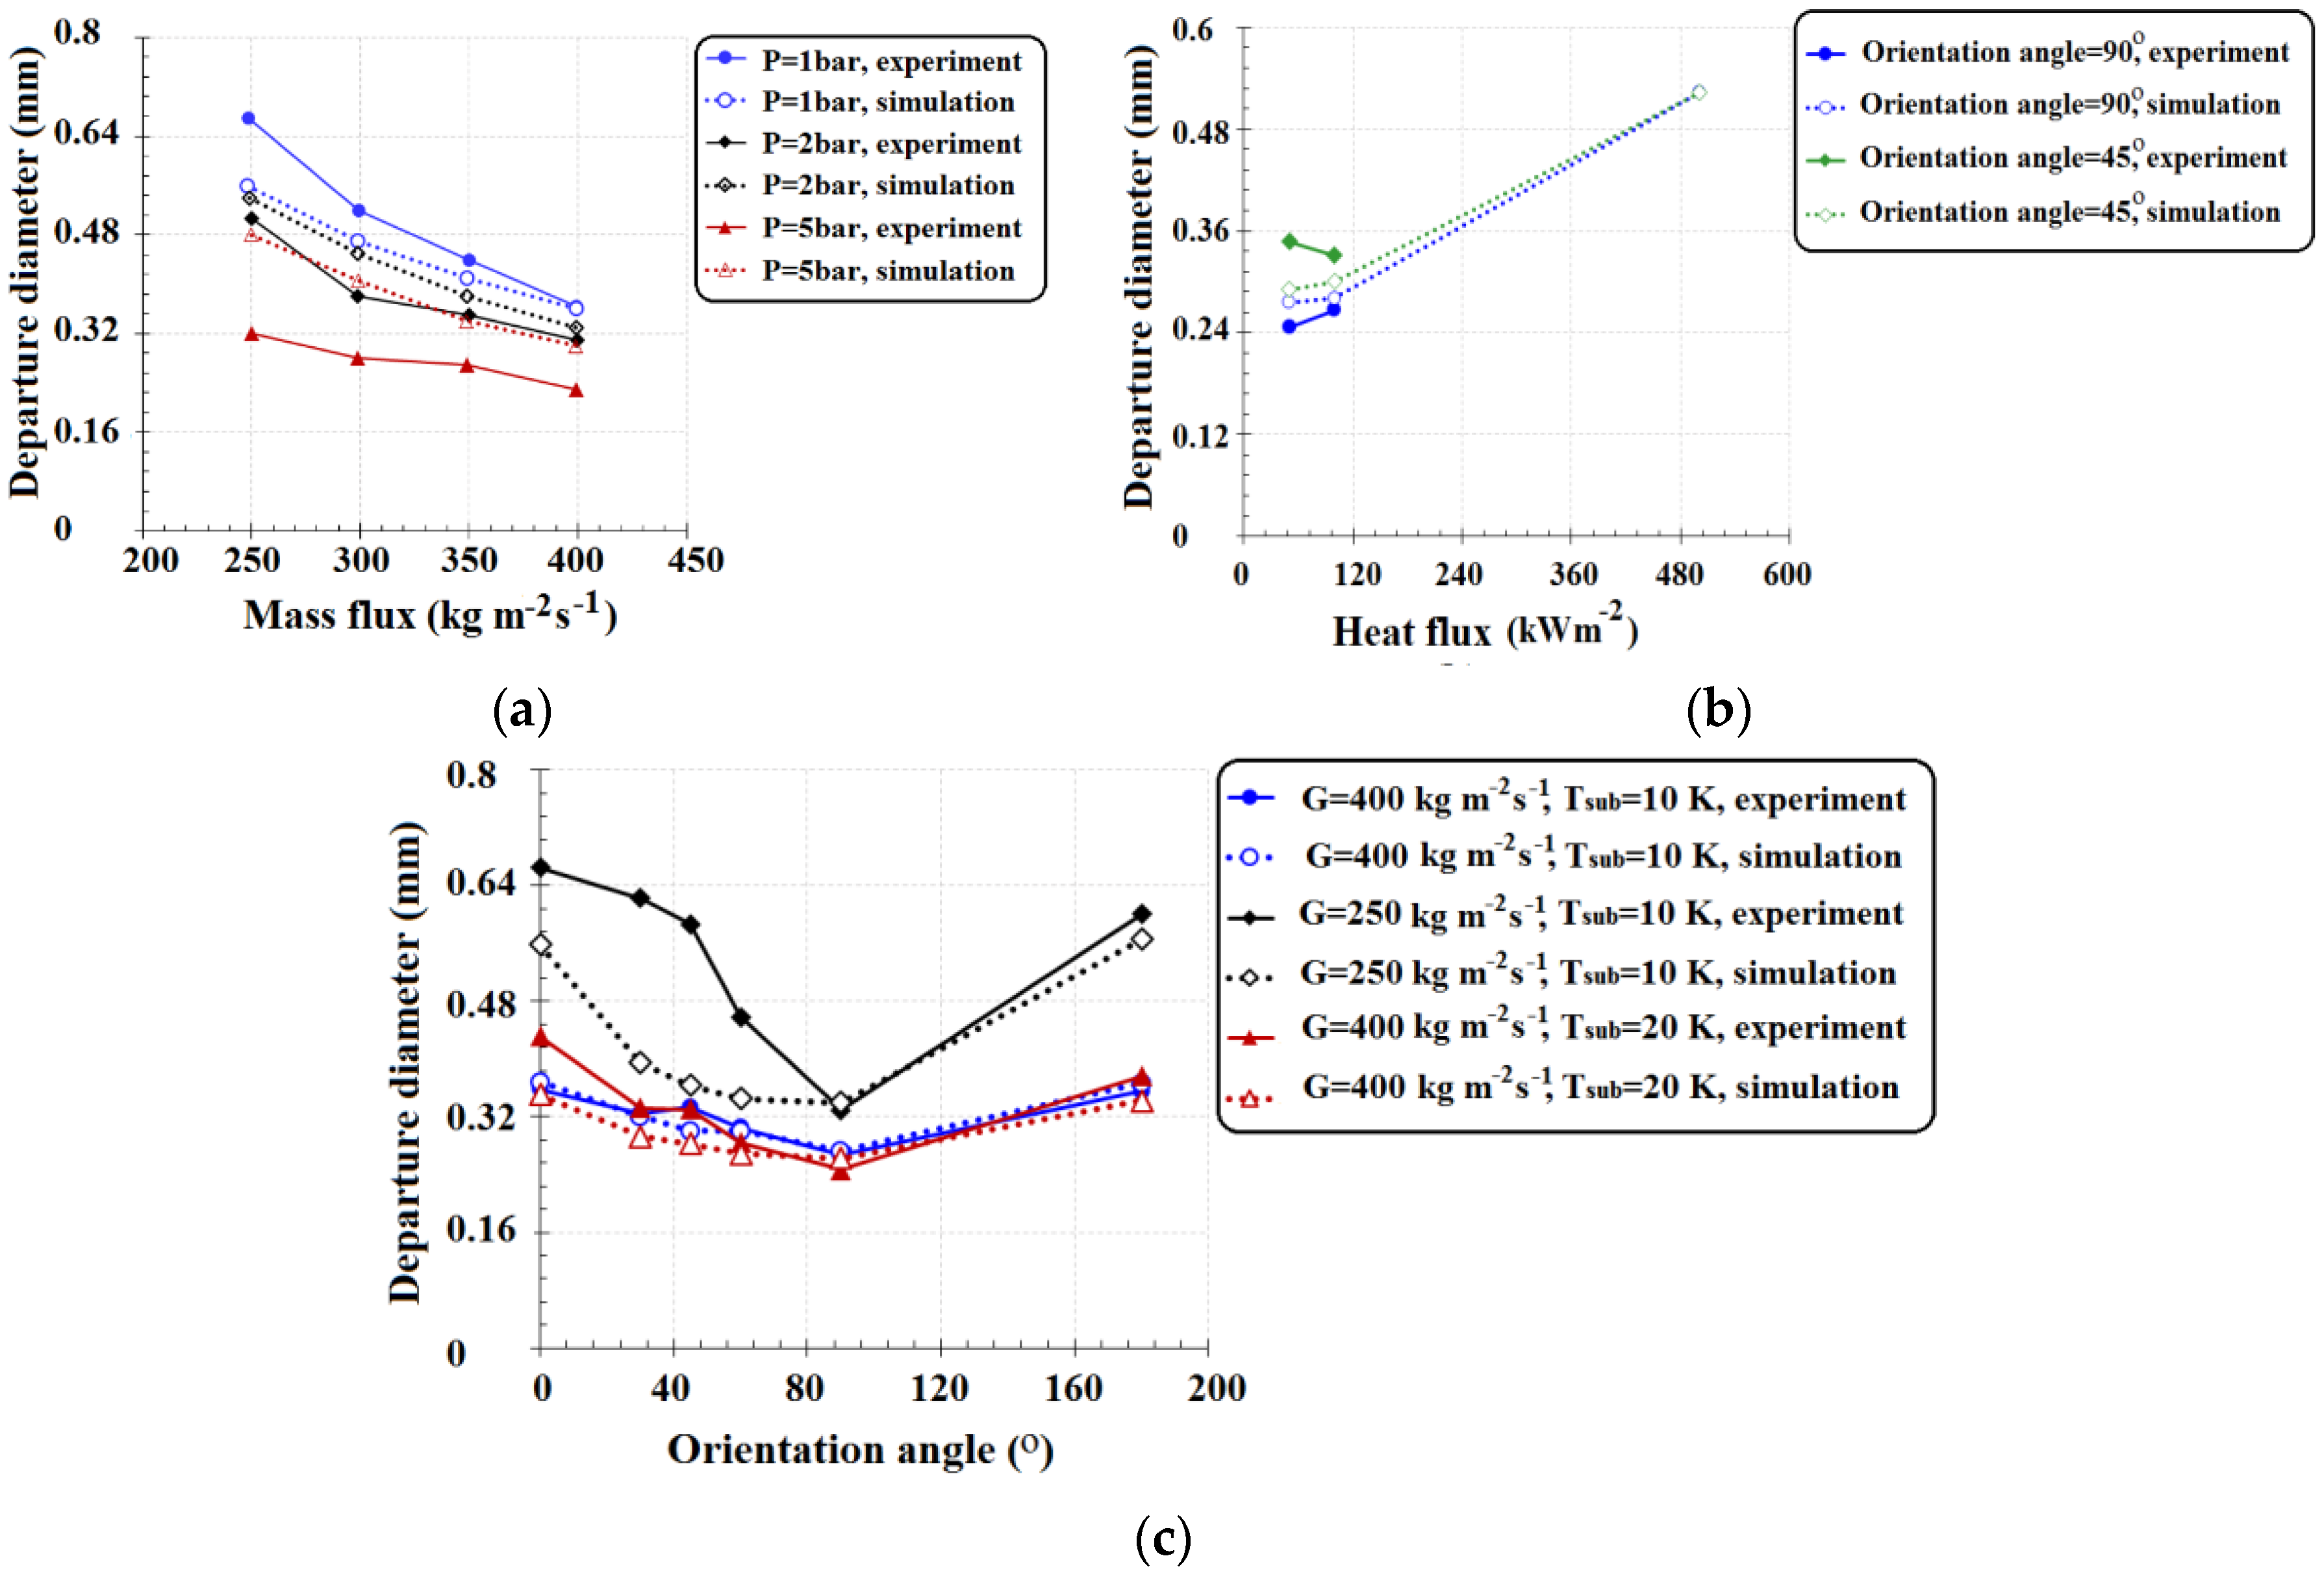
3.3. Validation of Bubble Growth and Departure (Lift-Off) Models
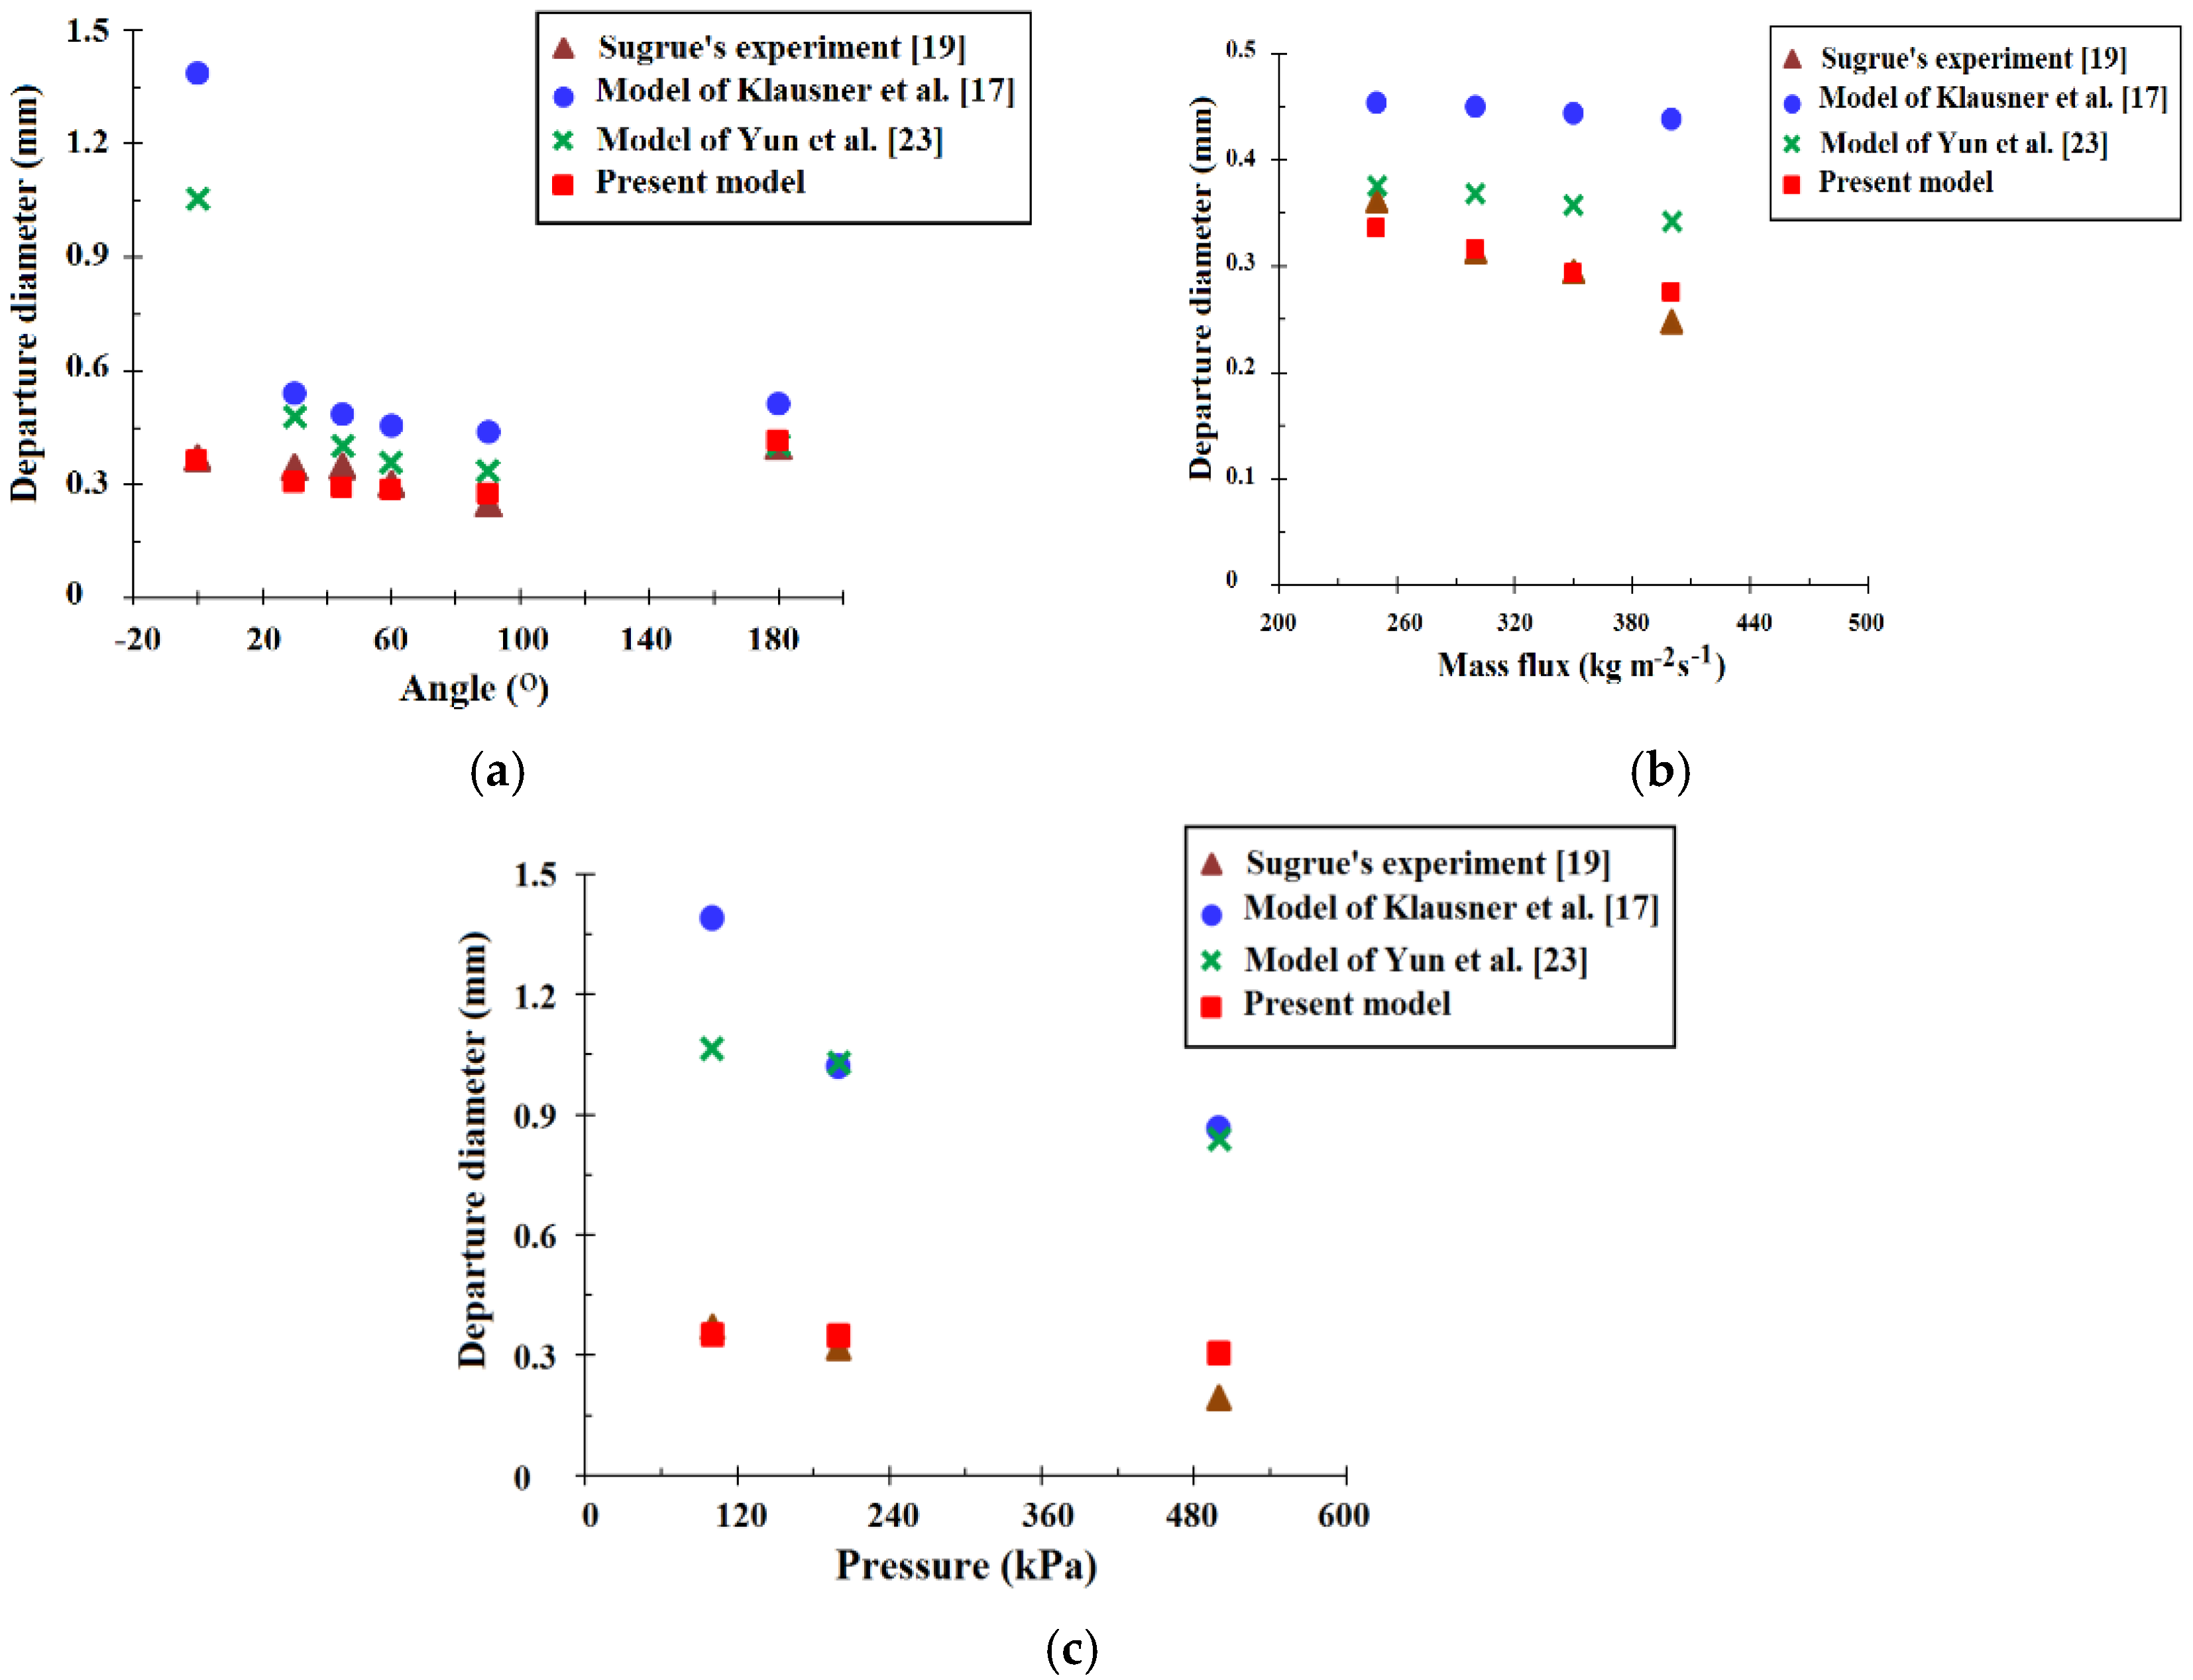
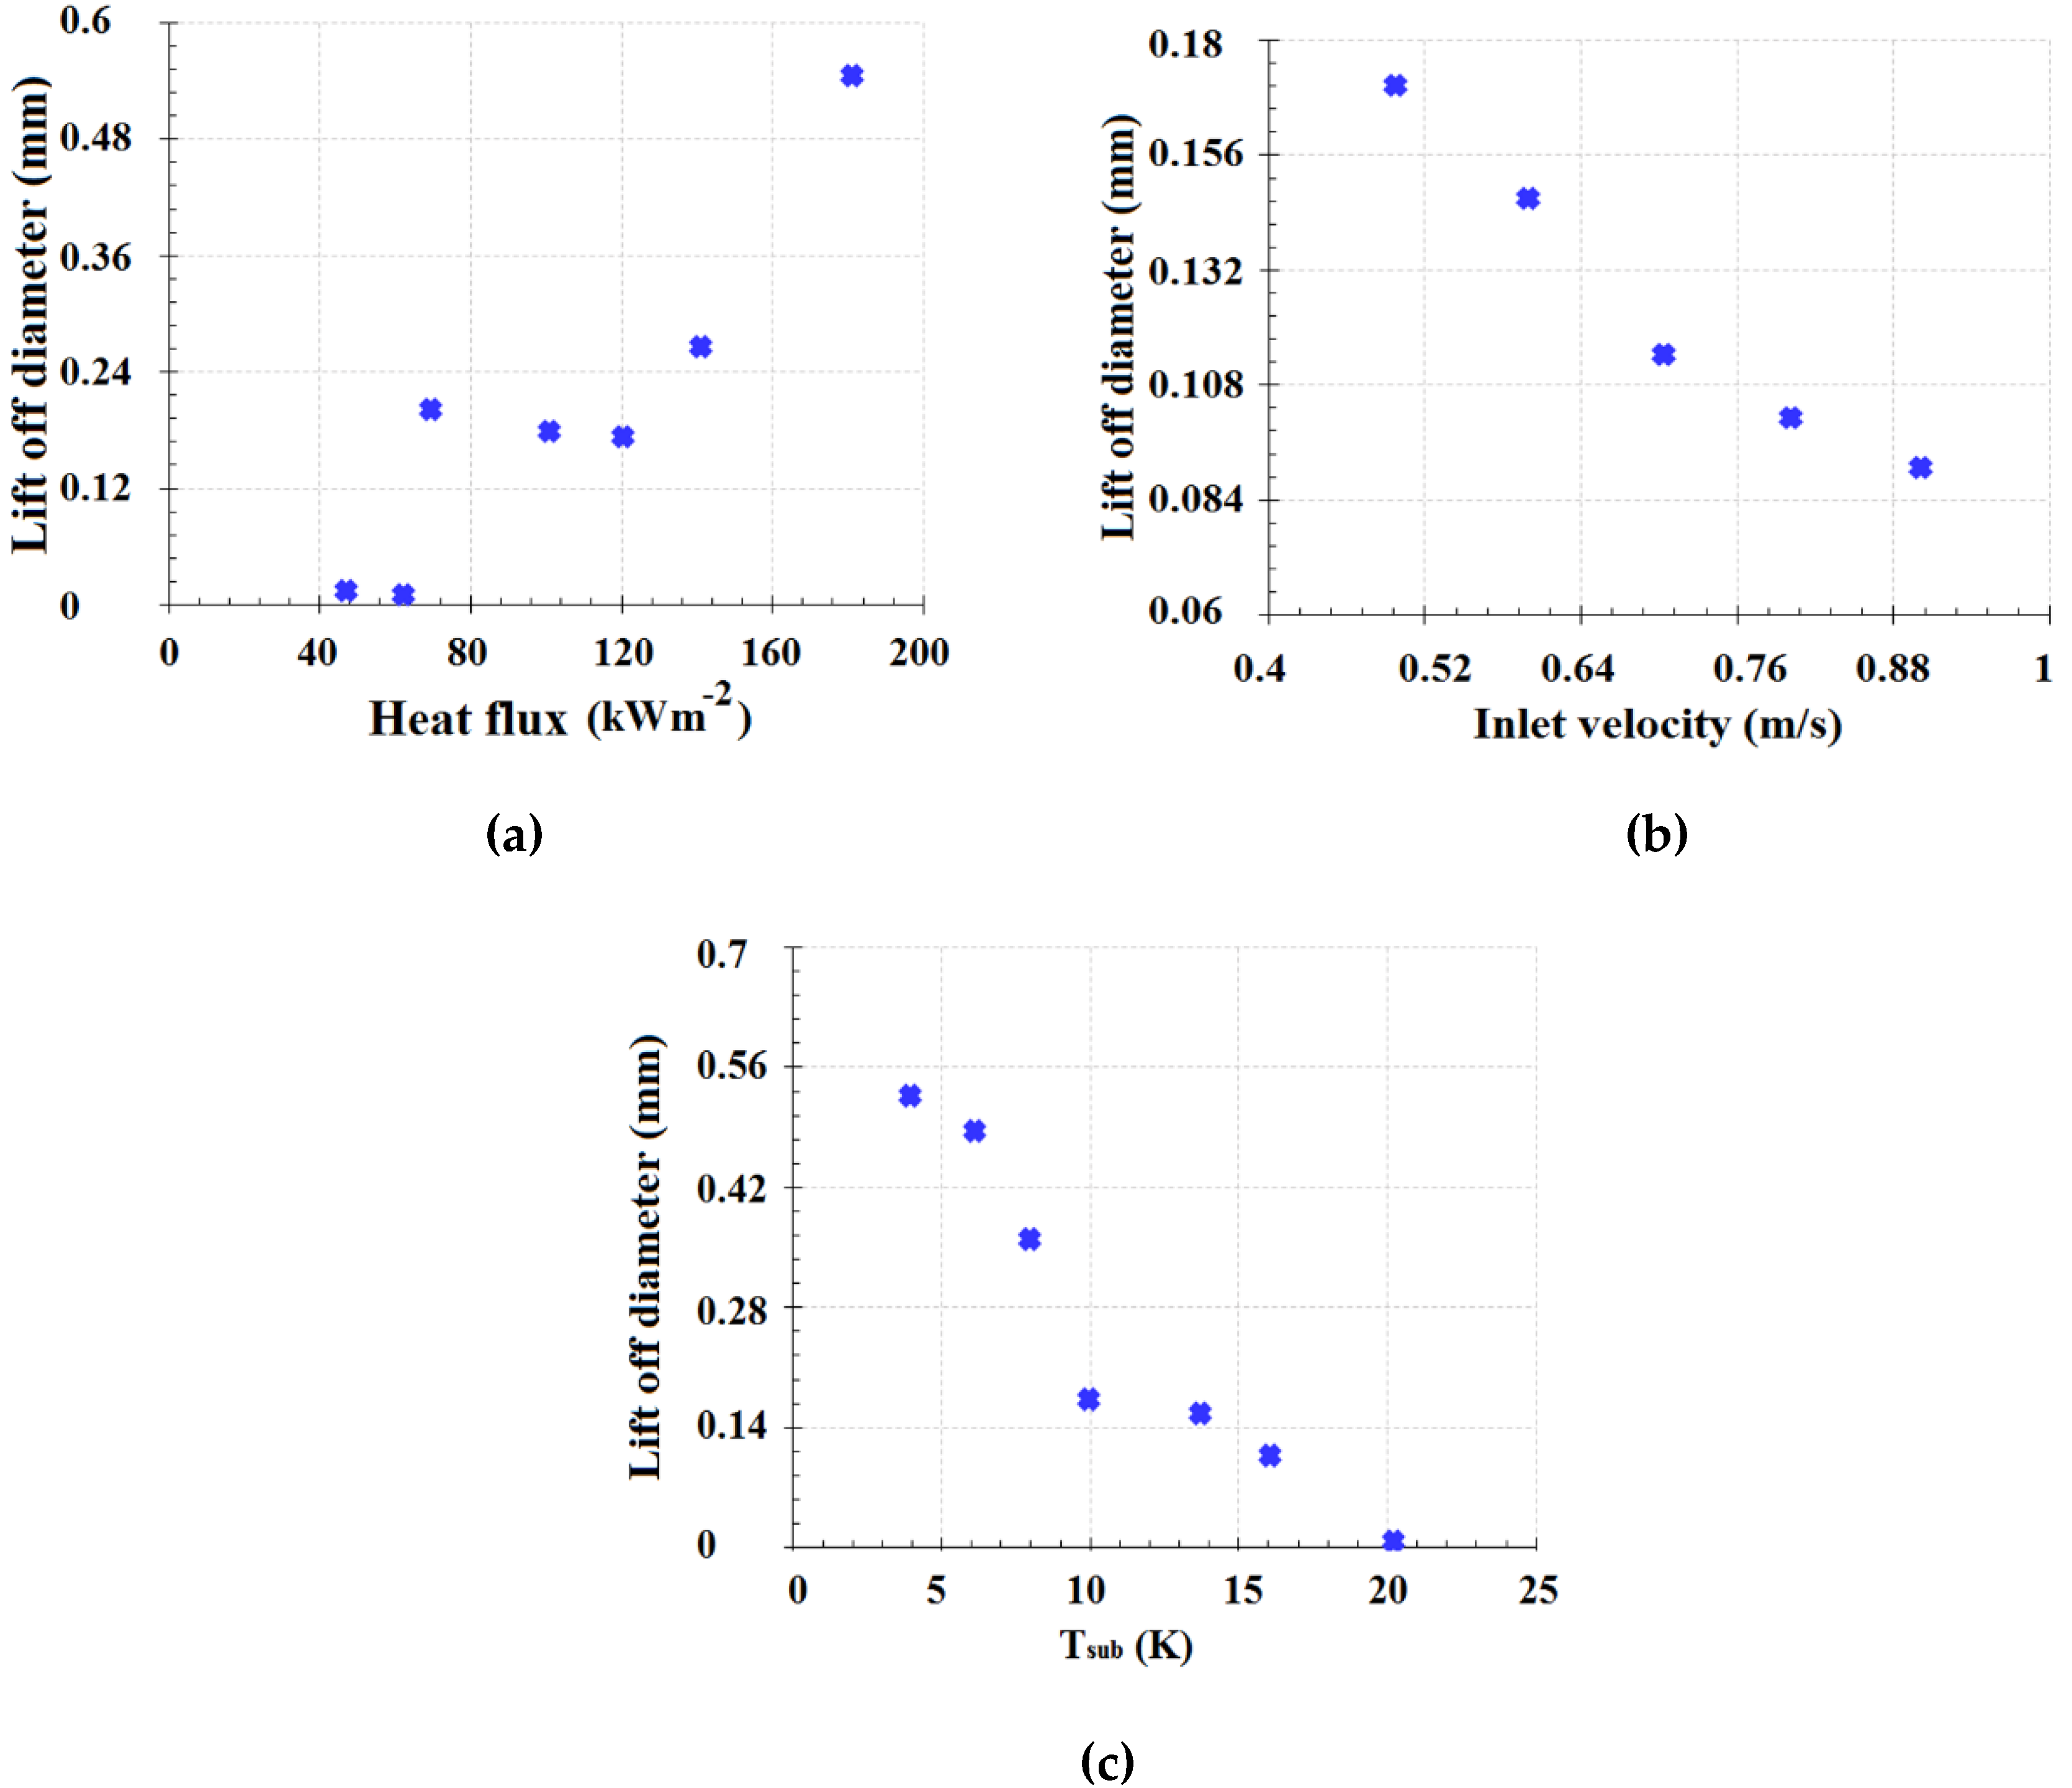
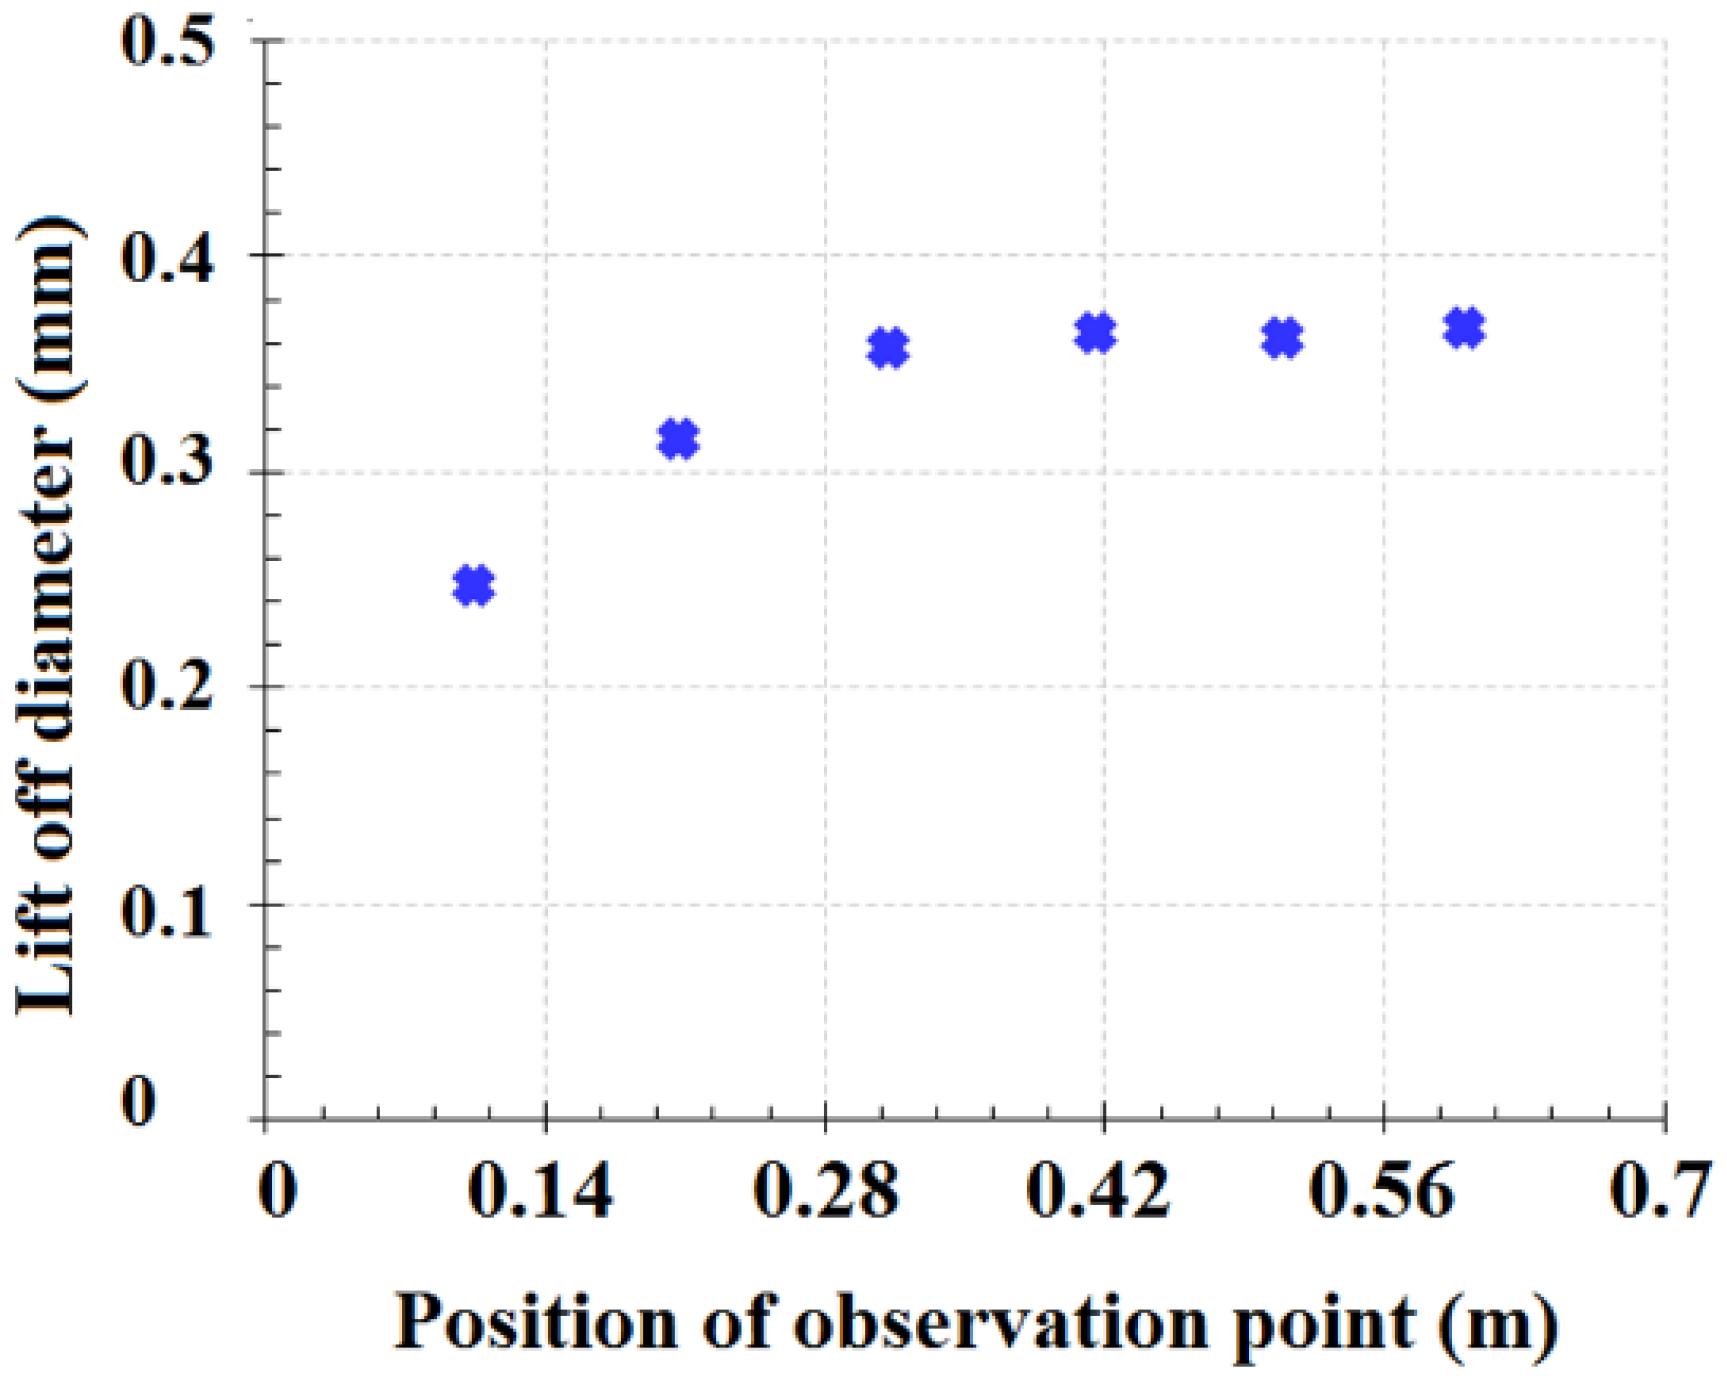
3.4. Sensitivities Analysis
4. Conclusions and Outlook
Author Contributions
Funding
Acknowledgments
Conflicts of Interest
Nomenclature
| bubble surface area () | |
| area of macrolayer () | |
| Cooper’s constant (-) | |
| drag force coefficient (-) | |
| specific heat capacity | |
| bubble diameter (m) | |
| bubble departure diameter (m) | |
| bubble base diameter (m) | |
| hydrodynamic diameter of channel (m) | |
| bubble departure frequency | |
| portion of bubble surface in contact with subcooled liquid (-) | |
| buoyancy force | |
| contact pressure force | |
| drag force | |
| growth force | |
| shear lift force | |
| surface tension force | |
| total force | |
| G | mass flux of fluid flow () |
| height of bubble without bottleneck (m) | |
| height of the bubble bottleneck (m) | |
| latent heat | |
| forced convection heat transfer coefficient (W/) | |
| Ja | Jakob number (-) |
| k | thermal conductivity |
| mass rate of evaporated liquid in the macrolayer | |
| mass rate of evaporated liquid in the microlayer | |
| N | nucleation site density () |
| referenced nucleation site density () | |
| P | pressure (bar) |
| Prandtl number (-) | |
| heat flux () | |
| heat flux into the heating wall () | |
| total heat flux from heating wall to fluid () | |
| heat flux due to evaporation of microlayer () | |
| heat flux due to evaporation of macrolayer () | |
| total heat flux of a heating wall segment () | |
| conduction heat flux between two neighboring segments of heating wall () | |
| heat transfer rate (W) | |
| r | coordinate/position |
| bubble radius (m) | |
| radius of curvature (m) | |
| bubble dryout radius (m) | |
| maximum radius in the initial growth period (m) | |
| bubble contact radius (base radius) (m) | |
| R | pipe diameter (m) |
| bubble Reynolds number (-) | |
| bulk temperature (K) | |
| liquid temperature (K) | |
| heating wall temperature (K) | |
| temperature in the bubble in the inertia-controlled growth period (K) | |
| saturation temperature (K) | |
| subcooling temperature (K) | |
| time (s) | |
| time of departure (s) | |
| bubble waiting time (s) | |
| time when the force becomes positive in heating wall normal direction (s) | |
| u | fluid flow velocity (m/s) |
| U | liquid velocity at top side of bubble (m/s) |
| bubble mass center velocity in heating wall normal direction (m/s) | |
| bubble sliding velocity in heating wall tangential direction (m/s) | |
| kinematic viscosity () | |
| volume () | |
| total volume of produced gas | |
| total volume of evaporated liquid | |
| distance between two neighboring heating wall segments (m) | |
| superheating () (K) | |
| temperature difference between two neighboring heating wall segments (K) | |
| subcooling () (K) | |
| maximal inertia-controlled growth time (s) | |
| time since start of dryout (s) | |
| time since start of quenching (s) | |
| thermal diffusivity () | |
| β | contact angle of macrolayer (rad) |
| equilibrium liquid contact angle (rad) | |
| advancing contact angle of macrolayer (rad) | |
| receding contact angle of macrolayer in (rad) | |
| torque of buoyancy force (N. m) | |
| torque of contact pressure force (N. m) | |
| torque of drag force (N. m) | |
| torque of growth force (N. m) | |
| torque of shear lift force (N. m) | |
| contact angle of microlayer (rad) | |
| bubble inclination angle (rad) | |
| orientation angle of heating wall during flow boiling (horizontal, ) (rad) | |
| liquid surface tension coefficient (N/m) | |
| interphase surface tension coefficient (N/m) | |
| density () | |
| initial microlayer thickness at time (m) | |
| microlayer thickness (m) | |
| heating wall thickness (m) | |
| thickness of thermal layer (m) | |
| Subscript | |
| b | bubble |
| cond | condensation |
| dryout | dryout area |
| d | departure |
| e | evaporation |
| fc | forced convection |
| g | gas phase |
| gl | gas–liquid |
| i | inlet |
| l | liquid phase |
| mi | microlayer |
| ma | macrolayer |
| max | maximum |
| n | heating wall normal direction |
| out | heat flux transferred out of the heating wall |
| q | quenching |
| sg | solid–gas |
| sl | solid–liquid |
| t | heating wall tangential direction |
| td | thermal diffusion controlled growth |
| th | thermal layer |
| tl | turbulent layer |
| w | heating wall |
References
- Krepper, E.; Rzehak, R.; Lifante, C.; Frank, T. CFD for subcooled flow boiling: Coupling wall boiling and population balance models. Nucl. Eng. Des. 2013, 255, 330–346. [Google Scholar] [CrossRef]
- Yeoh, G.H.; Tu, J. Computational Techniques for Multiphase Flows, 1st ed.; Elsevier: London, UK, 2010; pp. 351–456. [Google Scholar]
- Prosperetti, A.; Tryggvason, G. Computational Methods for Multiphase Flow, 1st ed.; Cambridge University Press: New York, NY, USA, 2007; pp. 1–85. [Google Scholar]
- Kurul, N.; Podowski, M.Z. Multidimensional effects in forced convection subcooled boiling. In Proceedings of the Ninth International Heat Transfer Conference, New York, NY, USA, 19–24 August 1990; Volume 2, pp. 19–24. [Google Scholar]
- Tolubinsky, V.I.; Kostanchuk, D.M. Vapour bubbles growth rate and heat transfer intensity at subcooled water boiling. In International Heat Transfer Conference 4; Begel House Inc.: Danbury, CT, USA, 1970; Volume 23. [Google Scholar]
- Krepper, E.; Lucas, D.; Frank, T.; Prasser, H.M.; Zwart, P.J. The inhomogeneous MUSIG model for the simulation of polydispersed flows. Nucl. Eng. Des. 2008, 238, 1690–1702. [Google Scholar] [CrossRef]
- Rayleigh, L. Pressure due to collapse of bubbles. Philos. Mag. 1917, 34, 94. [Google Scholar] [CrossRef]
- Plesset, M.S.; Zwick, S.A. The growth of vapor bubbles in superheated liquids. J. Appl. Phys. 1954, 25, 493–500. [Google Scholar] [CrossRef]
- Forster, H.; Zuber, N. Growth of a vapor bubble in a superheated liquid. J. Appl. Phys. 1954, 25, 474–478. [Google Scholar] [CrossRef]
- Griffith, P. Bubble Growth Rates in Boiling; Technical Report; Massachusetts Institute of Technology, Division of Industrial Cooperation: Cambridge, MA, USA, 1956. [Google Scholar]
- Savic, P. Discussion on bubble growth rates in boiling. Int. J. Heat Mass Transf. 1958, 80, 726–728. [Google Scholar]
- Zuber, N. The dynamics of vapor bubbles in nonuniform temperature fields. Int. J. Heat Mass Transf. 1961, 2, 83–98. [Google Scholar] [CrossRef]
- Mikic, B.B.; Rohsenow, W.M.; Griffith, P. On bubble growth rates. Int. J. Heat Mass Transf. 1970, 13, 657–666. [Google Scholar] [CrossRef]
- Cooper, M.G.; Lloyd, A.J.P. The microlayer in nucleate pool boiling. Int. J. Heat Mass Transf. 1969, 12, 895–913. [Google Scholar] [CrossRef]
- Labuntsov, D.A. State of the art of the nucleate boiling mechanism of liquids. Heat Transf. Phys. Hydrodyn. Mosk. Nauka Russ. 1974, 98–115. [Google Scholar]
- Van Stralen, S.J.D.; Sohal, M.S.; Cole, R.; Sluyter, W.M. Bubble growth rates in pure and binary systems: Combined effect of relaxation and evaporation microlayers. Int. J. Heat Mass Transf. 1975, 18, 453–467. [Google Scholar] [CrossRef]
- Klausner, J.F.; Mei, R.; Bernhard, D.M.; Zeng, L.Z. Vapor bubble departure in forced convection boiling. Int. J. Heat Mass Transf. 1993, 36, 651–662. [Google Scholar] [CrossRef]
- Situ, R.; Hibiki, T.; Ishii, M.; Mori, M. Bubble lift-off size in forced convective subcooled boiling flow. Int. J. Heat Mass Transf. 2005, 48, 5536–5548. [Google Scholar] [CrossRef] [Green Version]
- Sugrue, R.M. The Effects of Orientation Angle, Subcooling, Heat Flux, Mass Flux, and Pressure on Bubble Growth and Detachment in Subcooled Flow Boiling. Ph.D. Thesis, Massachusetts Institute of Technology, Cambridge, MA, USA, 2012. [Google Scholar]
- Thorncroft, G.E.; Klausner, J.F.; Mei, R. Bubble forces and detachment models. Multiph. Sci. Technol. 2001, 13, 35–76. [Google Scholar] [CrossRef]
- Chen, D.; Pan, L.M.; Ren, S. Prediction of bubble detachment diameter in flow boiling based on force analysis. Nucl. Eng. Des. 2012, 243, 263–271. [Google Scholar] [CrossRef]
- Colombo, M.; Fairweather, M. Prediction of bubble departure in forced convection boiling: A mechanistic model. Int. J. Heat Mass Transf. 2015, 85, 135–146. [Google Scholar] [CrossRef]
- Yun, B.J.; Splawski, A.; Lo, S.; Song, C.H. Prediction of a subcooled boiling flow with advanced two-phase flow models. Nucl. Eng. Des. 2012, 253, 351–359. [Google Scholar] [CrossRef]
- Raj, S.; Pathak, M.; Khan, M.K. An analytical model for predicting growth rate and departure diameter of a bubble in subcooled flow boiling. Int. J. Heat Mass Transf. 2017, 109, 470–481. [Google Scholar] [CrossRef]
- Mazzocco, T.; Ambrosini, W.; Kommajosyula, R.; Baglietto, E. A reassessed model for mechanistic prediction of bubble departure and lift off diameters. Int. J. Heat Mass Transf. 2018, 117, 119–124. [Google Scholar] [CrossRef]
- Ranz, W.E.; Marshall, W.R. Evaporation from drops. Chem. Eng. Prog. 1952, 48, 141–146. [Google Scholar]
- Ding, W.; Krepper, E.; Hampel, U. Evaluation of the microlayer contribution to bubble growth in horizontal pool boiling with a mechanistic model that considers dynamic contact angle and base expansion. Int. J. Heat Fluid Flow 2018, 72, 274–287. [Google Scholar] [CrossRef]
- Zhao, Y.; Tsuruta, T. Prediction of bubble behavior in subcooled pool boiling based on microlayer model. JSME Int. J. Ser. B 2002, 45, 346–354. [Google Scholar] [CrossRef]
- Utaka, Y.; Kashiwabara, Y.; Ozaki, M. Microlayer structure in nucleate boiling of water and ethanol at atmospheric pressure. Int. J. Heat Mass Transf. 2013, 57, 222–230. [Google Scholar] [CrossRef]
- Moore, D.W. The boundary layer on a spherical gas bubble. J. Fluid Mech. 1963, 16, 161–176. [Google Scholar] [CrossRef]
- Bergman, T.L.; Incropera, F.P.; DeWitt, D.P.; Lavine, A.S. Fundamentals of Heat and Mass Transfer, 7th ed.; John Wiley & Sons: Hoboken, NJ, USA, 2011; pp. 435–517. [Google Scholar]
- Clift, R.; Grace, J.R.; Weber, M.E. Bubbles, Drops, and Particles, 1st ed.; Academic Press Inc.: New York, NY, USA, 1978. [Google Scholar]
- Van Helden, W.G.J.; Van Der Geld, C.W.M.; Boot, P.G.M. Forces on bubbles growing and detaching in flow along a vertical wall. Int. J. Heat Mass Transf. 1995, 38, 2075–2088. [Google Scholar] [CrossRef] [Green Version]
- Auton, T.R. The Dynamics of Bubbles, Drops and Particles in Motion in Liquids. Ph.D. Thesis, University of Cambridge, Cambridge, UK, 1984. [Google Scholar]
- Sugrue, R.; Buongiorno, J. A modified force-balance model for prediction of bubble departure diameter in subcooled flow boiling. Nucl. Eng. Des. 2016, 305, 717–722. [Google Scholar] [CrossRef]
- Mukherjee, A.; Kandlikar, S.G. Numerical study of single bubbles with dynamic contact angle during nucleate pool boiling. Int. J. Heat Mass Transf. 2007, 50, 127–138. [Google Scholar] [CrossRef]
- Yuan, Y.; Lee, T.R. Contact angle and wetting properties. In Surface Science Techniques; Bracco, G., Holst, B., Eds.; Springer Series in Surface Sciences; Springer: Berlin/Heidelberg, Germany, 2013; Volume 51, pp. 3–34. [Google Scholar]
- Prodanovic, V.; Fraser, D.; Salcudean, M. Bubble behavior in subcooled flow boiling of water at low pressures and low flow rates. Int. J. Multiph. Flow 2002, 28, 1–19. [Google Scholar] [CrossRef]
- Gerardi, C.; Buongiorno, J.; Hu, L.W.; McKrell, T. Study of bubble growth in water pool boiling through synchronized, infrared thermometry and high-speed video. Int. J. Heat Mass Transf. 2010, 53, 4185–4192. [Google Scholar] [CrossRef]
- Hong, G.; Yan, X.; Yang, Y.H.; Xie, T.Z.; Xu, J.J. Bubble departure size in forced convective subcooled boiling flow under static and heaving conditions. Nucl. Eng. Des. 2012, 247, 202–211. [Google Scholar] [CrossRef]
- Lemmert, M.; Chawla, J.M. Influence of flow velocity on surface boiling heat transfer coefficient. Heat Transf. Boil. 1997, 237, 247. [Google Scholar]


| Author | Klausner et al. [17] | Situ et al. [18] | Sugrue [19] | Prodanovic et al. [38] |
|---|---|---|---|---|
| Fluid | R113 | Water | Water | Water |
| Heating wall orientation | Horizontal | Vertical | 0°, 30°, 45°, 60°, 90°, 180° | Vertical |
| Geometry of channel | Rectangular; ; no full filled | Annular; observation points at different positions | Rectangular; | Rectangular; |
| 112–287 | 466–900 | 250–400 | 76.6–766 | |
| 11–26 | 54–206 | 50, 100 | 200–1000 | |
| (°C) | saturated | 2–20 | 10, 20 | 10, 20, 30 |
| P (bar) | 1.5 | 1.01 | 1.01; 2.02; 5.05 | 1.05; 2 |
| Measurement uncertainties | ±0.03 mm | ±0.016 mm | ±0.113 mm |
© 2019 by the authors. Licensee MDPI, Basel, Switzerland. This article is an open access article distributed under the terms and conditions of the Creative Commons Attribution (CC BY) license (http://creativecommons.org/licenses/by/4.0/).
Share and Cite
Setoodeh, H.; Ding, W.; Lucas, D.; Hampel, U. Prediction of Bubble Departure in Forced Convection Boiling with a Mechanistic Model That Considers Dynamic Contact Angle and Base Expansion. Energies 2019, 12, 1950. https://doi.org/10.3390/en12101950
Setoodeh H, Ding W, Lucas D, Hampel U. Prediction of Bubble Departure in Forced Convection Boiling with a Mechanistic Model That Considers Dynamic Contact Angle and Base Expansion. Energies. 2019; 12(10):1950. https://doi.org/10.3390/en12101950
Chicago/Turabian StyleSetoodeh, Hamed, Wei Ding, Dirk Lucas, and Uwe Hampel. 2019. "Prediction of Bubble Departure in Forced Convection Boiling with a Mechanistic Model That Considers Dynamic Contact Angle and Base Expansion" Energies 12, no. 10: 1950. https://doi.org/10.3390/en12101950