Simulation Study of an Oxy-Biomass-Based Boiler for Nearly Zero Emission Using Aspen Plus


School of Energy and Environmental Engineering, Hebei University of Technology, 5340# Xiping Road, Shuangkou Town, Beichen District, Tianjin 300401, China
*
Author to whom correspondence should be addressed.
Energies 2019, 12(10), 1949; https://doi.org/10.3390/en12101949
Submission received: 26 April 2019
/
Revised: 14 May 2019
/
Accepted: 17 May 2019
/
Published: 21 May 2019
Abstract
:Bioenergy integrated CO2 capture is considered to be one of the viable options to reduce the carbon footprint in the atmosphere, as well as to lower dependability on the usage of fossil fuels. The present simulation-based study comprises the oxy bio-CCS technique with the objective of bringing about cleaner thermal energy production with nearly zero emissions, CO2 capture and purification, and with the ability to remove NOx and SO2 from the flue gas and to generate valuable byproducts, i.e., HNO3 and H2SO4. In the present work, a simulation on utilization of biomass resources by applying the oxy combustion technique was carried out, and CO2 sequestration through pressurized reactive distillation column (PRDC) was integrated into the boiler. Based on our proposed laboratory scale bio-CCS plant with oxy combustion technique, the designed thermal load was kept at 20 kWth using maize stalk as primary fuel. With the objective of achieving cleaner production with near zero emissions, CO2 rich flue gas and moisture generated during oxy combustion were hauled in PRDC for NOx and SO2 absorption and CO2 purification. The oxy combustion technique is unique due to its characteristic low output of NO sourced by fuel inherent nitrogen. The respective mechanisms of fuel inherent nitrogen conversion to NOx, and later, the conversion of NOx and SO2 to HNO3 and H2SO4 respectively, involve complex chemistry with the involvement of N–S intermediate species. Based on the flue gas composition generated by oxy biomass combustion, the focus was given to the fuel NOx, whereby different rates of NO formation from fuel inherent nitrogen were studied to investigate the optimum rates of conversion of NOx during conversion reactions. The rate of conversion of NOx and SO2 were studied under fixed temperature and pressure. The factors affecting the rate of conversion were optimized through sensitivity analysiês to get the best possible operational parameters. These variable factors include ratios of liquid to gas feed flow, vapor-liquid holdups and bottom recycling. The results obtained through optimizing the various factors of the proposed system have shown great potential in terms of maximizing productivity. Around 88.91% of the 20 kWth boiler’s efficiency was obtained. The rate of conversion of NOx and SO2 were recorded at 98.05% and 87.42% respectively under parameters of 30 °C temperature, 3 MPa pressure, 10% feed stream holdup, liquid/gaseous feed stream ratio of 0.04 and a recycling rate of the bottom product of 20%. During the simulation process, production of around four kilograms per hour of CO2 with 94.13% purity was achieved.
1. Introduction
Based on a proposed laboratory scale biomass boiler with 20 kWth capacity, a simulation study with an objective of optimizing the oxy biomass with CO2-enriched flue gas processing system (oxy bio–CCS) was carried out. The optimization was accomplished by conducting the design specification and sensitivity analysis of the proposed oxy bio-CCS system in order to determine the optimum operational parameters involved during the plant processes. Biomass power, due to its availability and sustainability, is a potential source of heat and power generation on various scales, such as domestic, commercial, semi industrial and industrial. According to International Renewable Energy Agency, 2018 [1], the annual industrial level thermal energy obtained from biomass will exceed 20.2 EJ/year in 2050, compared to an energy output of 8 EJ in 2015. Biomass will account for two thirds of direct utilization of renewable energy according to the estimation for 2050 [2]. The energy and environmental potential of biomass as primary source of fuel has been investigated by several researchers [3,4,5]. Greenhouse gas emissions associated with biomass boilers comprise 42 and 85 g CO2-e/kWh, which were recorded to be less than those emitted from solar and wind power of equal installed capacity [6]. Studies on different perspectives of biomass fueled boilers have been conducted, e.g., varying the fuel type [7,8], and rating capacities [9] etc. Maize, being one of the world’s top agricultural crops, can play an important role as a biomass feedstock. The world’s annual maize production is the largest among all crops; 32% maize is produced than wheat. Around 22.83% of the world’s maize is produced in China, while the US accounts for 32.69%. According to FAO statistics from 2016 [10], annually, about 1.88 × 10⁸ tons of maize stalk (dry matter) is burned worldwide, which accounts for 49.29% of total agricultural biomass burned (including residues of maize, wheat, sugar cane and rice). This makes maize stalk biomass a more suitable fuel for extracting thermal energy.
Considering the Chinese perspective of biomass potential, Cheng et al., 2014 [11], have elaborated an evaluation of agricultural biomass potential in China with a methodological development. Accordingly, as per the medium- and long-term development program for renewable energy in China, a biomass power generation capacity of 24 GW was proposed by 2020. Furthermore, the emissions coming from boilers have caused concerns as a source of atmospheric pollution. Due to skyrocketing developments in the global industrialization, the problem of effluents is significant, particularly from power plants fueled with fossil fuels. With broadening awareness regarding the greenhouse effect and air pollution, environmental concerns and clean energy development have attracted much attention [12]. CO2, being the major constituent of greenhouse gases, accounts for about 65% of radiative forcing by long-lived greenhouse gases, and it has attained its highest levels, i.e., 408.02 ppm, of global annual average concentrations [13], with an annual increase of 0.83% and an accumulative 144% increase from the pre-industrial level of about 278 ppm.
Besides CO2, air contaminants including NOx and SOx have incited global thinkers to search for the possible limiting technologies. Researchers have focused on investigating abatement techniques of SOx and NOx in terms of desulfurization and denitrification technologies. The wet process for the removal of NOx and SO2 from flue gas mix [14], microwave irradiation over activated carbon [15], air staging along addition of lime (CaO) into the system [16] contribute to efficient denitrification and desulfurization of the flue gas. A study was conducted by Liu et al. [17], whereby the experimental and modeling results of desulfurization under oxy condition were revealed to show increased efficiency of an average of five times compared to values for conventional combustion. Accordingly, the residence time of SO2 due to flue gas recirculation was extended. Several patented investigations have been carried out in the field of desulfurization, such as the SNOX process, developed by Haldor Topsoe [18], where the inventors claimed to achieve desulfurization through the integration of catalytic CO2 oxidation and oxy fuel sour compression. Using industrial flue gas as a source of SO2, an improved lead chamber process of producing sulfuric acid from the industrial flue gas was developed by Keilin et al. [19]. The inventors devised a system to produce HNO3 and H2SO4 through the conversion of NOx and SOx in the flue gas mixture. NOx abatement technique through flue gas treatment can generally be categorized as either dry and wet systems, where selective catalytic reduction (SCR) [20,21], selective non-catalytic reduction (SNCR) [22], air/fuel staging [23], low NOx burner [24] and flue gas recirculation [25] fall under the category of dry flue gas treatment for NOx control, and absorption [26] under higher pressure to a wet process of denitrification. These industrial processes can be optimized through the relevant computer operated simulation programs in order to obtain the best possible operational parameters through design specifications and sensitivity analyses. The Aspen PLUS application is used to simulate and optimize actual plant processes.
Many researchers have conducted simulation studies to get the optimum operational parameters of various plant processes, such as Aspen PLUS simulation of integrated gasification combined cycle thermodynamic with in situ desulfurization and CO2 capture [27], circulating fluidized bed reactor [28], power cycle [29], CO2 liquefaction [30], sour compression unit for CO2 purification [31,32] and oxy fuel combustion [33], etc. White et al. [34,35,36], devised a mechanism to recover pure CO2 from the oxy fuel combustion process by deploying computer simulation techniques by Aspen plus.
The oxy fuel combustion technique results in a flue gas comprising mainly CO2, with impurities of NOx and SO2; thus, this technique is appropriate for effective CCS processes. The total amount of impurities in CO2 stream depend on the boiler’s operating conditions, fuel type and its composition. According to Leung et al., 2014 [37], the resultant CO2 rich flue gas stream must be purified in order to make it feasible for transportation and geological storage in saline aquifers. Researchers have sought more feasible CO2 purification processes with simultaneous removal of NOx and SO2 from the flue gas stream. Siddiqi et al. [38], for example, have studied the effects of NOx on SO2 in wet flue gas cleaning process. A multi-stage process for CO2 purification and acid formation was invented by Degenstein et al. [39]; the inventors claimed to have developed a means of treating the carbon dioxide stream at elevated pressure of at least 2 bar pressure. The inventors focused on the interchangeability of NOx and H2SO4 through the desorption of NOx and the conversion of NO to NO2 by stripping and converting units. In the invention of Petrocelli et al. [40], a SO2-rich CO2 gas stream was used in their research, in which catalytic oxidation of SO2 and sour compression through SO3 conversion to H2SO4 were the focus. In his patent, Allam et al. [40,41] demonstrated the removal of SOx and/ or NOx from a gaseous CO2 steam at elevated pressure in the presence of molecular oxygen and water. Where NO acted as oxidant for SO2 conversion to SO3 and then to H2SO4, before spontaneously converting to HNO3. This invention was noteworthy for its demonstration of the oxy fuel combustion process. Laura Torrente-Murciano et al. [42] studied the oxidation of SO2 in the presence of NO2 under conditions which were similar to those of the sour compression process, and determined the importance of the presence of liquid water in the completion of these reactions. The research carried out by Normann et al. [43] was focused on the chemistry involved in the binary interactions of SO2 and NOx compounds in pressurized flue gas systems. Pursuing the same technique, Sima et al. [44] further extended this research and investigated the effects on pH on the components involved during the acidification of SO2 and NOx in pressurized flue gas stream enriched with CO2.
In our Aspen plus-based simulation study, the flue gas generated during oxy biomass combustion was subjected to a pressurized reactive distillation column (PRDC) process. This process involved the occurrence of a number of chemical reactions which resulted in the removal of SO2 and NOx from the CO2-enriched flue gas in the form of valuable byproducts, i.e., H2SO4 and HNO3. The conversion rates of NOx and SO2 into their respective acidic distillates correspond to the purification of CO2.
The ratio of liquid to gaseous feed stream, rate of bottom product recycling, and ratio of holdup of the feed streams at the distillation column are important factors for PRDC which can play key roles in meeting the objectives of achieving oxy biomass–CCS. These factors are relevant to the specific operation of the distillation column, and have been analyzed in the relevant section through a sensitivity analysis using Aspen plus a simulation program. Keeping in view the negative carbon feature of oxy biomass combustion and CO2 purification for CCS, the present work provides insights into the use of renewable energy with nearly zero emissions.
2. Materials and Methods
2.1. Methodology
A proposed 20 kWth biomass boiler with oxy combustion and CCS techniques was analyzed using the Aspen plus simulation program. The objectives of this simulation were to determine the best possible operational parameters for the integrated sensitivity analysis, where the maximum efficiencies for oxy biomass thermal process and the CO2 purification process could be attained by the least effort and with nearly zero emissions. The process industry-designed Aspen plus simulation software includes a wide range of tools such as components, physical property databases and process models. The whole simulation process was divided into two parts in the present work: oxy biomass combustion with CO2-enriched flue gas recirculation, and purification of the produced CO2-enriched flue gas through conversion of NOx and SO2.
For the first step of the simulation, the Peng Robinson equation of state physical property [45] was used to simulate the operations of the thermal boiler. The advantage of using Peng Robinson property method is that its equations of state give better agreement between the experimental and simulation results, and it can be used in both the gaseous and liquid phases. In this equation, the pressure term of the Van der Waals equation was modified. The empirical form of this equation is mentioned in Equation (1):
where ; ; ; ; ; and .
Equation (1) can be re-written as:
where ; ; and .
The ELECNRTL as one of the electrolyte property method was used to calculate and predict the best possible process results for simulating the PRDC process in order to purify the CO2 rich stream of flue gas. Furthermore, the Steam-TA property method was used to better predict the water/steam properties. During the simulation study of the oxy biomass with CCS techniques, the most suitable process models available in Aspen plus were assigned to specify the operational functions of process units, which were interconnected through material, and energy flow to build the process flowsheet. The properties of maize stalk biomass were used in the present simulation study, whose proximate and ultimate analyses data, as described in Table 1, were obtained using laboratory instruments i.e., TRGF-8000 (Hebi Tianrun Electronic Technology Company, HeBi, China) and EA-3000 Euro Vector EA-IRMS (EUROVECTOR Srl, Italy) respectively.
A pressurized reactive distillation column (PRDC) was used to model the conversion of SO2 and NOx into H2SO4 and HNO3 along with purification of CO2 during the present simulation study. In this model, the following three main factors were investigated for their effects on the process operations:
- Ratio of liquid feed to gaseous feed of PRDC;
- Ratio of holdup of the feed streams in PRDC; and
- Rate of recycling of bottom product (by-products in the present case).
These variable factors have shown great influence on the overall process of PRDC in terms of achieving nearly zero emission along with the purification of CO2 for CCS.
2.2. Simulation Model
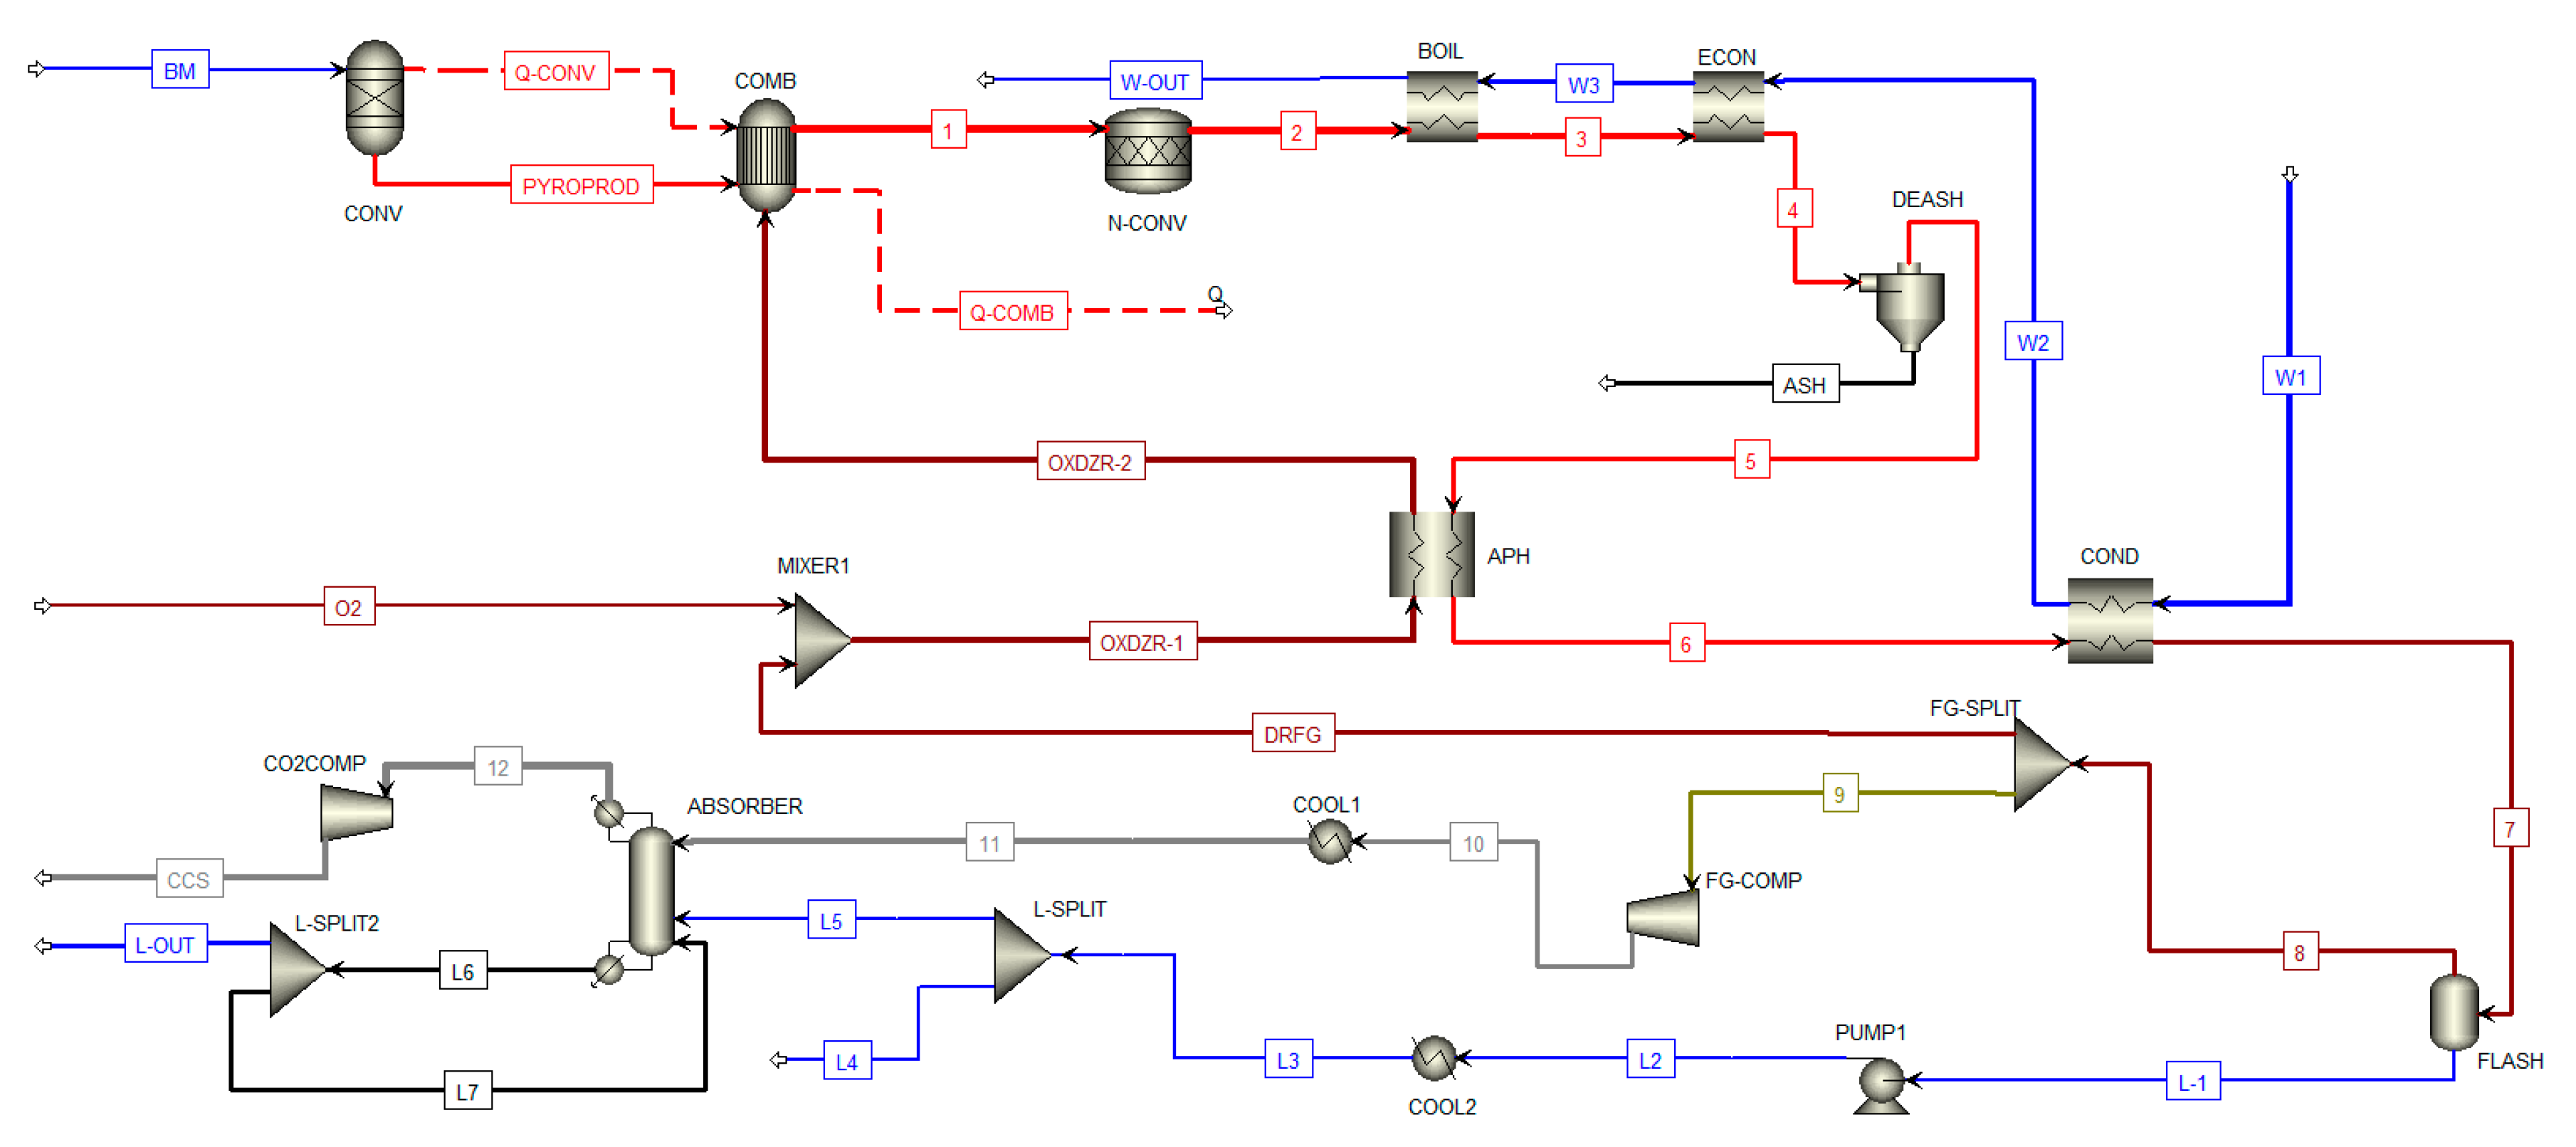
The simulation model is based on two interconnected processes: oxy biomass combustion with flue gas recirculation, and CO2 purification unit processing, including the conversion of SO2 and NOx, and the generation of by-products in the form of H2SO4, HNO3 and CO2 purification. A synchronized process flow according to the proposed laboratory scale plant process is illustrated in Figure 1. In the oxy biomass combustion part of the understudied simulation system, three reactor models, namely RYield, RGibbs and RStoic, were used respectively to simulate the conversion of non-conventional maize stalk biomass fuel into conventional form, the combustion by minimizing the Gibbs free energy, and the conversion of fuel inherent nitrogen into NOx at the pre-specified temperature under an oxy atmosphere. RYield model generates the elemental building blocks of non-conventional components. The RGibbs model produces the combustion products and the RStoic model converts the fuel inherent nitrogen into NOx.
The combustion product achieved using the RGibbs model is a mixture of flue gases containing CO2, CO, H2O, SO2, N2, NO, NO2, and excess O2, with ash as solid residue. In modeling the oxy biomass combustion, NO produced by the model does not actually represent the exact NOx formation. To accurately determine the fuel nitrogen conversion into NOx, the RStoic model was introduced into the flue gas flow channel based on our previous experimental work [46]. The detailed reaction mechanism occurring in the RStoic reaction model involves the conversion of fuel nitrogen into fuel NOx or elemental nitrogen, as illustrated in Section 2.3.1. The enthalpy of combustion taken by the flue gas is transferred to water for heating in the boiler through a heat exchanger. Ash removal was modelled by integrating the solid separator process model. The flue gas exiting the RStoic reactor model was set at 1000 °C, which was reduced to 180 °C after passing through the boiler. The thermal energy of the flue gas at 180 °C was used in the economizer for heat recovery by the introduced water. The relative low temperature flue gas stream was allowed to heat up the oxidizers by air preheater, where the temperature of the oxidizers was raised to 80 °C. The flue gas produced during the combustion process contains moisture, which should be minimized to a certain level in order to not impede the process efficiency. The exhaust flue gas stream was connected to the condenser followed by flash for the removal of moisture in the flue gas. The condensate stream containing 0.99 mole fraction of water after flushing from the flue gas stream was used as a liquid feed for the CO2 purification unit for the absorption of NOx and SO2 to yield the acidic condensates. The cooled dry flue gas stream was then split into two segments; one was allowed to return to the combustion reactor RGibbs after mixing with the pure O2 stream (considering an excess O2 factor of not more than 4% in the flue gas exiting the boiler), while the second (Stream 9) was set as the feed source for the CO2 purification unit.
The CO2-enriched flue gas was compressed by the compressor process model. The resultant flue gas was cooled through the cooler model prior to entering the PRDC model. A RadFrac column was used to perform the functions of the pressurized reactive distillation column (PRDC), where the gaseous feed stream (11) entered through the bottom end, and the liquid feed stream (L5) was injected through the top stage of the column. In the RadFrac model, kinetic and equilibrium reaction models must be synchronized in the Reaction module of the Aspen plus. The detailed NOx and SO2 absorption mechanisms involving the formation of complex species is described in Section 2.3.2. The pre-defined kinetic parameters of NOx and SO2 absorption reactions were integrated into the Reaction module to study their respective conversion into acids. Similar to the CO2-enriched flue gas stream, the condensate stream was used as the liquid feed for the reactive distillation column. Its pressure and temperature values were synchronized according to flue gas stream, and absorption studies were carried out by varying the liquid to gas ratio in order to determine the best possible values for CO2 purification. During the PRDC process, NOx and SO2 underwent the pre-specified reaction scheme and was converted to HNO3 and H2SO4 respectively. The acidic forms were obtained as liquid condensate from the bottom stage of the reactive column, whose fractional compositions were adjusted by varying the recycle ratio to get the best possible values of NOx and SO2. The resulting CO2-rich and effluent-lean vapor stream leaving the reactive column was compressed through the compressor model to obtain CO2 liquefaction, whereby liquefied CO2 is available for transportation and storage under saline aquifers or for further use. The operational parameters and their ranges in the present simulation process are summarized in Table 2.
2.3. Reaction Mechanism
The reaction mechanism involved in the RStoic reactor model used for the conversion of fuel nitrogen to NOx or elemental nitrogen and absorption of NOx and SO2 in RadFrac reactive distillation column model of the Aspen plus simulation are described in the following sections:
2.3.1. Fuel N Conversion
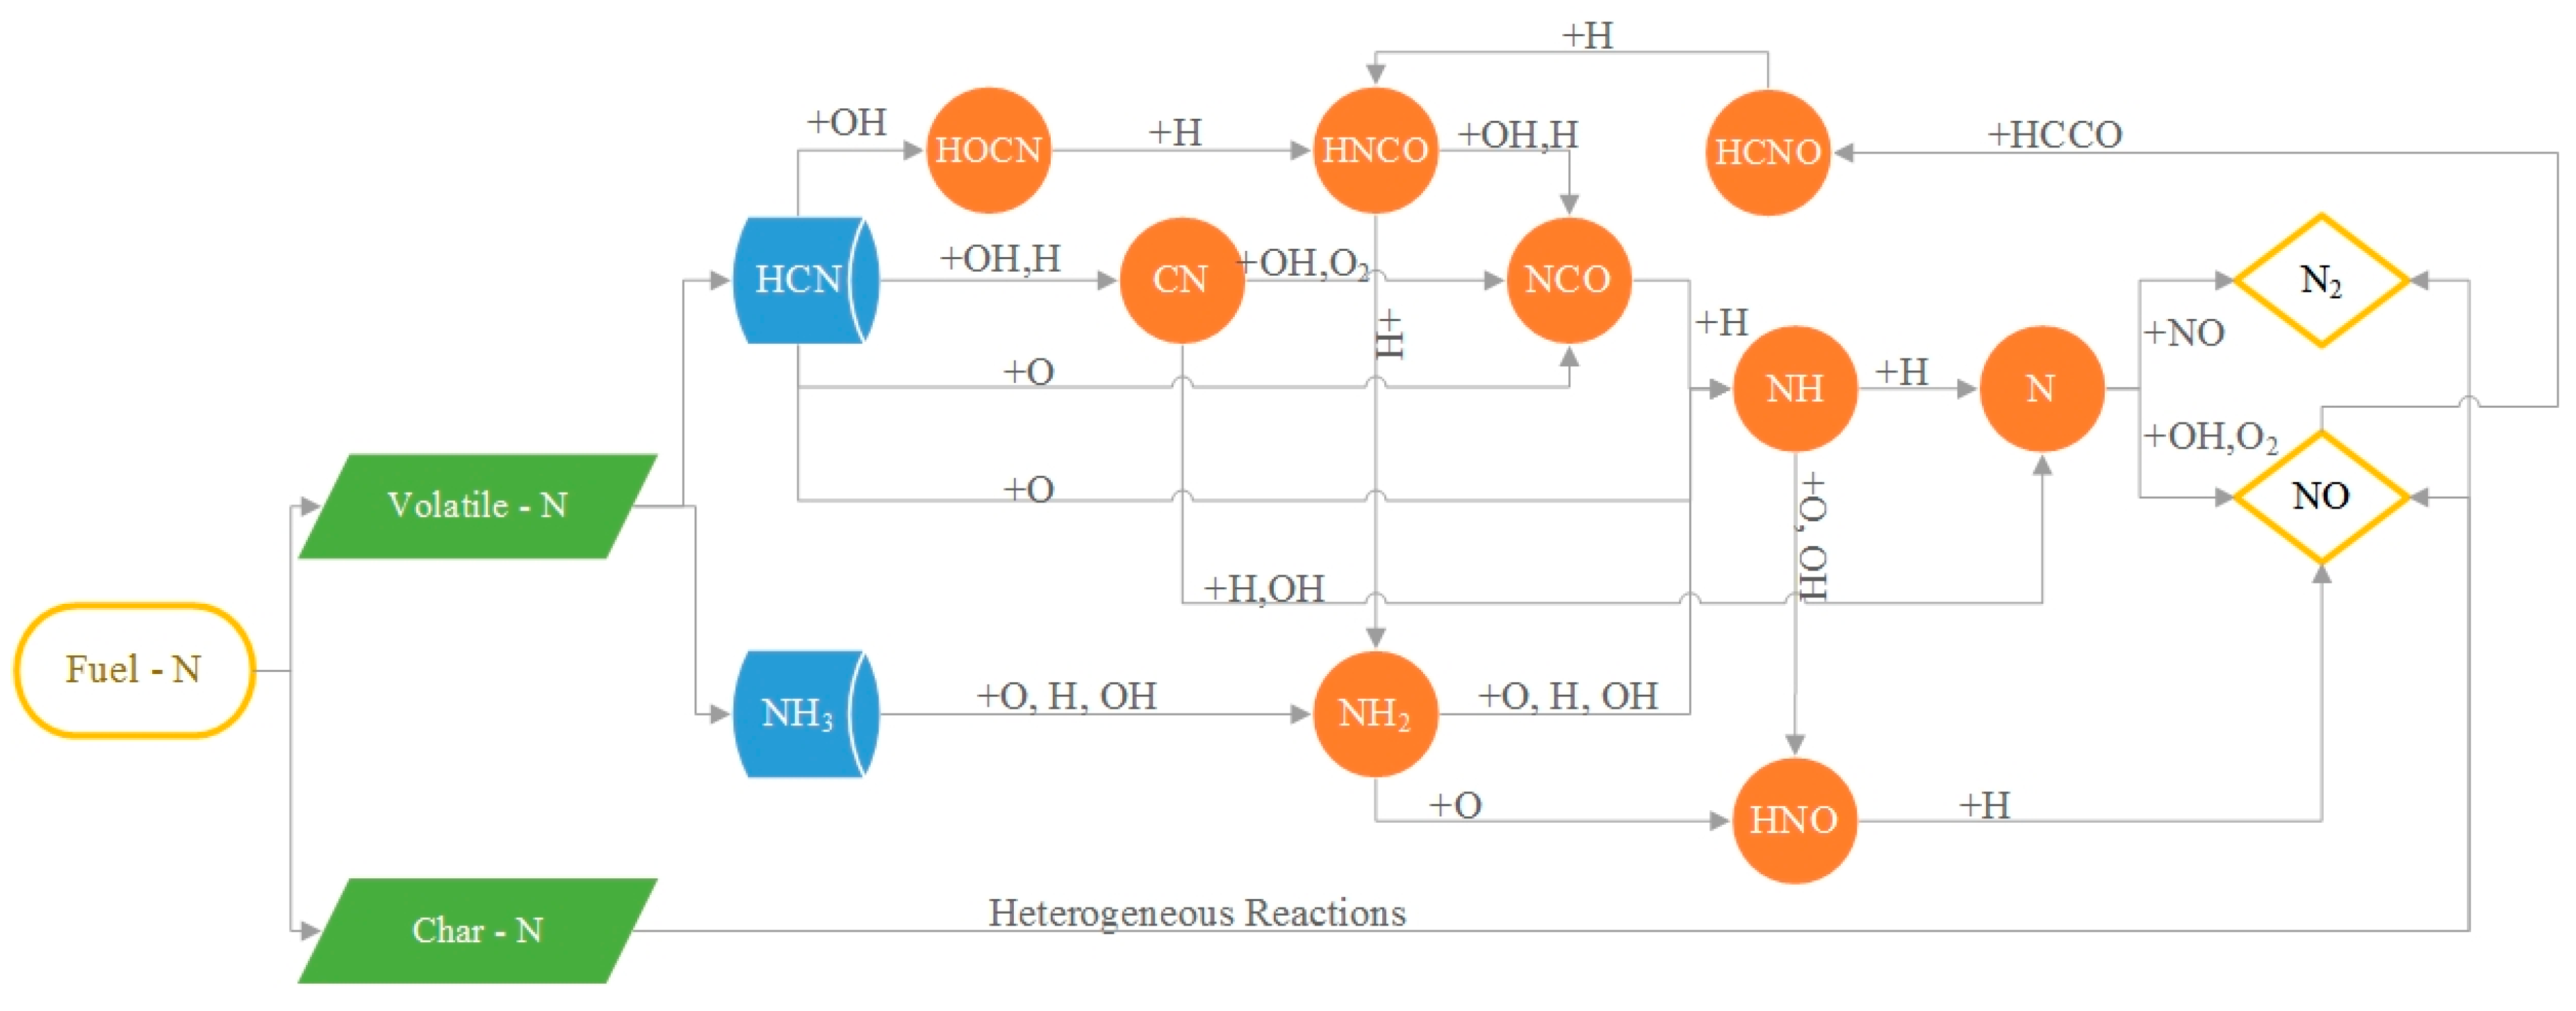
Fuel–NOx is formed from oxidation of fuel nitrogen within the fuel matrix [47]. It may evolve as volatile nitrogen or may remain in the char [48]. NO formed from fuel inherent nitrogen can be greatly influenced by its distribution in the volatiles and char of fuel matrix [49]. Fuel NOx formation through char nitrogen undergoes heterogeneous reactions due to the interaction of formed NOx with the active carbon sites at the surface of char leading to its reduction to elemental nitrogen. Volatile nitrogen after the formation of intermediate species in the form of HCN and NH3 follows various possible routes, due to reactions with H, O, OH radicals to become oxidized, yielding NOx, or it may be reduced to elemental nitrogen. The volatile nitrogen in biomass converts directly to NH3 which may react with char to form HCN (Equation (3)). It worth noting that more NH3 is produced than HCN in biomass combustion [50].
NH3 + CH → HCN
The liberated NH3 and formed HCN from the fuel nitrogen undergo various reaction processes which may result in the formation of NO through oxidation, or may reduce to N2. NOx formation from fuel nitrogen depends on various factors such as residence time, temperature and char particle size. The fate of fuel nitrogen contributing to the formation of NO or N2 is illustrated in Figure 2 (as part of our previous work) [46]; the conversion rate to NO for a maize stalk biomass fuel was considered in the present simulation study.
2.3.2. NO and SO2 Absorption
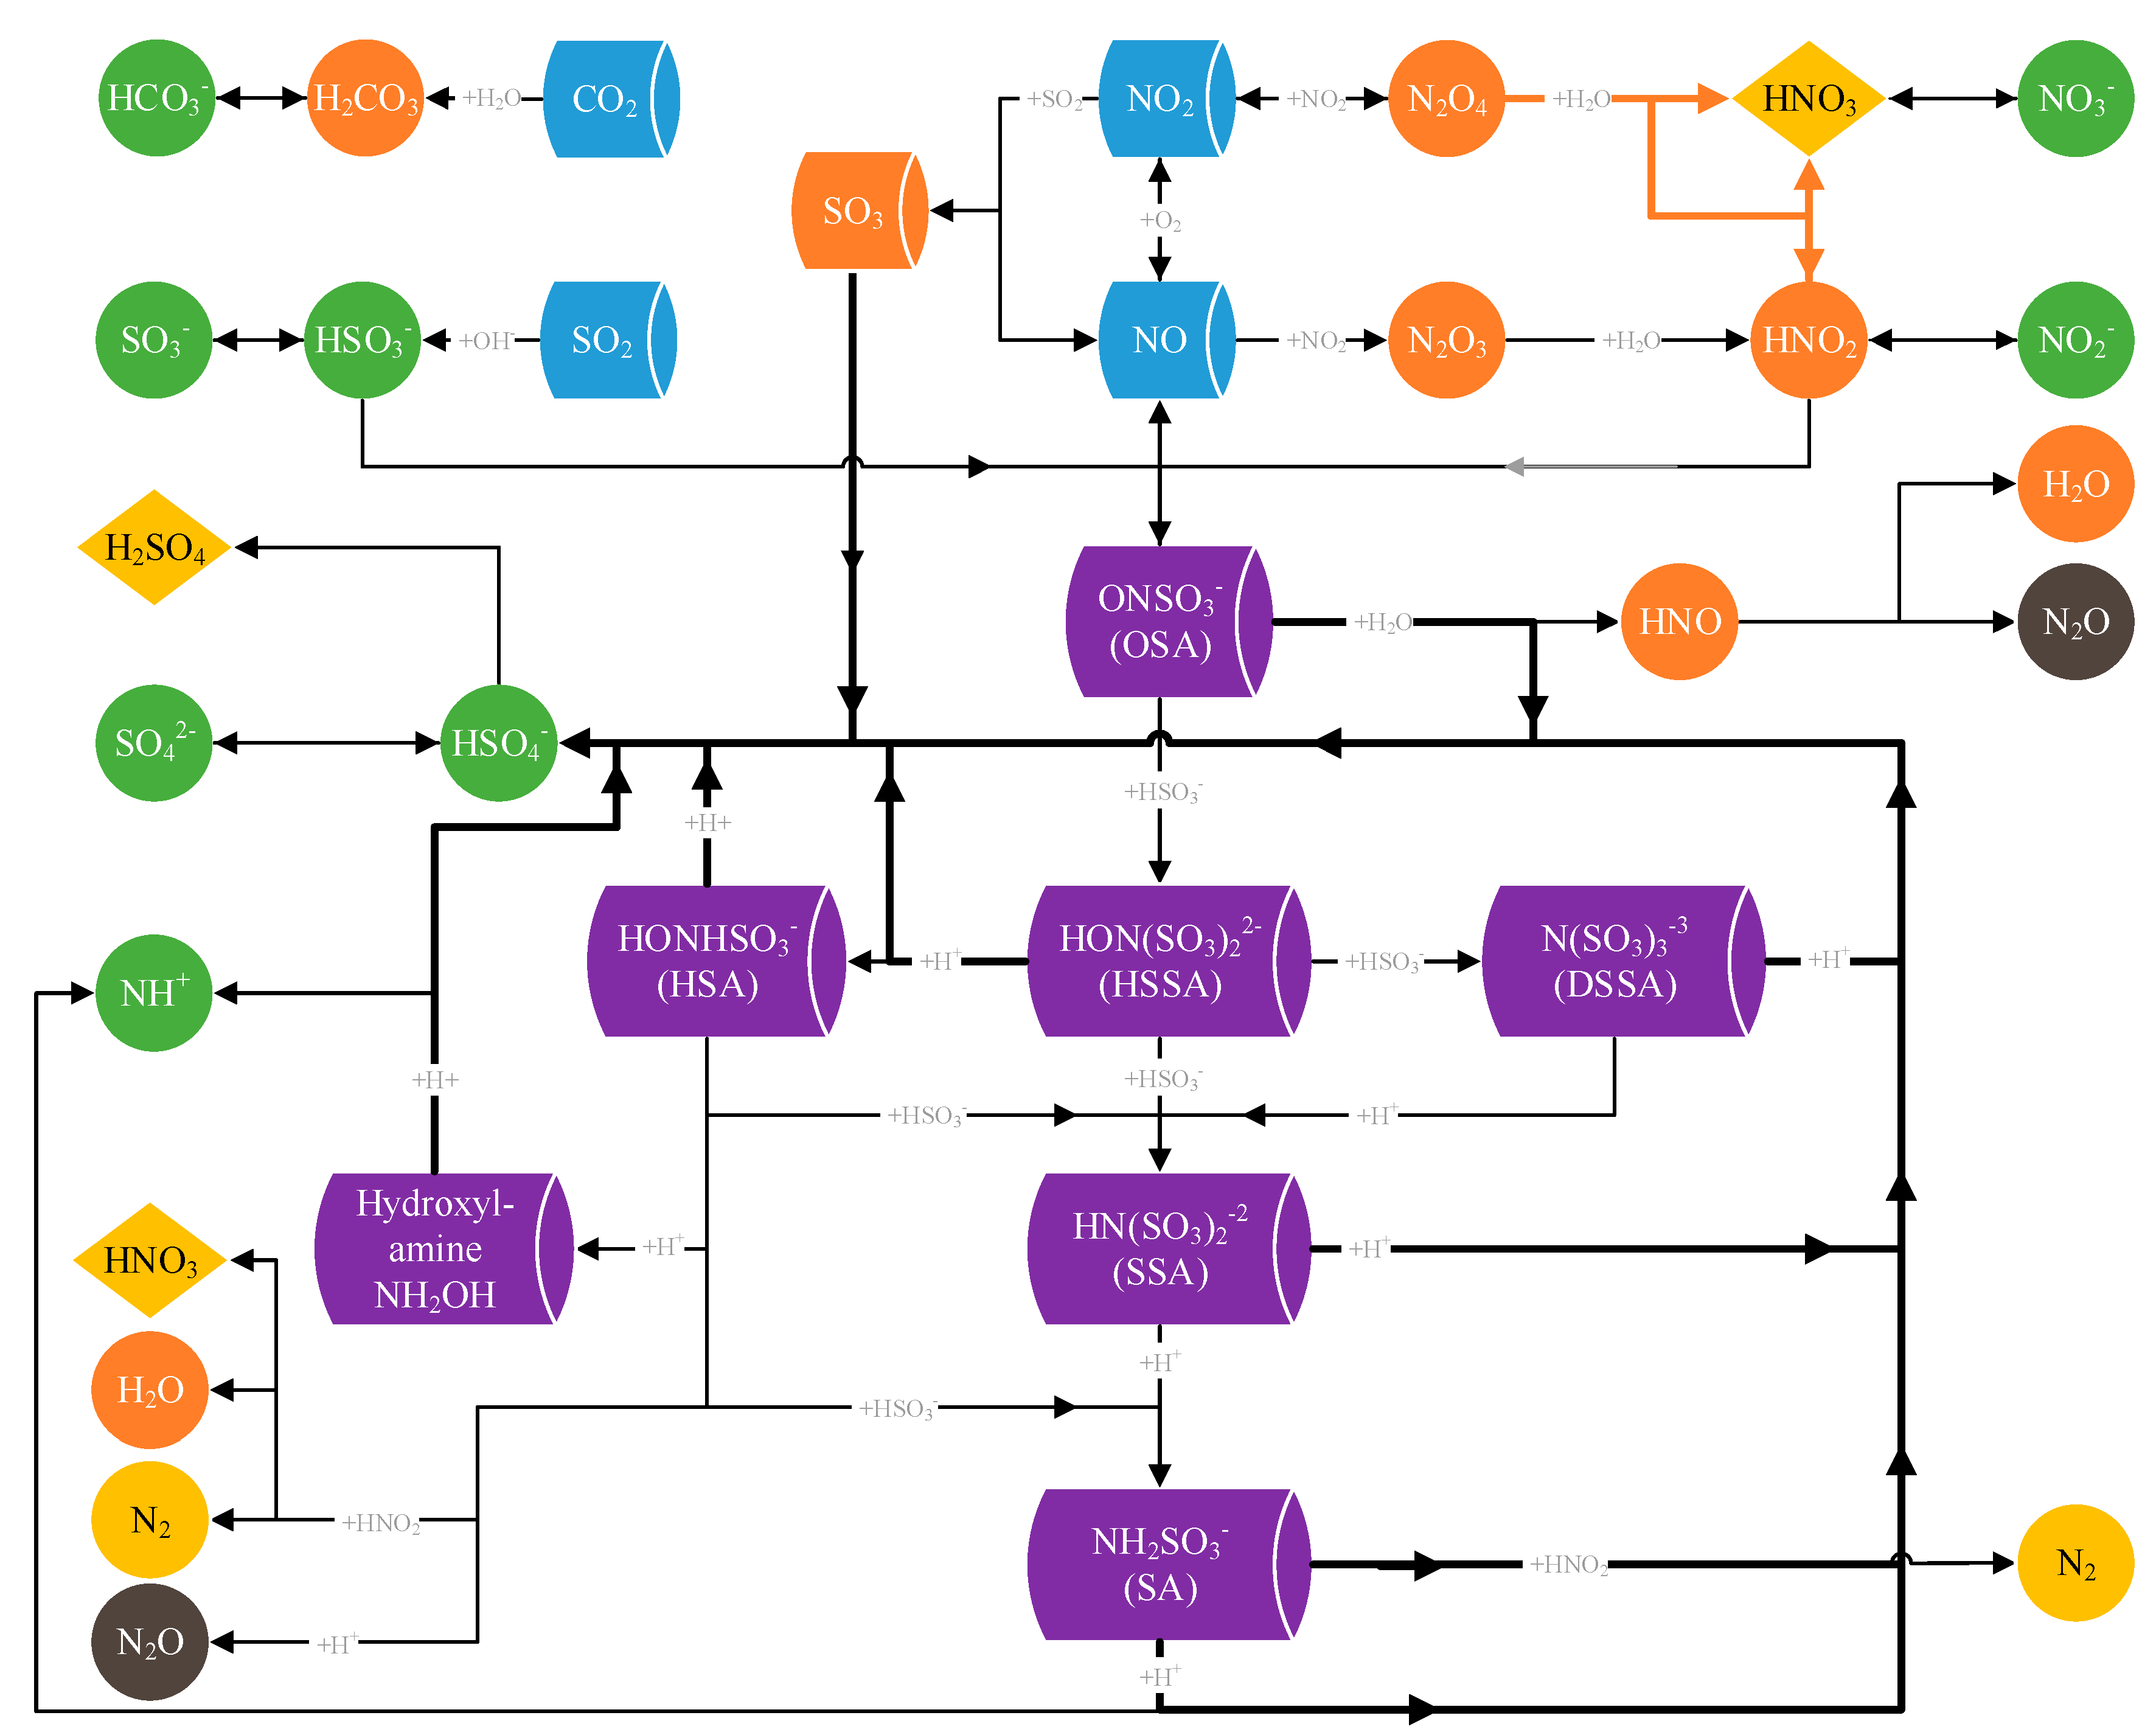
The overall reaction mechanism involving the conversion of NOx and SO2 into several by-products is comprised of a series of binary phase reactions, where the gaseous phase chemistry involves the conversion of NO to NO2 and SO2 to SO3. Major reactions take place in the liquid phase which involve the formation of intermediate N–S complex species during the formation of by-products in forms of N2O, H2SO4, HNO3, and N2. The characteristics of the involved N–S complex species can be derived from the interactions between SO2 and NOx. It involves the formation of Oxo Sulfamic Acid [ONSO3–], Hydroxy (Sulfo) Sulfamic Acid [HON(SO3)2–2], Hydroxy Sulfamic Acid [HONHSO3–], Disulfo Sulfamic Acid [N(SO3)3–3], Sulfo Sulfamic Acid [HN(SO3)2–2], Sulfamic Acid (NH2SO3–), and Hydroxylamine (NH2OH). The reaction scheme is shown in Figure 3.
During the present simulation, the main reactions were integrated with the aim of optimizing the maximum absorption of NOx and SO2 in binary phases. The gas phase chemistry involves the oxidation and hydrolysis of oxides of nitrogen and sulfur. Oxidation of NO into NO2 i.e. Reaction (4) is the governing reaction in the gas phase; it is strongly influenced by pressure.
NO oxidation is favored by low temperatures and high pressures [51]. The reaction is more prominent at elevated pressure, even for shorter reaction times. Maximum conversion to NO2 can be achieved within a shorter residence time due to its greater solubility in water [52]. The rate of the reaction is first order with respect to O2 and second order with respect to NO [51,53].
The formed NO2 is in equilibrium with its dimer N2O4 (Reaction 5). The dimer formation favors by low temperatures [54].
The hydrolysis of N2O4 is the main reaction. N2O4 may be absorbed directly in the liquid phase, yielding nitric acid directly (Reaction 6) or through the intermediate formation of nitrous acid (Reaction 7).
Miller et al. [55] combined these reactions (6) and (7) into a single reaction (8);
The interaction between SO2 and NO2 has been studied extensively by Jaffe et al. [56] and Armitage et al. [57]. Both publications studied experimentally the catalytic oxidation of SO2 in the presence of NO2. The oxidation of SO2 is significant at temperatures higher than 900 °C; thus, at lower temperatures in the PRDC, direct oxidation was not included in the reaction scheme. Rather, NO2, instead of the available O2, reacts as an oxidizer in the conversion of SO2 into SO3 (Reaction 9), and subsequently produces H2SO4 on hydrolysis according to reaction (10).
A detailed kinetic scheme of the involved reactions is illustrated in Table 3.
2.4. System Performance Calculations
2.4.1. Thermal Performance
Thermal efficiency is a direct indication of fuel resource conservation and emission reduction. In the present work, an indirect method to determine the boiler efficiency when ASME (American Society of Mechanical Engineers) standards are used was included in the first part of simulation. All the system and process losses were first taken into consideration, and the difference between the cumulative losses and the energy input was taken as the boiler efficiency. The losses include dry flue gas exiting the boiler (), moisture produced due to oxidation of H2 plus evaporation of moisture content of the fuel (), unburnt combustibles in the form of CO (), unburnt losses and fly and bottom ashes (), and radiation and convection losses (). These losses were calculated using a set of empirical equations, as shown in Equations (11)–(14);
where
where
The efficiency of the boiler was determined using Equation (15).
2.4.2. Conversion Performance
The abatement efficiency of the effluents, i.e., NO and SO2, is a direct indication of the CO2 purification, since these effluents settle in the distillation unit in acidic forms and are separated as the acidic condensate product of the reactive column, whereas the purified CO2 stream leaves as vapor product of the reactive column. During simulation, the NOx and SO2 removal efficiencies were calculated using Equations (16) and (17) respectively;
where [NOs]in, [NO]out, [SO2]in, [SO2]out are the NO and SO2 concentrations (in mole fraction) at inlet and outlet of PRDC (RadFrac).
3. Results and Discussion
Various parameters of the present simulation study have been evaluated regarding the subsequent combustion of maize stalk biomass under an oxy atmosphere with flue gas recirculation and the treatment of flue gas channel drawn out for pressurized reactive distillation column (PRDC). The results of the oxy biomass thermal system are comprised of thermal performance and evaluation of losses incurred during the combustion process. In addition, the heating and cooling curves of the boiler are evaluated and presented. As an important part of the present study is to optimize the extent of CO2 purification through the subsequent conversion of NOx and SO2 into their respective by-products through PRDC, the variable factors relevant to the specific operation of distillation column were analyzed and the respective results are described in detail. The ratio of liquid to gaseous feed stream, rate of bottom product recycling, ratio of holdup of the feed streams at the distillation column are important factors affecting the operation of the PRDC. These factors can play key roles in meeting the objectives of achieving oxy biomass–CCS. The results are described below:
3.1. Oxy Biomass based Thermal System
3.1.1. Thermal Efficiency
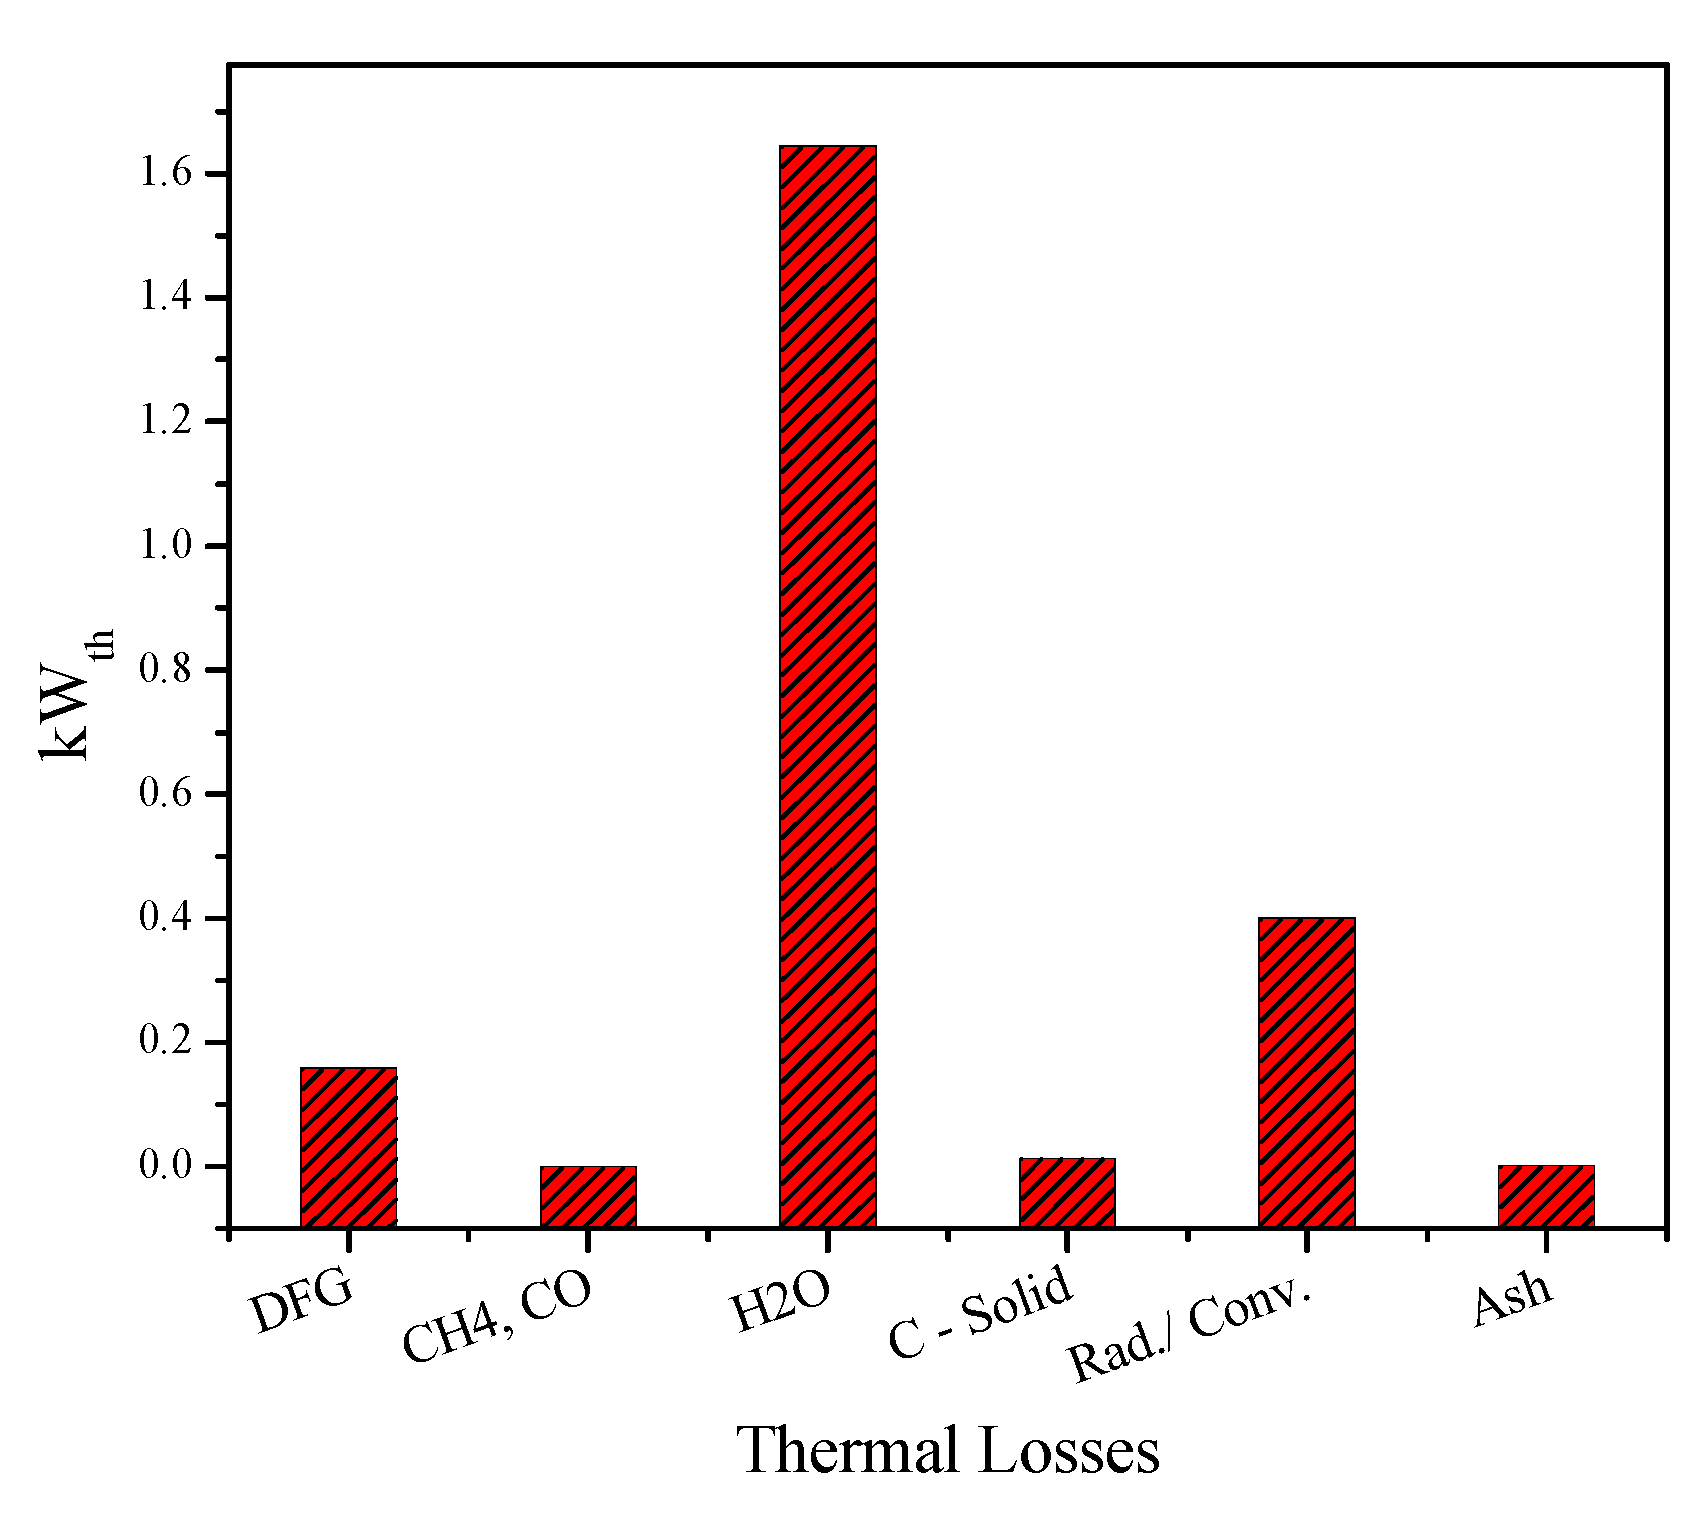
The losses occurring in the boiler vary widely due to boiler design and operational modes. Biomass fuels have their distinguished primary characteristics in terms of elemental or proximate analysis. In the present scenario, maize stalk comprises a higher ratio of H2O and H2 in its fuel matrix. The inherent moisture evaporates during the combustion process and accompanies the flue gas. Hydrogen contained in the biomass fuel matrix is excessively oxidized, forming H2O, which is added into the already evaporated moisture content in the flue gas. Considering Equation (13) regarding losses due to H2O formation, it gives a clear overview of an inverse relationship between the concerned losses and the calorific value of the biomass. Alternatively, the thermal performance of the boiler is adversely influenced by the higher moisture contents of the flue gas. The major losses in the present study are those due to moisture formation in the flue gas, accounting for 74.12% (1.64 kWth) of the total thermal losses. The detailed losses are plotted in Figure 4.
On the other hand, the radiation and convection losses rely mainly upon the design and structure of thermal boiler. In the present study, it was kept at constant value. Other incorporated losses include dry flue gas leaving the boiler through a vent fan, which accounts for 7.17% (0.16 kWth). The unburnt organic material left behind in the ash portion of the fuel, and the subsequent formation of CH4 and CO, contribute to the increase in losses which lowers the thermal efficiency of the boiler. During actual boiler operation, the flue gas heat losses calculated are based on the flowrate, temperature and composition of flue gas; Dias et al., 2004, among others, studied conventional combustion in a biomass boiler and obtained thermal efficiencies of up to 77% [7]. Under an oxy atmosphere in the present study, the thermal efficiency was shown to be 88.91%, which is comparatively under oxy conditions compared to the referenced conventional condition.
In order to address the extent of GHGs and pollutant reduction in the boiler, it is important to have a comparative overview of oxy and conventional combustion techniques. The main difference lies in the oxidizer atmosphere, where the nitrogen of the air acts as a diluent during the conventional combustion process. In the case of oxy the combustion technique, nitrogen is replaced by recycled flue gas, whereas pure oxygen is required as the main oxidizer. The pure oxygen (up to 95%) is usually obtained through a cryogenic air separation process which splits air into its components. To make CO2 capture viable, it will be necessary to enhance its formation, which is carried out by recycling the produced flue gas as a result of combustion under an oxy atmosphere. The average flue gas composition of both the combustion systems is illustrated in Table 4:
It can be inferred through Table 4 that the resultant flue gas during conventional combustion is enriched mainly with N2, whereas CO2 is prevalent in cases of oxy combustion. The corresponding SO2 and NOx results can be justified with similar results to those observed by Shao et al., 2013 [60], where adequate NOx and SO2 emission reductions were observed by changing the conventional air to oxy combustion atmospheres. Li et al., 2013 [61], considering the internal flue gas recirculation in a co-firing boiler, observed the same phenomenon of lower NOx and SO2 emissions in oxy atmosphere compared to the corresponding conventional one. Through flue gas recycling, NOx can be highly reduced due to char nitrogen reacting with the produced NOx [62].
Usually, CO2 formation in conventional air combustion accounts for around 16% of the total flue gas; the rest of the flue gas is composed of N2. This order is different in case of oxy air combustion, where the exhaust stream is mainly composed of 80–95% CO2. CO2, having different thermal and chemical characteristics and being denser than nitrogen in the air, impacts on the overall process. Consequently, heat accumulation and reclamation due to recycling is advantageous for the efficiency of the process.
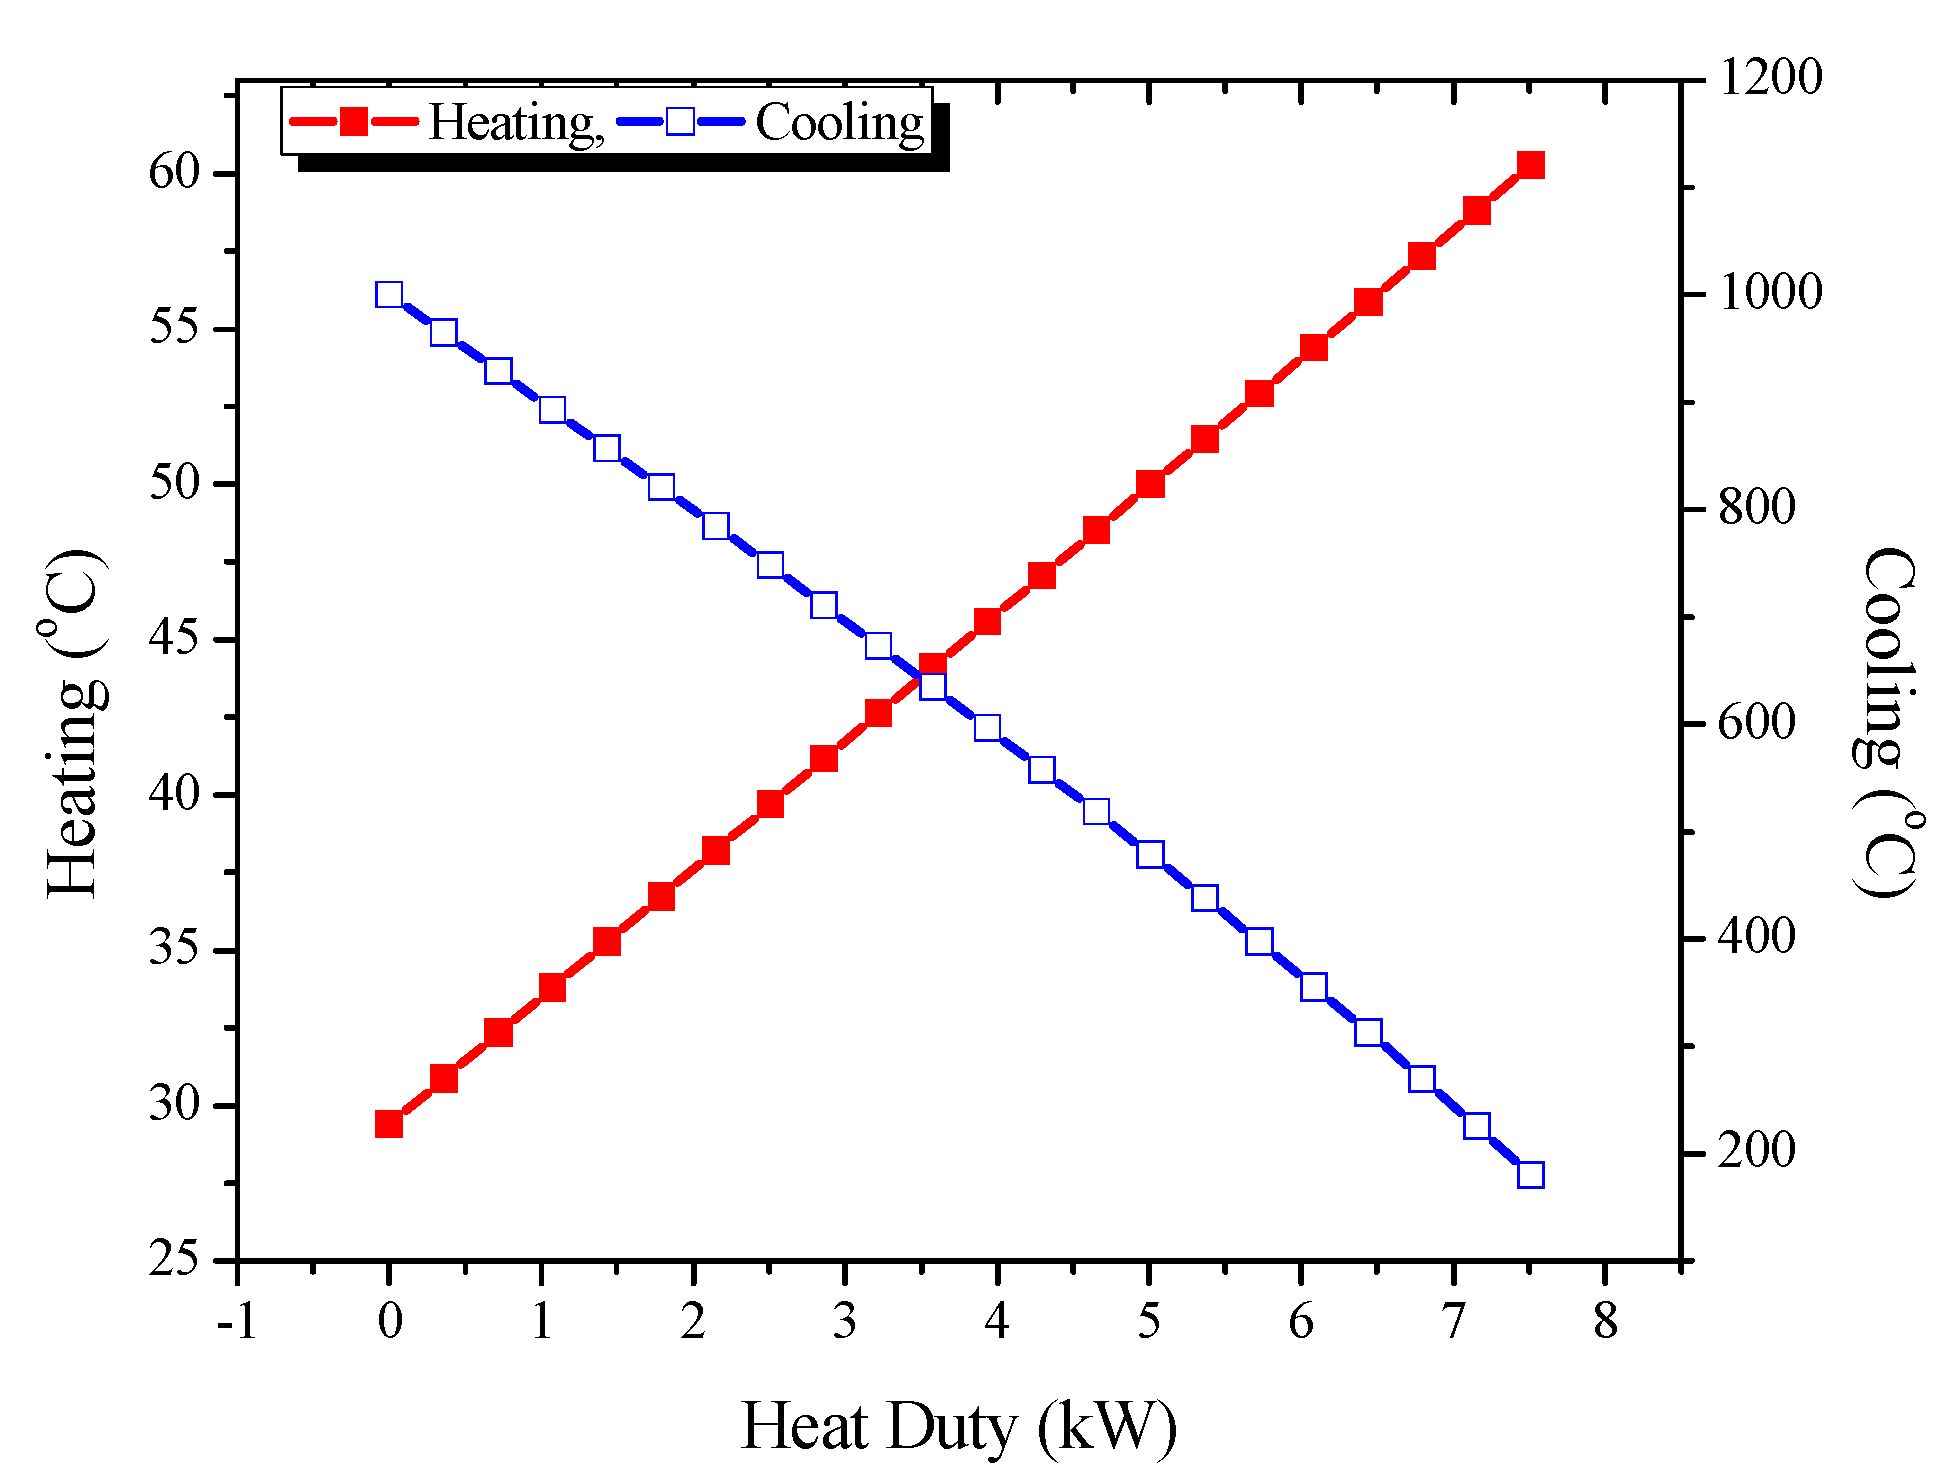
3.1.2. Heating/Cooling Curves of Heat Exchangers
The heating rates of the heat exchanger are a function of the varying temperature with the passage of time. The heating curve obtained through the operation of the heat exchanger is considered a measure of heat exchanger’s effectiveness. Due to the steady state simulation, the time factor was not included in the present study. However, heat duties (kW) of the boiler heat exchanger model were calculated, corresponding to the change in temperatures of both the cold and hot streams. The curves obtained by heat transfer in the heat exchanger with gradual variations in the hot and cold side temperatures is illustrated in Figure 5.
Heat given by hot stream through a step change in temperature is transferred to heat the cool stream. Flue gases exiting RStoic model were adjusted at 1000 °C; they were then allowed to cool to below 200 °C in the boiler model. Heat duty generated during cooling process of the flue gas in the heat exchanger was used to raise the temperature of the cool water stream from ambient temperatures to around 60 °C.
3.2. Pressurized Reactive Distillation Column (PRDC)
In order to achieve the maximum conversion rates of SO2 and NOx for the purification of CO2 and consequent formation of by-products (H2SO4 and HNO3 etc.) during the pressurized reactive distillation column (PRDC) process, the effects of the various parameters such as fuel inherent nitrogen conversion rate and the variable factors affecting PRDC process have been analyzed. The results obtained through sensitivity analysis of the involved factors were in agreement with the relevant results obtained by referenced researchers.
3.2.1. Effect of Conversion Rate of Fuel Inherent Nitrogen on Rate of Conversion
In the case of oxy combustion, where nitrogen in air is replaced by a pure oxygen stream, the NOx formation is sourced by fuel nitrogen only. The conversion mechanism of fuel nitrogen into NOx or elemental nitrogen (N2) depends on many factors, such as the fuel characteristics, devolatilization conditions and combustion mode on the selectivity of oxidation toward NOx formation or reduction towards elemental nitrogen [63]. One of the factors is the surrounding atmosphere of the burning fuel particles, which dictates the fate of fuel inherent nitrogen [47]. Accordingly, the formation of intermediate species such as NH3 and HCN does not quantify the ratio of NOx produced to elemental nitrogen in flue gas. Analyzing the fuel inherent nitrogen conversion into NOx and extending it further to PRDC gives an good idea of achieving the enhanced conversion efficiency at comparatively higher concentrations of NOx in the flue gas.
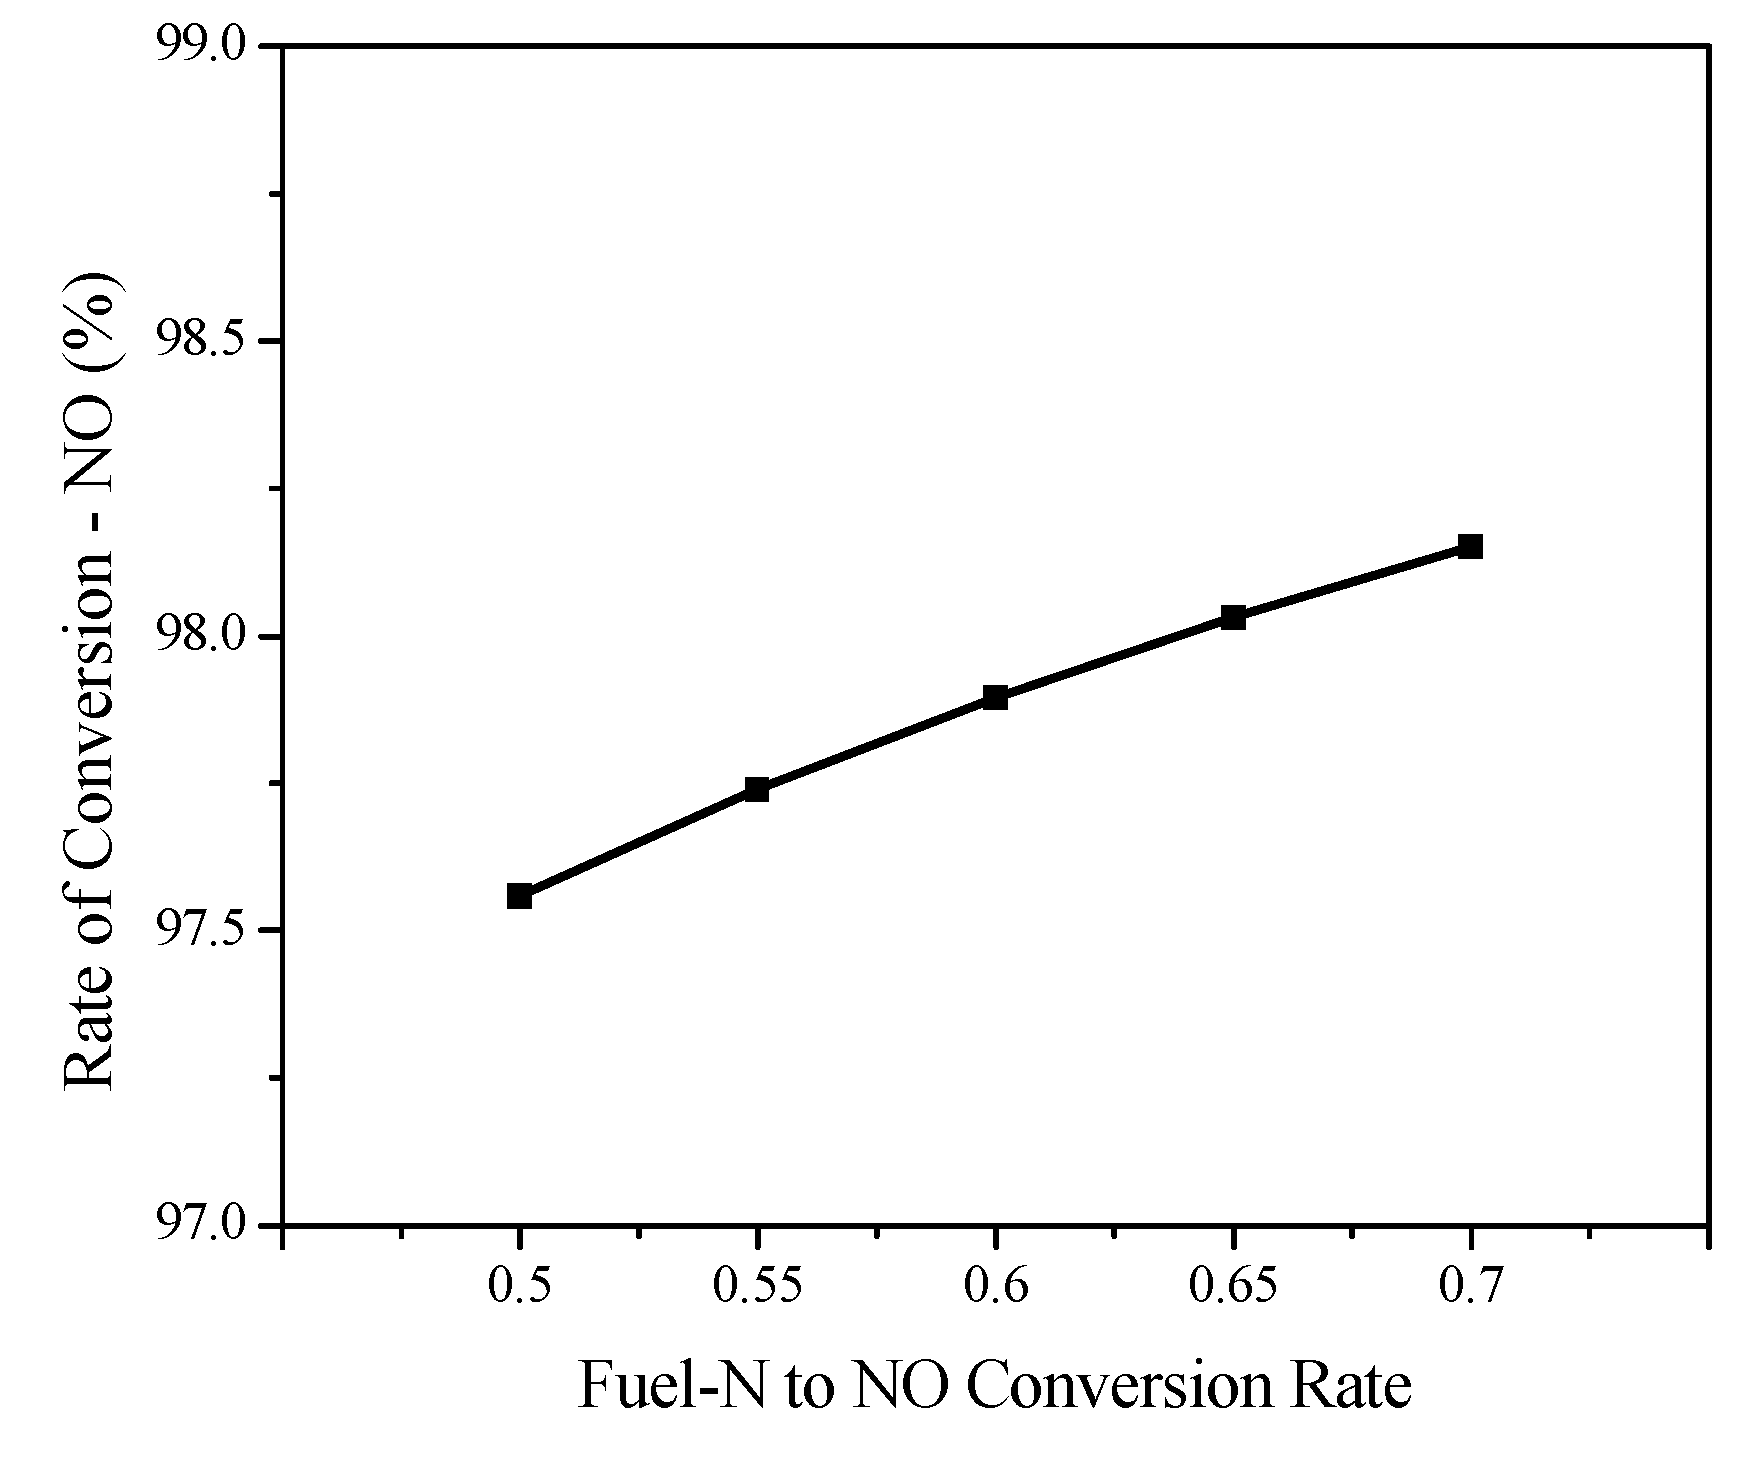
As explained in the simulation model, the mechanism of nitrogen distribution into NOx and N2 was integrated into Aspen by varying the conversion rates based on our similar experimental work [47]. During the present simulation study, various ratios of NO to elemental N2 were assigned to quantify the subsequent conversion of NO into HNO3 in the reactive distillation column. The results, as illustrated in Figure 6, show that through enhancing the Fuel-N conversion rate to NO accelerated the absorption of NO into PRDC, a similarly higher ratio of HNO3 as a by-product of the PRDC process is obtained. Although higher NOx formation is not considered favorable due to its atmospheric deterioration characteristics, in order to achieve the purification of CO2 simultaneously with HNO3 production as the bottom product, higher concentrations do not adversely affect the conversion in the PRDC process.
3.2.2. Effect of Liquid/Gaseous Feed Ratio on Rate of Conversion
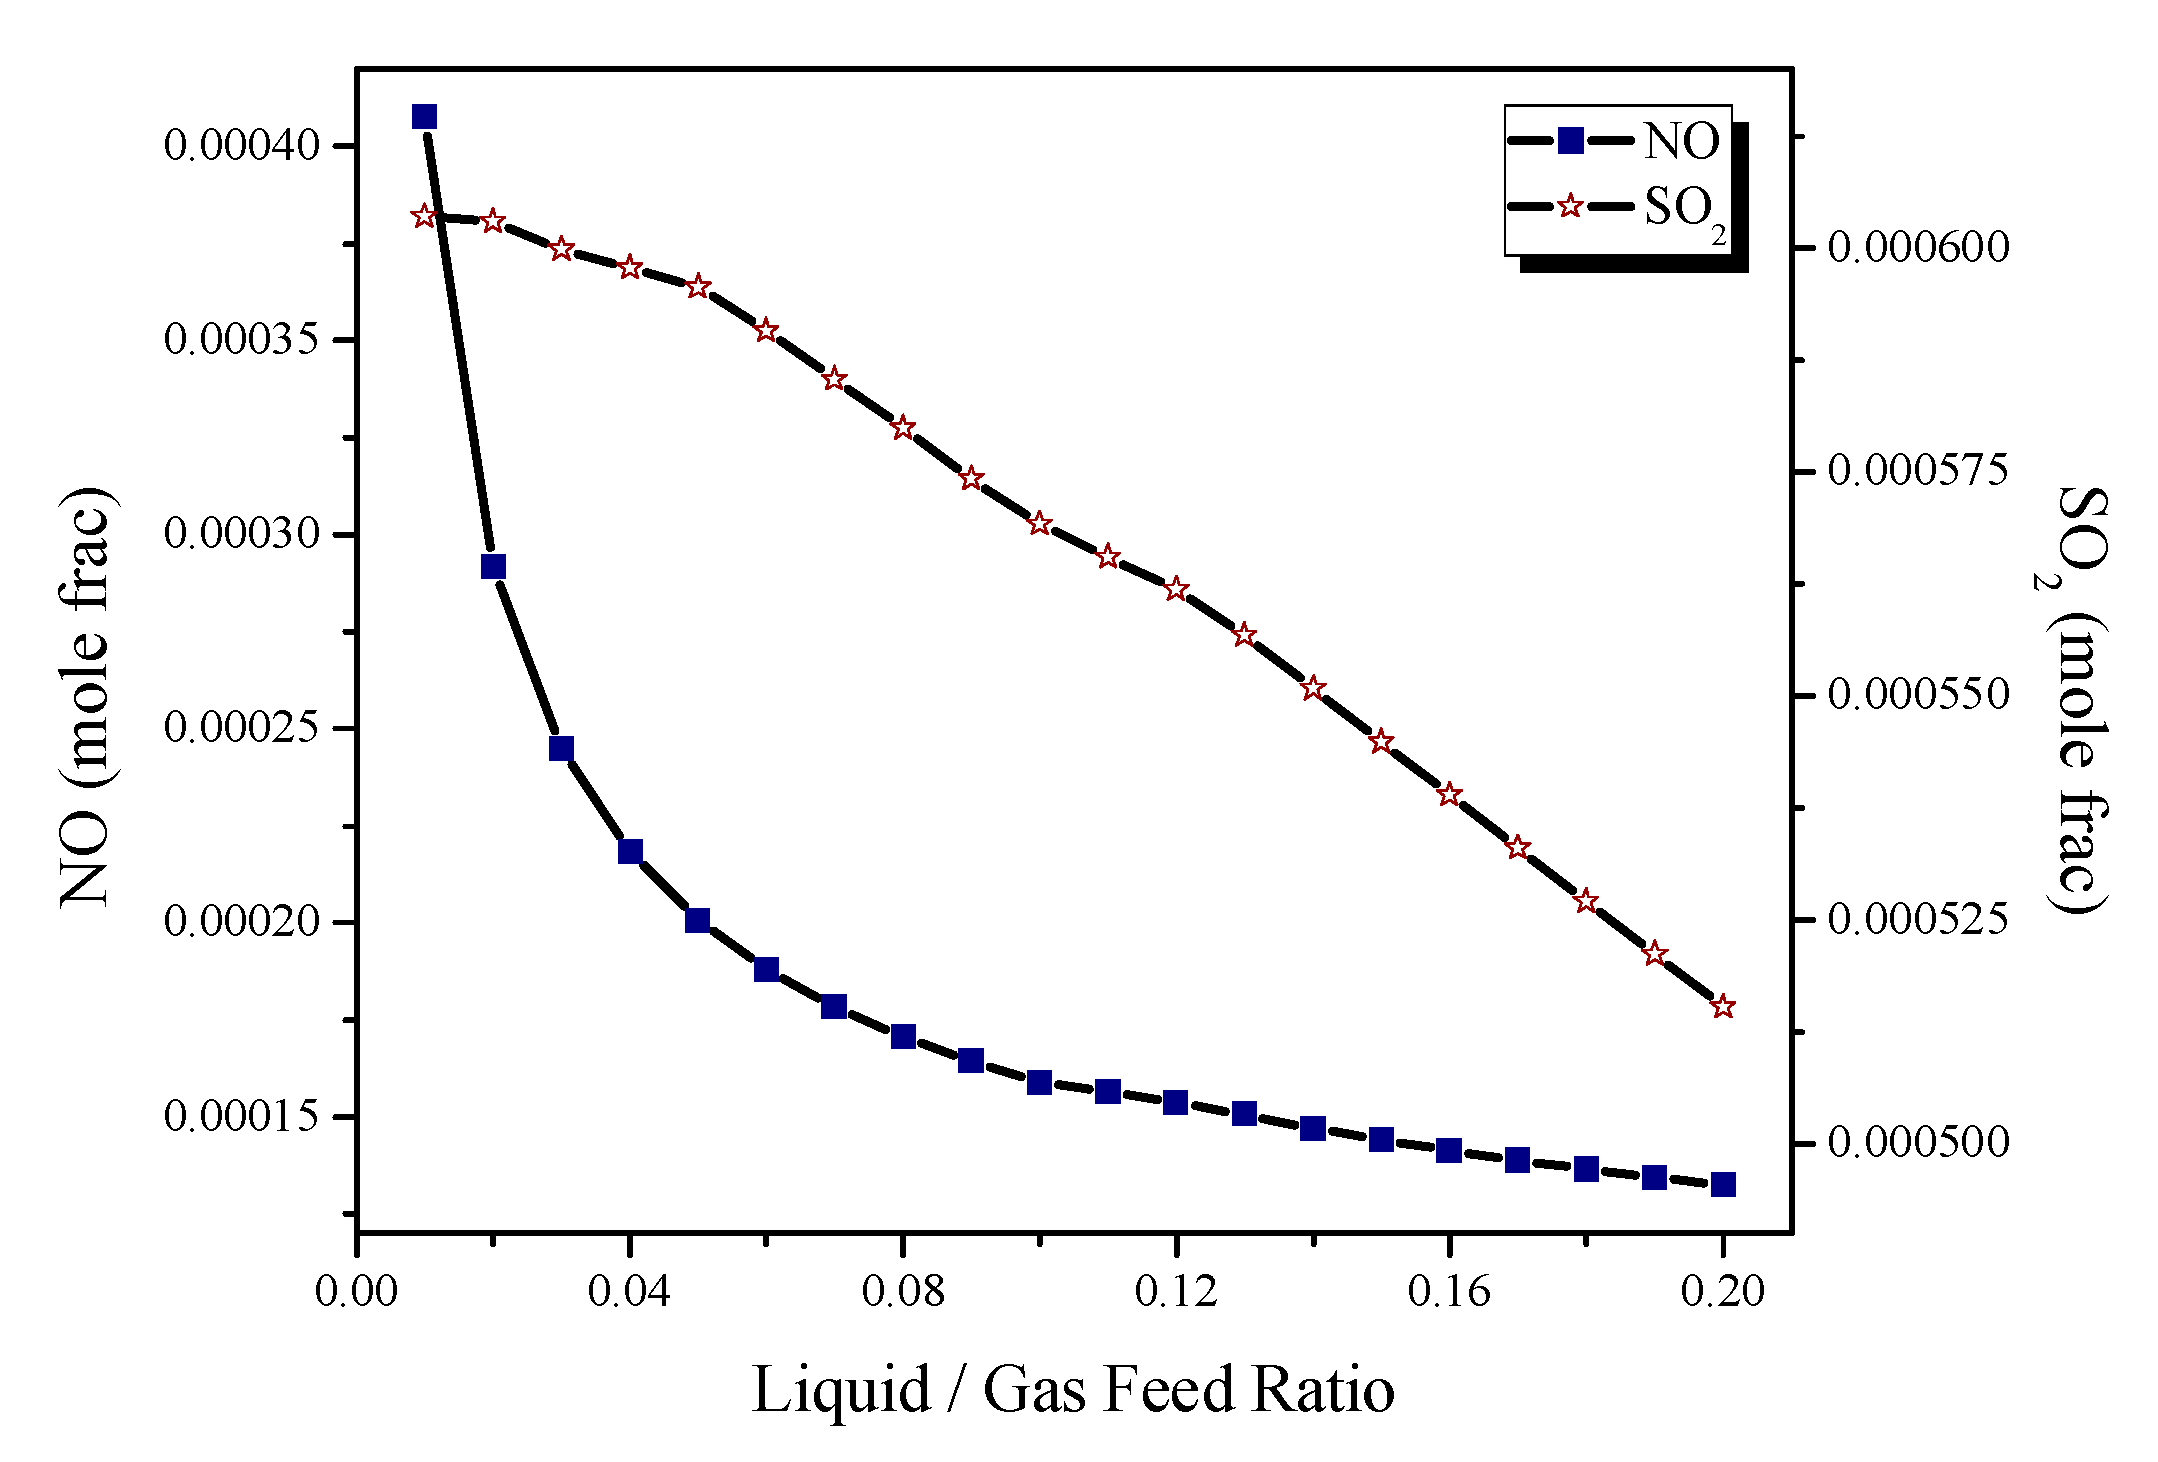
Large scale usage of water in the industries has created shortages of drinking water. Based on this fact, the moisture content leaving the boiler with flue gas after condensing and flashing out from the gas stream was used as a liquid feed for the present simulation study. Keeping in view the optimum level of liquid required to achieve maximum reactive distillation, a series of liquid feed to gaseous feed ratios was established, and its effects on NO and SO2 reduction were observed, as shown in Figure 7. From Figure 7, the mole fraction of NO and SO2 are shown to decline with increases in the ratio of liquid to gaseous feed rate. Although the mole fractions of NO and SO2 are decreasing with the liquid to gaseous feed ratio, the decrease in the mole fraction of SO2 is more prominent, showing a linear decrease, whereas NO fraction decreases sharply in the lower liquid to gas feed ratio due to a faster absorption reaction compared to the corresponding higher ratios.
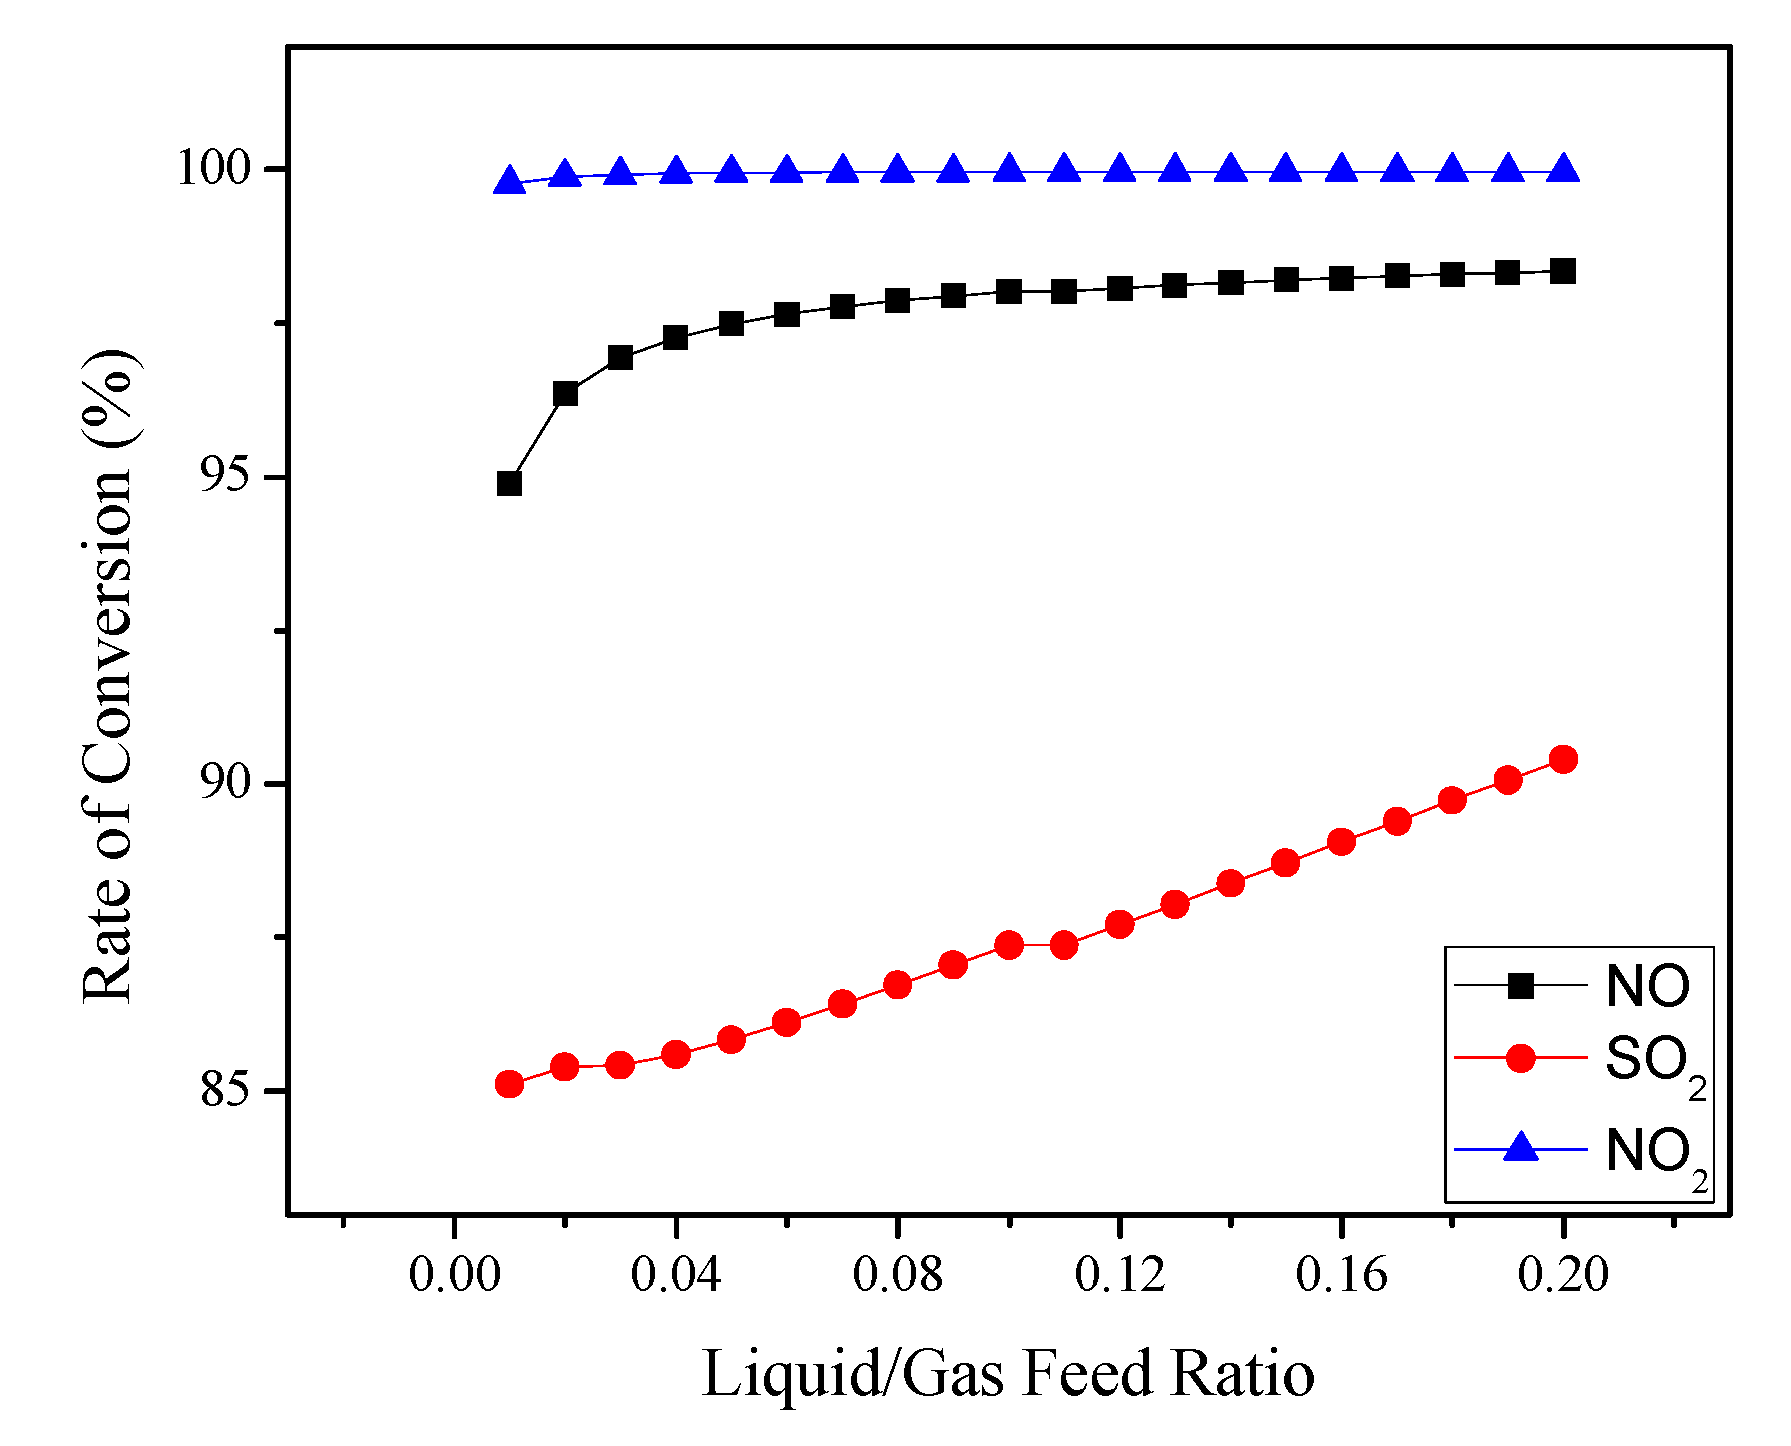
The maximum removal efficiencies of NO and SO2 have been achieved at higher liquid to gaseous feed ratios due to the availability of more moisture in the liquid phase, as shown in Figure 8. A higher moisture content gives rise to more surface area for absorption of the acidic gases; however, on an industrial scale, limiting the level of moisture required for maximum reactive distillation is more economical and favorable, as keeping the liquid to gaseous feed ratio at its optimum level is necessary to achieve maximum CO2 purification.
On the other hand, through focusing on the bottom (liquid) products, satisfactory results validating the conversion of NO and SO2 into their respective acidic forms were achieved. The mole fractions of H2SO4 and HNO3 in the bottom products were plotted with an increasing trend of liquid to gaseous feed ratio, as displayed in Figure 9, in which a linear decline in the molar concentrations of HNO3 and H2SO4 occurs, which, by contrast, is a direct indication of abatement of NOx and SO2 from the flue gas stream, thus allowing CO2-enriched stream to be purified.
3.2.3. Effect of Column Holdup on Rate of Conversion
Liquid holdup is one of the most important hydrodynamic parameters in characterizing the vapor/liquid flow configuration in the structured distillation columns [64]. The column performance is influenced by holding up a certain percentage of the total feed streams by keeping the recycle ratio, liquid to gaseous feed ratio, column pressure and temperature at constant levels. Holdup is the ratio of feed volume kept in the bed compared to the total volume of column occupied by the packing material. It is influenced by the feed flow rate, viscosity and density of the working medium. The effect of holdup on the column performance could be positive or negative. In the present study, liquid feed holdup showed effects on the column performance in terms of reduction of NOx and SO2. The vapor holdup did not show any effect on the column performance. The obtained results of liquid feed holdup show the effects of increasing rate of holdup on NOx and SO2 removal efficiency from the flue gas. Figure 10 illustrates the holdup rate profile on variations of the mole fraction values of NO and SO2, which are declining with an increasing holdup ratio (%). NO reduction is more prominent at a lower rate of holdup, whereas SO2 saw a linear decline along the holdup ratio. It may be concluded that the conversion of SO2 to H2SO4 could be enhanced with gradual holdup increments. The sudden change in the mole fraction of NO and SO2 at lower holdup rates was observed by Mujtaba et al., 1998 [65], where a relative easy distillation was observed at the start of the batch process at lower holdup ratios.
The column performance in terms of NOx and SO2 conversion efficiencies (%) is presented in Figure 11, where NO at a much higher level of removal efficiency is affected a little as compared to SO2. The rate of liquid feed holdup is seen to be more favorable to the conversion of NO to HNO3 at lower rates, till a certain holdup rate i.e. 20% occurs, at which time there is no prominent effect on NO conversion. SO2 conversion to H2SO4 is enhanced at an average rate of 0.02% on every 6% increment of holdup, attaining a maximum efficiency of 75% at 40% holdup. SO2 removal efficiency is enhanced at a faster rate than NO under the similar trend of liquid feed holdup ratio. Meanwhile, there is no visible negative effect on the NO2 removal performance by holdup ratio. Iloeje et al. 2015 [66] observed there inverse relationship between NOx concentration in flue gas stream and holdup volume per stage of a single column absorber. The present simulation result shows good agreement with the modeling studies conducted by Iloeje et al., in such a way that lower NOx concentrations are observed at higher holdup rates. In contrast to NOx behavior, the SOx concentration shows the opposite trend. The reason for this behavior depends on the selectivity of the conversion rate of NOx over SO2, such as NO after oxidation to NO2 acting as the oxidizing agent for the oxidation of SO2 to form SO3, as shown in reaction (4) and reaction (9). Therefore, the NOx concentration is reduced first among the holdup rates, which results in an increase of SO2 concentration (as shown in Figure 10); however, the conversion rate of SO2 to H2SO4 becomes constant at 85% after 20% of liquid holdup is attained (Figure 11).
It can be concluded that based on the reaction mechanism involved during the PRDC process, a mild liquid holdup ratio on one side may enhance the conversion rate of NOx into HNO3, while on the other hand, it may lower the conversion rate of SO2 into H2SO4. In order to balance the formation of both by-products, a value of 10% for holdup was taken for the present simulation study.
3.2.4. Effect of Recycling Rate of Column’s Bottom on Rate of Conversion
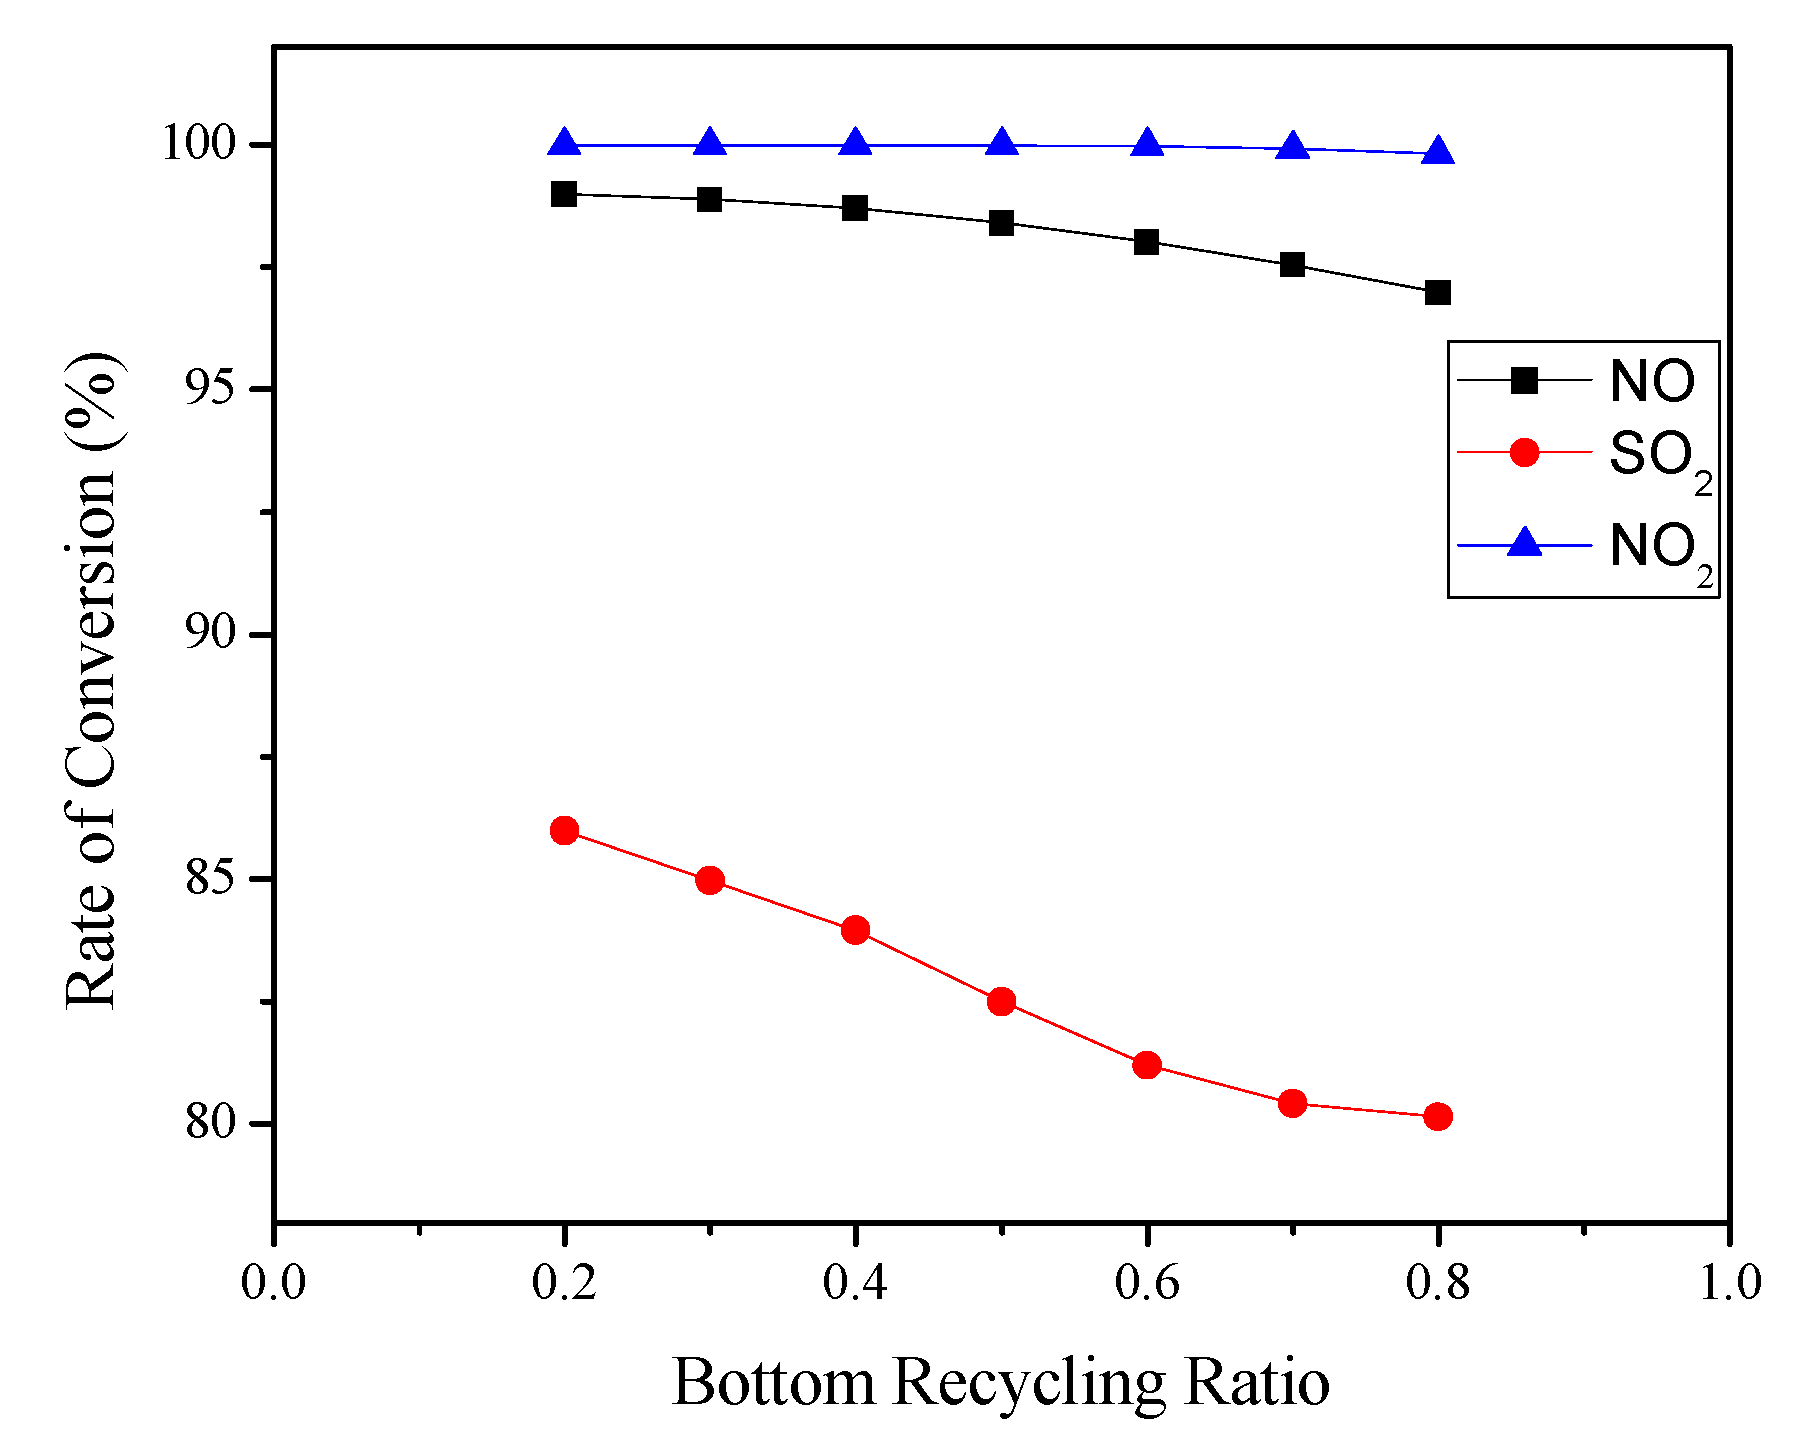
The bottom recycling in the pressurized reactive distillation column (PRDC) influences the performance of the PRDC process by altering the composition of liquid stream in the reactive distillation column. In the present scenario, the rate of bottom recycling tends to raise the mole fraction of NOx and SO2 in the reactive column’s gaseous (top) product, as illustrated in Figure 12. It shows the adverse impact of bottom recycling on CO2 purification, as it will reduce the conversion of effluents, i.e., NOx and SO2 to HNO3 and H2SO4, and consequently, will enhance the mole fraction of these effluents in the gaseous product stream.
Modeling work done by Iloeje et al. 2015 [66] supports the present trend of increased NOx concentrations along with enhancing the bottom recycle fraction.
From Figure 13, it is inferred that even though SO2 conversion is at a lower level than NO, its variation in rate of conversion is more influenced by enhancing the bottom recycle ratio than NO. The SO2 conversion rate is seen to reduce at an average rate of 1% on enhancing the recycling ratio of 0.1, whereas the NO conversion rate is reduced at a comparatively lower pace that is a 0.333% average decrease on enhancing the recycling ratio of 0.1.
This further elaborates the reaction scheme implemented in the PRDC process, where the rate of H2SO4 yield was shown to be 1/3 times less than the corresponding yield of HNO3 by keeping bottom recycling rate at 0.2. At this rate of bottom recycling, around 99% of NO is converted to HNO3 and 86% of SO2 is converted to H2SO4. It is worth noting that NO2 in the aforementioned sensitivity studies has not shown any visible changes in its concentration; such behavior illustrates that the studied parameters did not have a prominent effect on the NO2 characteristics.
4. Conclusions
A simulation-based study of oxy biomass combustion using maize stalk as the primary fuel for the boiler with flue gas recirculation was conducted with the main objectives of determining the thermal performance of the boiler and the optimization of CO2-enriched flue gas cleaning up process for CCS. The unique characteristics of the proposed system included fuel inherent nitrogen conversion to NOx and the use of flushed out condensate water as the liquid feed for the CCS system, which can be considered as the novelty of the prescribed system. An indirect method of determining the thermal efficiency was adopted which resulted in 88.91% efficiency of the proposed 20 kWth biomass boiler. On further pursuance, NO concentration in flue gas enriched with CO2 was treated through pressurized the reactive distillation column (PRDC) process, where up to 98.05% NO and 87.42% SO2 were converted into valuable by-products including HNO3 and H2SO4, respectively Sensitivity analysis through varying the factors of liquid to gas ratio, holdup ratio and bottom recycle ratio were performed. Around four kilograms per hour of CO2 with 94.13% purity was achieved by optimizing the simulation system with variable parameters. The total gas stream leaving the reactive distillation column comprised 3.47% O2, 1.57% N2 and 0.83% H2O along with 94.13% CO2. After separation of moisture through cooling and condensing the mix stream, the pure CO2 can be available to transport for storage under saline aquifers or for use in enhanced oil recovery operations.
However, certain economic factors, such as retrofitting of the existing boilers to make them suitable for oxy combustion and the cryogenic production of pure oxygen through the air separation technique are being considered as the main issues for industrial applicability. Oxy combustion and flue gas processing techniques are among the possible mechanisms of cleaner production. The investigated simulation model based on the oxy biomass–CCS technique can play a potential role, as negative emission technology and can boost the likelihood of achieving low concentration targets [67]. Based on this simulation system, the arrangements of a proposed laboratory scale boiler, i.e., setting up CO2-enriched flue gas compressor and packed bed pressurized reactive distillation column, are in progress for future experimentations. The proposed laboratory scale system will not only validate the applicability of the oxy biomass–CCS technique, but will serve as a basis for attracting investment projects for plant scale operation.
Author Contributions
I.A.S. designed and carried out the simulation. I.A.S. and X.G. participated in the analysis of data. I.A.S. wrote the manuscript. X.G. and J.W. revised the manuscript. All authors have read and approved the manuscript.
Acknowledgments
This research did not receive any specific grant from funding agencies in the public, commercial, or not-for-profit sectors.
Conflicts of Interest
The authors declare no conflict of interest.
References
- IRENA International Renewable Energy Agency. Global Energy Transformation: A Roadmap to 2050; IRENA International Renewable Energy Agency: Abu Dhabi, UAE, 2018.
- Gielen, D.; Boshell, F.; Saygin, D.; Bazilian, M.D.; Wagner, N.; Gorini, R. The role of renewable energy in the global energy transformation. Energy Strategy Rev. 2019, 24, 38–50. [Google Scholar] [CrossRef]
- Demirbas, A. Potential applications of renewable energy sources, biomass combustion problems in boiler power systems and combustion related environmental issues. Prog. Energy Combust. Sci. 2005, 31, 171–192. [Google Scholar] [CrossRef]
- Ghafghazi, S.; Sowlati, T.; Sokhansanj, S.; Bi, X.; Melin, S. Particulate matter emissions from combustion of wood in district heating applications. Renew. Sustain. Energy Rev. 2011, 15, 3019–3028. [Google Scholar] [CrossRef]
- Williams, A.; Jones, J.M.; Ma, L.; Pourkashanian, M. Pollutants from the combustion of solid biomass fuels. Prog. Energy Combust. Sci. 2012, 38, 113–137. [Google Scholar] [CrossRef]
- He, J.; Liu, Y.; Lin, B. Should China support the development of biomass power generation? Energy 2018, 163, 416–425. [Google Scholar] [CrossRef]
- Dias, J.; Costa, M.; Azevedo, J.L.T. Test of a small domestic boiler using different pellets. Biomass Bioenergy 2004, 27, 531–539. [Google Scholar] [CrossRef]
- Serrano, C.; Portero, H.; Monedero, E. Pine chips combustion in a 50 kW domestic biomass boiler. Fuel 2013, 111, 564–573. [Google Scholar] [CrossRef]
- Caposciutti, G.; Barontini, F.; Francesconi, M.; Antonelli, M. Experimental investigation on the fixed bed of a small size biomass boiler. Energy Procedia 2017, 142, 468–473. [Google Scholar] [CrossRef]
- FAOSTAT. Burning-Crop Residue: Food and Agriculture Organization of the United Nations 2019. Available online: http://www.fao.org/faostat/en/#data/GB (accessed on 23 March 2019).
- Cheng, S.; Li, Z.; Gao, R.; Wang, X.; Mang, H.P. Methodology development of evaluating agricultural biomass potential for biomass power plant in China. Energy Procedia 2014, 61, 13–16. [Google Scholar] [CrossRef]
- IEA—International Energy Agency. Energy Technology Perspectives 2015: Mobilising Innovation to Accelerate Climate Action; IEA: Paris, France, 2015. [Google Scholar] [CrossRef]
- Global Monitoring Division. Earth System Research Laboratory 2019. Available online: https://www.esrl.noaa.gov/gmd/ccgg/trends/global.html (accessed on 10 July 2018).
- Chang, S.G.; Littlejohn, D.; Lin, N.H. Kinetics of Reactions in a Wet Flue Gas Simultaneous Desulfurization and Denitrification System. Am. Chem. Soc. 1982, 127–152. [Google Scholar] [CrossRef]
- Ma, S.; Jin, Y.; Jin, X.; Yao, J.; Zhang, B.; Dong, S.; Shi, R. Influences of co-existing components in flue gas on simultaneous desulfurization and denitrification using microwave irradiation over activated carbon. J. Fuel Chem. Technol. 2011, 39, 460–464. [Google Scholar] [CrossRef]
- Duan, L.; Zhao, C.; Zhou, W.; Qu, C.; Chen, X. O2/CO2 coal combustion characteristics in a 50kWth circulating fluidized bed. Int. J. Greenh. Gas Control 2011, 5, 770–776. [Google Scholar] [CrossRef]
- Liu, H.; Okazaki, K. Simultaneous easy CO2 recovery and drastic reduction of SOx and NOx in O2/CO2 coal combustion with heat recirculation. Fuel 2003, 82, 1427–1436. [Google Scholar] [CrossRef]
- Petrocelli, F.P.; Fogash, K.B.; White, V. Integration of Catalytic Carbon Dioxide Oxidation and Oxyfuel Sour Compression. U.S. Patent US 8,282,901 B2, 9 October 2012. [Google Scholar]
- Keilin, B.; Walittm, A.L. Method of Converting Sulfur Dioxide to Sulfuric Acid. U.S. Patent US 3649188, 14 March 1972. [Google Scholar]
- Hu, Y.; Yan, J. Characterization of flue gas in oxy-coal combustion processes for CO2 capture. Appl. Energy 2012, 90, 113–121. [Google Scholar] [CrossRef]
- Van Caneghem, J.; De Greef, J.; Block, C.; Vandecasteele, C. NOx reduction in waste incinerators by selective catalytic reduction (SCR) instead of selective non catalytic reduction (SNCR) compared from a life cycle perspective: A case study. J. Clean. Prod. 2016, 112, 4452–4460. [Google Scholar] [CrossRef]
- Poskrobko, S.; Król, D.; Łach, J. A primary method for reducing nitrogen oxides in coal combustion through addition of Bio-CONOx. Fuel Process. Technol. 2012, 101, 58–63. [Google Scholar] [CrossRef]
- Shu, Y.; Wang, H.; Zhu, J.; Tian, G.; Huang, J.; Zhang, F. An experimental study of heterogeneous NO reduction by biomass reburning. Fuel Process. Technol. 2015, 132, 111–117. [Google Scholar] [CrossRef]
- Kurose, R.; Makino, H.; Suzuki, A. Numerical analysis of pulverized coal combustion characteristics using advanced low-NOx burner. Fuel 2004, 83, 693–703. [Google Scholar] [CrossRef]
- Stadler, H.; Ristic, D.; Förster, M.; Schuster, A.; Kneer, R.; Scheffknecht, G. NOx-emissions from flameless coal combustion in air, Ar/O2 and CO2/O2. Proc. Combust. Inst. 2009, 32, 3131–3138. [Google Scholar] [CrossRef]
- Siddiqi, M.A.; Petersen, J.; Lucas, K. Influence of nitrogen monoxide on the complex phase and chemical equilibria in wet flue gas cleaning processes. Ind. Eng. Chem. Res. 2003, 42, 1406–1413. [Google Scholar] [CrossRef]
- Elseviers, W.F.; Van Mierlo, T.; Van De Voorde, M.J.F.; Verelst, H. Thermodynamic simulations of lignite-fired IGCC with in situ desulfurization and CO2 capture. Fuel 1996, 75, 1449–1456. [Google Scholar] [CrossRef]
- Sotudeh-Gharebaagh, R.; Legros, R.; Chaouki, J.; Paris, J. Simulation of circulating fluidized bed reactors using ASPEN PLUS. Fuel 1998, 77, 327–337. [Google Scholar] [CrossRef]
- Srinophakun, T.; Laowithayangkul, S.; Ishida, M. Simulation of power cycle with energy utilization diagram. Energy Convers. Manag. 2001, 42, 1437–1456. [Google Scholar] [CrossRef]
- Øi, L.E.; Eldrup, N.; Adhikari, U.; Bentsen, M.H.; Badalge, J.L.; Yang, S. Simulation and cost comparison of CO2 liquefaction. Energy Procedia 2016, 86, 500–510. [Google Scholar] [CrossRef]
- Laribi, S.; Dubois, L.; Duprez, M.-E.; De Weireld, G.; Thomas, D. Simulation of the Sour-Compression Unit (SCU) process for CO2 purification applied to flue gases coming from oxy-combustion cement industries. Comput. Chem. Eng. 2018. [Google Scholar] [CrossRef]
- Laribi, S.; Dubois, L.; De Weireld, G.; Thomas, D. Optimization of the Sour Compression Unit (SCU) process for CO2 Purification Applied to Flue Gases Coming from Oxy-combustion Cement Industries. Energy Procedia 2017, 114, 458–470. [Google Scholar] [CrossRef]
- Pei, X.; He, B.; Yan, L.; Wang, C.; Song, W.; Song, J. Process simulation of oxy-fuel combustion for a 300 MW pulverized coal-fired power plant using Aspen Plus. Energy Convers. Manag. 2013, 76, 581–587. [Google Scholar] [CrossRef]
- White, V. Purification of Carbon Dioxide. U.S. Patent US 2008/0173584 A1, 24 July 2008. [Google Scholar]
- White, V.; Allam, R.J. Purification of Carbon Dioxide. U.S. Patent US 2008/0173585 A1, 24 July 2008. [Google Scholar]
- White, V.; Wright, A.; Tappe, S.; Yan, J. The Air Products Vattenfall oxyfuel CO2 compression and purification pilot plant at schwarze pumpe. Energy Procedia 2013, 37, 1490–1499. [Google Scholar] [CrossRef]
- Leung, D.Y.C.; Caramanna, G.; Maroto-Valer, M.M. An overview of current status of carbon dioxide capture and storage technologies. Renew. Sustain. Energy Rev. 2014, 39, 426–443. [Google Scholar] [CrossRef] [Green Version]
- Siddiqi, M.A.; Petersen, J.; Lucas, K. A study of the effect of nitrogen dioxide on the absorption of sulfur dioxide in wet flue gas cleaning processes. Ind. Eng. Chem. Res. 2001, 40, 2116–2127. [Google Scholar] [CrossRef]
- Degenstein, N.J.; Shah, M.M.; Kumar, R. Multi-Stage Process for Purifying Carbon Dioxide and Producing Acid. U.S. Patent US 2010/0080745A1, 19 April 2010. [Google Scholar]
- Allam, R.J.; White, V.; Miller, J. Purification of Carbon Dioxide. U.S. Patent US 8,580,206 B2, 12 November 2013. [Google Scholar]
- Allam, R.J.; White, V.; Miller, J. Purification of Carbon Dioxide. U.S. Patent US 2007/0122328 A1, 31 May 2007. [Google Scholar]
- Torrente-Murciano, L.; White, V.; Petrocelli, F.; Chadwick, D. Study of individual reactions of the sour compression process for the purification of oxyfuel-derived CO2. Int. J. Greenh. Gas Control 2011, 5, S224–S230. [Google Scholar] [CrossRef]
- Normann, F.; Jansson, E.; Petersson, T.; Andersson, K. Nitrogen and sulphur chemistry in pressurised flue gas systems: A comparison of modelling and experiments. Int. J. Greenh. Gas Control 2013, 12, 26–34. [Google Scholar] [CrossRef]
- Ajdari, S.; Normann, F.; Andersson, K.; Johnsson, F. Gas phase oxidation of SO2 by NO2 in pressurized flue gas systems—An experimental investigation. Energy Procedia 2013, 46, 2011–2013. [Google Scholar]
- Peng, D.-Y.; Robinson, D.B. A New Two-Constant Equation of State. Ind. Eng. Chem. Fundam 1976, 15, 59–64. [Google Scholar] [CrossRef]
- Shah, I.A.; Gou, X.; Zhang, Q.; Wu, J.; Wang, E.; Liu, Y. Experimental study on NOx emission characteristics of oxy-biomass combustion. J. Clean. Prod. 2018, 199, 400–410. [Google Scholar] [CrossRef]
- Lupiáñez, C.; Guedea, I.; Bolea, I.; Díez, L.I.; Romeo, L.M. Experimental study of SO2 and NOx emissions in fluidized bed oxy-fuel combustion. Fuel Process. Technol. 2013, 106, 587–594. [Google Scholar] [CrossRef]
- Shaddix, C.R.; Molina, A. Fundamental investigation of NOx formation during oxy-fuel combustion of pulverized coal. Proc. Combust. Inst. 2011, 33, 1723–1730. [Google Scholar] [CrossRef]
- Chui, E.H.; Gao, H. Estimation of NOx emissions from coal-fired utility boilers. Fuel 2010, 89, 2977–2984. [Google Scholar] [CrossRef]
- Álvarez, L.; Yin, C.; Riaza, J.; Pevida, C.; Pis, J.J.; Rubiera, F. Biomass co-firing under oxy-fuel conditions: A computational fluid dynamics modelling study and experimental validation. Fuel Process. Technol. 2014, 120, 22–33. [Google Scholar] [CrossRef]
- Pratt, C.J.; Noyes, R. Nitrogen Fertilizer Chemical Processes; Noyes Development Corporation: Pearl River, NY, USA, 1965. [Google Scholar]
- Honti, G.D. Nitric Acid: The Nitrogen Industry, Part I; Akad Kiado: Budapest, Hungary, 1976; pp. 369–448. [Google Scholar]
- Thiemann, M.; Scheibler, E.; Wiegand, K.W. Nitric Acid, Nitrous Acid, and Nitrogen Oxides. Ullmann’s Encycl. Ind. Chem. 2000, 24, 177–225. [Google Scholar] [CrossRef]
- Hoftyzer, P.J.; Kwanten, F.J.G. Absorption of nitrous gases. In Gas Purification Processes for Air Pollution Control; Newnes-Butterworths: London, UK, 1972; pp. 164–187. [Google Scholar]
- Miller, D.N. Mass transfer in nitric acid absorption. AIChE J. 1987, 33, 1351–1358. [Google Scholar] [CrossRef]
- Jaffe, S.; Klein, F.S. Photolysis of NO2 in the presence of SO2 at 3660 Å. Trans. Faraday Soc. 1966, 62, 2150–2157. [Google Scholar] [CrossRef]
- Armitage, J.W.; Cullis, C.F. Studies of the reaction between nitrogen dioxide and sulfur dioxide. Combust. Flame 1971, 16, 125–130. [Google Scholar] [CrossRef]
- Atkinson, R.; Baulch, D. Evaluated kinetic and photochemical data for atmospheric chemistry: Volume I-gas phase reactions of Ox, HOx, NOx and SOx species. Atmos. Chem. Phys. 2004, 4, 1461–1738. [Google Scholar] [CrossRef]
- Rayson, M.S.; MacKie, J.C.; Kennedy, E.M.; Dlugogorski, B.Z. Accurate rate constants for decomposition of aqueous nitrous acid. Inorg. Chem. 2012, 51, 2178–2185. [Google Scholar] [CrossRef]
- Shao, L.-M.; Fan, S.-S.; Zhang, H.; Yao, Q.-S.; He, P.-J. SO2 and NOx emissions from sludge combustion in a CO2/O2 atmosphere. Fuel 2013, 109, 178–183. [Google Scholar] [CrossRef]
- Li, J.; Zhang, X.; Yang, W.; Blasiak, W. Effects of Flue Gas Internal Recirculation on NOx and SOx Emissions in a Co-Firing Boiler. Int. J. Clean. Coal Energy 2013, 2, 13–21. [Google Scholar] [CrossRef] [Green Version]
- Okazaki, K.; Ando, T. NOx reduction mechanism in coal combustion with recycled CO2. Energy 1997, 22, 207–215. [Google Scholar] [CrossRef]
- Glarborg, P.; Jensen, A.D.; Johnsson, J.E. Fuel nitrogen conversion in solid fuel fired systems. Prog. Energy Combust. Sci. 2003, 29, 89–113. [Google Scholar] [CrossRef]
- Zakeri, A.; Einbu, A.; Svendsen, H.F. Experimental investigation of liquid holdup in structured packings. Chem. Eng. Res. Des. 2012, 90, 585–590. [Google Scholar] [CrossRef]
- Mujtaba, I.M.; Macchietto, S. Holdup issues in batch distillation-binary mixtures. Chem. Eng. Sci. 1998, 53, 2519–2530. [Google Scholar] [CrossRef]
- Iloeje, C.; Field, R.; Ghoniem, A.F. Modeling and parametric analysis of nitrogen and sulfur oxide removal from oxy-combustion flue gas using a single column absorber. Fuel 2015, 160, 178–188. [Google Scholar] [CrossRef]
- Azar, C.; Lindgren, K.; Obersteiner, M.; Riahi, K.; van Vuuren, D.P.; den Elzen, K.M.G.J. The feasibility of low CO2 concentration targets and the role of bio-energy with carbon capture and storage (BECCS). Clim. Chang. 2010, 100, 195–202. [Google Scholar] [CrossRef]
Figure 1.
Oxy Biomass Combustion and CCS.

Figure 2.
Reaction mechanism – Fuel inherent nitrogen conversion to NO and N2 Adapted from [46].
Figure 2.
Reaction mechanism – Fuel inherent nitrogen conversion to NO and N2 Adapted from [46].

Figure 3.
Reaction mechanism involving N-S complex species.

Figure 4.
Thermal losses (in kWth) of the 20 kWth oxy combustion based thermal boiler.

Figure 5.
Heating and Cooling Curves of Boiler.

Figure 6.
Profile of fuel N to NO conversion versus NO Conversion (%) in pressurized reactive distillation column (PRDC).
Figure 6.
Profile of fuel N to NO conversion versus NO Conversion (%) in pressurized reactive distillation column (PRDC).

Figure 7.
Effect of liquid/gas feed ratio on vapor product composition.

Figure 8.
Effect of liquid/gas feed ratio on rate of conversion (%).

Figure 9.
Effect of liquid/gas feed ratio on liquid product composition.

Figure 10.
Effect of liquid holdup on vapor product composition.

Figure 11.
Effect of Feed holdup on Rate of Conversion (%).

Figure 12.
Effect of Bottom Recycling ratio on vapor product composition.

Figure 13.
Effect of Bottom Recycling ratio on Rate of Conversion (%).


Table 1.
Ultimate & proximate analyses of biomass fuel used in Aspen simulation.
| C [%ad] | H [%ad] | N [%ad] | S [%ad] | O [%ad] | M [%ad] | A [%ad] | VM [%ad] | FC [%ad] | HHV [MJ/kg·db] |
|---|---|---|---|---|---|---|---|---|---|
| 42.2 | 5.56 | 1.74 | 0.22 | 31.85 | 11.51 | 6.92 | 71.67 | 9.9 | 19.99 |
Table 2.
Parameters and operating conditions used in the steady state simulation.
| Parameters | Unit | Value | Operating Range |
|---|---|---|---|
| Biomass flow rate | kg/hr | 3.6 | - |
| Excess O2 (v/v) | % | 3.46 | - |
| Water flow rate | kg/hr | 210 | - |
| Fuel N conversion to NO | - | 0.5 | 0.5–0.7 |
| L/G feed ratio | - | 0.04 | 0.02–0.2 |
| Absorber Holdup | % | 10 | 2–40 |
| Bottom Recycling | - | 0.2 | 0.2–0.8 |
Table 3.
Reaction kinetics of NOx and SOx absorption.
| Reaction No. | Reactions | Kinetic Rate/Equilibrium Expression | Reference |
|---|---|---|---|
| 4 | [58] | ||
| 5 | [53] | ||
| 6 | [53] | ||
| 7 | [59] | ||
| 8 | [55] | ||
| 9 | [57] | ||
| 10 | , | - |
Table 4.
Average flue gas composition of conventional and oxy combustion (3.5% Excess O2).
| Parameters | Unit | Conventional | Oxy |
|---|---|---|---|
| CO2 | % | 15.94 | 89.01 |
| N2 | % | 74.39 | 1.25 |
| NO | Mol-frac. | 0.0172 | 0.0084 |
| NO2 | Mol-frac. | 7.75 × 10⁻⁷ | 9.54 × 10⁻⁸ |
| SO2 | Mol-frac. | 0.00292 | 0.0016 |
© 2019 by the authors. Licensee MDPI, Basel, Switzerland. This article is an open access article distributed under the terms and conditions of the Creative Commons Attribution (CC BY) license (http://creativecommons.org/licenses/by/4.0/).
Share and Cite
MDPI and ACS Style
Shah, I.A.; Gou, X.; Wu, J. Simulation Study of an Oxy-Biomass-Based Boiler for Nearly Zero Emission Using Aspen Plus. Energies 2019, 12, 1949. https://doi.org/10.3390/en12101949
AMA Style
Shah IA, Gou X, Wu J. Simulation Study of an Oxy-Biomass-Based Boiler for Nearly Zero Emission Using Aspen Plus. Energies. 2019; 12(10):1949. https://doi.org/10.3390/en12101949
Chicago/Turabian StyleShah, Imran Ali, Xiang Gou, and Jinxiang Wu. 2019. "Simulation Study of an Oxy-Biomass-Based Boiler for Nearly Zero Emission Using Aspen Plus" Energies 12, no. 10: 1949. https://doi.org/10.3390/en12101949
Note that from the first issue of 2016, this journal uses article numbers instead of page numbers. See further details here.