Identifying the Drivers of Wind Capacity Additions: The Case of Spain. A Multiequational Approach
by
Consolación Quintana-Rojo
1, 
Fernando E. Callejas-Albiñana
1,
Miguel-Angel Tarancón
1,* and
Pablo del Río
2 1
Faculty of Law and Social Sciences, University of Castilla–La Mancha, 13300 Ciudad Real, Spain
2
Spanish National Research Council, 28032 Madrid, Spain
*
Author to whom correspondence should be addressed.
Energies 2019, 12(10), 1944; https://doi.org/10.3390/en12101944
Submission received: 14 April 2019
/
Revised: 15 May 2019
/
Accepted: 17 May 2019
/
Published: 21 May 2019
(This article belongs to the Special Issue Modeling of Variable Renewable Generation: Wind and Solar Photovoltaic Power Plants)
Abstract
:An abundant volume of literature has been devoted to the analysis of the drivers of renewable electricity capacity additions in general and wind energy in particular. Nevertheless, whereas the direct influence of several explanatory variables has been considered, indirect effects, which refer to impacts of explanatory variables on another explanatory variable which, in turn, influence capacity additions, have been neglected. However, those effects need to be taken into account in order to properly grasp the full influence of the explanatory variables in general, and the policy variable in particular, on capacity additions (whether in wind energy generation or other energy systems). The aim of this paper is to identify the drivers of wind energy capacity additions. Based on data over the 1998–2015 period for Spain, a country with a substantial deployed wind capacity, we estimate a three-stage least squares multiecuational econometric model, which allows the analysis of direct and indirect effects as mediated by their influence on intermediate variables. Our results show that, as expected, wind capacity additions are positively and significantly driven by renewable energy support and negatively driven by the material costs of wind energy. Other variables are related to capacity additions in an indirect manner, i.e., through their influence on intermediate variables, i.e., electricity demand and electricity prices. This includes the positive impact of GDP, wind share, capacity load and price of oil. Others have a negative impact (tax share in the electricity price and electricity transport costs). Finally, no statistically significant relationship can be observed for the risk premium, interest rates and the price of gas. Our findings suggest that the success of renewable energy policy instruments might be contingent upon the level of other variables and, particularly, electricity consumption.
1. Introduction
There is a widespread consensus that the development and deployment of renewable energy technologies (RETs) is an essential part of efforts to mitigate climate change. The deployment of RETs (and particularly solar PV and wind) has increased substantially in recent times. Solar global capacity worldwide has increased exponentially in the last decade, reaching 402 GW in 2017, up from 6 GW in 2006. Although with a lower growth rate, wind global capacity has reached 539 GW in 2017, up from 74 GW in 2006 [1].
However, despite such impressive growth, there is still a long way to go in order to fully decarbonise electricity systems. Renewable energy sources (RES) only represent 26.5% of electricity generation (2017) and modern RES are only 10.4% of total final energy consumption (2016). The share of non-hydro renewables is even lower (10.1% and 16.4%, respectively). Historical trends are clear: energy technologies do not tend to emerge and diffuse quickly because of a wide range of barriers to invention, development and diffusion [2,3,4]. Policymakers need to identify ways in which this process can be accelerated [5].
Indeed, experiences in different countries show that diffusion can be a very slow and tedious process [6], particularly in the energy sector. As [7] puts it, at the beginning the new technology is crude, expensive, inefficient, and badly adapted to the existing institutional setting and the ultimate use, which leads to slow diffusion. Therefore, identifying the drivers and barriers to RETs is a relevant exercise in order to propose policy measures which activate those drivers or remove those barriers.
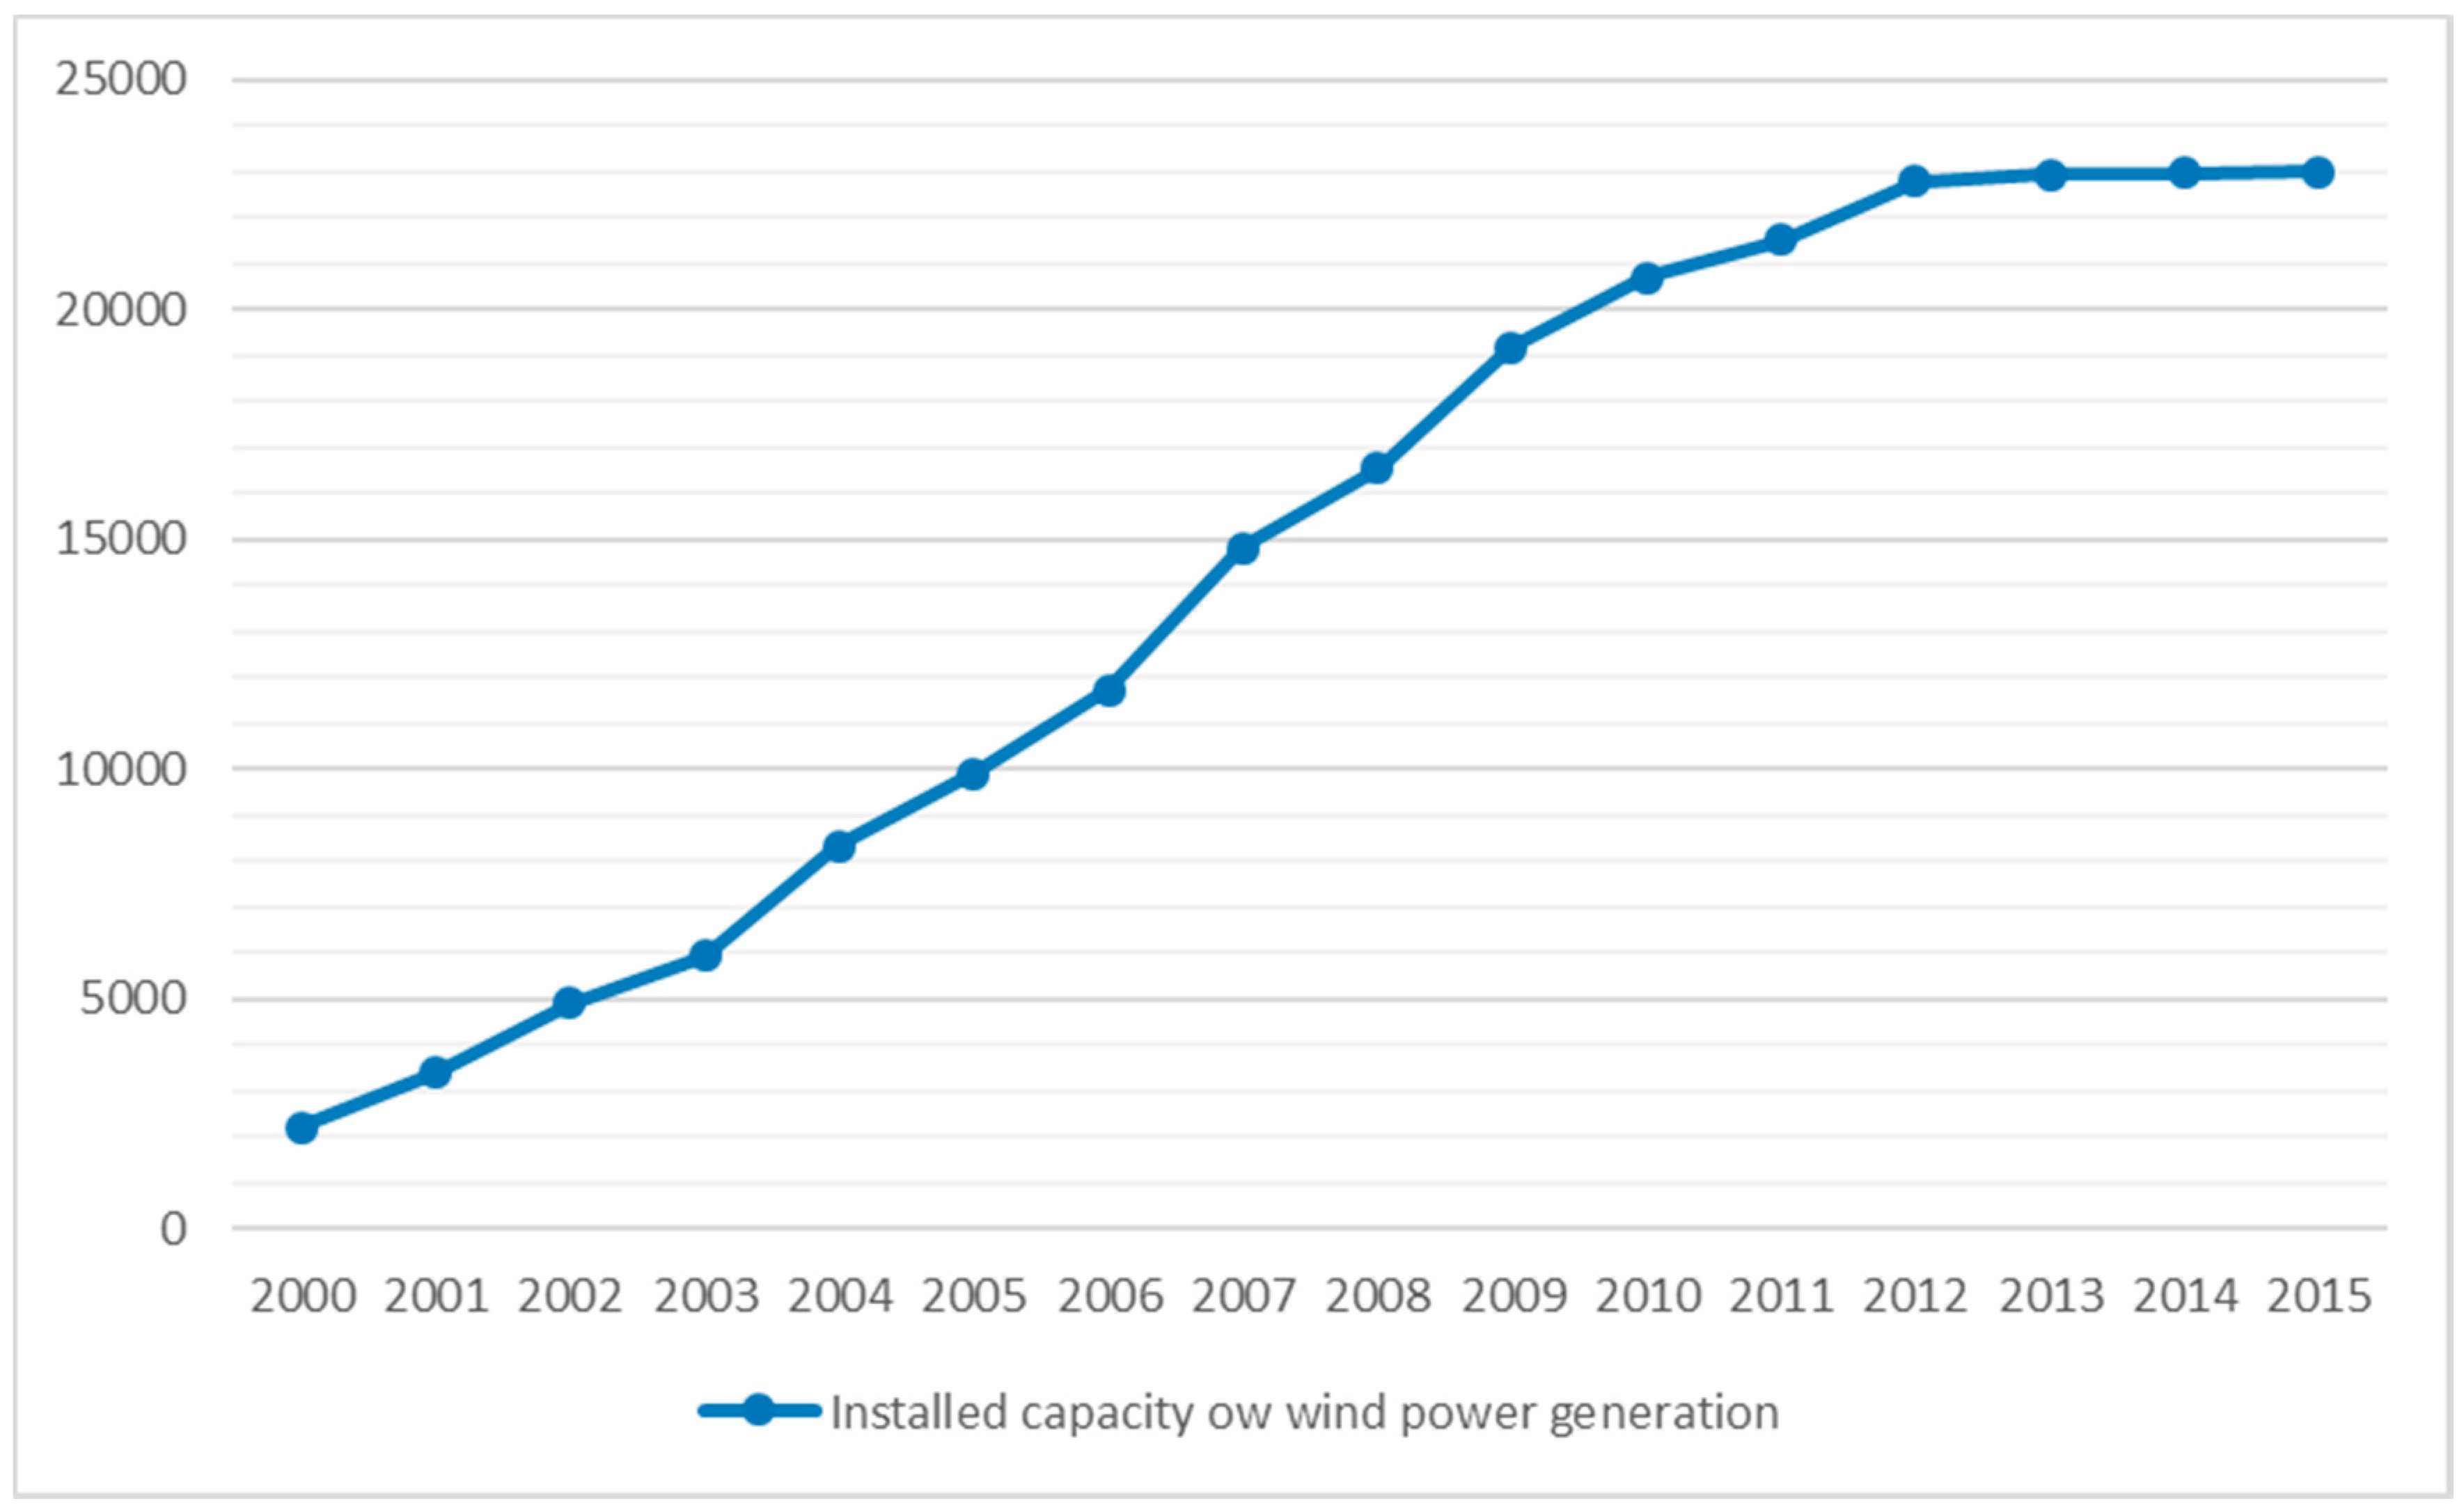
Among RETs, wind energy stands out. It currently represents the most relevant non-hydro renewable energy source worldwide and it is the one with the highest absolute increase in the last decade [1] (according to [8], generation from wind is 825 TWh, followed by biomass (476 TWh) and solar PV (243 TWh). Wind represents 5.6% of world electricity generation, followed by biomass (2.2%) and solar PV (1.9%) [1].) According to the IEA, wind can represent 17% of electricity generation in 2050 [9]. Spain is one of the pioneering countries in sourcing a significant share of its electricity from wind. In 2017, wind energy accounted for 17.5% of electricity generation in this country. However, a low growth rate can be observed from 2007 until the period 2012–2014, when the installed capacity remained constant. Installed capacity in wind energy was 2206 MW in 2000 and rose to 14,820 MW in 2007. Then, it increased slowly to 22,975 in 2014 and 22,988 MW in 2017 [8].
The most crucial factor to explain the behavior described above is undoubtedly the adoption of public policy instruments, particularly different versions of feed-in laws (feed-in tariffs (FITs) and feed-in premia (FIPs)). FITs/FIPs caused a strong expansion of RES installed capacity, especially wind and solar photovoltaics. However, the high cost of this system led to the introduction of a moratorium in 2012, which implied the suspension of incentives to new facilities. A deep reform of the electricity sector approved in 2013 put an end to the RES promotion scheme based on FITs. Nevertheless, even if it is well-known that FITs/FIPs might be the main driver of wind capacity additions, their influence is contingent upon the influence of other variables and, particularly, electricity consumption.
The aim of this paper is to identify the relevance of different factors (drivers and barriers) behind wind capacity deployment in Spain with the help of a multiequational econometric model. The success of renewable energy policy instruments might be contingent upon the level of other variables and, particularly, electricity consumption. Therefore, estimating a multiequational model which captures the influence of those variables is a policy-relevant exercise.
Several previous studies have identified drivers and obstacles to wind deployment. Most have been based on case studies. A few studies have also used econometric methods (see Section 2 for further details). These last papers suggest that more in addition to the level of support for RES, factors such as energy security, removing administrative barriers, regulatory stability and lower risks, spur renewable energy deployment [10,11,12]. Reducing carbon emissions appears to be a driver of RES investments [11,13,14,15] Also, the level and trends of the price of fossil fuels influence renewable energy development [15,16].
However, the existing literature does not consider that some of the drivers and barriers have both direct and indirect effects on wind capacity additions. Direct effects are defined as the immediate influence of one explanatory variable on capacity additions. They have been the focus of past research, as shown by our literature review (see Section 2). In contrast, indirect effects, which refer to impacts of explanatory variables on another explanatory variable which, in turn, influence capacity additions have been neglected. These effects are deemed very relevant in energy systems characterized by many variables and interrelationships between them. A main tenet of this paper is that second-order effects need to be taken into account in order to properly grasp the full influence of the explanatory variables in general, and the policy variable in particular, on capacity additions (whether in wind energy generation or other energy systems). In the realm of the analysis of the determinants of wind energy capacity additions, some factors have not been considered in previous research, such as the share of wind electricity, the wind capacity factor or the transport costs, precisely because of their indirect influence on deployment. Therefore, identifying those indirect influences is critical in order to have a more complete picture of the drivers and barriers to wind energy deployment.
Most importantly, but related to the previous point, using an uniequational model to estimate the influence of different factors on wind capacity additions has several drawbacks. Since some drivers are related to each other, a single equation cannot grasp all those relationships in detail since this would lead to multicollinearity and small sample problems (too many explanatory variables). Furthermore, simultaneous relationships often exist when modeling a system and, particularly, an energy system. These relationships cannot be depicted by an uniequational model without a high risk of suffering endogeneity problems. The paper aims to complement the existing literature on the drivers of capacity additions in renewable energy, which has been based on single-equation models (whether with cross-section or panel data). A multi-equation model is estimated in order to avoid multicollinearity problems as well as to capture the simultaneous relationships between the variables. Therefore, our approach is original and novel in that it allows capturing direct and indirect effects through a multiequational econometric model, something which has not been attempted in the past. To our best knowledge, no previous contribution has addressed the impact of different explanatory variables on RES capacity additions using a multiequational model.
On the other hand, it might be interesting to model the evolution of technology diffusion in a given country, and not in a panel of countries, due to the fact that, with several countries, some variables which are not available for all the countries may need to be included in the specification of the model. From this point of view, the national multi-equational approach can be considered as a complementary modeling of the usual multi-national uniequational approach based on panel data models. It allows a deeper representation of the specific relations of a national energy system.
Therefore, to our best knowledge, this is the first contribution which models the increase in electricity from RES (RES-E) capacity in a given country within a broader system of relationships among variables, whereby direct, indirect, multiple and simultaneous relationships are considered. Thus, the approach in this paper is based on a model built upon multiple and simultaneous equations which allows the analysis of more relationships (complex model), in a more detailed (exhaustive model) and flexible manner (flexible model). Furthermore, this type of modeling can be gradually refined with more equations in order to simulate new interactions between the existing and additional variables while also making them more explicit.
2. Background and Literature Review
Some previous contributions have analyzed the factors influencing the increase of RES-E installed capacity in general, and wind energy in particular. Most of these studies such as [10,12,13,15,17,18] have focused on the influence of political factors (especially, mechanisms to support renewable energy), although there are also papers which have followed a more comprehensive approach and included a wide range of factors in their analysis. Table 1 summarizes the main features of the contributions which analyze the determinants of wind capacity additions through an econometric study [10,11,12,13,14,15,16,17].
We have also included those studies whose focus is not exclusively on wind, but also on other RES, since they provide relevant insights on those determinants. The literature review shows that previous studies have most often focused on a set of countries, rather than on single ones, with a dominance of developed countries (OECD and, particularly, the EU and USA). Different types of variables have been included in the models, although the presence of macroeconomic (GDP), wind resource, environmental (CO2 emissions) and policy variables has been most common. Regarding the methodology, most studies have been based on uniequational econometric techniques, either with panel or cross-section data. In contrast, we provide a multi-equational econometric model which allows capturing the indirect determinants of wind capacity deployment, including a wide array of barriers.
3. Analytical Framework: Drivers and Barriers of Wind Capacity Additions
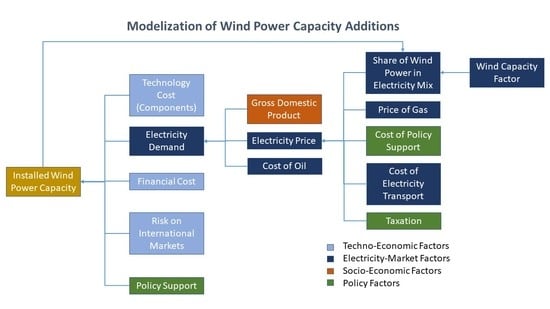
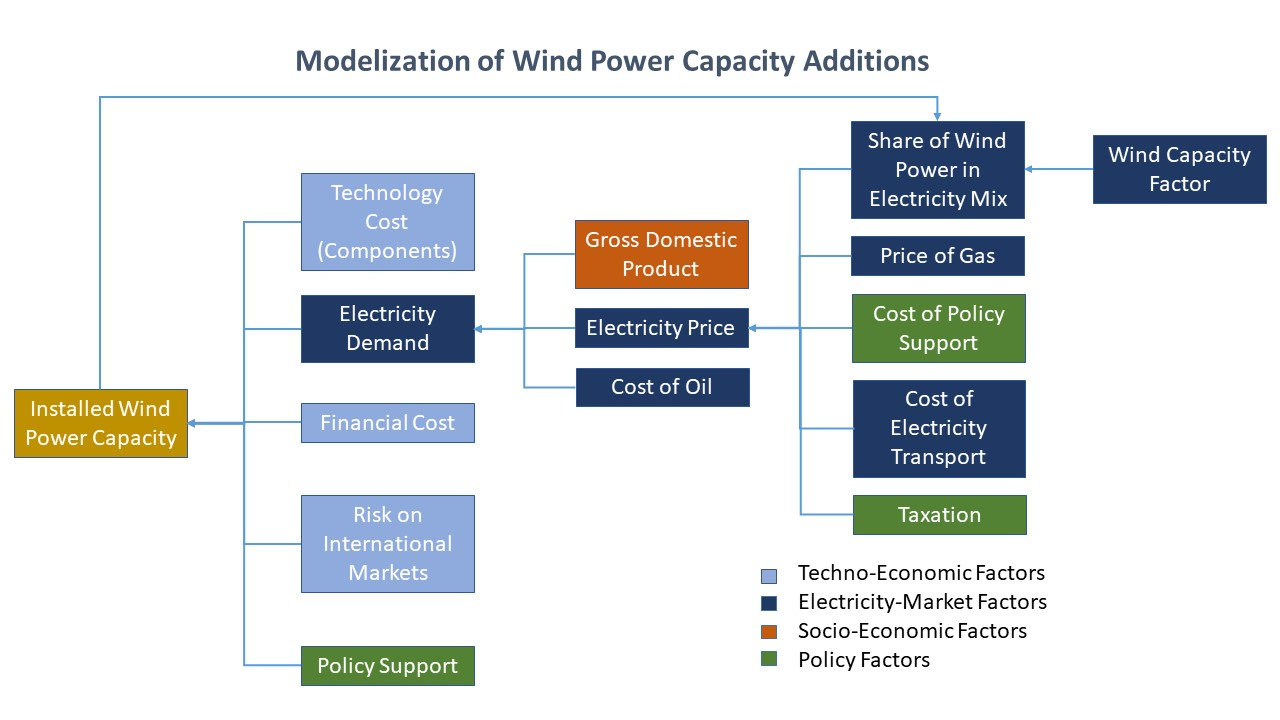
According to the aforementioned contributions, drivers of wind capacity additions include specific factors of wind generation technology, factors associated with the electricity market, political factors and factors related to the socio-economic environment (Table 2). These factors should not be considered in isolation, because they are often related to each other. Indeed, they are sometimes two sides of the same coin, creating a network of influences that simultaneously affect the installation of new wind capacity.
This paper focuses on several drivers to wind capacity additions in Spain which have been underesearched in the existing literature on the topic: degree of policy support, technology costs, investment conditions, fuel prices and the merit order effect. Several hypotheses are put forward regarding these drivers.
3.1. Degree of Policy Support
Despite the substantial cost reductions experienced by RETs (including wind on-shore), which have led to their competitiveness with fossil-fuels, these technologies have traditionally needed policy support in order to diffuse, due to their relatively higher (private) costs. Support can be provided through quantity-based (e.g., quotas with tradable green certificates) or price-based instruments (feed-in premiums, feed-in tariffs). Feed-in tariffs (FITs) provide guaranteed payments per kWh of electricity of renewable origin, combined with a purchase obligation by the utilities. Under feed-in premiums (FIPs), a guaranteed payment per kWh on top of the electricity wholesale-market price is granted, combined with a purchase obligation by the utilities. In the EU, most support schemes have been based on feed-in laws [19,20]. In Spain, support for wind on-shore has been provided through FITs and FIPs in the past. When such support has been absent, as was the case since the 2012 moratorium, the deployment of new wind capacity stopped. The main problem with these support systems is that their total costs, which are generally paid by electricity consumers in their bills, have sometimes skyrocketed [21]. In order to avoid excessive total support costs, some countries have limited the annual payment or the capacity that can be remunerated, as it was the case in Spain [22]. In addition to the support level, the stability of support is a main policy aspect. Mitigating the risks for investors is one of the main objectives of renewable energy promotion policies. Therefore, ensuring the stability of the regulatory framework, avoiding abrupt policy changes and protecting the implicit legal security of such regulation is advisable [10,23,24]. This allows investors to be confident that their investments can be recovered and that a reasonable profit can be recovered [12]. Therefore, the following hypothesis is proposed:
Hypothesis 1:
The higher the level of support for wind on-shore, the higher the wind capacity additions.
3.2. Technology Costs
The costs of the entire wind power generation system are divided into capital expenditures (CapEx) and operational expenditures (OpEx). CapEx include all installed costs incurred prior to commercial operations. Wind turbines are the main cost item of the total capital cost of wind energy. A modern wind turbine has more than 8000 individual components [25]. However, the costs of the main components groups (nacelles, blades and towers) represent 90% of the total costs of those individual components [26]. The operational expenditures (O&M) are those which are required to operate the project and maintain its availability.
When analysing the impact of the costs of wind power generation technology on installed capacity, it should be taken into account that wind turbines are the main cost item of total capital costs [27]. Furthermore, public data on O&M costs are unavailable and, when available, they are unreliable because of the dramatic changes in wind turbine technology [28]. Furthermore, although some O&M costs are incurred in the first years of a wind turbine in order to make the wind project fully operational, maintenance and spare part costs do not need to be considered in the first five years of operation because they are covered by a supplier warranty [29]. For those reasons, particular attention should be paid to the evolution of capital costs.
In contrast to other non-RET electricity generation technologies, wind on-shore is a highly capital-intensive one. This means that most costs are incurred up-front, and this is usually a powerful deterrent for their adoption. Two crucial costs for wind on-shore in this context are material costs and financing costs. Regarding the former, the evolution of iron prices is taken into account in our analysis. Iron prices are taken as a proxy of steel prices, which is the main material used in the construction of wind farms. Interest rates can be taken as a proxy of the financing costs, which are highly relevant in a capital-intensive technology such as wind. Surprisingly, these costs have received scant attention in the literature.
Hypothesis 2:
The higher the technology costs (interest rates, costs of iron), the lower the wind capacity additions.
3.3. Investment Conditions
As a capital intensive technology, investment conditions are key. These refer to several aspects, including the stability of regulation, general investment conditions and access to credit. These conditions are proxied in this paper through the risk premium.
Hypothesis 3:
The better the investment conditions (proxied by risk premia) the higher the wind capacity additions.
3.4. Fossil Fuel Prices
The price of fuel is one of the main cost components of electricity generation with conventional technologies. Therefore, the level and change in the prices of these fuels directly affect the competitiveness of RETs [15,20,30]. In fact, when these prices are high enough, renewable energies become competitive without the need for support mechanisms [13]. In addition, renewable energies may be an effective protection against the volatility of fuel prices [31]. Wind on-shore has traditionally competed with other electricity generation technologies, whether renewable or non-renewable. In this paper, the prices of oil and gas are taken as proxies of those fossil-fuel prices.
Hypothesis 4:
The higher the price of fossil fuels, the higher the wind capacity additions.
3.5. Merit Order
Finally, while the merit order effect has been extensively analyzed, its influence on the deployment of RETs in general and wind capacity additions in particular has not been the focus of research in the past. The merit order effect refers to the reduction of wholesale electricity prices due to a higher RES supply. The power price is determined by the “merit order”, with the cheapest offer made by the power station with the lowest running costs setting the starting point and the marginal generation unit needed to cover the demand setting the electricity price at a given moment. Since renewable energies have low variable costs, this price is usually set by fossil-fuel energy sources (gas or oil), which have higher variable costs. Electricity from wind turbines is sold in the wholesale market, pushing more expensive conventional producers out the merit order and, thus, reducing the electricity price [32]. It has been argued in the past that lower electricity prices as a result of more wind electricity generation would deter further wind capacity investments, i.e., that wind energy could be the victim of its own success [33,34]. However, two effects play a role here. On the one hand, a lower electricity price entails lower revenues for electricity generators. But, on the other hand, a lower price leads to a higher electricity demand (depending on the elasticity of demand), which encourages greater investments in electricity generation capacity (all energy sources, not only wind). Whether one effect offsets the other is an empirical issue worth analyzing.
Hypothesis 5:
The higher the share of wind electricity, the higher the wind capacity additions.
The above suggests that some of the aforementioned variables do not influence capacity additions directly, but indirectly through their impact on other intermediate variables such as electricity demand and the price of electricity. In particular, electricity demand is related to both the global productive activity and the residential uses (households). An increase in electricity demand would put pressure to increase electricity production and, if the rise in demand is persistent over time, a higher stock of installed capacity can be expected [10,12,15,20,35]. Due to its renewable character and maturity, part of this capacity can be covered by wind technology.
Other variables can be included as control variables, with either a direct or an indirect effect on wind capacity additions. These include GDP, transport/transmission/distribution costs and taxes. In contrast, other relevant variables with an expected influence on capacity additions, such as administrative and grid connection barriers, cannot be included due to lack of data.
4. Methods
Taking into account the aforementioned factors, a multiequational econometric model that evaluates their impact on the increase of on-shore wind installed capacity in Spain is estimated.
As it was mentioned in the introduction, wind on-shore has been gaining weight in the electricity generation mix in Spain. With 46.9 TWh in 2017, it shows the greatest contribution of all RES (17.5% of total electricity generation, [36]). Indeed, it was the second source of electricity generation in that year, only behind nuclear (20.3%). However, if we observe the evolution of installed wind power capacity in Spain in recent years, we can see an "S-curve" trend (Figure 1).
The figure shows that installed capacity continued to grow until 2007, and then the growth rate gradually declined to zero in the period 2012–2015. This is probably related to the passing of the moratorium on RES-E support in 2012. Despite the removal of the previous support scheme based on FITs and FIPs, the analysis of the rest of determinants of the increase in wind energy capacity is crucial since, in the absence of such support scheme and its replacement by auctions (at zero support levels), the rest of variables will bear a relevant role in wind deployment. The rest of this section provides details on the specification and estimation of the multiequational model that has been developed in order to analyze the evolution of wind energy capacity additions in Spain. Two main approaches have been followed in the past to model the relation between the deployment of RETs and the factors suggested by the literature.
The first one involves the estimation of an econometric model for a relatively wide group of countries, often using panel data (Table 1). A sufficient amount of data is required for a proper estimation and this induces the choice of several countries. Data for each factor or variable must be available for all countries, which is a drawback of this approach. Furthermore, the final specification of the model could lead to the inclusion of several variables, some of which might be irrelevant for a specific country.
The second approach comprises the estimation of an econometric model for a single country. This could reduce the requirements for data from other countries and the number of irrelevant variables. However, there could also be a problem of data availability, as time series tend to be short for several variables. In turn, an estimation with short time series could lead to multicollinearity problems and to the loss of precision of the estimated coefficients.
In this paper a third approach is suggested. It comprises the estimation of a multiple equation model which represents the relation between the deployment of renewable power capacity and a set of factors or variables, overcoming some of the limitations mentioned above. In particular, this type of model allows the specification of a number of variables in spite of the length of the time series without affecting the degrees of freedom (and thus the properties of the estimators) by means of the estimation of several equations. This method also reduces the risk of multicollinearity problems because each equation specifies a low number of regressors. In addition, indirect relations can be depicted through linked equations. Finally, a multiple equation model allows the inclusion of simultaneous relations between variables in an adequate manner, avoiding endogeneity problems.
The model to assess the variation in wind energy installed capacity in Spain in the 1998–2015 period is made up of four equations. In the main equation wind capacity additions is the dependent variable. Second, an equation is specified in which one of the explanatory variables of the first equation (electricity consumption) is the dependent variable. In turn, this second equation has a simultaneous relation with a third one, which explains the behavior of the electricity price. In the fourth equation, the share of wind in electricity generation is the dependent variable, which is deemed a relevant factor to explain electricity prices. Therefore, our econometric approach allows us to model the evolution of investment in wind capacity additions in Spain, including the multiple factors which influence such investment in either a direct or an indirect manner, avoiding multicollinearity problems and low degrees of freedom.
The 15 variables which make up the specification of the model are included in Table 3. The data have been collected from several information sources: the European Commission (EC), the statistical office of the European Union (EUROSTAT), the International Renewable Energy Agency (IRENA), the annual macro-economic database of the European Commission (AMECO), the Bank of Spain (BDE), the European Environment Agency (EEA), the International Energy Agency (IEA), the Lawrence Berkeley National Laboratory (LBNL), the Iberian Balance sheet Analysis System (SABI), the company BP plc (BP), the Ministry of Agriculture, Fisheries, Food and the Environment (MAGRAMA), the National Statistics Institute (INE), the company OMI-Polo Español S.A. (OMIE) (which is the market operator in Spain), the National Commission on Markets and Competition (CNMC) (which is the energy regulator in Spain) and the Ministry of Economic and Financial Affairs. This data can be found in the Supplementary Material.
The choice of variables was made using a four-stage procedure. First, a literature review as well as theoretical considerations were taken into account in the broad selection of an initial set of variables. Then, we looked for data on those variables and discarded those for which enough high-quality data were not available. Third, the analysis of the correlation matrix allowed us to identify high correlations between the initially selected variables. Therefore, we removed those variables which had high correlations with others, in order to avoid multicollinearity problems. Finally, each equation has been specified in order to minimize the value in the Akaike information criterion (AIC).
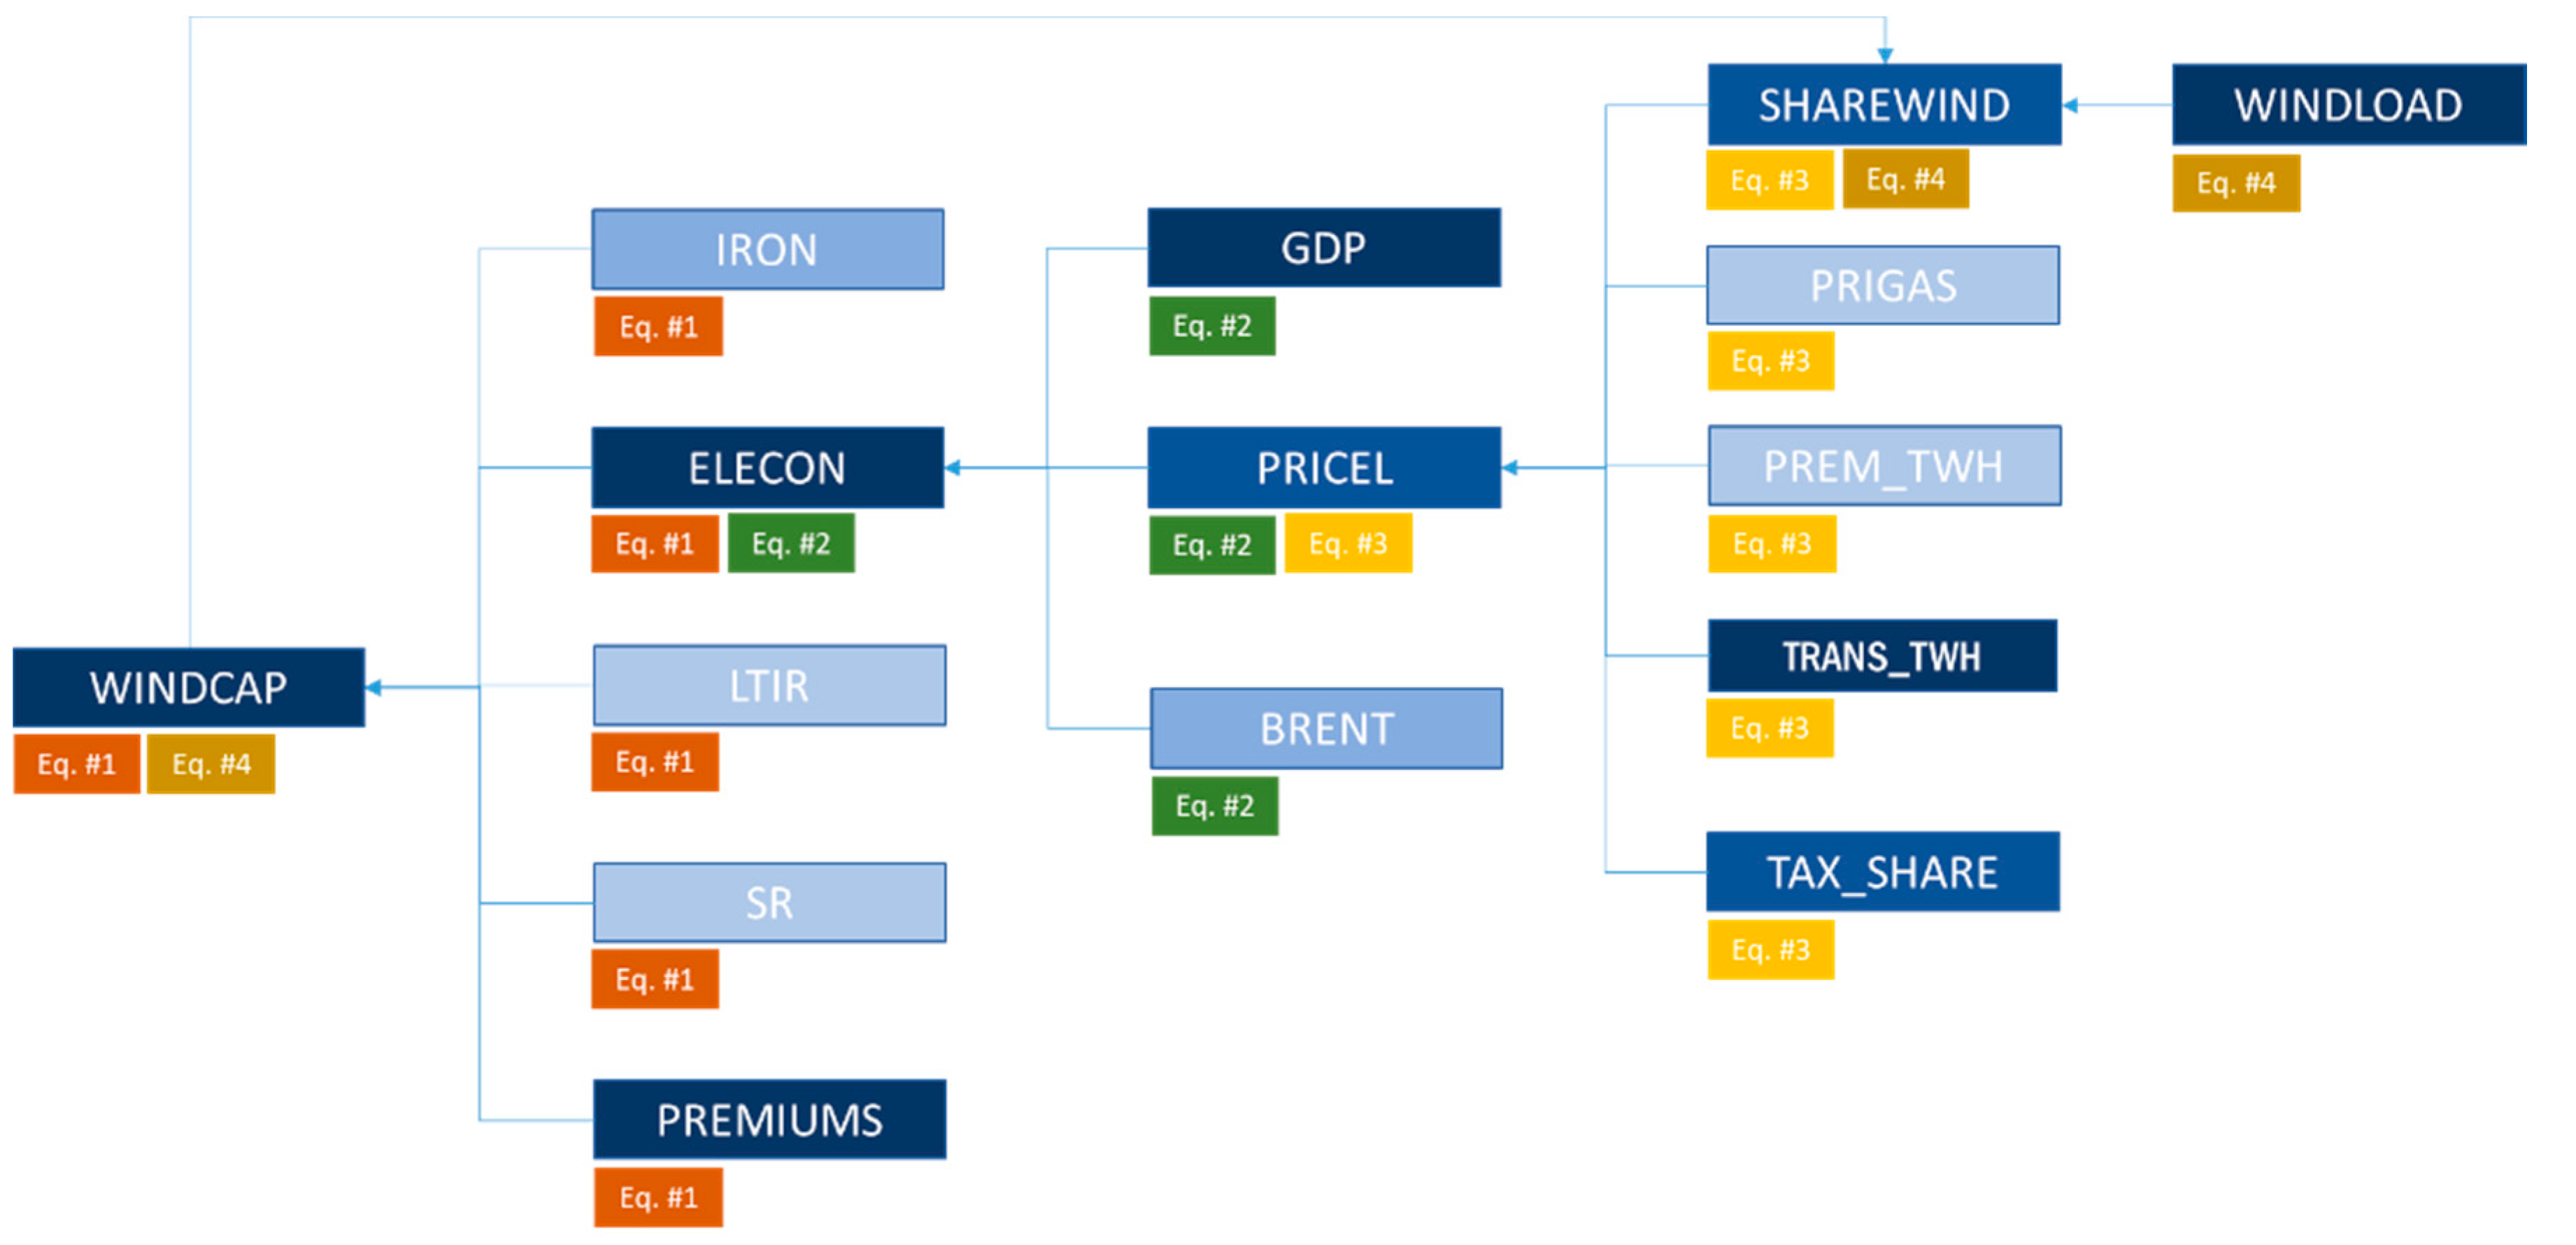
Accordingly, the following equations have been specified with the following variables. Equation (1) includes the main determinants of wind installed capacity in Spain (WINDCAP). Those explanatory variables are: electricity consumption in the country (ELECON); the price of iron in international markets (IRON) as a proxy of steel prices (for which data are not available), since this is the main material used in the construction of wind turbines (see Section 3.2); RES-E support schemes in the form of feed-in tariffs or feed-in premia (PREMIUMS), the risk premium (SR) and the long-term interest rate (LTIR). Therefore, Equation (1) is specified as follows:
Equation (2) explains the evolution of electricity consumption in the country (ELECON) which, in turn, was one of the explanatory variables of WINCAP. The following explanatory variables have been included: Gross Domestic Product (GDP), since the higher is the level of economic activity, the higher is electricity consumption; the electricity price (PRICEL), given that a higher price would lead to a lower electricity demand, and the price of oil (BRENT), as an overall proxy of the price of conventional energy sources (oil, gas and coal). Therefore, Equation (2) is specified as follows:
Equation (3) is a second-level equation which explains the evolution of the electricity price (PRICEL). In turn, this was an explanatory variable of electricity demand (ELECON). The following explanatory variables have been included: the share of electricity generated with wind turbines, since wind energy pushes down the wholesale electricity price (SHAREWIND), the price of natural gas (PRIGAS), which is an indicator of the costs of electricity generation with combined cycle gas turbines (CCGT); the total amount of RES-E support (premiums) divided by the total amount of RES-E generated (PREM_TWH) since this support is finally paid by the electricity consumer; the share of electricity taxes in the electricity price (TAX_SHARE) and transport costs (TRANS_TWH). Therefore, Equation (3) is specified as follows:
Finally, Equation (4) is a fourth-level equation which explains the evolution of the share of wind energy in the electricity mix (SHAREWIND). This variable depends on the capacity load of wind (WINDLOAD), which in turn depends on the meteorological conditions in a given year and on the installed wind capacity itself (WINDCAP). Therefore, Equation (4) can be specified as follows:
Figure 2 depicts the final specification of the multiequational model:
5. Results and Discussion
Given the existence of simultaneity relationships between some of the variables, and given the fact that the four equations of the model are over-identified [44,45], the model was estimated with two alternative techniques in order to avoid the loss of quality in the estimators due to the existence of endogeneity in the equations: the limited information technique of two-stage least squares (2SLS) and the complete information technique of three-stage least squares (3SLS). Once the model was estimated with the 2SLS and 3SLS methods, the Hausman test [46] was applied. It provides a criterion to choose between one or the other type of estimation. The null hypothesis of the test advocates the consistency of the estimators of both methods, which implies a preference for the results of the 3SLS since the estimations with such technique are more efficient than those provided by 2SLS (in addition to being consistent) [44,47], given that 3SLS include in the estimation process the fact that the contemporaneous correlation matrix of the SEM disturbances has non-trivial off-diagonal elements in order to correct the impact of relationships between the random errors of the different equations. The rejection of the null hypothesis would imply that the 3SLS estimators would not be consistent and, thus, that the 2SLS estimators would be preferable. In our case, the Hausman test reached a value of -6.963, which implies a p-value of 1 and, thus, the non-rejection of the null hypothesis. This means that the results of the estimation with 3SLS are preferable.
After the estimation of the model with the 3SLS method, two additional tests have been carried out in order to assess the quality of the estimation. On the one hand, a test of the likelihood-ratio has been undertaken, and the estimations of the equations of the model using the ordinary least squares (OLS) method have been compared with the joint estimation of the equations with the 3SLS method. The p-value is 0.757 and, thus, the null hypothesis that the over-identifying restriction implied by this simultaneous equation model is significant is not rejected. Notwithstanding, we have preferred to use the 3SLS estimation in order to ensure a better efficiency of the estimators.
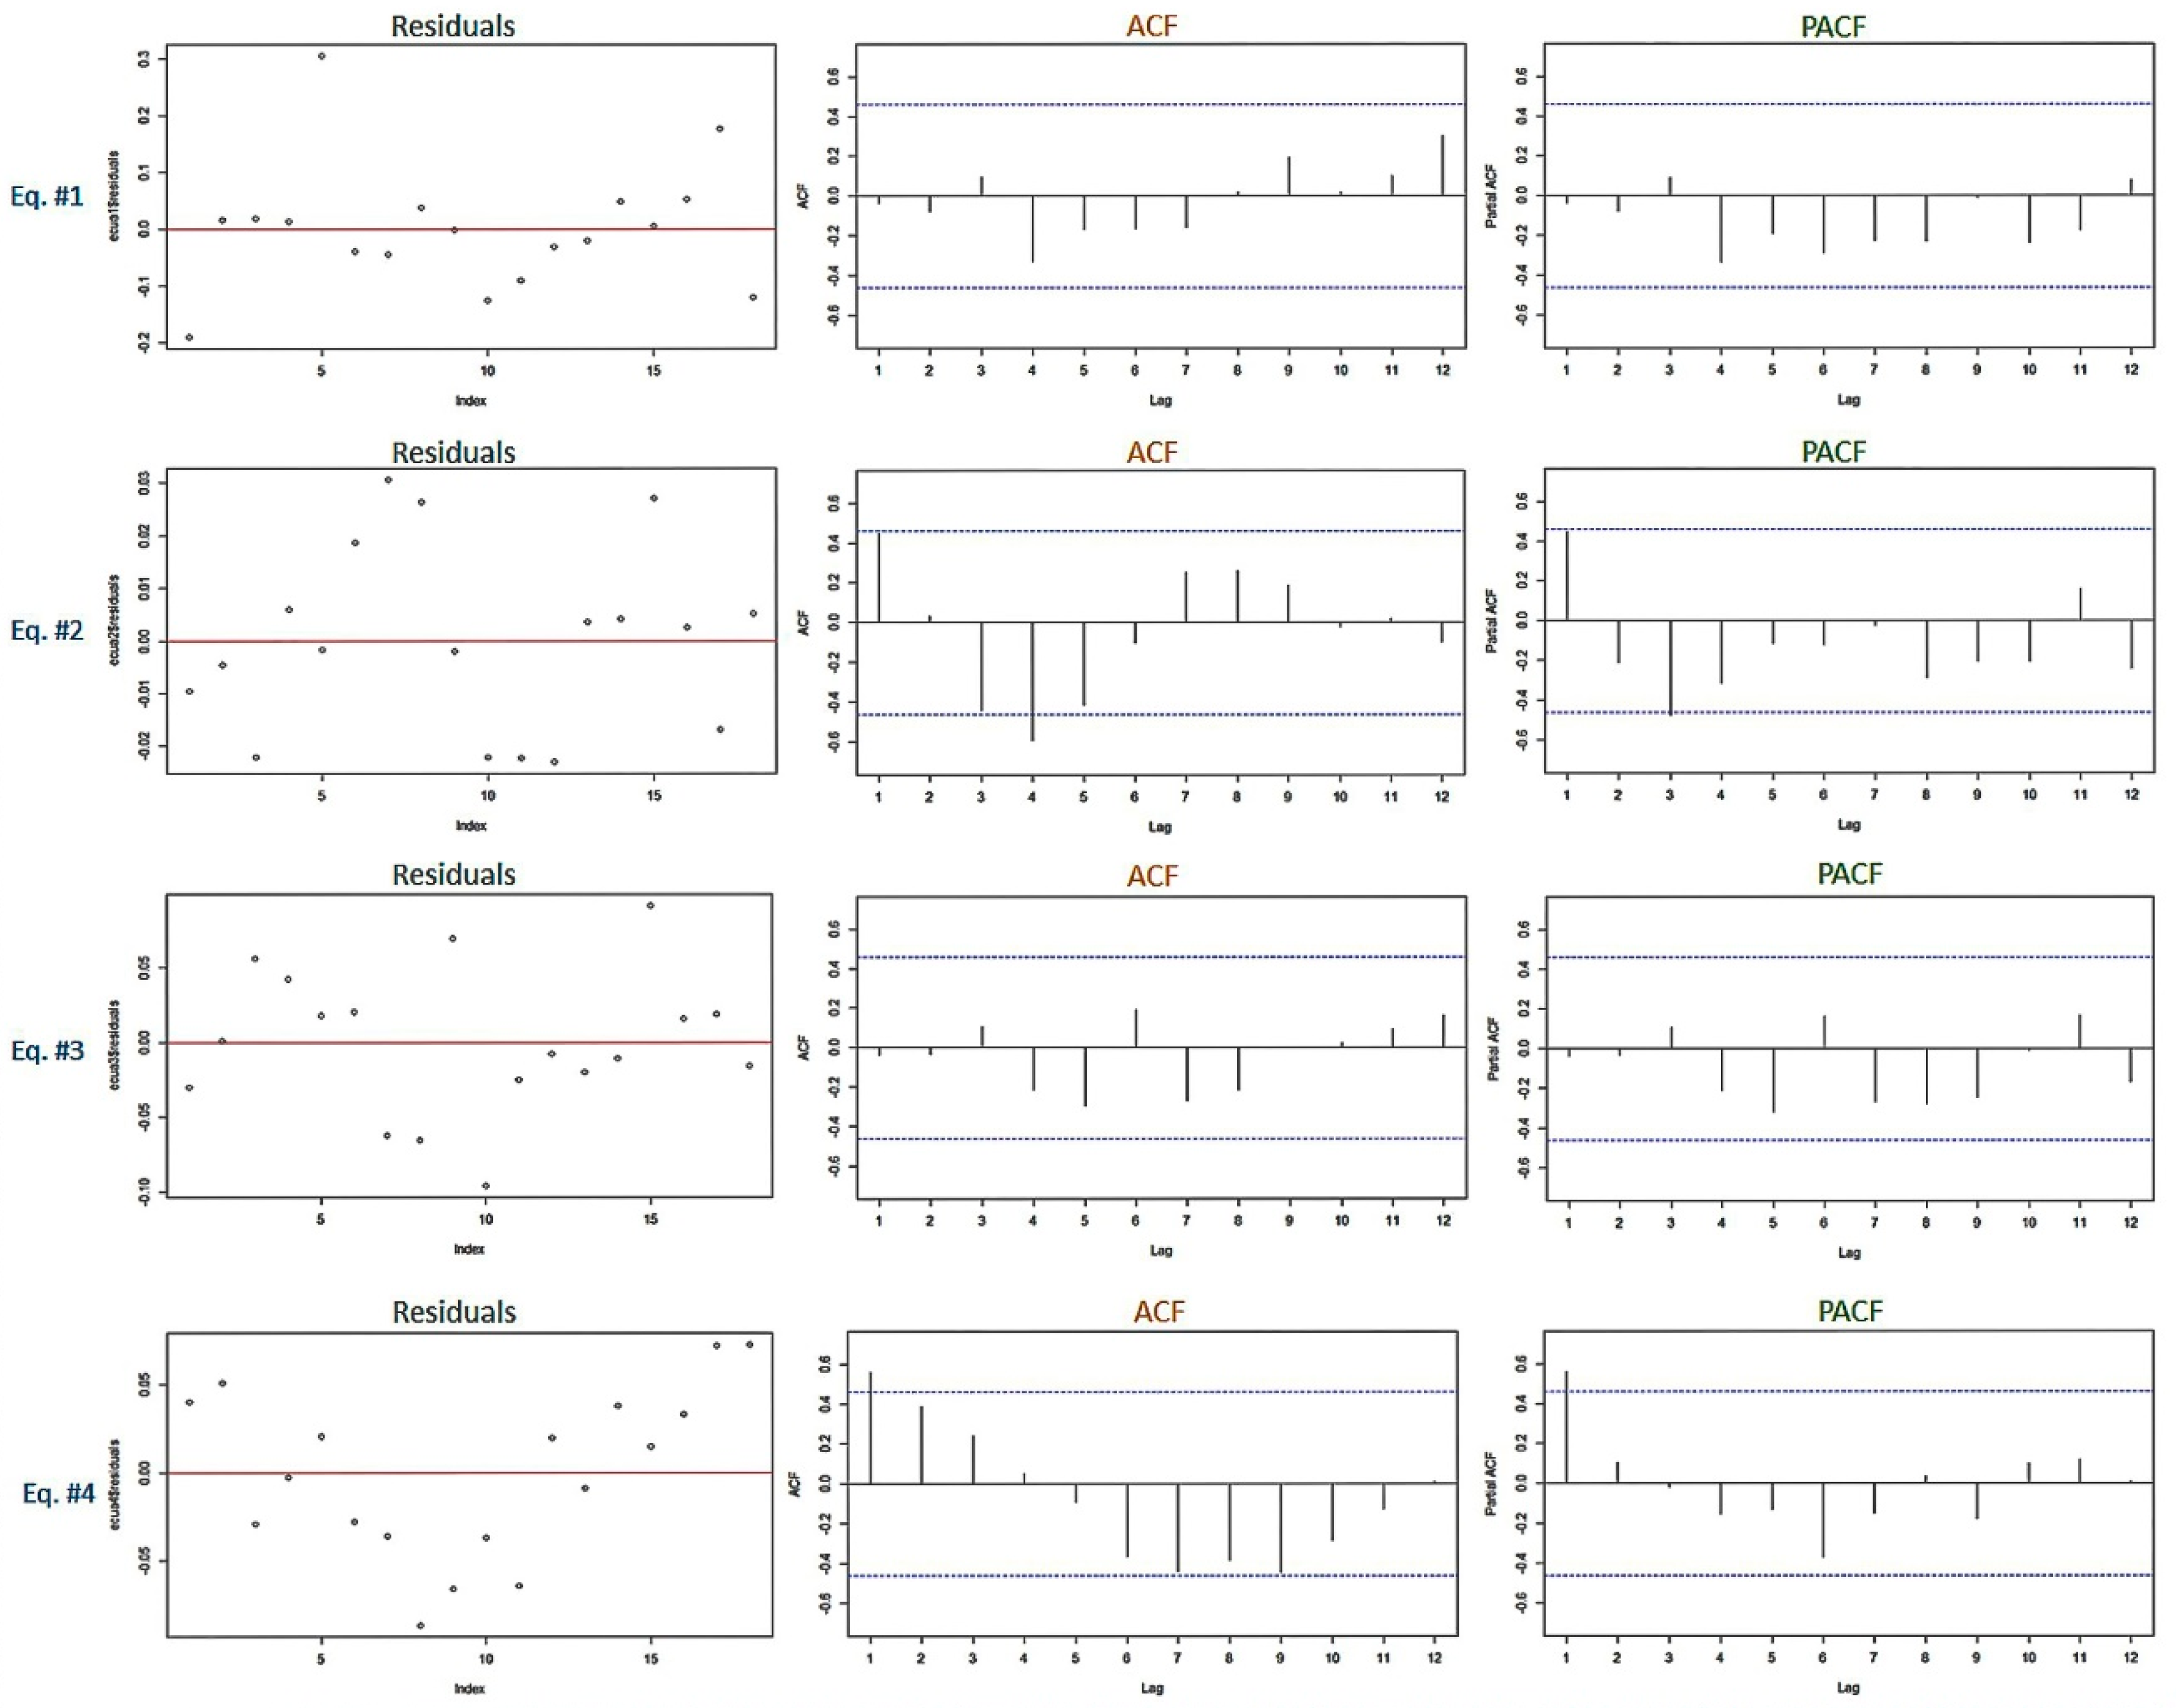
On the other hand, and given that the variables included in the model are integrated of first-order, we have applied the stationarity tests of Augmented-Dickey-Fuller (ADF) to the series of errors of each of the equations, whereas for the usual critical values, the result is that those series are stationary in all the equations; the opposite occurs if the values proposed by [48] MacKinnon (1996) are taken as critical values: ADF value of −4.42 against a critical value of −5.16 in the first equation, −3.61 versus −4.28 in the second one, in the third equation an ADF value of −4.19 against −5.16 and finally, −1.69 versus −3.807 in the fourth equation. Notwithstanding, we have taken into account two fundamental reasons for maintaining the specification of the equations. First, the strong support of the economic theory underlying the revised literature in terms of the results obtained. And, secondly, the analysis of the series and functions of total autocorrelation (ACF) and partial autocorrelation (PACF) of the residuals of the estimated equations by OLS that, as can be observed in Figure 3, they point in general to a stationary behavior of these and, therefore, to a stable relationship between the specified variables in each equation.
The results of the 3SLS estimation are shown in Table 4. The variables are expressed in natural logarithms.
The results of the estimations show that the estimated coefficient associated to the support level is significant at the 0.05 significance level. The sign of this coefficient is positive, which suggests a positive relationship between WINDCAP and support levels. This relationship could be expected since, as mentioned above, the most crucial factor to explain the behavior described is undoubtedly the implementation of public policies, based on feed-in tariffs and premia. Therefore, support levels are a crucial driver of wind capacity additions, i.e. Hypothesis 1 cannot be rejected.
Regarding the variables related to technology costs, the variable “iron costs” is statistically significant and has a negative sign, suggesting that higher iron costs are related to lower wind capacity additions. In other words, the higher the material costs of this technology, the lower its deployment. In contrast, the other technology cost considered in this study (interest rates) is not statistically significant. This was not an expected result, since financing costs can be deemed a critical barrier for a capital-intensive technology such as wind on-shore. This result means that financing costs are not a barrier to wind deployment, possibly due to the relatively low interest rates and the easy access to credit in the analyzed period. Therefore, Hypothesis 2 cannot be rejected.
As a capital-intensive technology, wind on-shore requires favorable investment conditions. These conditions have been proxied in our model by the risk premium. However, the estimated coefficient associated to this variable is not statistically significant, suggesting that this is not a relevant driver/barrier of wind capacity additions. Therefore, Hypothesis 3 can be rejected.
Although the impact of gas prices on the electricity price (Equation (3)) is not statistically significant, the price of oil (Equation (2)) is statistically significant and has a positive sign. Therefore, it can be concluded that the costs of electricity generation with CCGT do not have a significant influence on wind capacity additions, but the price of other conventional energy sources such as oil, increase the electricity consumption in the country and such increase has a positive effect on wind capacity additions. Therefore, Hypothesis 4 cannot be rejected.
Finally, a higher amount of wind capacity positively affects the share of wind in electricity (Equation (4)). In turn, a higher share of wind reduces the wholesale electricity price (Equation (3)), which increases the demand for electricity (Equation (2)). This higher electricity demand has a positive effect on wind capacity additions (Equation (1)). Thus, wind capacity additions and a higher wind capacity factor positively influence further wind capacity additions though a lower electricity price due to a higher penetration of wind electricity (merit order effect). Therefore, hypothesis 5 cannot be rejected.
This merit order effect illustrates a main tenet of this paper, i.e., that in energy systems characterized by many variables and interrelationships between them, second-order effects need to be taken into account in order to properly grasp the full influence of the explanatory variables in general, and the policy variable in particular, on capacity additions. In addition to the positive and direct effect of policy on wind capacity additions (impact of the variable PREMIUMS), a negative and indirect effect of policy could be expected: the cost of support (PREM_TWH) would put upward pressure on the final electricity price which, then, would reduce electricity demand and, thus, the need for new capacity. However, the results of our model suggest that the price has a significant impact on demand and, thus, on capacity additions, that the costs of support do not have a significant influence on price and that the level of support (PREMIUMS) significantly affects wind capacity additions. Therefore, we can deduce that the (positive) direct effect of support for RES on wind investments is more relevant than the (negative) indirect effect through the increase in final electricity prices.
This is an interesting result which, to our best knowledge, has never been identified before. Indeed, it has usually been mentioned that wind might be the victim of its own success since a greater share of wind would reduce wholesale electricity prices, leading to a lower remuneration level for wind investors. It is usually argued that past and future reductions in the costs of solar PV and wind will make these technologies cost-competitive with respect to their competing alternatives in the medium or long-terms [33]. For some, this means that support schemes for wind and solar should be phased out. However, there is still a challenge for policy makers to encourage RES-E investments with the expected move to market-based instruments, since part of the revenues are received through the wholesale price and these are reduced when a greater penetration of RES-E takes place (merit order effect). Therefore, even where the full costs of (variable) renewables are lower than average market prices, policy intervention may be needed to ensure that sufficient investment is attracted to RES-E projects.
Regarding the control variables, most are statistically significant and have the expected sign. This is the case with GDP (positive influence on wind capacity additions through its impact on electricity demand), tax share (negative relationship) and transport cost (negative relationship).
Finally, our results confirm the very relevant role played by the intermediate variables electricity demand and electricity prices, i.e., most explanatory variables have an indirect effect on wind capacity additions through their impact on these two variables.
6. Conclusions
This paper has identified the drivers of wind energy capacity additions in Spain over the period 1998-2015 through the estimation of a three-stage least squares multiecuational econometric model, which allows the analysis of direct and indirect effects as mediated by their influence on two intermediate variables (electricity demand and electricity prices).
Our results show that, as expected, wind capacity additions are positively and significantly driven by renewable energy support (in the form of feed-in premiums and tariffs). The absence of support since 2012 led to a stagnation of wind capacity additions in this country. Interestingly, our results suggest that the impact of FITs/FIPs on wind deployment is mediated by the influence (level) of other variables. In other words, the success of renewable energy policy instruments is contingent upon the level of those variables.
In contrast, our results regarding the influence of technology costs are mixed. On the one hand, the material costs of wind energy (proxied by the price of iron) have had a negative effect on wind capacity additions. On the other hand, the financing costs (proxied by interest rates) are not statistically significant in the econometric estimations. This is probably related to the type of investors in wind capacity in Spain: large investors which have been able to finance their investments with equity rather than debt. The lack of statistical significance of the investment conditions (proxied by the risk premium) suggests that access to credit has not been a barrier. They may have been problematic only in the last years of the considered period, coinciding with the worst years of the economic/financial crisis, which led to severe credit restrictions. But these were also the years when cost-containment mechanisms on the support scheme and the moratoria were adopted. Our results suggest that those unfavourable policy conditions played a more relevant role than the access to credit restrictions. This stresses the importance of policy framework conditions, in contrast to the traditional focus in the literature on specific RES deployment instruments.
Contrary to expectations, gas prices have not played a significant role in explaining wind capacity additions. This might be related to the fact that wind does not compete with gas or, more likely, that gas prices were simply not part of the decision by investors to invest in wind energy capacity additions because other variables were more relevant in this regard. Nevertheless, oil prices have a significant impact on wind capacity additions.
Finally, the fact that wind capacity additions and a higher wind capacity factor positively influence further wind capacity additions through a lower electricity price due to a higher penetration of wind electricity (merit order effect), leading to a higher electricity demand, is an interesting result, which is against the argument that wind can be the victim of its own success.
Supplementary Materials
The following are available online at https://www.mdpi.com/1996-1073/12/10/1944/s1, Data S1: Model Database in Spreadsheet format.
Author Contributions
All the authors contributed equally to this work.
Funding
This research received funding from the Faculty of Law and Social Sciences, University of Castilla–La Mancha and the Ministry of Education, Culture and Sport grants for training university teachers (FPU).
Acknowledgments
We thank three anonymous reviewers for their valuable comments which have contributed to the improvement of this paper.
Conflicts of Interest
The authors declare no conflict of interest.
References
- Renewable Energy Policy Network for the 21st Century. Renewables 2018 Global Status Report; REN21: Paris, France, 2018. [Google Scholar]
- Fouquet, R. The Slow Search for Solutions: Lessons from Historical Energy Transitions by Sector and Service. Energy Policy 2010, 38, 6586–6596. [Google Scholar] [CrossRef]
- Grübler, A.; Nakićenović, N.; Victor, D.G. Dynamics of Energy Technologies and Global Change. Energy Policy 1999, 27, 247–280. [Google Scholar] [CrossRef]
- Kramer, G.J.; Haigh, M. No quick switch to low-carbon energy. Nature 2009, 462, 5682009. [Google Scholar] [CrossRef] [PubMed]
- McDowall, W.; Ekins, P.; Radošević, S.; Zhang, L.-Y. The development of wind power in China, Europe and the USA: How have policies and innovation system activities co-evolved? Technol. Anal. Strateg. Manag. 2013, 25, 163–185. [Google Scholar] [CrossRef]
- Negro, S.O.; Alkemade, F.; Hekkert, M.P. Why does renewable energy diffuse so slowly? A review of innovation system problems. Renew. Sustain. Energy Rev. 2012, 16, 3836–3846. [Google Scholar] [CrossRef] [Green Version]
- Rosenberg, N. Perspectives on Technology; Cambridge University Press: New York, NY, USA, 1976. [Google Scholar]
- International Renewable Energy Agency. Renewable Capacity Statistics; IRENA: Abu Dhabi, UAE, 2018. [Google Scholar]
- International Energy Agency. Energy Technology Perspectives; IEA: Paris, France, 2015. [Google Scholar]
- Carley, S. State Renewable Energy Electricity Policies: An Empirical Evaluation of Effectiveness. Energy Policy 2009, 37, 3071–3081. [Google Scholar] [CrossRef]
- Popp, D.; Hascic, I.; Medhi, N. Technology and the Diffusion of Renewable Energy. Energy Econ. 2011, 33, 648–662. [Google Scholar] [CrossRef]
- Del Río, P.; Tarancón, M.A. Analysing the Determinants of On-Shore Wind Capacity Additions in the EU: An Econometric Study. Appl. Energy 2012, 95, 12–21. [Google Scholar] [CrossRef]
- Aguirre, M.; Ibikunle, G. Determinants of Renewable Energy Growth: A Global Sample Analysis. Energy Policy 2014, 69, 374–384. [Google Scholar] [CrossRef]
- Dong, C.G. Feed-in Tariff vs. Renewable Portfolio Standard: An Empirical Test of Their Relative Effectiveness in Promoting Wind Capacity Development. Energy Policy 2012, 42, 476–485. [Google Scholar] [CrossRef]
- Marques, A.C.; Fuinhas, J.A.; Pires Manso, J.R. Motivations Driving Renewable Energy in European Countries: A Panel Data Approach. Energy Policy 2010, 38, 6877–6885. [Google Scholar] [CrossRef]
- Kim, K.; Heo, E.; Kim, Y. Dynamic Policy Impacts on a Technological-Change System of Renewable Energy: An Empirical Analysis. Environ. Resour. Econ. 2017, 66, 205–236. [Google Scholar] [CrossRef]
- Menz, F.C.; Vachon, S. The Effectiveness of Different Policy Regimes for Promoting Wind Power: Experiences from the States. Energy Policy 2006, 34, 1786–1796. [Google Scholar] [CrossRef]
- Zhao, Z.-Y.; Yan, H.; Zuo, J.; Tian, Y.-X.; Zillante, G. A Critical Review of Factors Affecting the Wind Power Generation Industry in China. Renew. Sustain. Energy Rev. 2013, 19, 499–508. [Google Scholar] [CrossRef]
- Del Río, P.; Mir-Artigues, P. The Economics and Policy of Solar Photovoltaic Generation, 1st ed.; Springer International Publishing: Cham, Switzerland, 2016. [Google Scholar]
- Kilinc-Ata, N. The Evaluation of Renewable Energy Policies across EU Countries and US States: An Econometric Approach. Energy Sustain. Dev. 2016, 31, 83–90. [Google Scholar] [CrossRef]
- Del Río, P.; Mir-Artigues, P. Support for Solar PV Deployment in Spain: Some Policy Lessons. Renew. Sustain. Energy Rev. 2012, 16, 5557–5566. [Google Scholar] [CrossRef]
- Mitchell, C.; Sawin, J.L.; Pokharel, G.R.; Kammen, D.; Wang, Z.; Fifi ta, S.; Jaccard, M.; Langniss, O.; Lucas, H.; Nadai, A.; et al. Financing and Implementation. In IPCC Special Report on Renewable Energy Sources and Climate Change Mitigation; Edenhofer, O., Pichs-Madruga, R., Sokona, Y., Seyboth, K., Matschoss, P., Kadner, S., Zwickel, T., Eickemeier, P., Hansen, G., Schlömer, S., et al., Eds.; Cambridge University Press: Cambridge, UK; New York, NY, USA, 2011. [Google Scholar]
- Dinica, V. Support Systems for the Diffusion of Renewable Energy Technologies—An Investor Perspective. Energy Policy 2006, 34, 461–480. [Google Scholar] [CrossRef]
- Haas, R.; Panzer, C.; Resch, G.; Ragwitz, M.; Reece, G.; Held, A. A Historical Review of Promotion Strategies for Electricity from Renewable Energy Sources in EU Countries. Renew. Sustain. Energy Rev. 2011, 15, 1003–1034. [Google Scholar] [CrossRef]
- European Wind Energy Association. The Economics of Wind Energy; EWEA: Brussels, Belgium, 2009. [Google Scholar]
- Mone, C.; Stehly, T.; Maples, B.; Settle, E. 2014 Cost of Wind Energy Review; National Renewable Energy Laboratory: Denver West Parkway Golden, CO, USA, 2015. [Google Scholar]
- Breeze, P. Power Generation Technologies, 2nd ed.; Newnes; Elsevier Ltd.: Newnes, New South Wales, Australia, 2014. [Google Scholar]
- Wiser, R.; Bolinger, M. 2015 Wind Technologies Market Report; U.S. Department of Energy (DOE): Oak Ridge, TN, USA, 2015.
- Lantz, E.; Wiser, R.; Hand, M. IEA Wind Task 26: The Past and Future Cost of Wind Energy; National Renewable Energy Laboratory: Denver West Parkway Golden, CO, USA, 2012. [Google Scholar]
- Johnstone, N.; Haščič, I.; Popp, D. Renewable Energy Policies and Technological Innovation: Evidence Based on Patent Counts. Environ. Resour. Econ. 2010, 45, 133–155. [Google Scholar] [CrossRef]
- Chang, T.H.; Huang, C.M.; Lee, M.C. Threshold Effect of the Economic Growth Rate on the Renewable Energy Development from a Change in Energy Price: Evidence from OECD Countries. Energy Policy 2009, 37, 5796–5802. [Google Scholar] [CrossRef]
- Appunn, K. Setting the Power Price: The Merit Order Effect. Clean Energy Wire Factsheet. 2015. Available online: https://www.cleanenergywire.org/factsheets/setting-power-price-merit-order-effect#dossier-References (accessed on 9 July 2018).
- Piria, R.; Lorenzoni, A.; Mitchell, C.; Timpe, C.; Klessmann, C.; Resch, G.; Groscurth, H.; Neuhoff, K.; Ragwitz, M.; del Río, P.; et al. Ensuring Renewable Electricity Investments; 14 Policy Principles for a Post-2020 Perspective. Available online: http://remunerating-res.eu/wp-content/uploads/2013/04/14principlespost2020.pdf (accessed on 9 July 2018).
- Boßmann, T.; Sonja Föster, L.J.; del Río, P. Appropriate Policy Portfolios for (Nearly) Mature RES Technologies (Report D3.2.1). In the European Intelligent Energy-Europe Project Towards 2030-Dialogue, European Commission and Executive Agency for Small and Medium-sized Enterprises (EASME). 2016. Available online: http://towards2030.eu/sites/default/files/Appropriate policy portfolios for (nearly) mature RES-E technologies.pdf (accessed on 9 July 2018).
- Marques, A.C.; Fuinhas, J.A. Are Public Policies towards Renewables Successful? Evidence from European Countries. Renew. Energy 2012, 44, 109–118. [Google Scholar] [CrossRef]
- Red Eléctrica de España. El Sistema Eléctrico Español-Avance 2017; Red Eléctrica de España: Alcobendas, Madrid, 2017. [Google Scholar]
- The Statistical Office of the European Union (EUROSTAT). Available online: https://ec.europa.eu/eurostat/data/database (accessed on 7 November 2016).
- The International Renewable Energy Agency (IRENA). Available online: https://www.irena.org/Statistics/View-Data-by-Topic/Capacity-and-Generation/Query-Tool (accessed on 7 November 2016).
- Quandl Inc. Available online: https://www.quandl.com/data/ODA/PIORECR_USD-Iron-Ore-Price (accessed on 7 November 2016).
- The Annual Macro-Economic Database of the European Commission (AMECO). Available online: http://ec.europa.eu/economy_finance/ameco/user/serie/SelectSerie.cfm (accessed on 7 November 2016).
- BP plc. Available online: https://www.bp.com/en/global/corporate/energy-economics/statistical-review-of-world-energy/downloads.html (accessed on 7 November 2016).
- The International Energy Agency (IEA). Available online: https://www.iea.org/statistics/ (accessed on 7 November 2016).
- The National Commission on Markets and Competition (CNMC). Available online: http://data.cnmc.es/datagraph/ (accessed on 7 November 2016).
- Greene, W.H. Econometric Analysis, 7th ed.; Pearson Education Limited: Harlow Essex, UK, 2012. [Google Scholar]
- Intrilligator, M.D.; Bodkin, R.G.; Hsiao, C. Econometric Models, Techniques and Applications, 2nd ed.; Prentice Hall: Upper Saddle River, NJ, USA, 1996. [Google Scholar]
- Hausman, J.A. Specification Tests in Econometrics. Econometrica 1978, 46, 1251–1271. [Google Scholar] [CrossRef]
- Henningsen, A.; Hamman, J.D. Systemfit: A Package for Estimating Systems of Simultaneous Equations in R. J. Stat. Softw. 2007, 23, 1–40. [Google Scholar] [CrossRef]
- MacKinnon, J.G. Numerical Distribution Functions for Unit Root and Cointegration Tests. J. Appl. Econom. 1996, 11, 601–618. [Google Scholar] [CrossRef]
Figure 1.
Installed capacity of wind power generation in Spain (2000–2015, TWh). Source: European Commission.
Figure 1.
Installed capacity of wind power generation in Spain (2000–2015, TWh). Source: European Commission.

Figure 2.
Illustrating the model specification. Source: own elaboration.

Figure 3.
Time series and autocorrelation functions of residuals. Source: own elaboration.


Table 1.
Econometric studies on the determinants of RES-E.
| Article | Scope (Technological, Temporal, Geographical) | Determinants Included in the Model | Methodology | Results |
|---|---|---|---|---|
| [17] | Wind energy. 1998–2003 39 states in the USA. | Wind energy development (dependent variable), renewable portfolio standard (RPS), fuel generation disclosure requirements (FGD), mandatory green power opinion (MGPO), public benefits funds (PBF), retail choice (RET). | Econometric techniques. Uniequational model. Panel data. Ordinary Least Squares (OLS) methods. | Statistically significant: (+) RPS (+) MGPO, (+) RPS experience, (+) MGPO experience, (−) RET experience. |
| [10] | Renewable energy. 1998–2006 50 states of the USA. | RES percentage in electricity generation (dependent variable), total amount of annual RES generation (dependent), RPS policy, state’s environmental policy, number of per capita state and local employees in natural resource governmental positions, percentage of total gross state product (GSP), per capita GSP, growth rate of population, annual amount of total electricity generated divided by the associated state population per year, deregulation, price of electricity, natural resource endowment, subsidy policies index, tax incentive index. | Econometric techniques. Uniequational model. Panel data. Fixed effects (FE) and fixed effects vector decomposition method (FEVD). | RES share: Statistically significant: (+) house score, (+) per capita natural resource employees, (−) petrol/coal manufacturing GSP, (+) GSP per capita, (−) electricity price, (−) electricity use per capita, (+) percent regional RPS, that in both FE and FEVD model; (−) wind and biomass potential, (+) solar potential, (−) tax index, (+) subsidy index, (−) deregulation for FEVD model. Not statistically significant: (−) RPS and growth rate of population. Total RES: Statistically significant: (+) RPS, (+) GSP per capita, (+) percent regional RPS, (−) per capita natural resource employees, (−) wind potential, (+) biomass and solar potential, (−) tax index, (+) subsidy index, (+) deregulation. Not statistically significant: (−) house score for FE, (+) petrol/coal manufacturing GSP, (+) growth rate of population, (+) electricity price, (−) electricity use per capita. |
| [15] | Renewable energy 1990–2006 EU countries. | Contribution of RES to energy supply (dependent variable), CO2 per capita, per capita energy consumption, import dependency of energy, share of coal, oil, gas and nuclear in electricity generation, surface area, coal, natural gas and oil prices, EU’s member in 2001 and real GDP. | Econometric techniques. Uniequational model. Panel data. FE, FEVD and OLS method. | Statistically significant: (−) CO2 emissions, (+) energy per capita, (−) the lobby of coal and oil, (+) energy dependency, (+) income effect for all EU Members, (−) income effect for non-EU Members, (+) oil price and coal price for EU Members, (+) natural gas price for all countries and EU Members, (−) coal price for Non-EU Members, (+) continuous commitment for EU Members and (−) for non-EU Members, (+) geographic area. |
| [11] | Wind, solar photovoltaic, geothermal, biomass and waste. 1990–2004 26 OECD countries. | Investment per capita in capacity of RE (dependent variable), knowledge stock, GDP per capita, % growth of electricity consumption, % electricity production from nuclear and hydro, Kyoto Protocol ratified, natural gas, coal and oil production per capita, % of energy imported, feed-in tariffs, renewable energy certificate and other RES policy. | Econometric techniques. Uniequational model. Panel data. FE method. | The effect of knowledge is significant (+) only for wind and biomass, and it is not influenced by country characteristics. If country fixed effects are considered, then knowledge remains significant in the overall regression. The % of clean substitutes is significant (+) for wind. Ratifying Kyoto is significant (+) for wind and biomass. Individual RES policies are not significant. Ratifying Kyoto has a larger impact on investment than new knowledge. Reducing carbon emissions is the primary driver of RES investments. Natural resources and the % of energy imported by a country are insignificant. |
| [12] | Wind energy. 2006–2008 EU Member States. 23 countries. | Wind capacity additions between 2006 and 2008 (dependent variable), wind resource potentials, support levels, electricity generation costs, type of support scheme, administrative barriers, social acceptance, general investment climate, electricity demand, share of hydro and nuclear in electricity generation, country area, dummy variable that represents minor or major changes in support scheme. | Econometric techniques. Uniequational model. Cross-section data. | Statistically significant: (−) administrative barriers, (−) changes in support scheme, (−) minor changes in support scheme, (+) business competitiveness index, (+) FITs support (only for model 1, i.e. without electricity demand and share of nuclear and hydro). Not statistically significant: (+) level of support, (−) available wind resources, (+) FIT support, (−) social acceptance of wind energy, (+) area, (+) electricity demand, (−) share of nuclear and hydro. |
| [14] | Wind energy. 2005–2009 53 countries. | Total wind installed capacity (dependent variable), feed-in tariff, renewable portfolio standard, interaction of FIT and RPS, gross domestic production per capita, total electricity net consumption, oil imports minus exports, metric tons of carbon dioxide, wind resources, other policies. | Econometric techniques. Uniequational model. Panel data. FE and OLS method. | Results confirm that a FIT is more effective than RPS in promoting wind capacity development. RPS could provide some incentives to developers in the short-term. Deploying wind power is highly responsive to satisfying the electricity demand of this country. The variable CO2 emission is statistically significant. |
| [13] | Renewable energy 1990–2010 38 countries (EU, OECD and five BRICS). | Contribution of RES to energy supply (dependent variable), public policies, ratification of the Kyoto protocol, energy security, CO2 emissions, prices of oil, natural gas, coal and electricity, welfare, contribution of traditional energy sources to electricity generation, energy needs, renewables potential, deregulation of the electricity market, continuous commitment. | Econometric techniques. Uniequational model. Panel data. FEVD and PCSE method. | Statistically significant: (+) CO2 emissions, (−) energy use, (+) Kyoto Protocol, (−) % coal, natural gas and nuclear power in electricity generation, (−) renewable energy potential, (−) industry electricity rates, (+) continuous commitment, (+) biomass and solar potential, (−) fiscal and financial policy variables, (−) voluntary instruments, (+) negotiated agreements. |
| [16] | Solar PV 1992–2007 16 OECD countries Wind power 1991–2006 13 OECD countries | The proportion of patent applications for RE technology to total patent applications (dependent variable for invention model), Installed system cost (dependent variable for innovation model), Cumulative installed capacity (dependent variable por diffusion model). Cumulative installed capacity, market opportunities, domestic and overseas knowledge stock, technology-push policy, market-pull policies, national scientific resources, absorption capacity, public R&D, tariff incentives, RE obligations, environmental taxes, public investment, science resources, raw material prices, coal prices, electricity generation, GDP. | Quantitative. Econometric techniques. Uniequational model. Panel data. 3SLS method. | Policy outcomes create a virtuous cycle in the technological change system through market opportunity, learning-by-searching and learning-by-doing. The static impact of technology-push and tariff incentive policies are effective on invention and renewables obligation and CO2 tax appear to encourage cost reduction in the technologies. When dynamic impacts of policy are considered, FIT appears to outperform renewables obligation policy with very small margin. Dynamic impact of CO2 tax varies with the level of technological development maturity. |
Source: own elaboration.
Table 2.
Factors determining the increase in wind installed capacity.
| Type | Factor |
|---|---|
| Technological Factors |
|
| Electricity-Market Factors |
|
| Socio-economic Factors |
|
| Policy Factors |
|
Source: own elaboration.
Table 3.
Factors determining the increase in wind installed capacity.
| Variable | Definition | Units | Source | Source (web) |
|---|---|---|---|---|
| WINDCAP (Dependent variable Equation (1)) | Installed Wind Capacity | MW | EUROSTAT/IRENA | [37,38] |
| Technoeconomic Factors | ||||
| IRON | Iron price | Value (US $ per metric ton) | QUANDL FINANCE | [39] |
| SR | Risk premium ([German long-term interest rate–Spanish long-term interest rate] × 100) | % | AMECO | [40] |
| LTIR | Real long-term interest rates, deflator GDP (ILRV) | % | AMECO | [40] |
| Electricity-Market Factors | ||||
| BRENT | Europe Brent Spot Price FOB | US $ per barrel | BP | [41] |
| ELECON (Dependent variable Equation (2)) | Final domestic consumption of electricity | Mtoe | EUROSTAT | [37] |
| PRICEL (Dependent variable Equation (3)) | Price of electricity for domestic final consumption (2500–5000 KWh). Taxes included. | Euro/kWh | IEA, EUROSTAT and own elaboration | [42,37] |
| PRIGAS | Price of natural gas | US$ per million Btu | BP | [41] |
| SHAREWIND (Dependent variable Equation (4)) | Share of electricity production from wind power | % | EUROSTAT and own elaboration | [37] |
| WINDLOAD | Wind annual average capacity factor | % | EUROSTAT | [37] |
| TRANS_TWH | Transport costs | Mill €/TWh | CNMC | [43] |
| Socio-Economic Factors | ||||
| GDP | Gross domestic product (constant 2010) | Mrd Euro | AMECO | [40] |
| Policy Factors | ||||
| PREMIUMS | FIT or FIP support schemes | Mill € | CNMC | [43] |
| PREM_TWH | Average support for RES | Mill €/TWh | CNMC | [43] |
| TAX_SHARE | Share of taxes on the price of domestic electricity (2500–5000 KWh) | % | EUROSTAT and own elaboration | [37] |
Source: own elaboration.
Table 4.
Estimation results. Standardized coefficients.
| Equation (1) | Equation (2) | Equation (3) | Equation (4) | |
|---|---|---|---|---|
| Intercept | −8.11079 *** | −4.42324 *** | −3.77958 *** | −4.25512 *** |
| ln WINDCAP | Dependent | - | - | 0.86314 *** |
| ln IRON | −0.24103 * | - | - | - |
| ln LTIR | −0.09873 | - | - | - |
| ln ELECON | 4.22806 *** | Dependent | - | - |
| ln SR | −0.09600 | - | - | - |
| ln PREMIUMS | 0.81412 *** | - | - | - |
| ln GDP | - | 1.02037 *** | - | - |
| ln PRICEL | - | −0.08489 ** | Dependent | - |
| ln BRENT | - | 0.04490 * | - | - |
| ln SHAREWIND | - | - | −0.15144 ** | Dependent |
| ln PRIGAS | - | - | 0.05520 | - |
| ln PREM_TWH | - | - | 0.07374 | - |
| ln TRANS_TWH | - | - | 0.84483 *** | - |
| ln TAX_SHARE | - | - | 0.24606 ** | - |
| ln WINDLOAD | - | - | - | 1.15392 *** |
| Adj. R-Squared | 0.9823 | 0.9762 | 0.9496 | 0.9972 |
Signif. codes (p-value): 0 ‘***’ 0.001 ‘**’ 0.01 ‘*’ 0.05 ‘.’ 0.1 ‘ ’ 1. Source: own elaboration.
© 2019 by the authors. Licensee MDPI, Basel, Switzerland. This article is an open access article distributed under the terms and conditions of the Creative Commons Attribution (CC BY) license (http://creativecommons.org/licenses/by/4.0/).
Share and Cite
MDPI and ACS Style
Quintana-Rojo, C.; Callejas-Albiñana, F.E.; Tarancón, M.-A.; del Río, P. Identifying the Drivers of Wind Capacity Additions: The Case of Spain. A Multiequational Approach. Energies 2019, 12, 1944. https://doi.org/10.3390/en12101944
AMA Style
Quintana-Rojo C, Callejas-Albiñana FE, Tarancón M-A, del Río P. Identifying the Drivers of Wind Capacity Additions: The Case of Spain. A Multiequational Approach. Energies. 2019; 12(10):1944. https://doi.org/10.3390/en12101944
Chicago/Turabian StyleQuintana-Rojo, Consolación, Fernando E. Callejas-Albiñana, Miguel-Angel Tarancón, and Pablo del Río. 2019. "Identifying the Drivers of Wind Capacity Additions: The Case of Spain. A Multiequational Approach" Energies 12, no. 10: 1944. https://doi.org/10.3390/en12101944
Note that from the first issue of 2016, this journal uses article numbers instead of page numbers. See further details here.