Experimental Study on Temperature Distribution and Heat Losses of a Molten Salt Heat Storage Tank


1
MOE Key Laboratory of Enhanced Heat Transfer and Energy Conservation and Key Laboratory of Heat Transfer and Energy Conversion, Beijing Education Commission, College of Environmental and Energy Engineering, Beijing University of Technology, Beijing 100124, China
2
State Key Laboratory of Advanced Power Transmission Technology (Global Energy Interconnection Research Institute), Changping District, Beijing 102211, China
*
Author to whom correspondence should be addressed.
Energies 2019, 12(10), 1943; https://doi.org/10.3390/en12101943
Submission received: 16 April 2019
/
Revised: 11 May 2019
/
Accepted: 15 May 2019
/
Published: 21 May 2019
(This article belongs to the Special Issue Solar Energy Harvesting, Storage and Application)
Abstract
:Two-tank molten salt heat storage systems are considered to be the most mature thermal storage technology in solar thermal power plants. As the key part of the system, the thermal performance of molten salt tanks is of great importance. An experimental thermal storage system with a new type of molten salt as a thermal energy storage medium has been built to investigate the temperature distribution of molten salt inside the tank during the cooling process from 550 °C to 180 °C. The temperature distribution of the salt was obtained, which reveals that temperature stratification appears at the bottom of the tank within the height of 200 mm. The position, with the maximum temperature difference of 16.1 °C, is at the lower edges of the molten salt storage tank. The temperature distribution was also measured to deepen our understanding of the insulation foundation, which shows that the maximum temperature appears at the middle upper part of the foundation and decreases radially. The heat losses of the molten salt tank were calculated by the classical equation, from which it was found that the heat loss decreases from 3.65 kWh to 1.82 kWh as the temperature of the molten salt drops from 550 °C to 310 °C. The effect of temperature stratification on the heat losses of the tank’s bottom was also analyzed.
1. Introduction
Concentrating Solar Power (CSP), as one of the renewable energy technologies, has been successfully applied commercially in several plants, and is now entering a commercial ramp-up period [1]. Unlike wind power generation and solar photovoltaic power generation, CSP has the ability to be combined with a thermal energy storage (TES) system, which can increase the dispatch ability of plants [2,3]. For this reason, CSP is becoming an important energy utilization direction.
Thermal energy storage improves the efficiency of CSP plants and can be used to balance the supply and demand [4]. So many newly constructed CSP plants have been assembled with TES. An example is the Crescent Dunes Solar Energy project, which is the largest solar tower power plant, with a capacity of 110 MWe and 10 h of thermal storage [5]. Among the different TES systems, the indirect two-tank molten salt storage system is widely used [6]. In this system, molten salt absorbs excess energy from the solar field through a heat exchanger at day time, and stores it in the tank for later use. During cloudy days and the evening, the stored energy is discharged to maintain the steam turbine at a specified load. As the key piece of equipment in a TES system, the molten salt tank not only determines the thermal storage of the system but also has a decisive effect on the efficiency of the power plant. Therefore, further research is required on the molten salt tank.
A molten salt tank is a vertical-vault-shaped vessel in a concentrating solar power plant. Even though the tank is highly insulated, heat losses cannot be prevented because of the high operation temperature (typically 386 °C and 565 °C for a hot tank in a parabolic trough and tower solar plants, respectively [7,8]). Heat losses of the tank to the surroundings cause the temperature to drop and an uneven distribution of the temperature of the molten salt inside the tank, which can induce a decline in the thermal efficiency of the TES system. Therefore, it is necessary to study heat losses and the temperature distribution in a molten salt tank.
A limited number of studies on heat losses and the temperature distribution of molten salt in TES systems have been carried out. Schulte-Fischedick et al. obtained the heat losses of an 880 MWh TES system by computational fluid dynamics (CFD) [9]. The results show that a high heat losses flux occurred at the lower edges of the salt storage tank (between the side wall and the bottom plate). Suarez et al. analyzed the cooling process of representative molten salt tanks during their standby periods and calculated the heat losses using a CFD model [10]. Zaversky et al. developed a fully transient heat loss model of a molten salt tank based on the Modelica modeling language and simulated it over three sets of six reference days, providing typical weather conditions of a solar thermal power plant’s location as model input [2]. Rodríguez et al. modeled molten salt tanks by proposing a parallel modular object-oriented methodology that considers that there are different elements for the storage system [11]. With respect to experimental studies, Bradshaw et al. reported measurements of heat losses in a hot tank and a cold tank in the Solar Two Project; however, the temperature distribution was not given [12]. Prieto et al. presented the temperature distribution inside a tank and the heat losses of the tank at the highest molten salt temperature of 370 °C in the pilot plant built at the University of Lleida [13]. Significantly, the highest operating temperature of molten salt solar power tower plants is 535~565 °C; there may be some that operate at a temperature from 380 to 300 °C during the cooling down process, but no experimental study on the temperature distribution of molten salt inside the tank at that temperature range is available. Moreover, thermal stratification often appears in liquid tanks based on the buoyancy mechanism [14,15]; however, it has not been analyzed in previous articles about molten salt tanks.
Molten salt has a high melting point, which represents a risk of local solidification during long standby periods, so it is crucial to identify locations where the onset of local solidifications occurs during the cooling down process. Therefore, it is necessary to study heat losses and the temperature distribution in a molten salt tank. However, no experimental research has been done on the temperature distribution of molten salt during the solidification process.
Different from the uniform foundation structure in an experimental TES system [13], the insulation foundation of a commercial TES system is used to support the tank and reduce heat losses from the tank’s bottom with a structure that is comprised of two separate radial zones, which are constructed from foam glass and firebrick [12]. The difference between the two types of structure is that they may have different impacts on the temperature distribution during natural cooling. To achieve a deep understanding of a TES system’s thermal performance that more closely approaches actual results, a structure that is similar to an insulation foundation is used in the experimental tank in this study. Meanwhile, since the highest operation temperatures of concrete and foam glass are 480 °C and 100 °C, respectively, it is necessary to study the temperature distribution of the insulation foundation to ensure safe operation. However, no studies have addressed this problem.
In this work, an experimental TES system is built to research the thermal property of a high-temperature molten salt tank during the cooling down process. The objectives are: (a) to obtain the temperature distribution of the molten salt and the insulation foundation during the natural cooling process from 550 °C to 310 °C; (b) to confirm or deny through the experiments whether thermal stratification appears and the influence of thermal stratification; (c) to obtain the temperature distribution of the molten salt during the solidification process; and (d) to analyze the heat loss of the experimental TES tank.
2. Materials and Methods
2.1. Molten Salt Tank and Insulation System
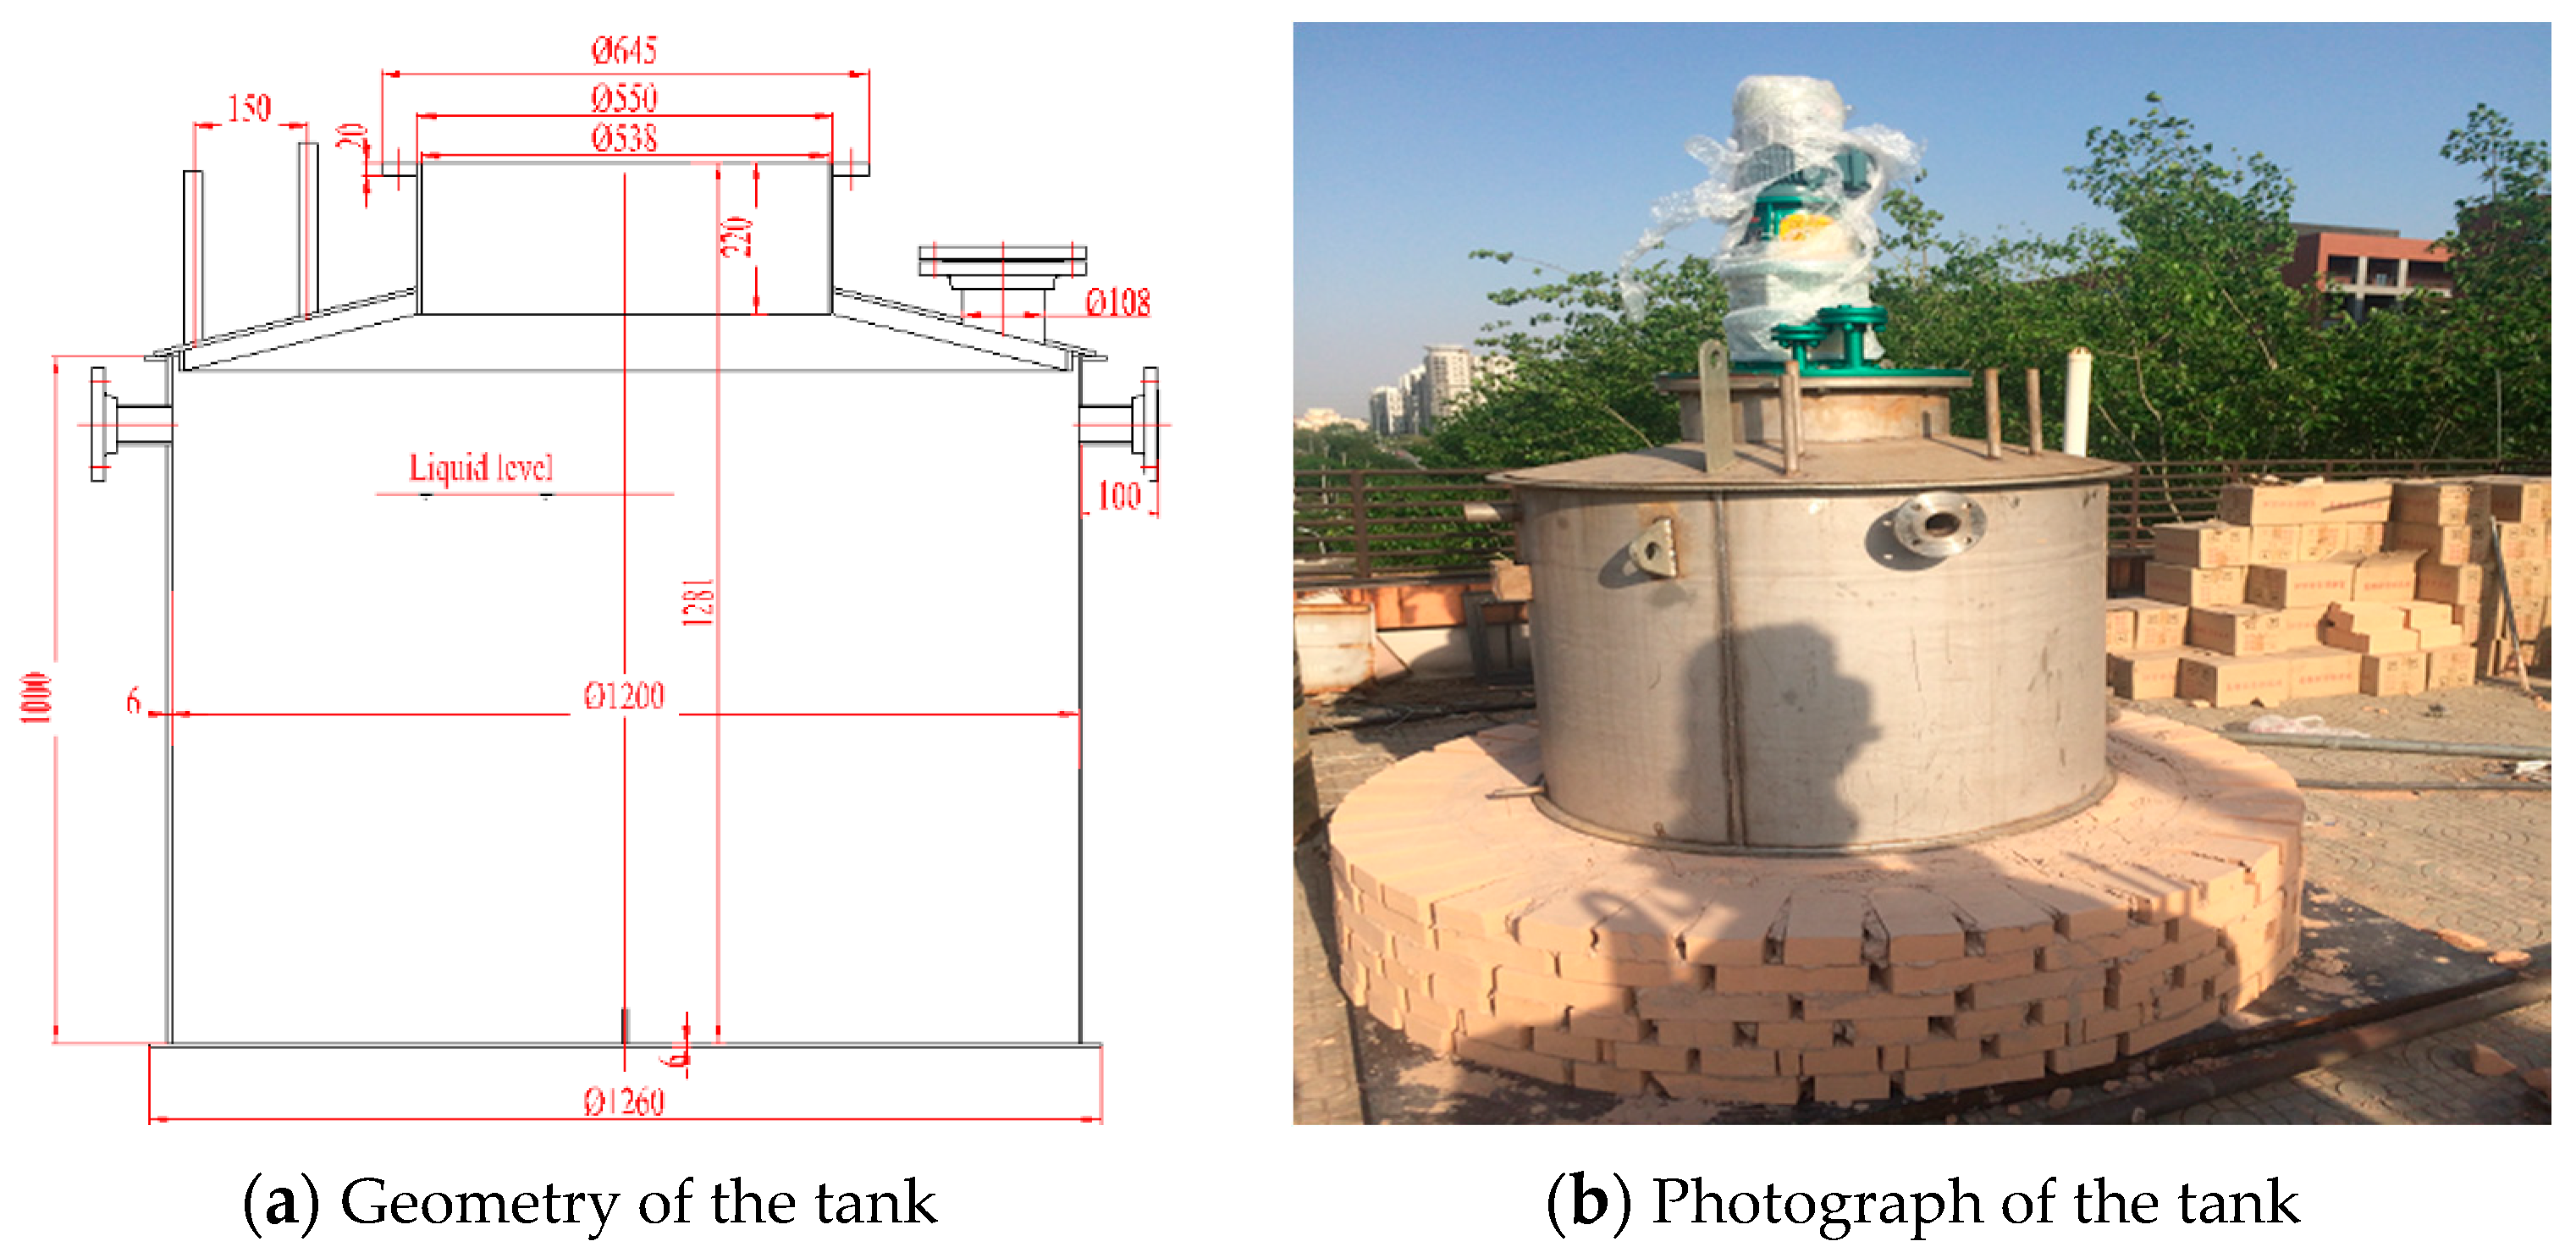
Similar to the Solar Two Project, the experimental molten salt tank, which is a vertical-vault-shaped tank with a plate bottom, as shown in Figure 1, is made of stainless steel 304 in order to avoid corrosion from the molten salt. A 10 kW immersion electric heater is set to heat the molten salt at the beginning of the experiment. The main geometrical characteristics of the tank are the shown in Table 1.
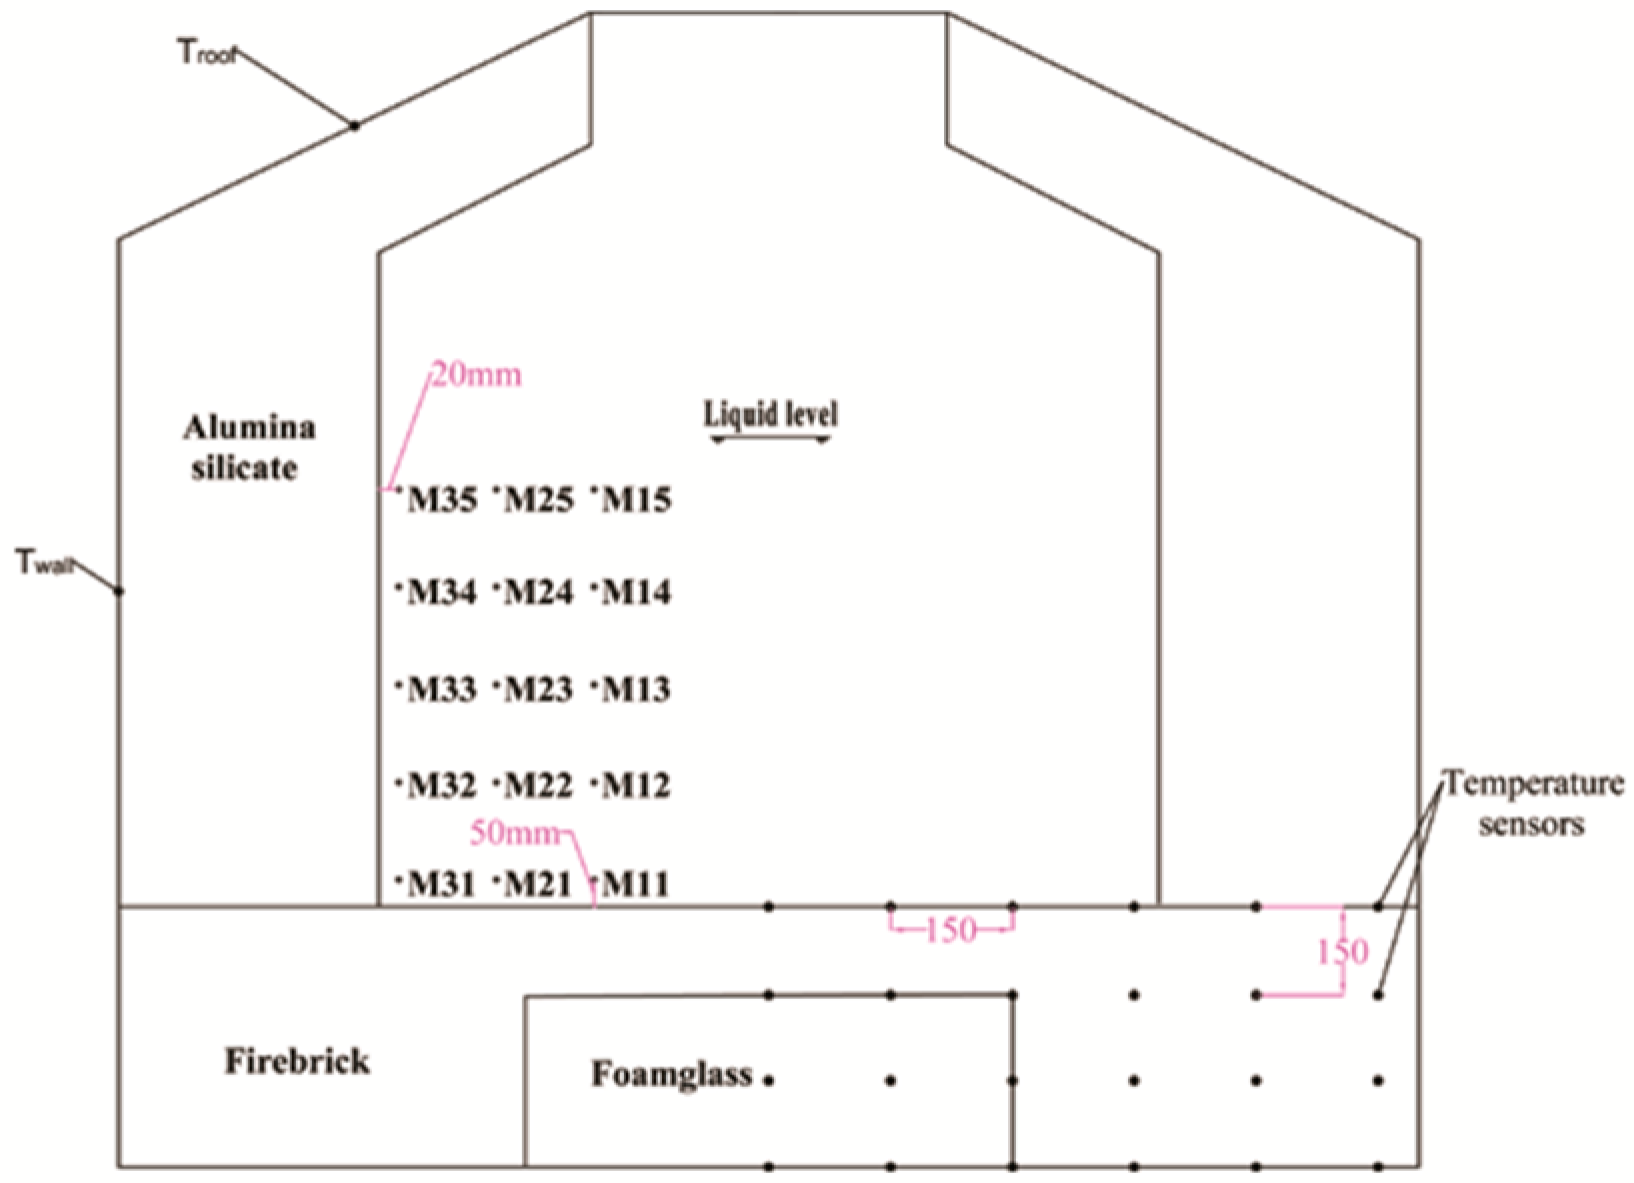
To reduce heat losses of the tank, the wall and roof of the tank are insulated by alumina silicate fiber boards with a thickness of 350 mm and 200 mm, respectively. The insulation foundation is comprised of two separate zones as shown in Figure 2. Firebricks are used to build the outer ring wall to support the weight of the entire tank. In the center of the foundation, foam glass is selected because of its low heat conductivity. Since the maximum permissible temperature of the foam glass is about 482 °C, firebricks with a thickness of 150 mm are located on the top of the foam glass in direct contact with the bottom of the tank. The properties of the insulation materials provided by the manufacturer are listed in Table 2.
A passive cooling system is required to prevent the reinforced concrete from being overheated [16]. To simulate the heat losses of the tank’s foundation, the insulation foundation of the tank is placed on a steel plate with steel supports so that the bottom of the insulation foundation can be cooled by air flowing through the interspaces of the steel supports, which can also protect the concrete floor from high temperatures.
2.2. Temperature Sensors
As can be seen from Figure 2, many temperature sensors (PT-100), with an accuracy of ±0.1 °C, are set to measure the temperature distribution. In the tank, 15 temperature sensors are set at five levels and in three columns, with an interval distance of 150 mm. The sensors are 20 mm and 50 mm distant from the wall and bottom. There are 24 temperature sensors located inside the insulation foundation, which are set at four levels and in six columns with an equal interval distance of 150 mm.
2.3. Molten Salt Material
A new kind of quaternary nitrate molten salt, namely Hitec salt with a Ca(NO3)2 additive (16.67%wtCa(NO3)2·4H2O + 44.17%wtKNO3 + 5.83%wtNaNO3 + 33.33%wtNaNO2), was used. The experiment used 1400 kg of this molten salt with a liquid level of 740 mm (at 550 °C). The properties of this material are presented in Table 3.
2.4. Methodology
Before the experiment began, the molten salt was heated to a homogenous 550 °C using the immersion electric heater. Then, we shut down the electric heater and started to record the temperatures.
2.4.1. Temperature Distribution Tests
After switching off the electric heater, the temperatures of the molten salt begin to decrease and the temperature distribution test was started. The test contains two stages. The first stage is called the cooling down process, in which the liquid salt cools down from 550 °C to 310 °C. At the beginning of the second stage, molten salt is pumped from the bottom of the tank and returned via a ring header at the top until the temperature drops to 300 °C, which makes the temperature more uniform. Then, the temperatures are recorded from 300 °C to about 180 °C, which indicates the solidification process of the salt.
2.4.2. Heat Losses
Heat loss is recognized as an extremely important parameter in the thermal efficiency of TES. An effective way to obtain the heat losses of a tank is to calculate them from temperature difference data. In this work, an uneven temperature distribution of the molten salt inside the tank appears because of the heat losses to the surroundings, so the mean temperature of molten salt can be calculated as the arithmetic average of the 15 recorded temperatures and heat losses. Qheatloss can be obtained by Equation (1):
where Caveraage represents the mean temperature of the specific heat of the molten salt, m is the weight of the molten salt in the tank, and Tt, Tt+Δt are the mean temperatures of the molten salt at time t and t + Δt, respectively.
Meanwhile, Qheatloss can be divided into three parts: the heat losses of the tank’s external walls Qwall, the heat losses of the tank’s roof Qroof, and the heat losses of the tank’s bottom Qbottom.
To calculate the heat losses of each part, we make the following assumptions:
- (1)
- The insulated roof surface is geometrically an inclined plane;
- (2)
- The effect of the pump on the heat losses is approximately equal to the convection heat transfer calculated in an equivalent area;
- (3)
- The temperature sensors Twall and Troof are representative for all of the areas that they represent.
Thus, Qwall, Qroof can be calculated by the classical formulas:
where Twall, Troof are the temperatures of the insulation wall and the insulation roof, respectively. Tatm represents the atmospheric temperature. Awall, Aroof are the areas of the insulation wall and the insulation roof, respectively. αwall, αroof indicate the heat transfer coefficients of the insulation wall and the insulation roof, respectively. Therefore, Qwall, Qroof can be confirmed by calculating awall and aroof when the temperature difference is measured.
Due to the heat exchange between the outer surface of the tank and the ambient environment happens via convection and radiation, the heat transfer coefficients awall and aroof consist of the convection heat transfer coefficient ac and the radiation heat transfer coefficient ar, which can be estimated by the relationships described in publication [18]. In the calculation, a standard wind velocity of 2 was taken.
Through the above calculation, the heat losses of the bottom of the foundation to the ambient environment Qbottom can be determined as Equation (4).
3. Results and Discussion
3.1. Temperature Distribution from 550 to 310 °C
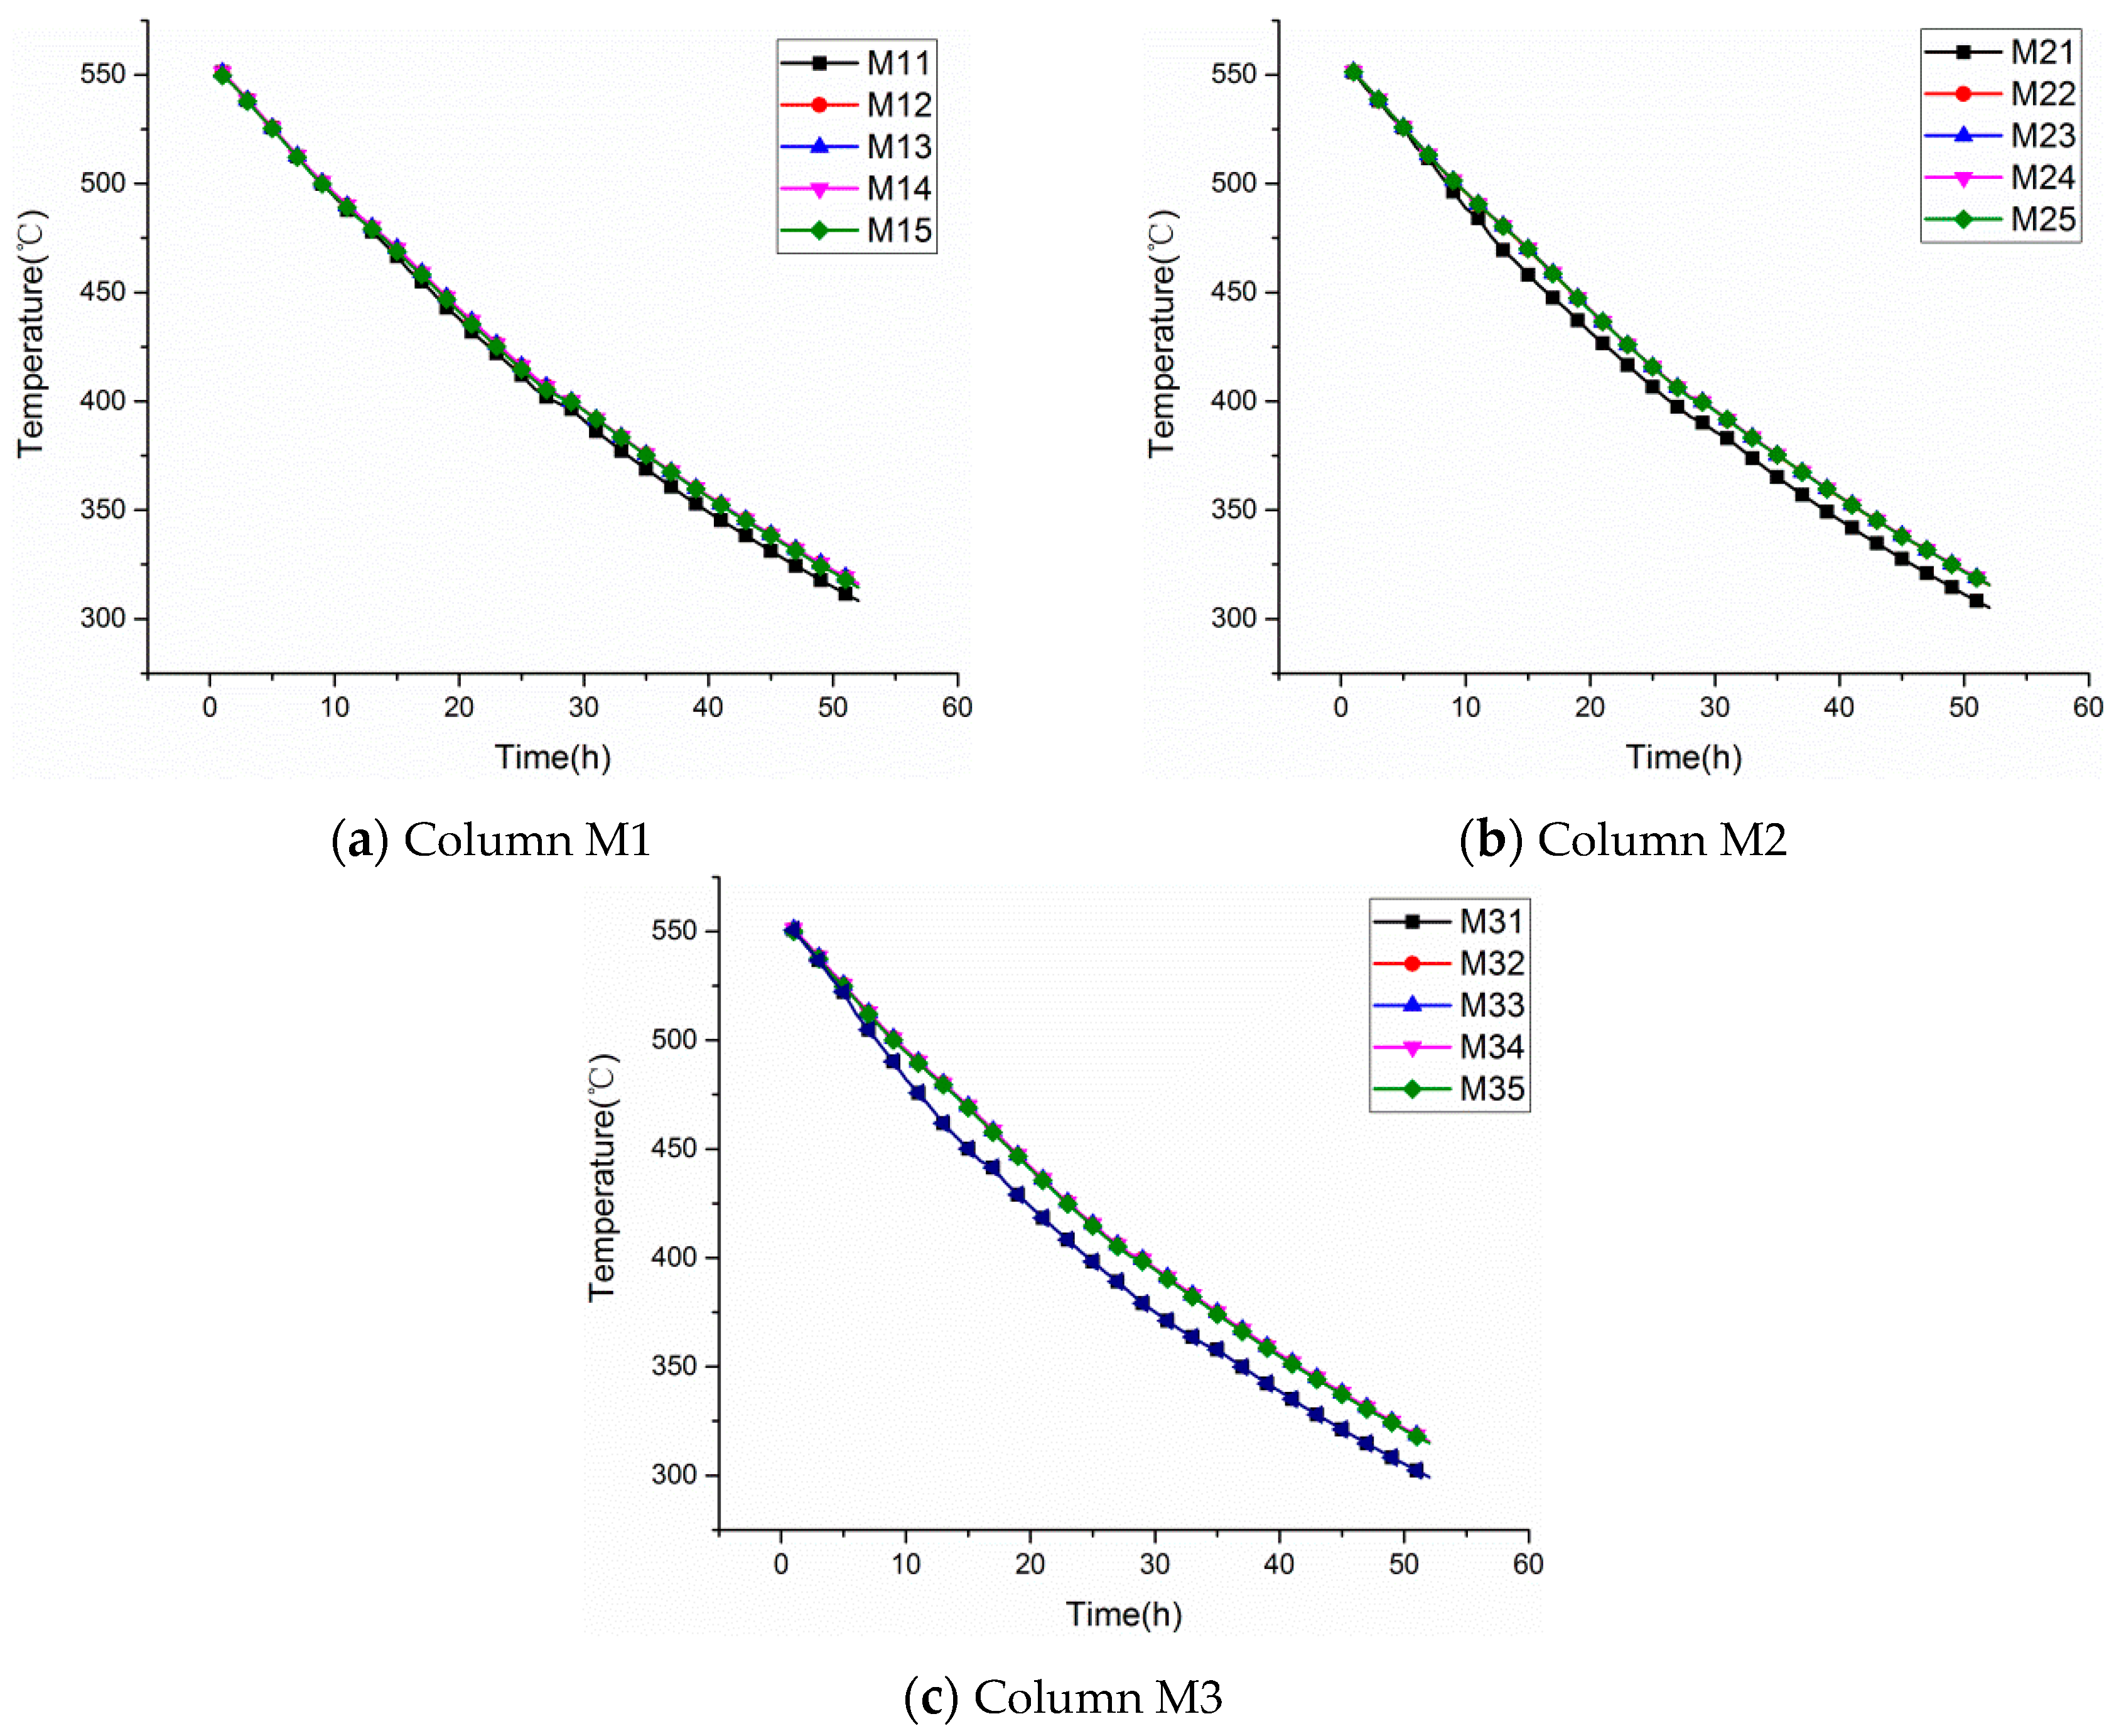
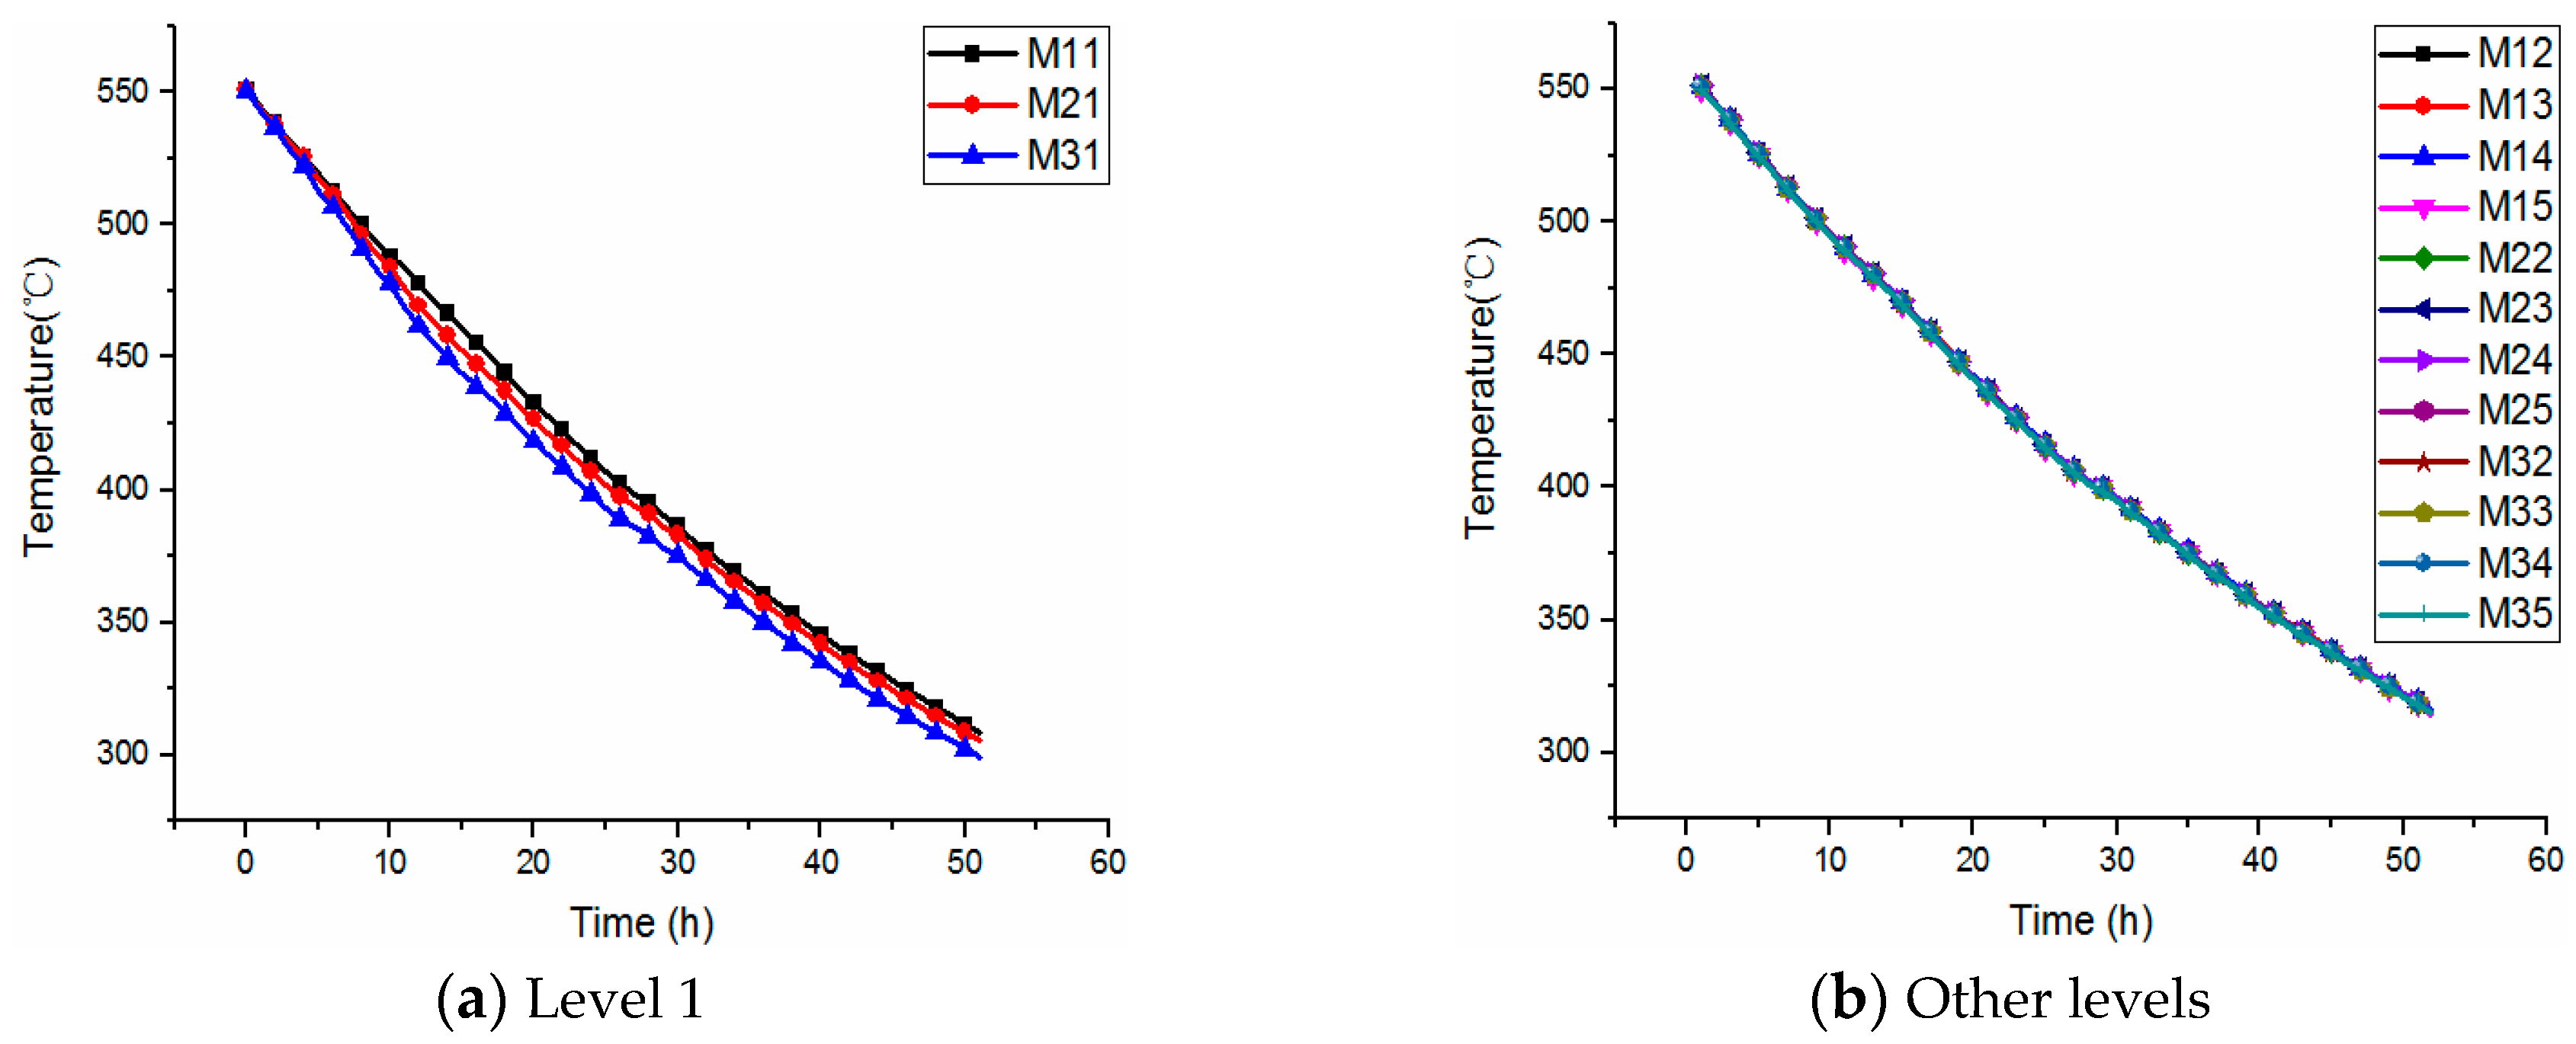
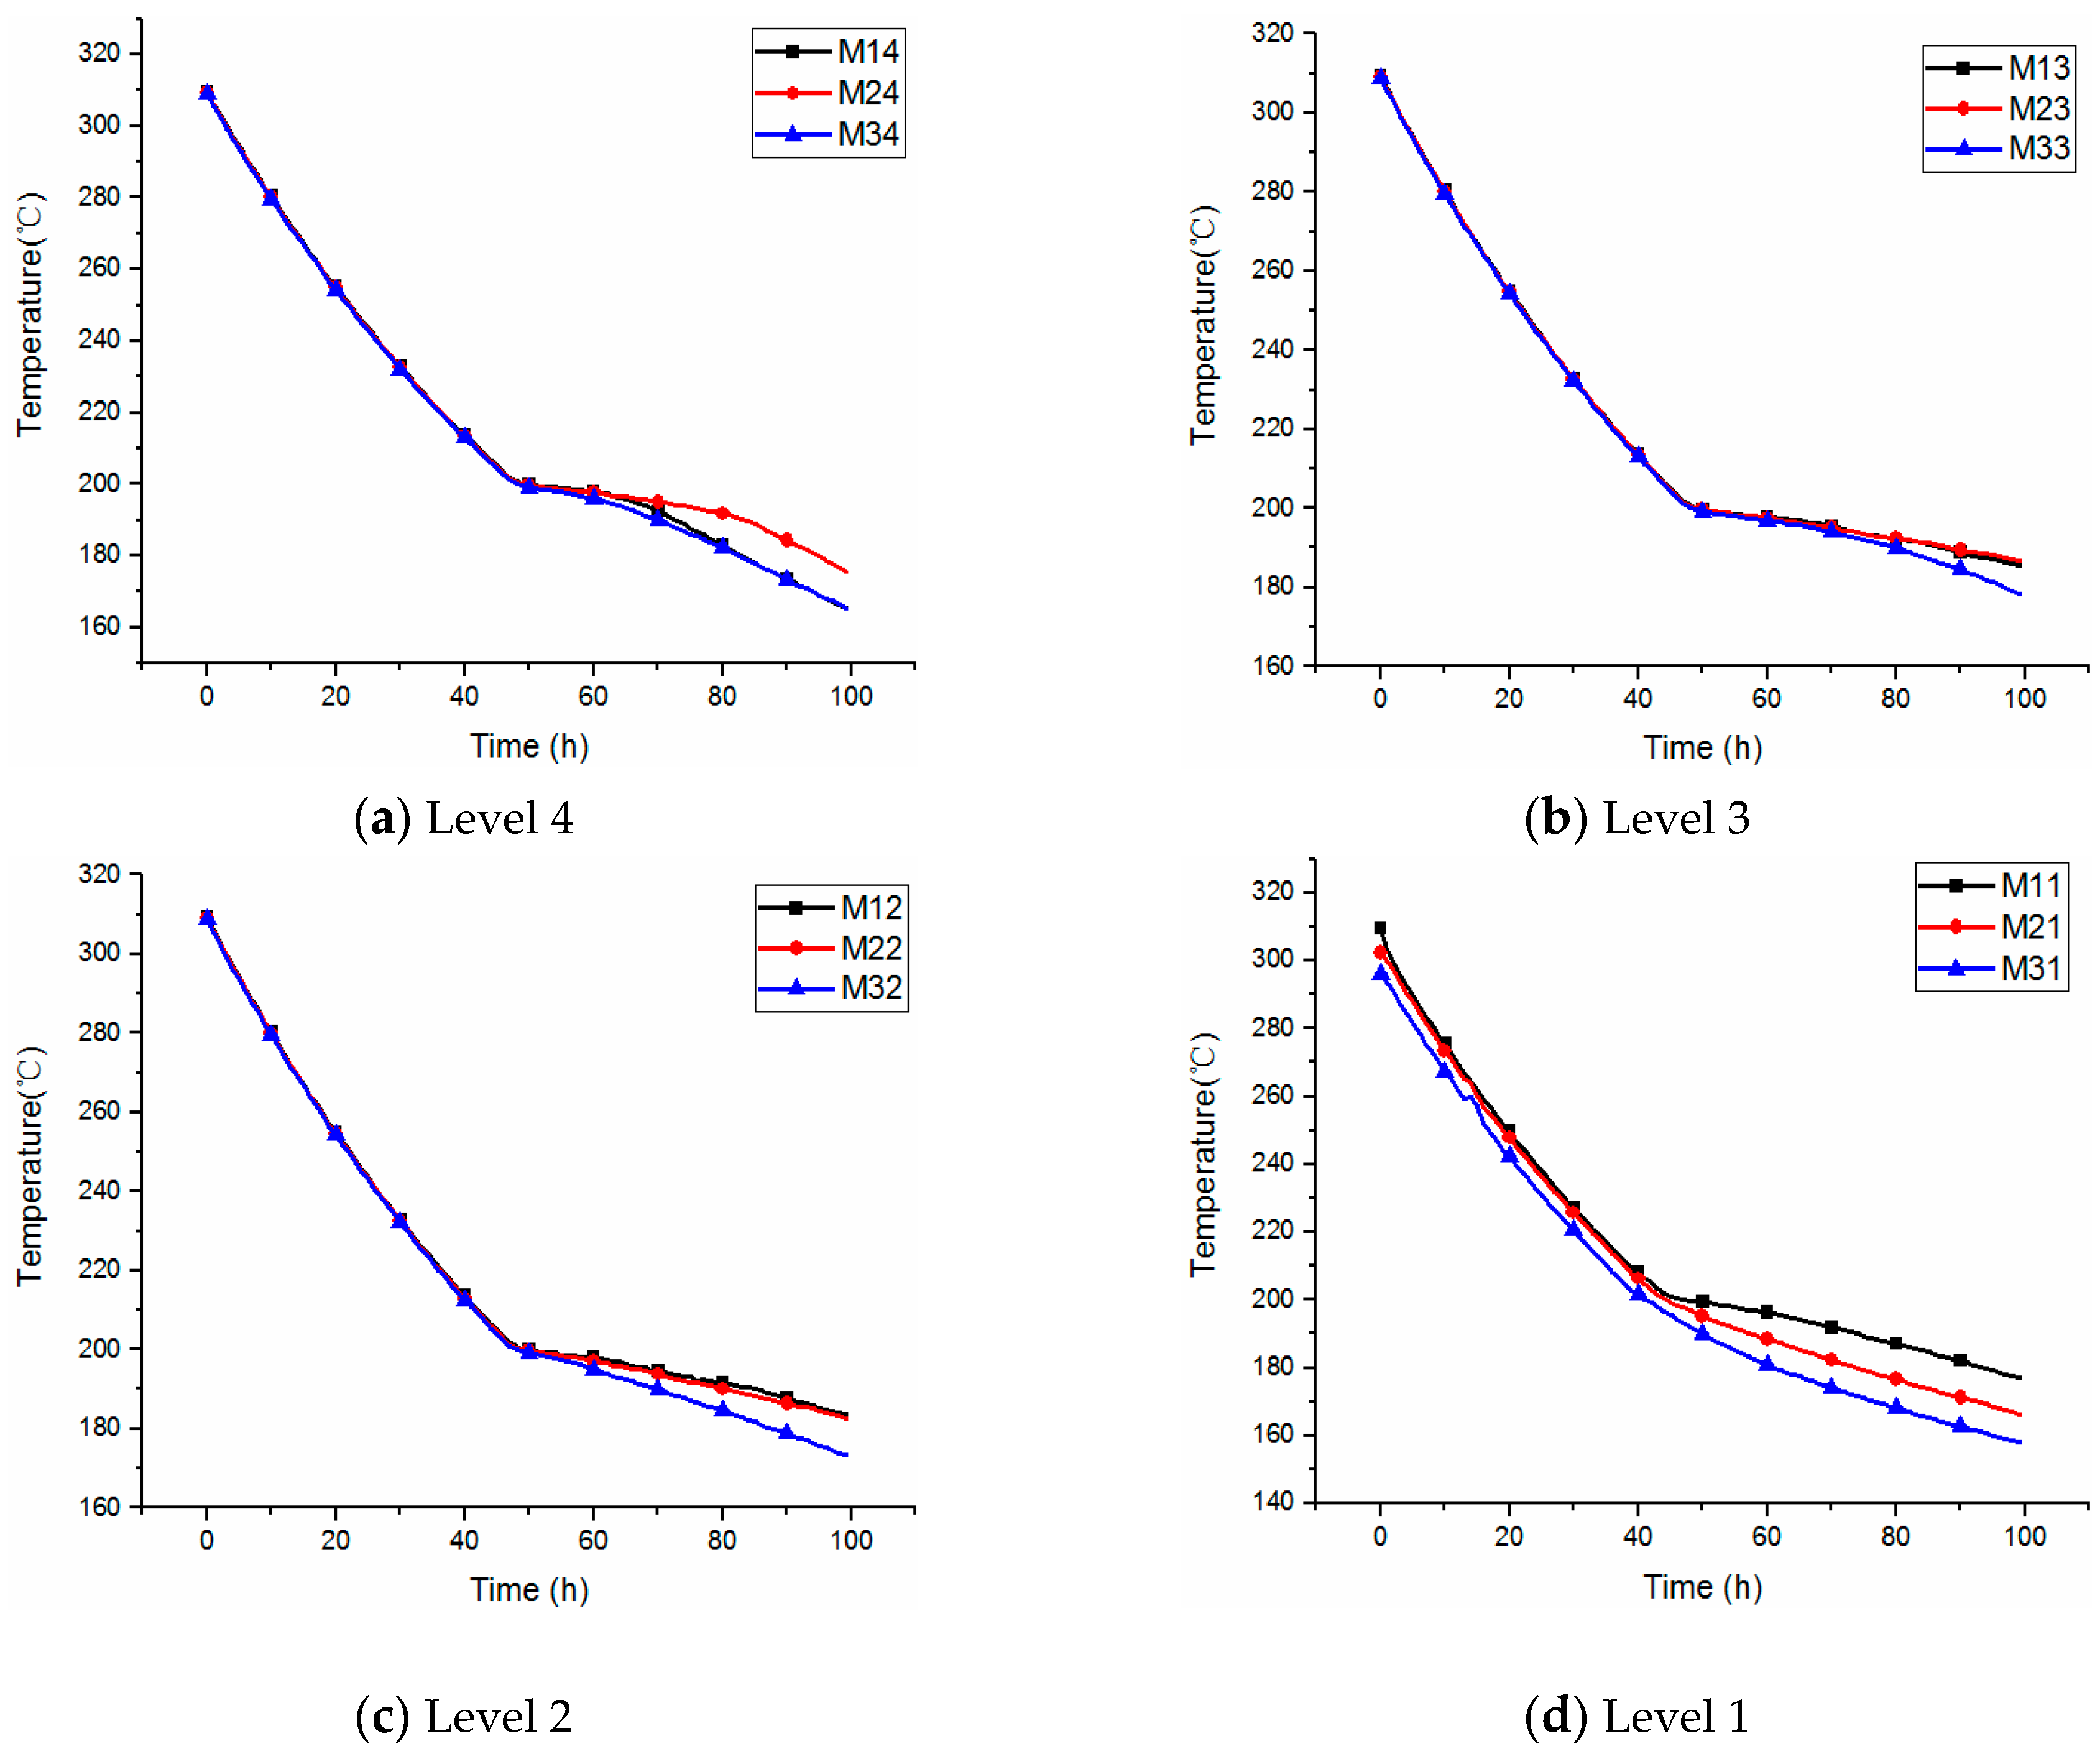
During the cool down process, heat losses to the environment offer enough buoyancy forces to drive the molten salt to natural convection, with the result that the molten salt near the tank walls cools down. Thus, its density increases and moves down to the bottom of the tank. Then, the phenomenon of thermal stratification appears. In this work, the temperature distribution of the cooling process from 550 °C to 310 °C is shown in Figure 3, which takes about 3100 min.
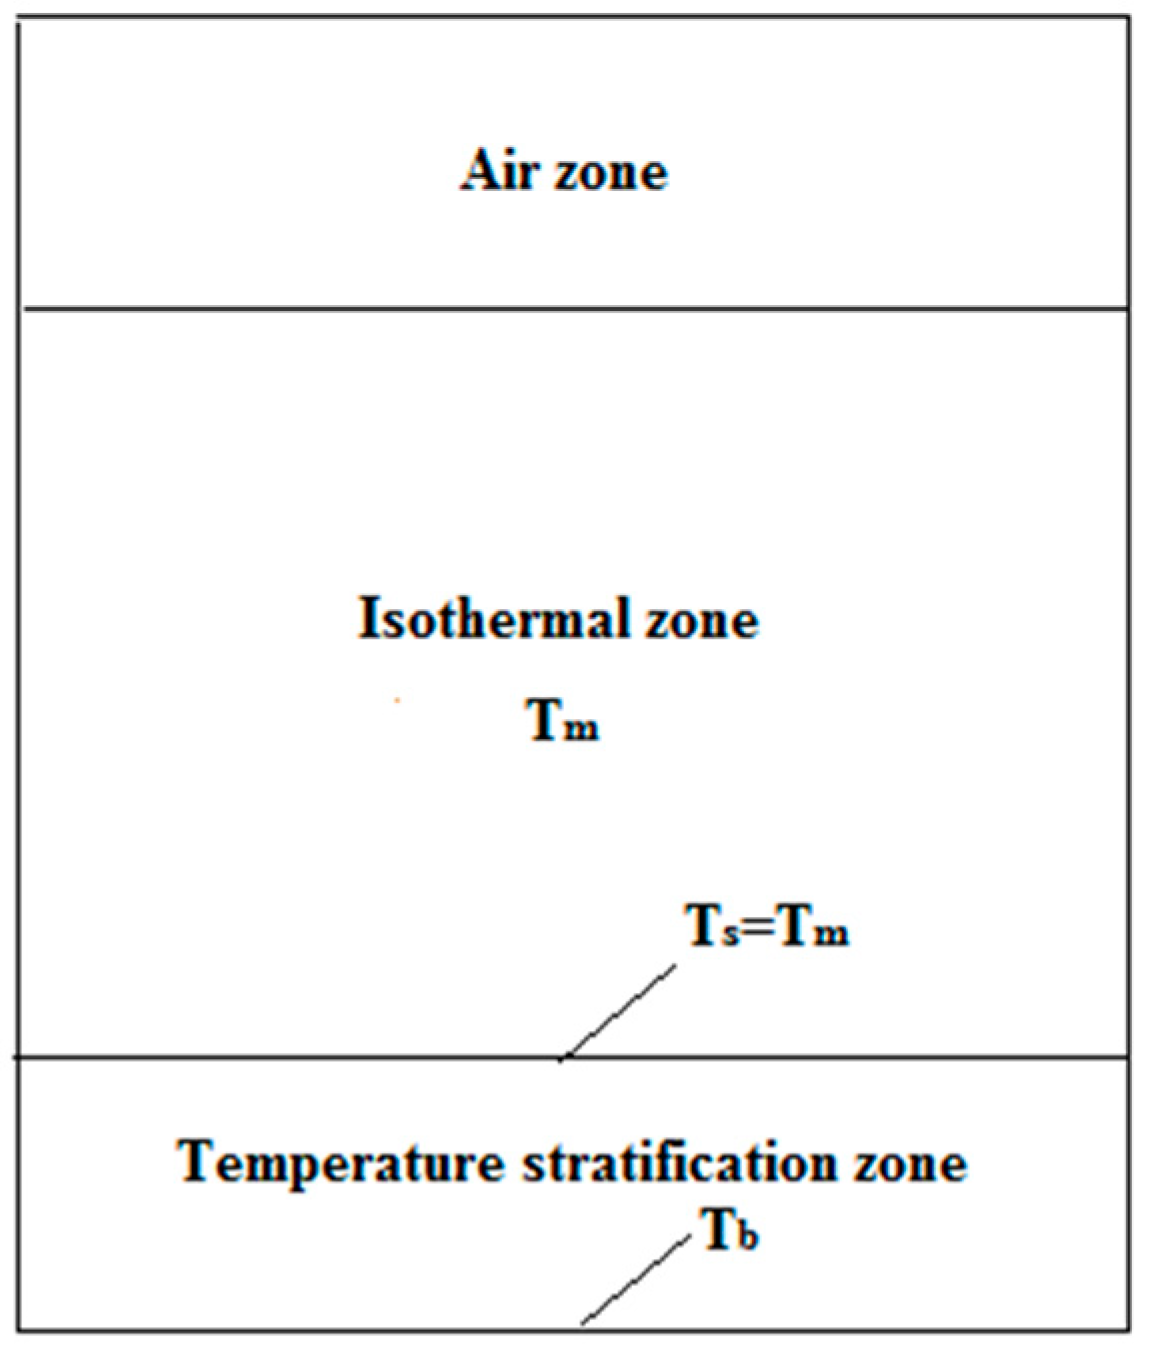
It can be seen from Figure 3a–c that temperature difference appears and gradually increases as the temperature decreases. However, a temperature difference only exists between the bottom two tiered sensors during the entire cooling down process. We can consider the molten salt in the tank as being divided into two zones (shown in Figure 4): an isothermal zone and a temperature stratification zone. Besides this, the height of the temperature stratification zone is less than 200 mm for the duration of the test.
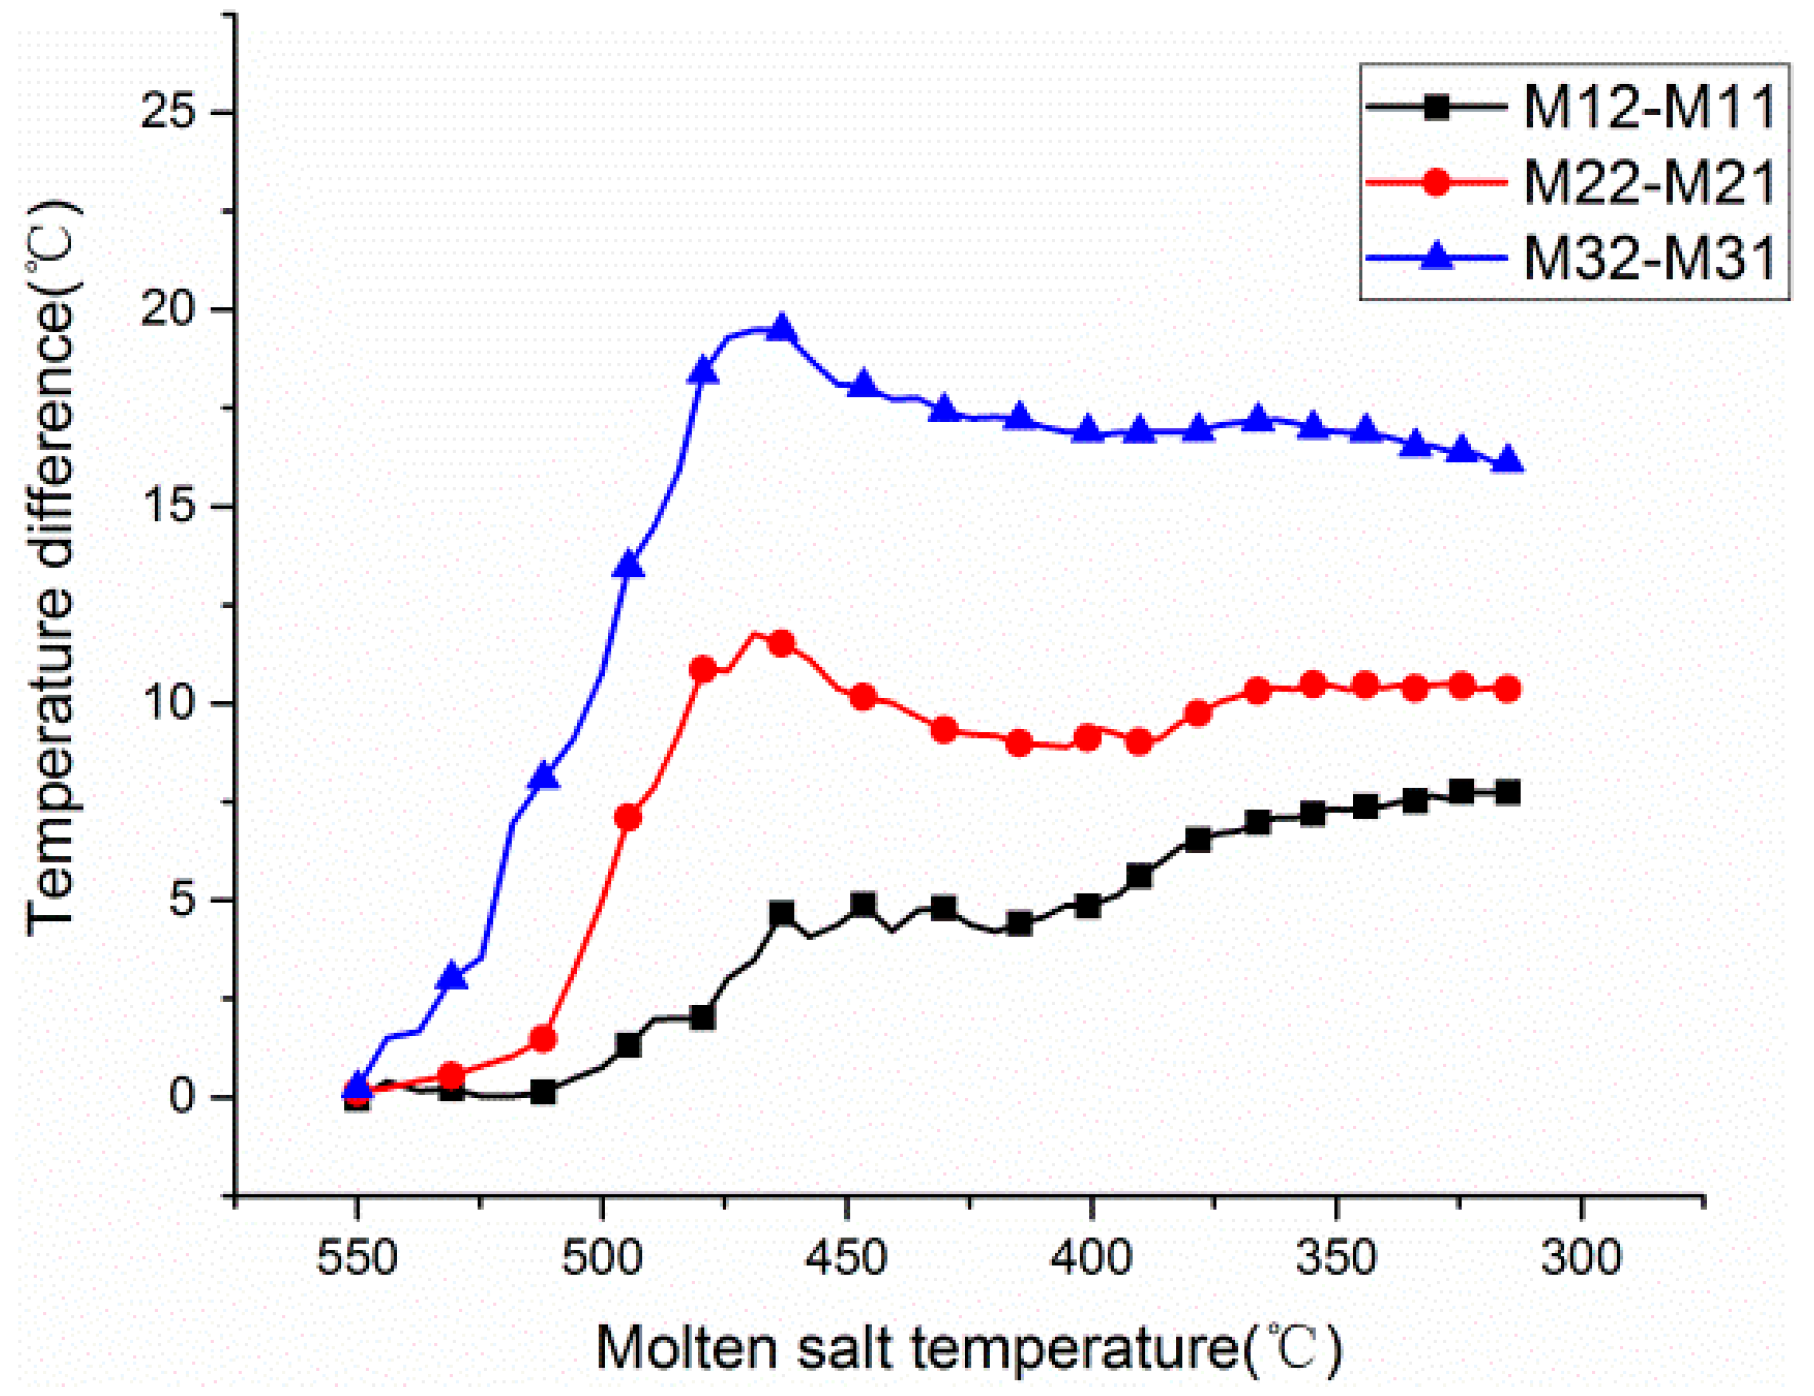
Figure 5 shows the temperature difference variations in the temperature stratification zone. At the beginning of the test, the temperature difference of the three column sensors gradually increases and then decreases, but finally reaches steady values of 16.1 °C, 10.4 °C, and 7.3 °C, respectively. The maximum temperature difference always occurs between M32 and M31, which shows that the minimum temperature appears at the lower edges of the molten salt tank (between the side wall and the bottom plate). This may be due to the fact that the molten salt in the region of the lower edges is slightly influenced by the natural convention of the main flow field.
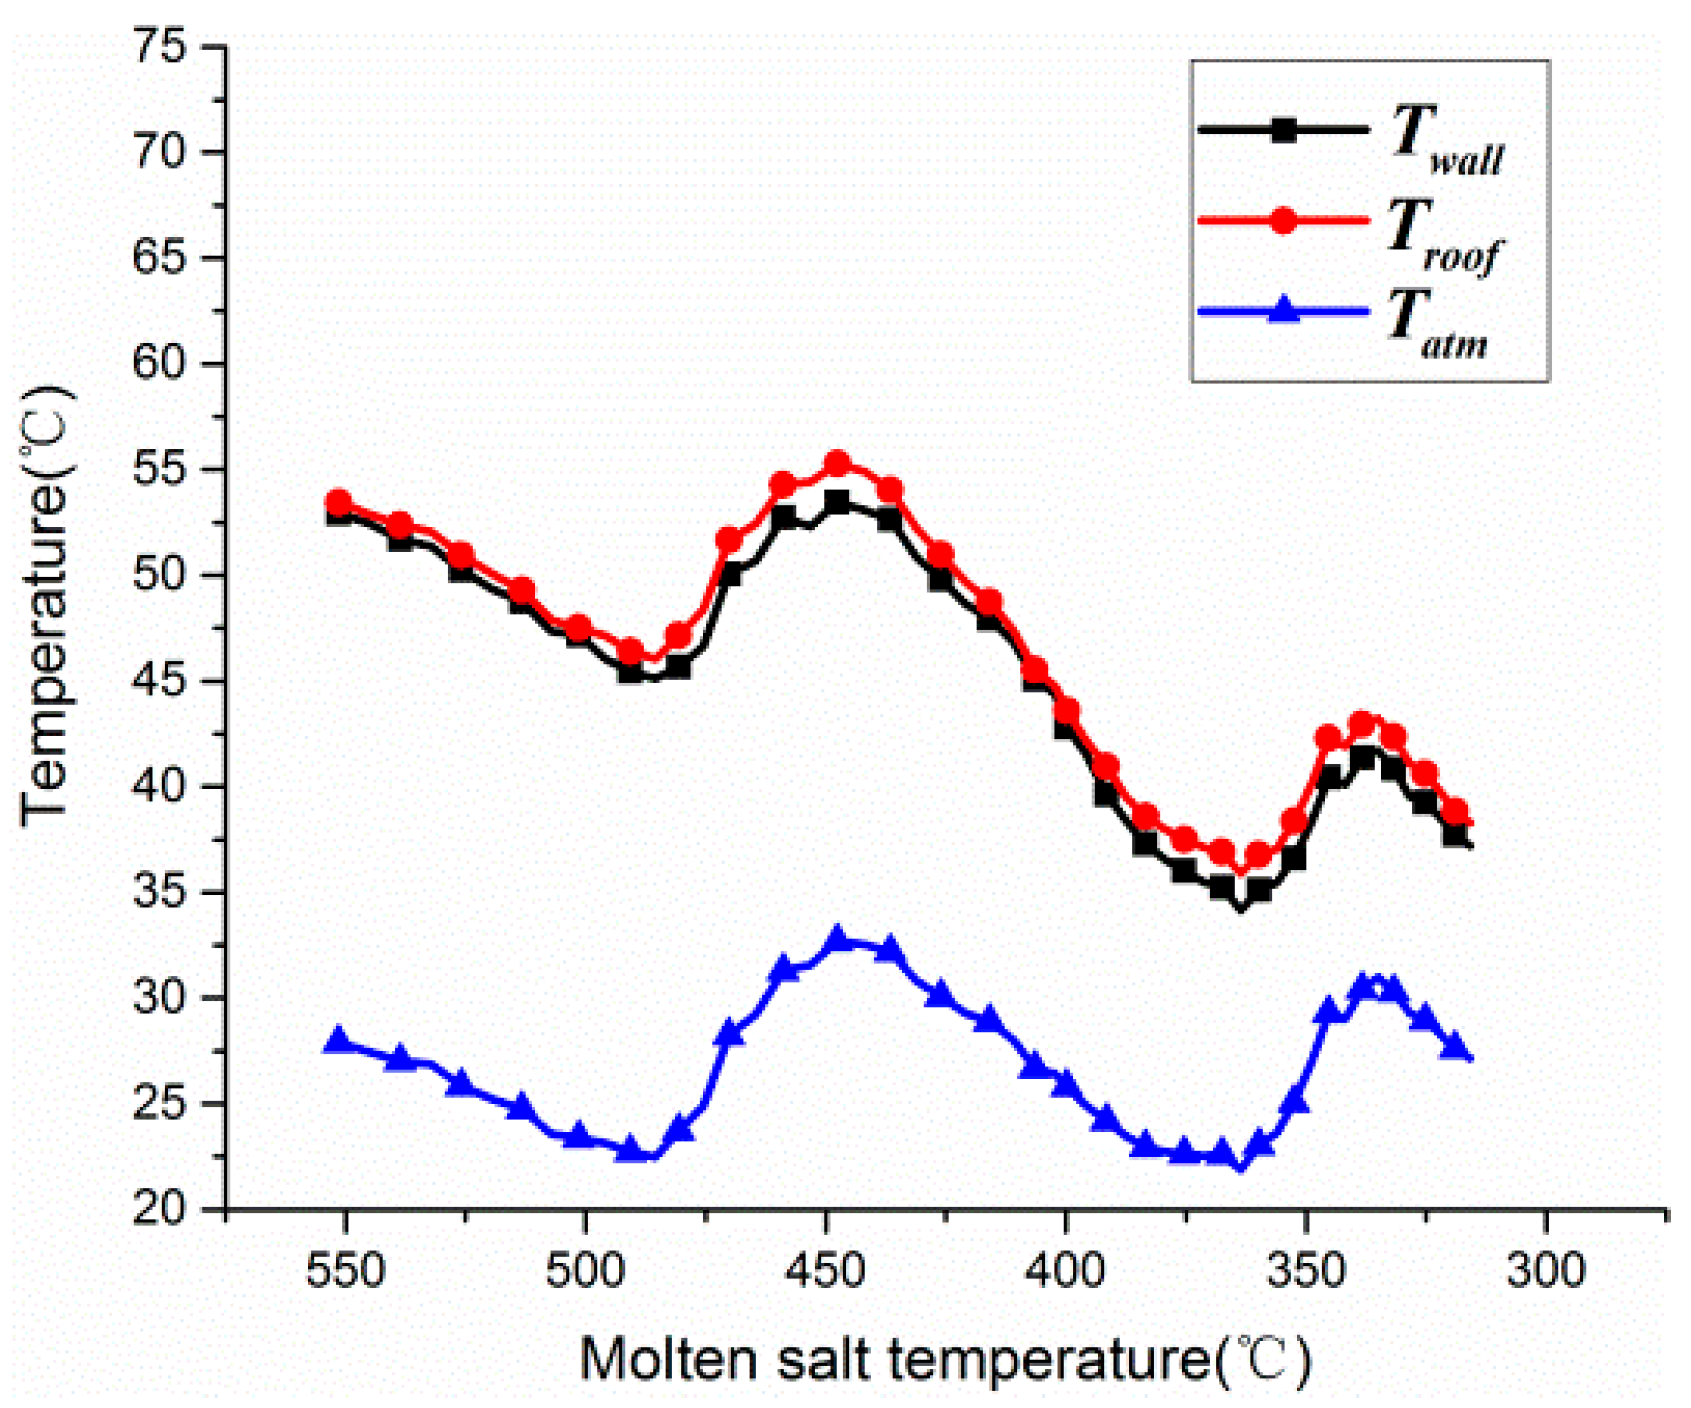
The temperature variations in the insulation surface and the ambient environment are shown in Figure 6. The wall temperatures change following the ambient temperatures. On the other hand, since the thickness of the insulation is thinner than that of the plant [15], the maximum wall temperature is about 54 °C.
Figure 7 shows the temperature distribution of the cooling down process at different levels. It can be seen that a temperature difference only appears at the bottom level. However, at other levels, the temperature remains highly consistent all the time. Moreover, temperature differences between the three bottom monitoring points (M11–M21 and M21–M31) appear as the temperature decreases, and both achieve maximum values of about 8.5 °C when the salt temperature is about 450 °C. Then, the temperature differences tend to be stable at about 3.5 °C (M11–M21) and 6.5 °C (M21–M31).
3.2. Temperature Distribution from 300 to 180 °C
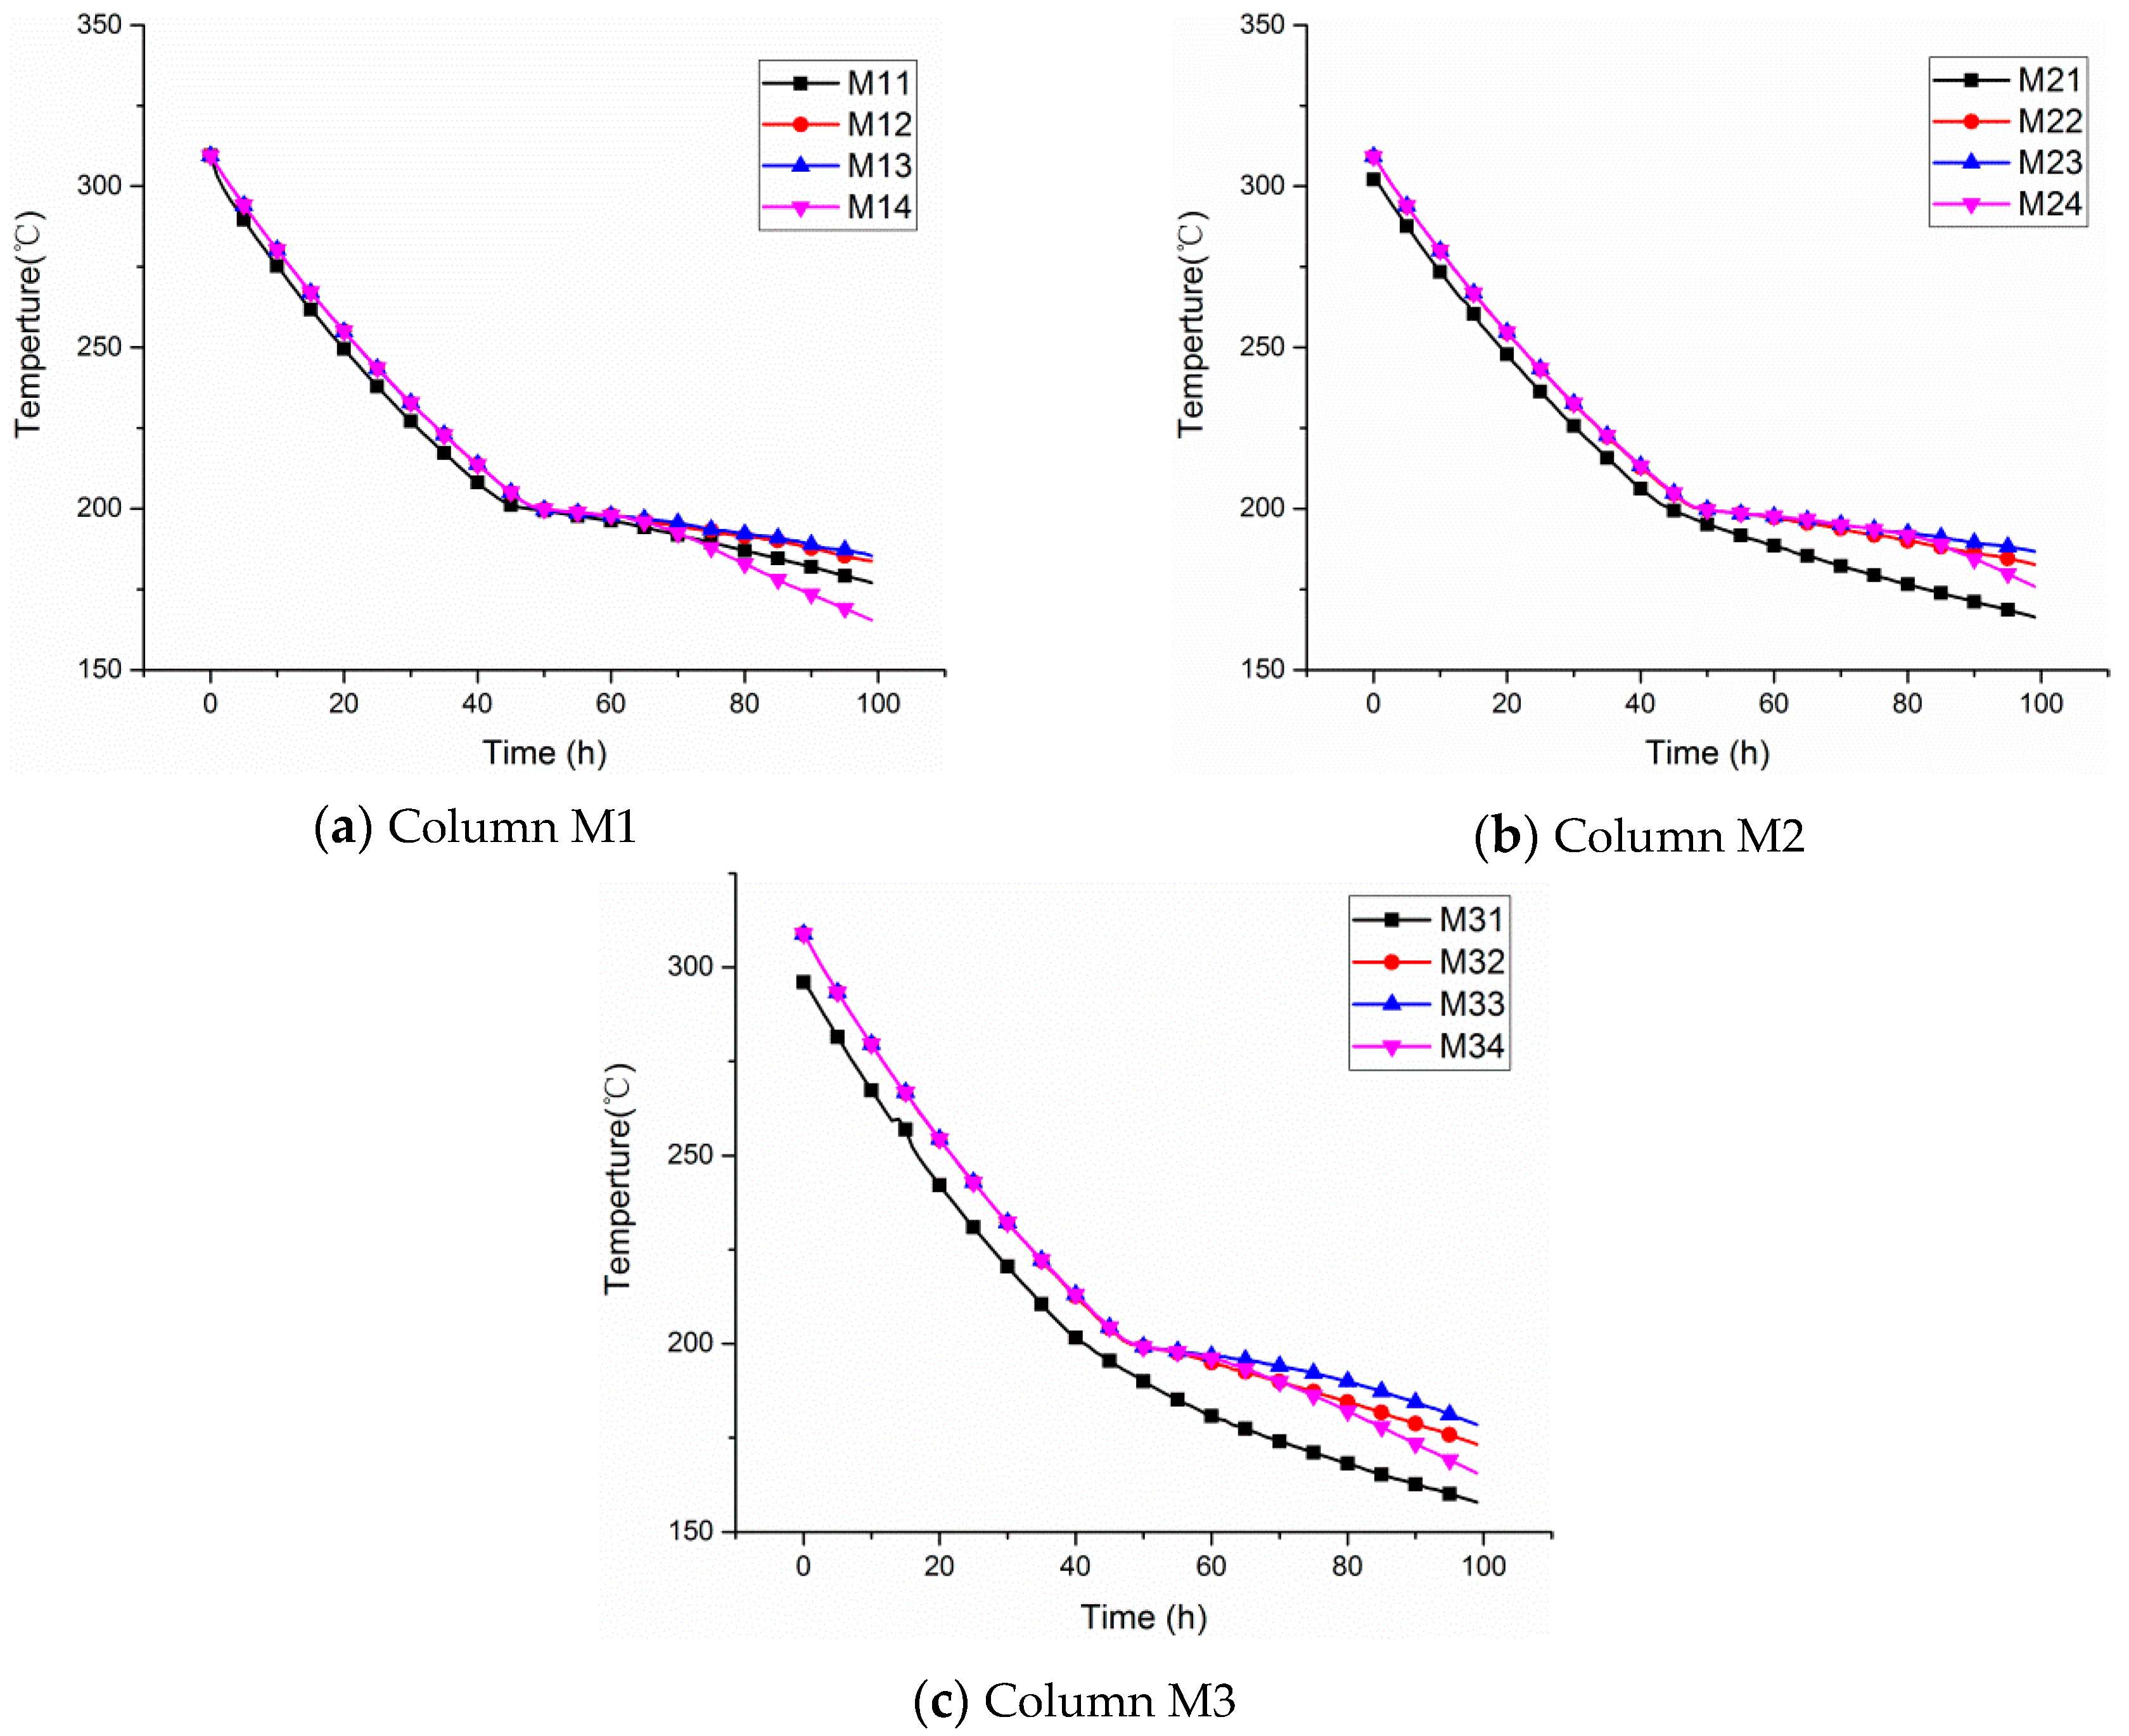
Figure 8 demonstrates the temperature distribution of molten salt from 300 °C to 180 °C. What should be noted is that, from Table 3, it is up to 19% of the variation in salt density from 500 °C to 200 °C, which leads to a decline of about 150 mm in the liquid level’s height, and the top sensors are exposed to air. So, the top temperature sensors M15, M25, and M35 are neglected here.
As can be noticed in Figure 8, it is clear that this process lasts for about 100 h from 300 °C to 180 °C, which is about two times longer than that from 550 °C to 310 °C. This result reveals that the temperature of molten salt has a great effect on the heat losses of the tank. Furthermore, it is obvious that the temperature drop rate suddenly slows down at about 195 °C, which illustrates the temperature at which the new type of molten salt starts to recrystallize.
Molten salt solidification must be avoided under all circumstances because of the enormous costs to resolve it, so it is important to confirm the position of the onset of solidification. In Figure 8, it is shown that the lowest temperature always occurs at M31, which shows that the initial position at which the molten salt solidifies is located at the lower edge of the tank.
At the same time, given that the natural convection effect on the temperature distribution vanishes during the solidification process, while the influence of heat radiation from the liquid surface becomes more important, the temperatures near the liquid level are lower than those of the other two layers, which can be seen in Figure 8.
The temperature of the molten salt at the four levels at 300~180 °C is shown in Figure 9. As expected, temperature differences only exist at the bottom level, with values of 1.5 °C (M11–M21) and 5.1 °C (M21–M31) when the molten salt is in the liquid region. However, temperature differences appear at each level and gradually increase as the amount of molten salt decreases during the solidification process. Moreover, as time goes on, it should be noted that the temperature at M14 approximates that at M34 due to the effect of the thermal bridges of the salt pump, which reveals that the onset of local solidifications of the liquid surface first occurs near the salt pump.
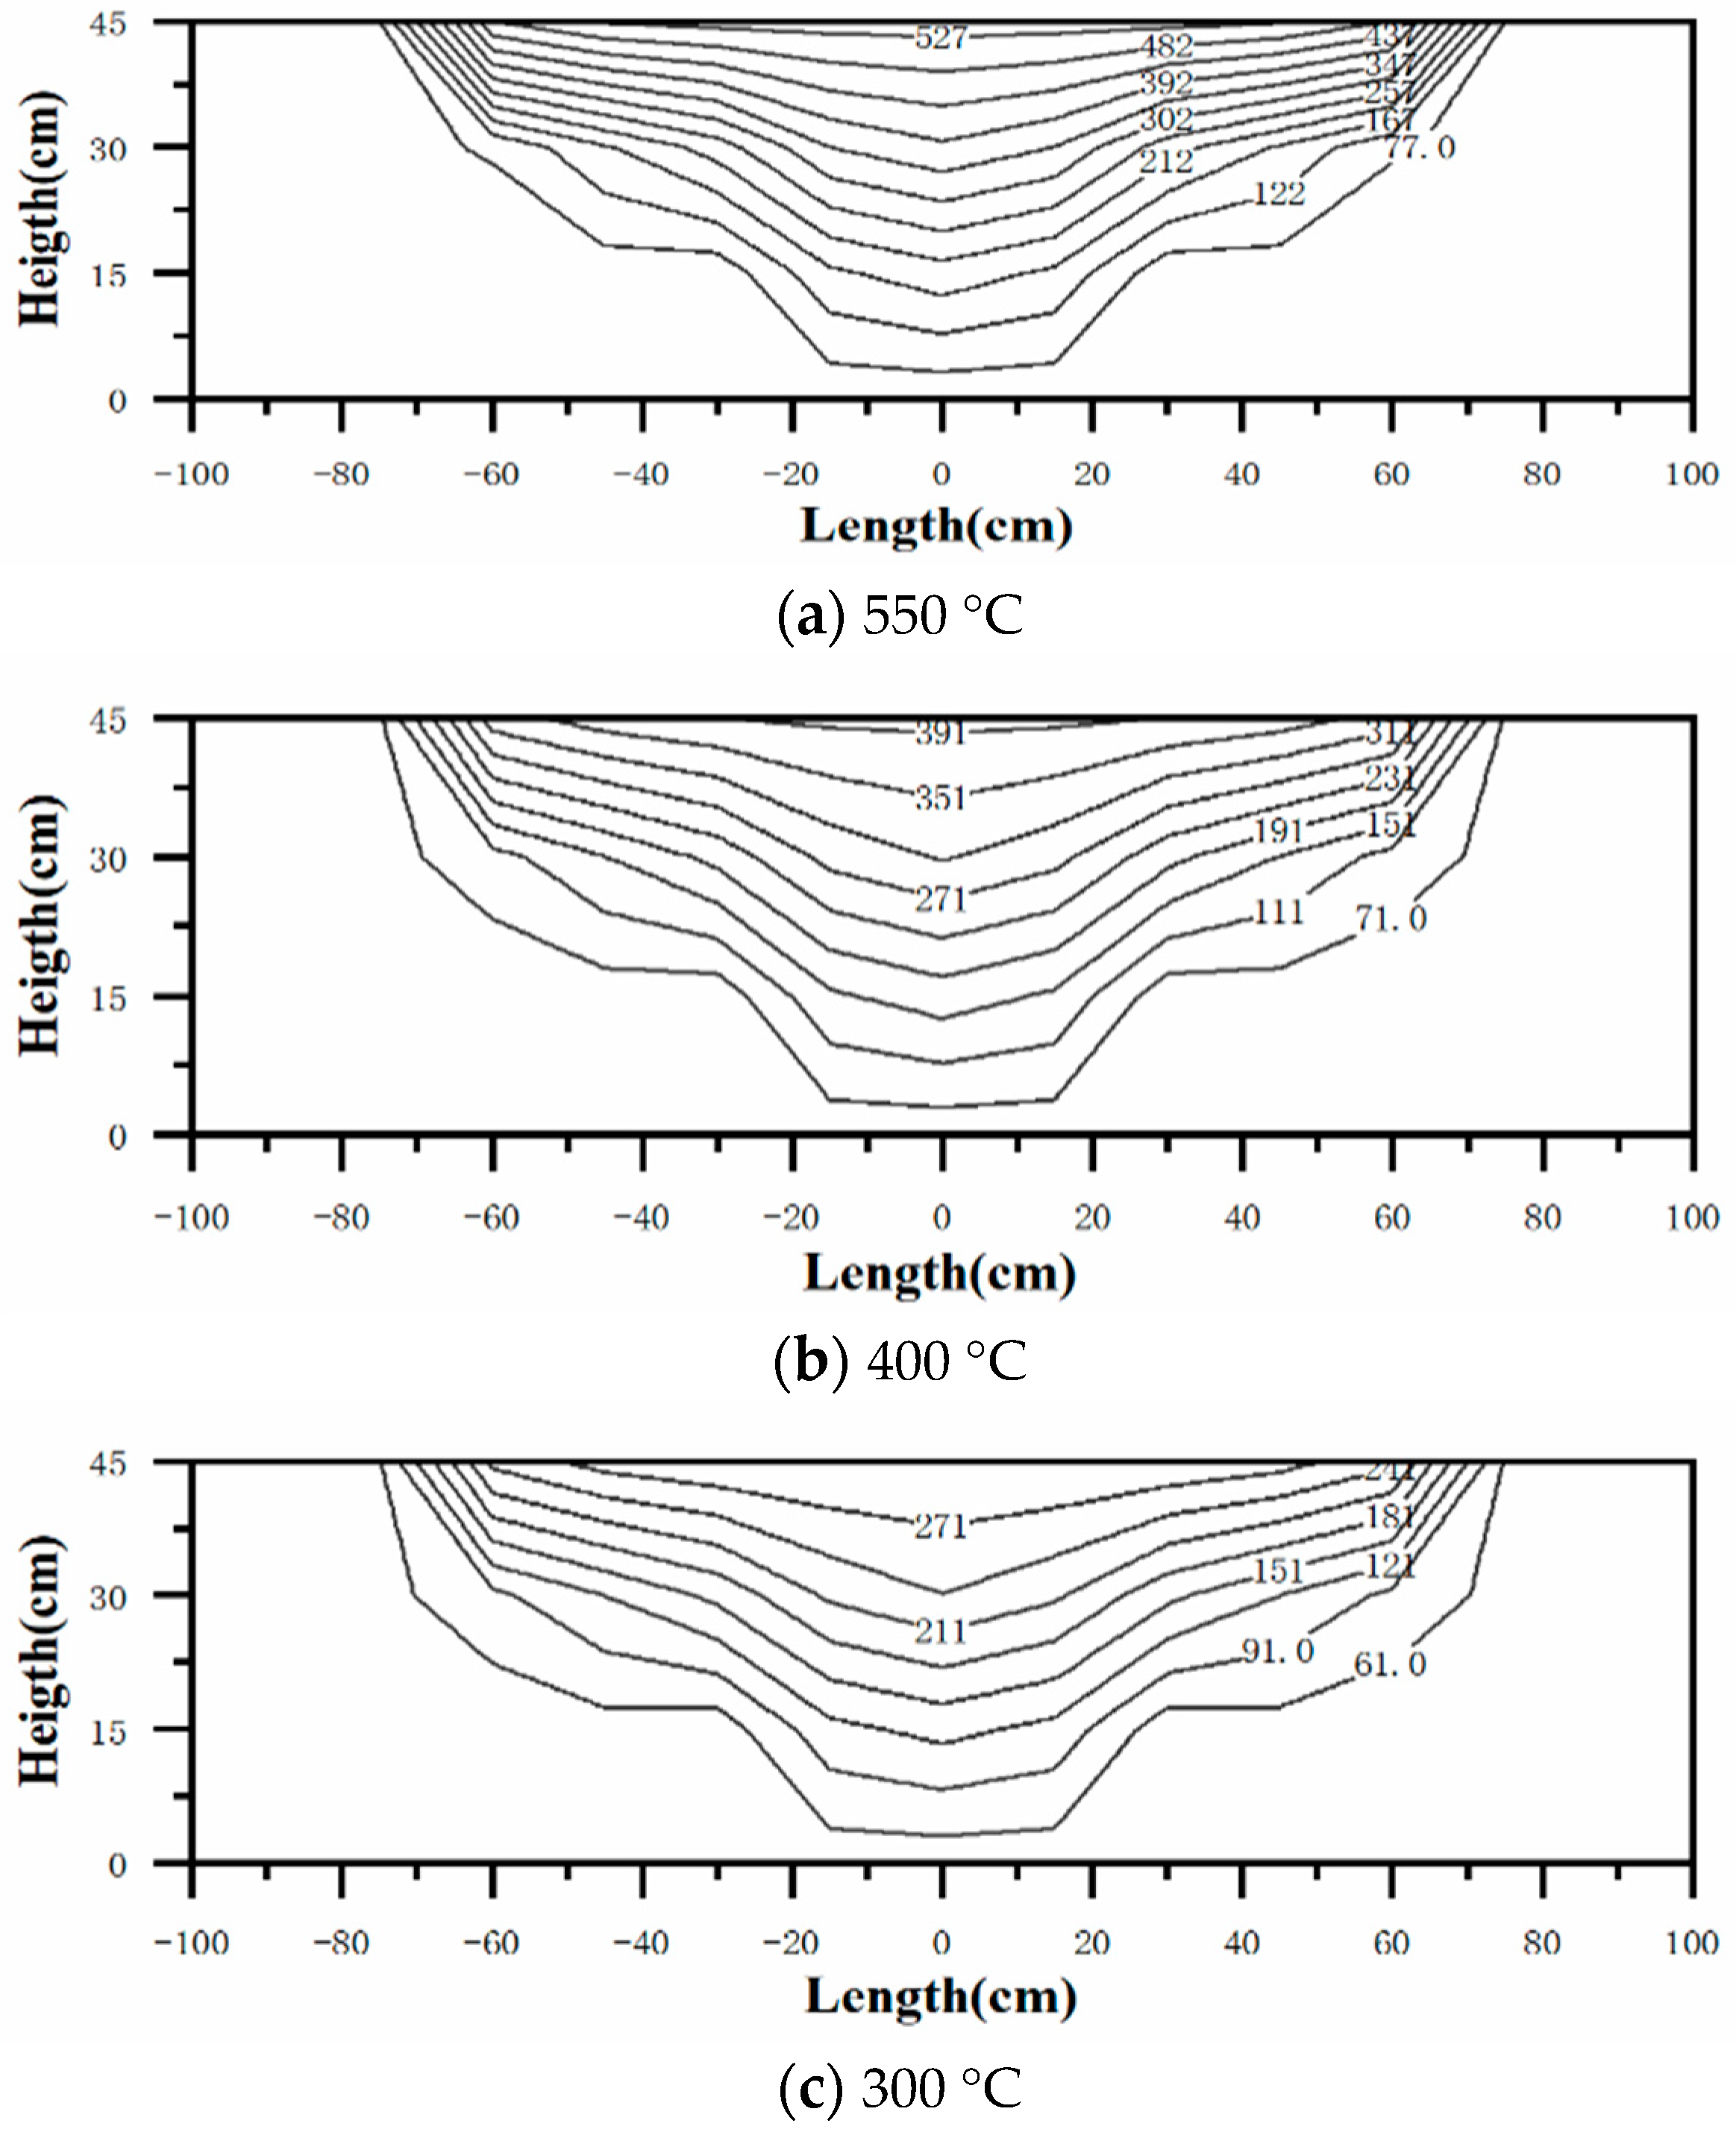
3.3. Temperature Distribution of the Insulation Foundation
An insulation foundation is used to reduce heat losses from the tank’s bottom and support the tank. In order to understand the insulation foundation more deeply, temperatures of the foundation were recorded. The isotherm distribution of the insulation foundation at 550 °C, 400 °C, and 300 °C is shown in Figure 10. The common characteristics of these figures are that the maximum temperature occurs at the middle-top parts of the foundation, which matches the temperature distribution of the molten salt in the tank. As mentioned earlier, the heat conduction of foam glass is lower than that of firebrick, so temperatures in foam glass always remain higher than those in firebricks at the same level.
There are two limits for the insulation foundation. The first is the maximum working temperature of the foam glass, which is 482 °C. The second is that the temperature at the insulation foundation’s bottom is prohibited from reaching 90 °C to avoid overheating of the concrete foundation below the insulation foundation in a real solar thermal plant. Figure 10 shows that the maximum temperatures of the foam glass and the foundation bottom are, respectively, 384 °C and 46 °C. That is to say, the current thickness of the foundation is reasonable.
3.4. Heat Losses
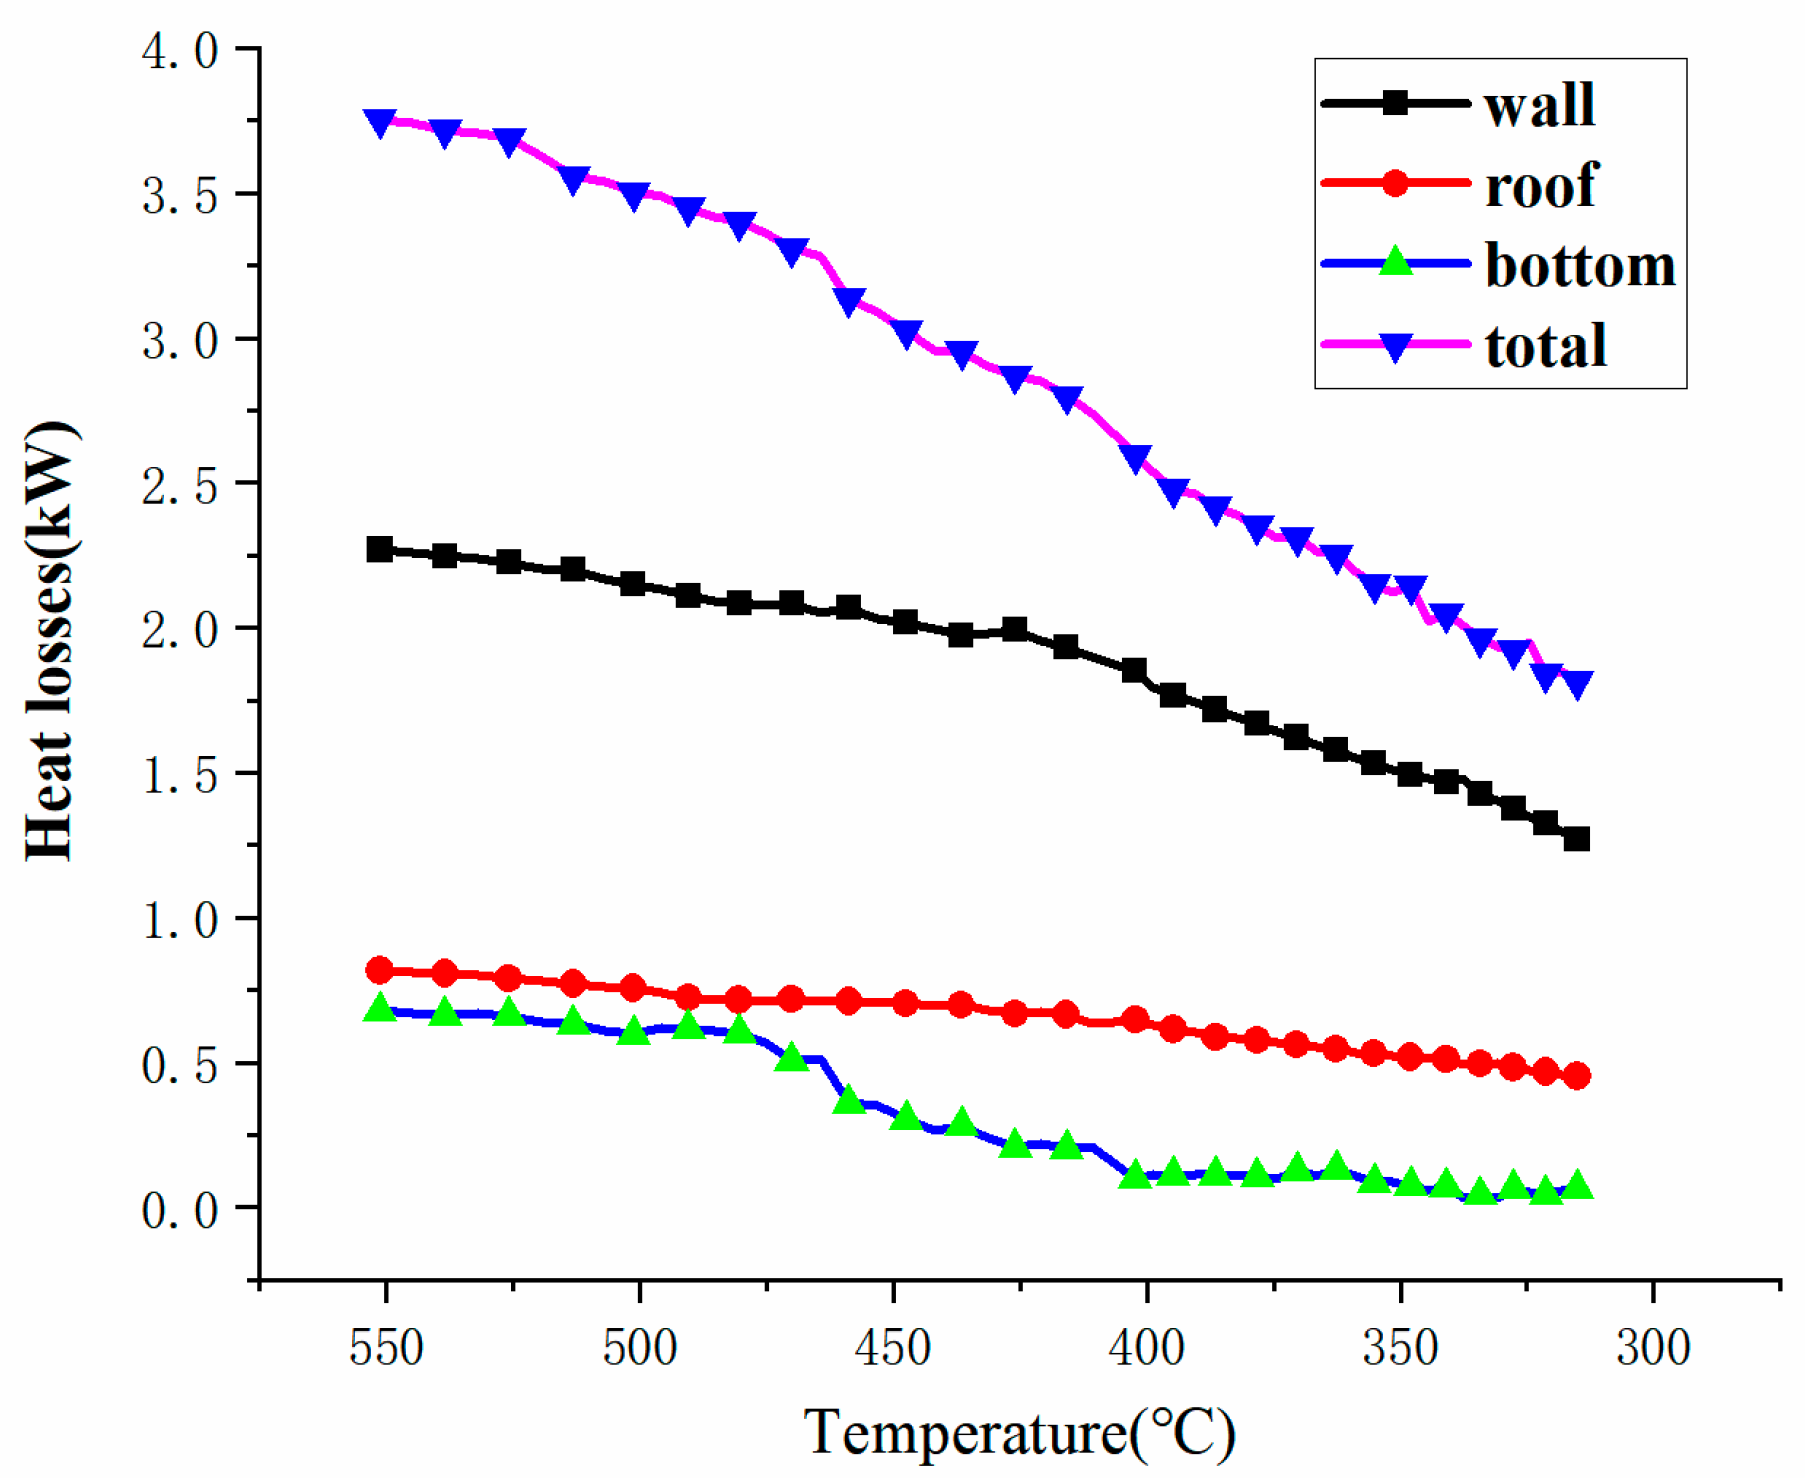
Because of the high operating temperature of the TES system, heat losses cannot be prevented from occurring. By calculating the heat losses of the tank, the tendency of the variation in the heat losses of the tank can be obtained, and is drawn in Figure 11. The figure shows that the total heat losses of the tank decrease from 3.75 kW to 1.82 kW as the temperature of the molten salt drops from 550 °C to 310 °C. However, the rate of the decrease in heat losses is different. At the beginning of the test, the temperature difference between the molten salt and the ambient environment is higher, which causes the heat losses to be greater. Then, the heat losses drop as the temperature decreases and the thermal stratification zone forms.
We compared the heat loss data from the experimental tank with Solar Two Project data, and the results are shown in Table 4. It is obvious that the heat losses from the experimental tank are higher than those from Solar Two, which may be due to the insulation being thinner and the insulation material being different. Moreover, another reason for this result may be that Solar Two has a smaller specific surface area.
Heat losses from the wall surface and the bottom of the tank were also calculated by applying the method presented in Section 2.4.2. The results are shown in Figure 11. As can be seen from the figure, Qwall contributes about 60% of the heat losses, while Qbottom is the minimum. Meanwhile, different from the linearly descending Qwall and Qroof, Qbottom shows a different trend of decline.
Figure 4 shows that thermal stratification only appears at the tank’s bottom, which equates to the introduction of thermal resistance in the bottom of the tank. Logically, a judgment can be formed that the thermal stratification zone only affects the heat losses from the tank’s bottom.
The heat losses of the foundation’s bottom to the ambient environment, Qbottom, can be given as:
where R is the thermal resistance of the insulation foundation, which is assumed to be constant here, and Tb, Tf represent the mean temperature of the tank’s bottom and the foundation’s bottom, respectively.
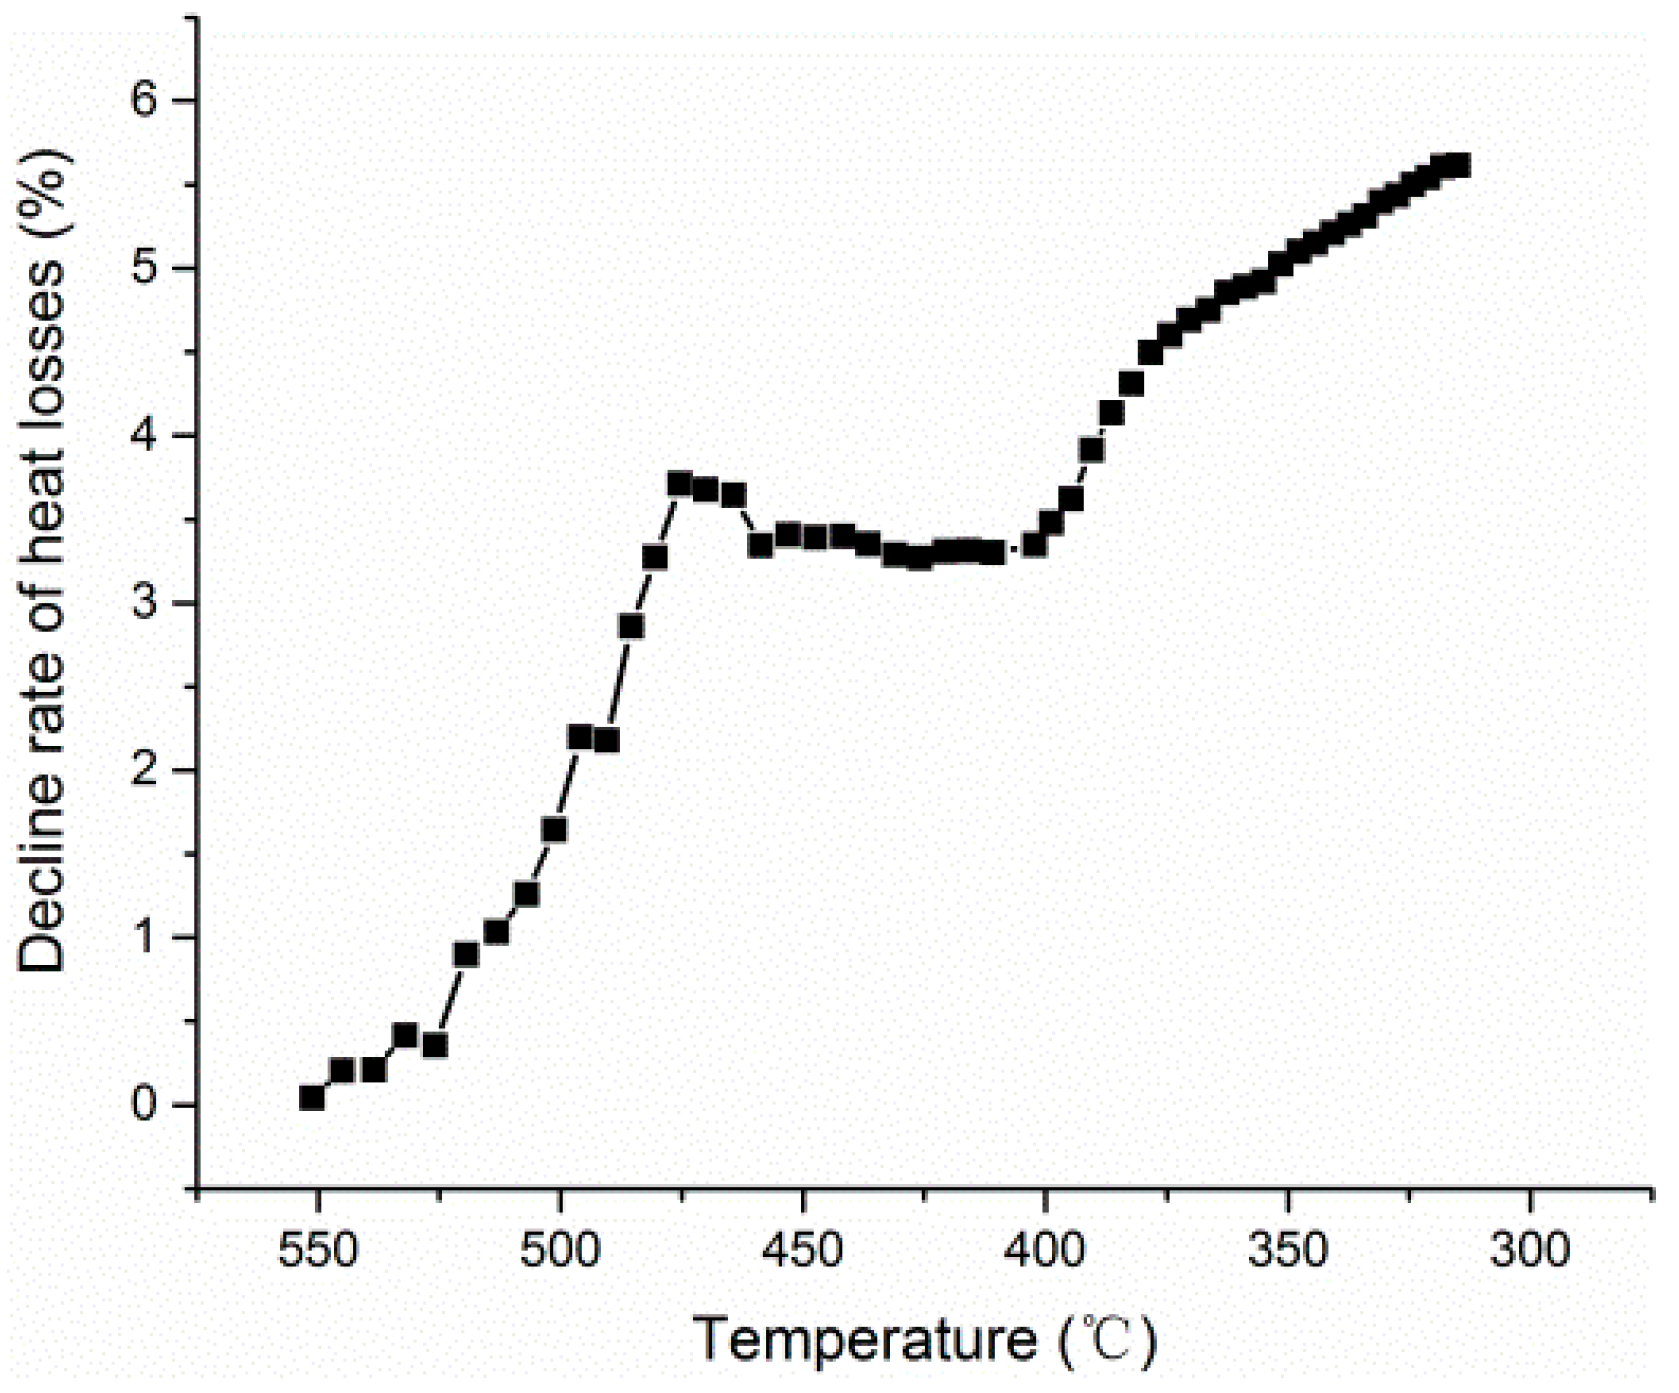
There is no thermal stratification zone in a full-mixed tank, so the temperature difference changes from Tb − Tf to Ts − Tf. The rate of decline of heat losses γ caused by the thermal stratification zone can be calculated as:
Figure 12 shows γ as the salt temperature decreases, which contains the three stages of the cooling process. In the first stage, the temperature difference Ts − Tb increases once thermal stratification has appeared at the bottom of the tank, so the rate of decline of heat losses increases to about 3.5%. The rate of decline remains constant from 475 °C to 400 °C at the second stage, which shows that the temperature drops of Tm and Tf are very close due to little change in Tm − Tb at this stage. However, at the third stage, the temperature difference Tm − Tb remains constant and the temperature difference Tm − Tf continues to reduce as Tm decreases, so the rate of decline of heat losses γ increases from 3.5% to about 5.6%.
4. Conclusions
An experimental TES system with a new type of molten salt as the thermal energy storage medium was built to investigate the performance during the cooling process. An uneven temperature distribution of molten salt driven by natural convection due to the heat losses of the tank to the surrounding environment was recorded from 550 °C to 180 °C. By analyzing the temperature distribution data, the temperature difference was found to remain within 200 mm at the tank’s bottom, which reveals that thermal stratification exists in the tank. Besides this, the local solidification problem was addressed, and the results show that the position of initial solidification is located at the lower edge of the tank. In order to achieve a deeper understanding of the molten salt tank, the temperature distribution of the insulation foundation was obtained, and the results show that the maximum temperature appears at the middle upper of the foundation and decreases radially.
On the other hand, the total heat losses of the tank were calculated to be 3.75 kW to 1.82 kW as the temperature decreased from 500 °C to 310 °C. The insulation wall contributed the majority of the heat losses (about 60%). Meanwhile, the existence of a thermal stratification zone reduces the heat losses of the insulation foundation by increasing the thermal resistance. However, the trends of this effect are unstable, can be divided into three parts with different molten salt temperatures, and have maximum rate of decline of up to 6.5%.
Author Contributions
X.Z. and Y.W. conceived the initial and final design of the research work. X.Z. completed the experiments, an analysis of the results, and the manuscript’s preparation. Y.W. and C.M. discussed the work with the rest of the authors and refined the manuscript. X.Z. wrote the paper with able support from all of the co-authors.
Funding
This research was funded by the Global Energy Interconnection Research Institute of State Grid Corporation of China under SGRI-DL-71-16-081. The APC was funded by National Key R & D Program of China (Grant No. 2017YFB0903603) and Qinghai Science and Technology Project (Grant No. 2017-GX-A3).
Acknowledgments
The research leading to these results has received funding from the Global Energy Interconnection Research Institute of State Grid Corporation of China under SGRI-DL-71-16-018.
Conflicts of Interest
The authors declare no conflict of interest
Nomenclature
| Qheatloss | Heat losses of the tank (kW) |
| Caverage | Mean temperature of the specific heat of molten salt () |
| m | The weight of molten salt in the tank (kg) |
| Tt,Tt+Δt | The mean temperature of molten salt at time t and t+Δt (K) |
| Qwall, Qroof, Qbottom | Heat losses of the tank’s wall, roof, and bottom (kW) |
| Twall, Troof, Tbottom | Temperature of the insulation wall, roof, and bottom (°C) |
| Tatm | Temperature of the environment (°C) |
| Awall, Aroof | Area of the insulation wall and insulation roof (m2) |
| awall, aroof | Heat transfer coefficients of the insulation wall and roof (W/(m2·K)) |
| ac | Convection heat transfer coefficient (W/(m2·K) |
| ar | Radiation heat transfer coefficient (W/(m2·K) |
| Tm | Temperature of molten salt of the isothermal zone (°C) |
| Ts | Boundary temperature of the molten salt of the isothermal zone and the stratification zone (°C) |
| Tb | Temperature of the molten salt of the tank’s bottom (°C) |
| Tf | Temperature of the insulation foundation’s bottom (°C) |
| R | Thermal resistance of the insulation foundation (K/W) |
| γ | Rate of decline of heat losses caused by the thermal stratification zone |
References
- Xu, X.; Vignarooban, K.; Xu, B.; Hsu, K.; Kannan, A.M. Prospects and problems of concentrating solar power technologies for power generation in the desert regions. Renew. Sustain. Energy Rev. 2016, 53, 1106–1131. [Google Scholar] [CrossRef]
- Zaversky, F.; García-Barberena, J.; Sánchez, M.; Astrain, D. Transient molten salt two-tank thermal storage modeling for CSP performance simulations. Sol. Energy 2013, 93, 294–311. [Google Scholar] [CrossRef]
- Zhang, H.; Baeyens, J.; Cáceres, G.; Degrève, J.; Lv, Y. Thermal energy storage: Recent developments and practical aspects. Prog. Energy Combust. Sci. 2016, 53, 1–40. [Google Scholar] [CrossRef]
- Li, X.; Xu, E.; Song, S.; Wang, X.; Yuan, G. Dynamic simulation of two-tank indirect thermal energy storage system with molten salt. Renew. Energy 2017, 113, 1311–1319. [Google Scholar] [CrossRef]
- Prieto, C.; Osuna, R.; Fernández, A.I.; Cabeza, L.F. Thermal storage in a MW scale. Molten salt solar thermal pilot facility: Plant description and commissioning experiences. Renew. Energy 2016, 99, 852–866. [Google Scholar] [CrossRef]
- Rodriguez-Sanchez, M.R.; Sanchez-Gonzalez, A.; Marugan-Cruz, C.; Santana, D. Saving assessment using the PERS in solar power towers. Energy Convers. Manag. 2014, 87, 810–819. [Google Scholar] [CrossRef]
- García, I.L.; Álvarez, J.L.; Blanco, D. Performance model for parabolic trough solar thermal power plants with thermal storage: Comparison to operating plant data. Sol. Energy 2011, 85, 2443–2460. [Google Scholar] [CrossRef]
- Relloso, S.; Delgado, E. Experience with molten salt thermal storage in a commercial parabolic trough plant; Andasol 1 commissioning and operation. In Proceedings of the 15th International Solar PACES Symposium, Berlin, Germany, 15–18 September 2009; pp. 14–18. [Google Scholar]
- Schulte-Fischedick, J.; Tamme, R.; Herrmann, U. CFD Analysis of the Cool down Behaviour of Molten Salt Thermal Storage Systems; ASME: New York, NY, USA, 2008; pp. 515–524. [Google Scholar]
- Suárez, C.; Iranzo, A.; Pino, F.J.; Guerra, J. Transient analysis of the cooling process of molten salt thermal storage tanks due to standby heat loss. Appl. Energy 2015, 142, 56–65. [Google Scholar] [CrossRef]
- Rodríguez, I.; Pérez-Segarra, C.D.; Lehmkuhl, O.; Oliva, A. Modular object-oriented methodology for the resolution of molten salt storage tanks for CSP plants. Appl. Energy 2013, 109, 402–414. [Google Scholar] [CrossRef]
- Bradshaw, R.; Dawson, D.B.; Daniel, B.; Rosa, D.L.; Gilbert, R. Final Test and Evaluation Results from the Solar Two Project; SAND2002-0120; IAEA: Vienna, Austria, 2002. [Google Scholar]
- Prieto, C.; Laia, M.; Gerard, P.; Oró, G.; Gil, A.; Cabeza, L.F. Temperature distribution and heat losses in molten salts tanks for CSP plants. Sol. Energy 2016, 135, 518–526. [Google Scholar] [CrossRef] [Green Version]
- Khalifa, A.J.N.; Mustafa, A.T.; Khammas, F.A. Experiment study of temperature stratification in a thermal storage tank in the static mode for different aspect. J. Eng. Appl. Sci. 2011, 6, 53–60. [Google Scholar]
- Azharul, K.; Ashley, B.; Sabrina, F. Investigation of Stratified Thermal Storage Tank Performance for Heating and Cooling Applications. Energies 2018, 11, 1049. [Google Scholar]
- Kelly, B.; Kearney, D. Thermal Storage Commercial Plant Design Study for a 2-Tank Indirect Molten Salt System: Final Report, 13 May 2002–31 December 2004; NERL: Lakewood, CO, USA, 2006. [Google Scholar]
- Zou, L.L.; Chen, X.; Wu, Y.T.; Wang, X.; Ma, C.F. Experimental study of thermo physical properties and thermal stability of quaternary nitrate molten salts for thermal energy storage. Sol. Energy Mater. Sol. Cells 2019, 190, 12–19. [Google Scholar] [CrossRef]
- ASTM Committee. C680-2003 Standard Practice for Estimate of the Heat Gain or Loss and the Surface Temperatures of Insulated Flat, Cylindrical, and Spherical Systems by Use of Computer Programs; ASTM International: West Conshohocken, PA, USA, 2003; pp. 6–8. [Google Scholar]
Figure 1.
Structure chart of the molten salt tank.

Figure 2.
Insulation in the tank and the distribution of temperature sensors.

Figure 3.
Temperature distribution of the molten salt during the cooling process from 550 to 300 °C.
Figure 3.
Temperature distribution of the molten salt during the cooling process from 550 to 300 °C.

Figure 4.
Model of the temperature stratification in the tank.

Figure 5.
Variations in the temperature difference of the temperature stratification zone.

Figure 6.
Variations in the temperature of the insulation surface and the ambient environment.

Figure 7.
The temperature distribution of molten salt at 550~310 °C at various levels.

Figure 8.
The temperature distribution of the molten salt at 300~180 °C.

Figure 9.
Temperature distribution of molten salt at 300~180 °C at various levels.

Figure 10.
The temperature distribution of the insulation foundation.

Figure 11.
Heat losses from the experimental tank.

Figure 12.
The rate of decline of heat losses caused by thermal stratification.


Table 1.
Main geometrical characteristics of the tank.
| Parameter | Units | Value |
|---|---|---|
| Internal diameter | mm | 1200 |
| Cylinder height | mm | 1000 |
| Pump mounting bracket height | mm | 220 |
| Total height | mm | 1281 |
| Thickness of the walls | mm | 6 |
Table 2.
Properties of the insulation materials.
| Position | Insulation Material | Conductivity (W/m·K) | Thickness (mm) |
|---|---|---|---|
| Roof of the tank | Alumina silicate fiber | 200 | |
| Side wall of the tank | Alumina silicate fiber | 350 | |
| Insulation foundation | Foam glass | 300 | |
| Insulation foundation | Firebrick | 450 |
Table 3.
Properties of the new type of molten salt [17].
Table 3.
Properties of the new type of molten salt [17].
| Property | Value |
|---|---|
| Melting point, °C | 94 |
| Density, kg/m3 | |
| Heat capacity, J/kg·K | |
| Thermal conductivity, W/m·K | |
| Dynamic viscosity, kg/m·s |
Table 4.
Comparison of heat loss data from the experimental tank and Solar Two (W/m2).
| Data Sources | Heat Losses Value | |||
|---|---|---|---|---|
| Roof | Wall | Bottom | Average Value | |
| Experiment result (550 °C) | 231.4 | 219.1 | 216.6 | 220.2 |
| Solar Two data (565 °C) | — | — | — | 176.3 |
© 2019 by the authors. Licensee MDPI, Basel, Switzerland. This article is an open access article distributed under the terms and conditions of the Creative Commons Attribution (CC BY) license (http://creativecommons.org/licenses/by/4.0/).
Share and Cite
MDPI and ACS Style
Zhang, X.; Wu, Y.; Ma, C.; Meng, Q.; Hu, X.; Yang, C. Experimental Study on Temperature Distribution and Heat Losses of a Molten Salt Heat Storage Tank. Energies 2019, 12, 1943. https://doi.org/10.3390/en12101943
AMA Style
Zhang X, Wu Y, Ma C, Meng Q, Hu X, Yang C. Experimental Study on Temperature Distribution and Heat Losses of a Molten Salt Heat Storage Tank. Energies. 2019; 12(10):1943. https://doi.org/10.3390/en12101943
Chicago/Turabian StyleZhang, Xiaoming, Yuting Wu, Chongfang Ma, Qiang Meng, Xiao Hu, and Cenyu Yang. 2019. "Experimental Study on Temperature Distribution and Heat Losses of a Molten Salt Heat Storage Tank" Energies 12, no. 10: 1943. https://doi.org/10.3390/en12101943
Note that from the first issue of 2016, this journal uses article numbers instead of page numbers. See further details here.