Article

Forecasting the Low-Voltage Line Damage Caused by Typhoons in China Based on the Factor Analysis Method and an Improved Gravitational Search Algorithm-Extreme Learning Machine

1
Department of Economics and Management, North China Electric Power University, Baoding 071000, China
2
Hebei Electric Power Co., Ltd., Shijiazhuang 050000, China
*
Author to whom correspondence should be addressed.
Energies 2018, 11(9), 2321; https://doi.org/10.3390/en11092321
Submission received: 2 August 2018 / Revised: 28 August 2018 / Accepted: 30 August 2018 / Published: 3 September 2018

Abstract

:
The frequency of typhoons in China has gradually increased, resulting in serious damage to low-voltage power grid lines. Therefore, it is of great significance to study the influencing factors and predict the amount of damage, which contributes to enhancing wind resistance and improving the efficiency of repairs. In this paper, 18 influencing factors with a correlation degree higher than 0.75 are selected by grey correlation analysis, and then converted into six common factors by factor analysis. Additionally, an extreme learning machine optimized by an improved gravitational search algorithm, hereafter referred to as IGSA-ELM, is established to predict the damage caused to the low-voltage lines by typhoons and verify the effectiveness of the factor analysis. The results reveal that the six common factors generated by factor analysis can effectively improve the prediction accuracy and the fitting effect of IGSA-ELM is better than those of the extreme learning machine (ELM) and the extreme learning machine based on particle swarm optimization (PSO-ELM). Finally, this article proposes valid policy recommendations to improve the anti-typhoon capacity and repair efficiency of the low-voltage lines in Guangdong Province.

Graphical Abstract

1. Introduction

1.1. Motivation

With the continuous development of power production and consumption, the requirements of power reliability and high-quality service are gradually increasing. In light of this, it is necessary for power companies to provide high quality power supply services, and improve the ability of withstanding disasters. As we all know, China is one of the countries most seriously affected by typhoons, with 9.09 average annual tropical cyclone landings [1]. Particularly, Guangdong Province, located in the coastal area of southeast China, is most affected by typhoon disasters [2]. According to the Guangdong Provincial Meteorological Yearbook, the number of typhoons landing in the Guangdong province reached 226 from 1945 to 2017, with an average annual number of 3.1, ranking first among coastal provinces in China [3,4]. The main form of typhoon damage to low-voltage power grid lines is to destroy the line nodes and cause an overall connection failure, which poses a threat to the safe and stable transmission of electrical energy [5]. Specifically, the strong typhoons, along with the continuous heavy rain, will result in a large number of broken lines and fallen towers, causing power hazards and safety accidents in local areas. In addition, the power repair work is extremely vulnerable to serious obstacles, which causes huge economic losses to society [6]. According to “The 13th Five-Year Plan for Electric Power Development (2016–2020)”, it is proposed to comprehensively improve the level of intelligent construction and establish a safety early warning system for natural disasters such as mountain fires, ice disasters and typhoons [7]. Compared to other sources, the power outage time caused by typhoons accounted for about 85% of the total annual power outage hours. Advancing with times, China Southern Power Grid plans to build a typhoon response mechanism to enhance disaster resistance [8]. Therefore, studying the typhoon damage to the low-voltage lines in China is conducive to improving the wind-resistant capacity and repair efficiency, which is of great significance to the development of the power grid. In order to achieve the above objectives, it is necessary to conduct an in-depth analysis of the influencing factors of the damage caused by typhoons to the low-voltage lines in China and make predictions. On this basis, effective measures are proposed to prevent typhoon hazards and prepare for rush repairs.

1.2. Literature Review

Throughout our study of the prior literature, the studies were mainly divided into two categories: one was the analysis of the influencing factors of typhoon damage to power facilities, and the other was the prediction of the damage using influencing factors as input values.
In terms of influencing factors, relevant scholars have mainly studied the impact of typhoons on the power grid and analyzed its causes. According to the pre-existing social, physical and economic vulnerabilities, Tatebe et al. [9] adopted geographic information system (GIS) technology to explore the impacts on New Orleans in the context of Hurricane Katrina. The result revealed that pre-existing socio-economic conditions played a significant role in disaster recovery. Meanwhile, some policy recommendations were put forward to reduce social and economic vulnerabilities to natural disasters. By studying the damage to power facilities caused by typhoon wind speeds in North Korea, Jung [10] indicated that the degree of damage to wind power generation was closely related to the wind level. Researching on the damage of power delivery systems caused by the 2013 Super Typhoon Haiyan in Philippines, Dai et al. [11] suggested a design framework with a holistic approach including a strong backbone line system. Based on a wind turbine collapse accident, Chou et al. [12] used finite element method to investigate the causes of collapse, with the ultimate purpose of strengthening risk prevention. Lei et al. [13] indicated that structural measures are not sufficient to resist the damage caused by typhoons. As a result, a risk-sharing model was put forward aiming to combine the government, insurance companies and victims to respond to the impacts of typhoon disasters. Yang et al. [14] studied the cascading failures in complex systems by large-scale modeling to analyze the North American power grid, the result elucidated the origins and causes of cascade failures related to grid design and operation, which demonstrated vulnerability analysis methods for a broader cascading-prone network. In term of the effects of typhoon on wind turbine operating, Li et al. [15] clarified that the wind, drastic turbulence and wind direction were major factors of wind turbine failures, and put forward some advice for strengthening wind resistance design. With regard to power grid wind disaster emergencies, Zhang et al. [16] proposed the grey relational analysis-multi-objective genetic algorithms method (GRAMOGA) for the case adaptation. According to the typhoon impact of the Guangdong Power Grid in 2009–2013, Zheng and Zhong [17] explored the main causes and laws of destruction, putting forward some corresponding countermeasures. Based on the blackouts caused by natural disasters, Wang et al. [18] consolidated the prediction methods of power system disturbance, aiming at hardening the grid. As a consequence, challenges and new research opportunities were put forward. Zhang et al. [19] indicated that the main reason for the damage caused by typhoons to the transmission line was the insufficient bearing capacity of the designed transmission tower structure, resulting in large-scale inverted towers and long-term power interruption. In general, there are certain limitations in the analysis of the influencing factors in the existing literature, with few factors considered. Nevertheless, the statistical analysis method can effectively solve the multivariate problem. In this paper, factor analysis method was adopted to comprehensively study the influencing factors of typhoon on low-voltage lines, extracting the main impact factors.
With respect to the prediction of damage, a few scholars have predicted and warned about the damage caused by typhoons to the power system. Through analyzing the correlation relationship between the salt environment and the actual damage of electric power distribution equipment caused by typhoons, Shumuta et al. [20] established a damage evaluation model to estimate the damage risk potential of the electric equipment. Based on the stress intensity interference model, Geng et al. [21] proposed a method for early warning of the damage in electric transmission lines aiming at putting forward a reasonable warning output. Schaefer et al. [22] believed that the most large-scale network outages are the reasons behind cascading failures. Based on the nature of cascades and the essentials of the network dynamics, they proposed a forecasting method to predict and model cascading failures in power grids Yu et al. [23] integrated historical data and established a logistic model with metabolic probability of power tower as the risk indicator to forecast the damage probability caused by typhoons. To analyze typhoon-induced hazards, Kim et al. [24] established the predictive extreme value theory model, with four meteorological variables including daily precipitation, maximum wind speed, instantaneous wind speed, and hourly precipitation input as parameters. Jun et al. [25] established a region power grid wind hazard precaution system, consisting of the statistical diagnosis model and the numerical forecasting model, to solve the problem of the wind hazard assessment in power grid. Li et al. [26] adopted the grey feature weighted support vector machine model based on particle swarm optimization (PSO-SVM) to analyze the damage discipline of typhoons, which contributed to improving the ability of defending against typhoons. Yates et al. [27] evaluated the hazards of climate-induced electrical infrastructure through the case of Hurricane Sandy. Mohammadi et al. [28] adopted game theory to enhance efficiency of the underlying communication network. With cross-layer interference of femto users (FUs) and macro users (MUs) selected as classification standard, the essential problem was converted into Stackelberg game jointed with convex optimization problem. Finally, a closed form solution was proposed and the effectiveness of the mathematical model was verified by simulation results. In summary, most of the literatures are based on mathematical theory models for prediction, which remains over-fitting and poor generalization capability. A few scholars introduce intelligent algorithms for prediction with fewer variables as input values, which reduced the prediction accuracy.
To sum up, the existing literature on analysis of the destructive effects of typhoons on the power grid is insufficient, mining less influencing factors. Furthermore, intelligent algorithms are seldom applied to the prediction of typhoon damage to low voltage lines, which has advantages in nonlinear forecasting.

1.3. Contribution

In order to overcome the above problems, this article selects the influencing factors of typhoon damage to low-voltage lines in China by grey correlation analysis, and the factor analysis method is used to extract common factors as independent variables, which contributes to screening the key factors and reducing their quantity. In addition, the extreme learning machine optimized by improved gravitational search algorithm (IGSA-ELM), with higher accuracy compared to existing prediction methods in this field, is adopted for the first time to predict the amount of typhoon damage.
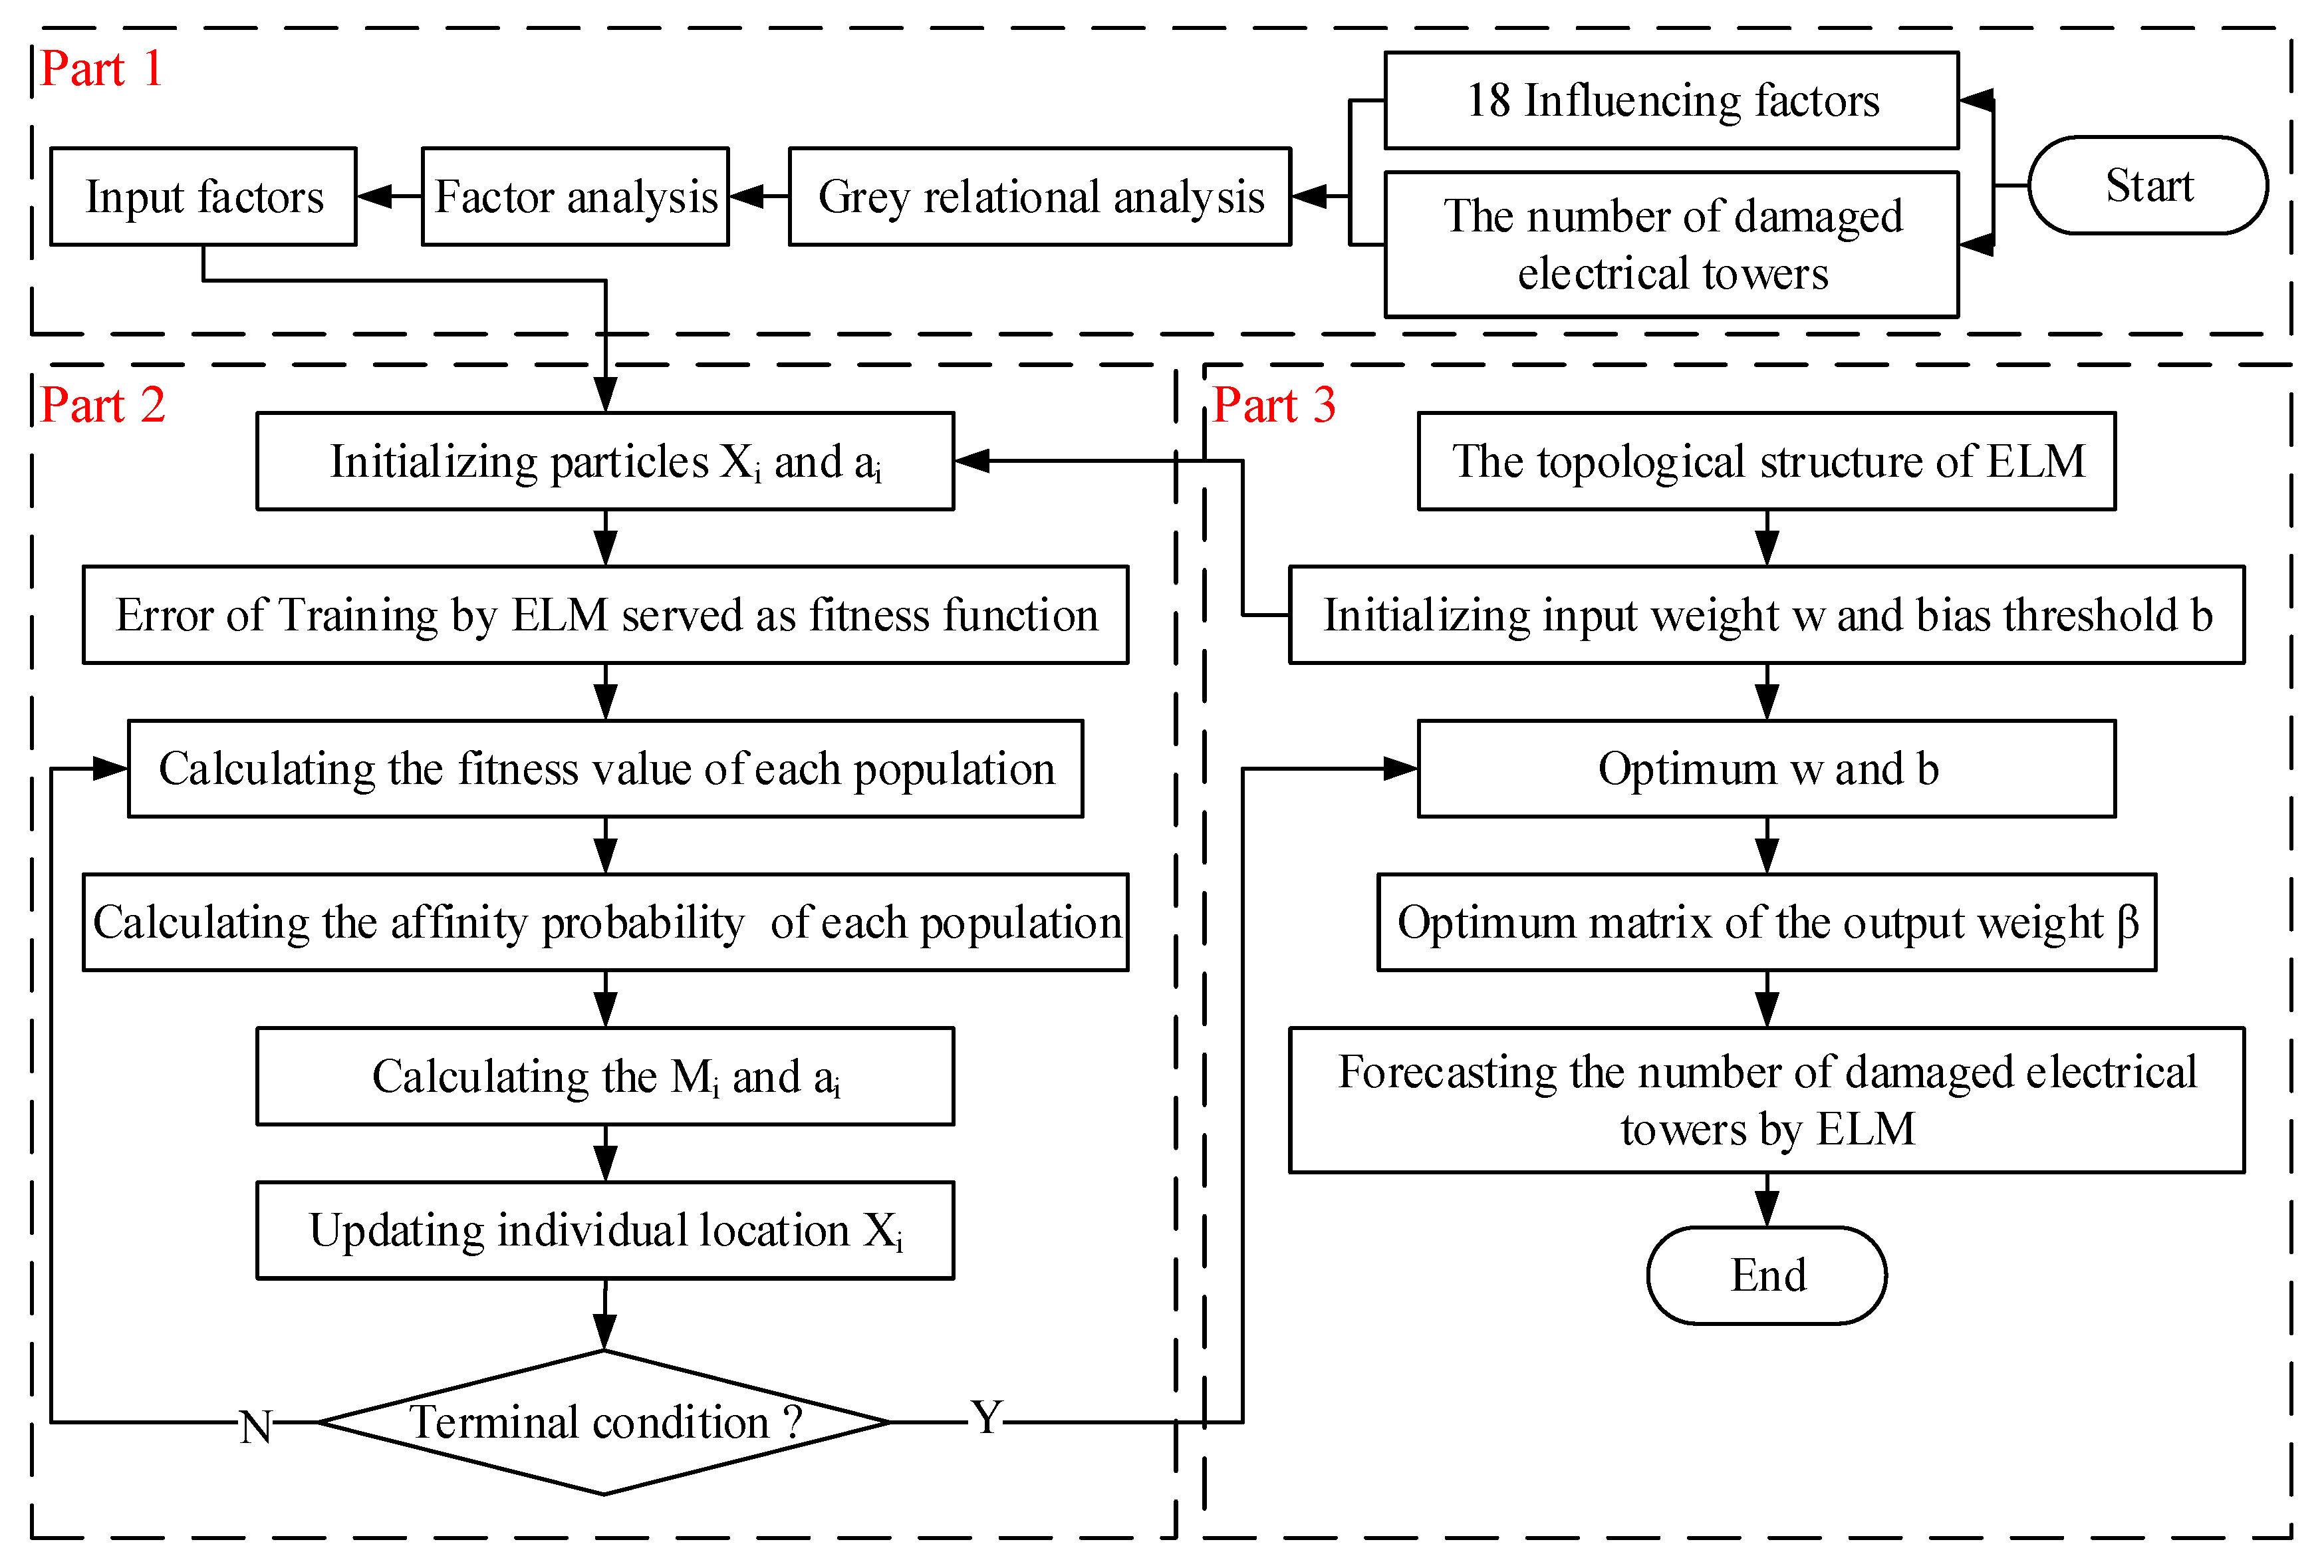
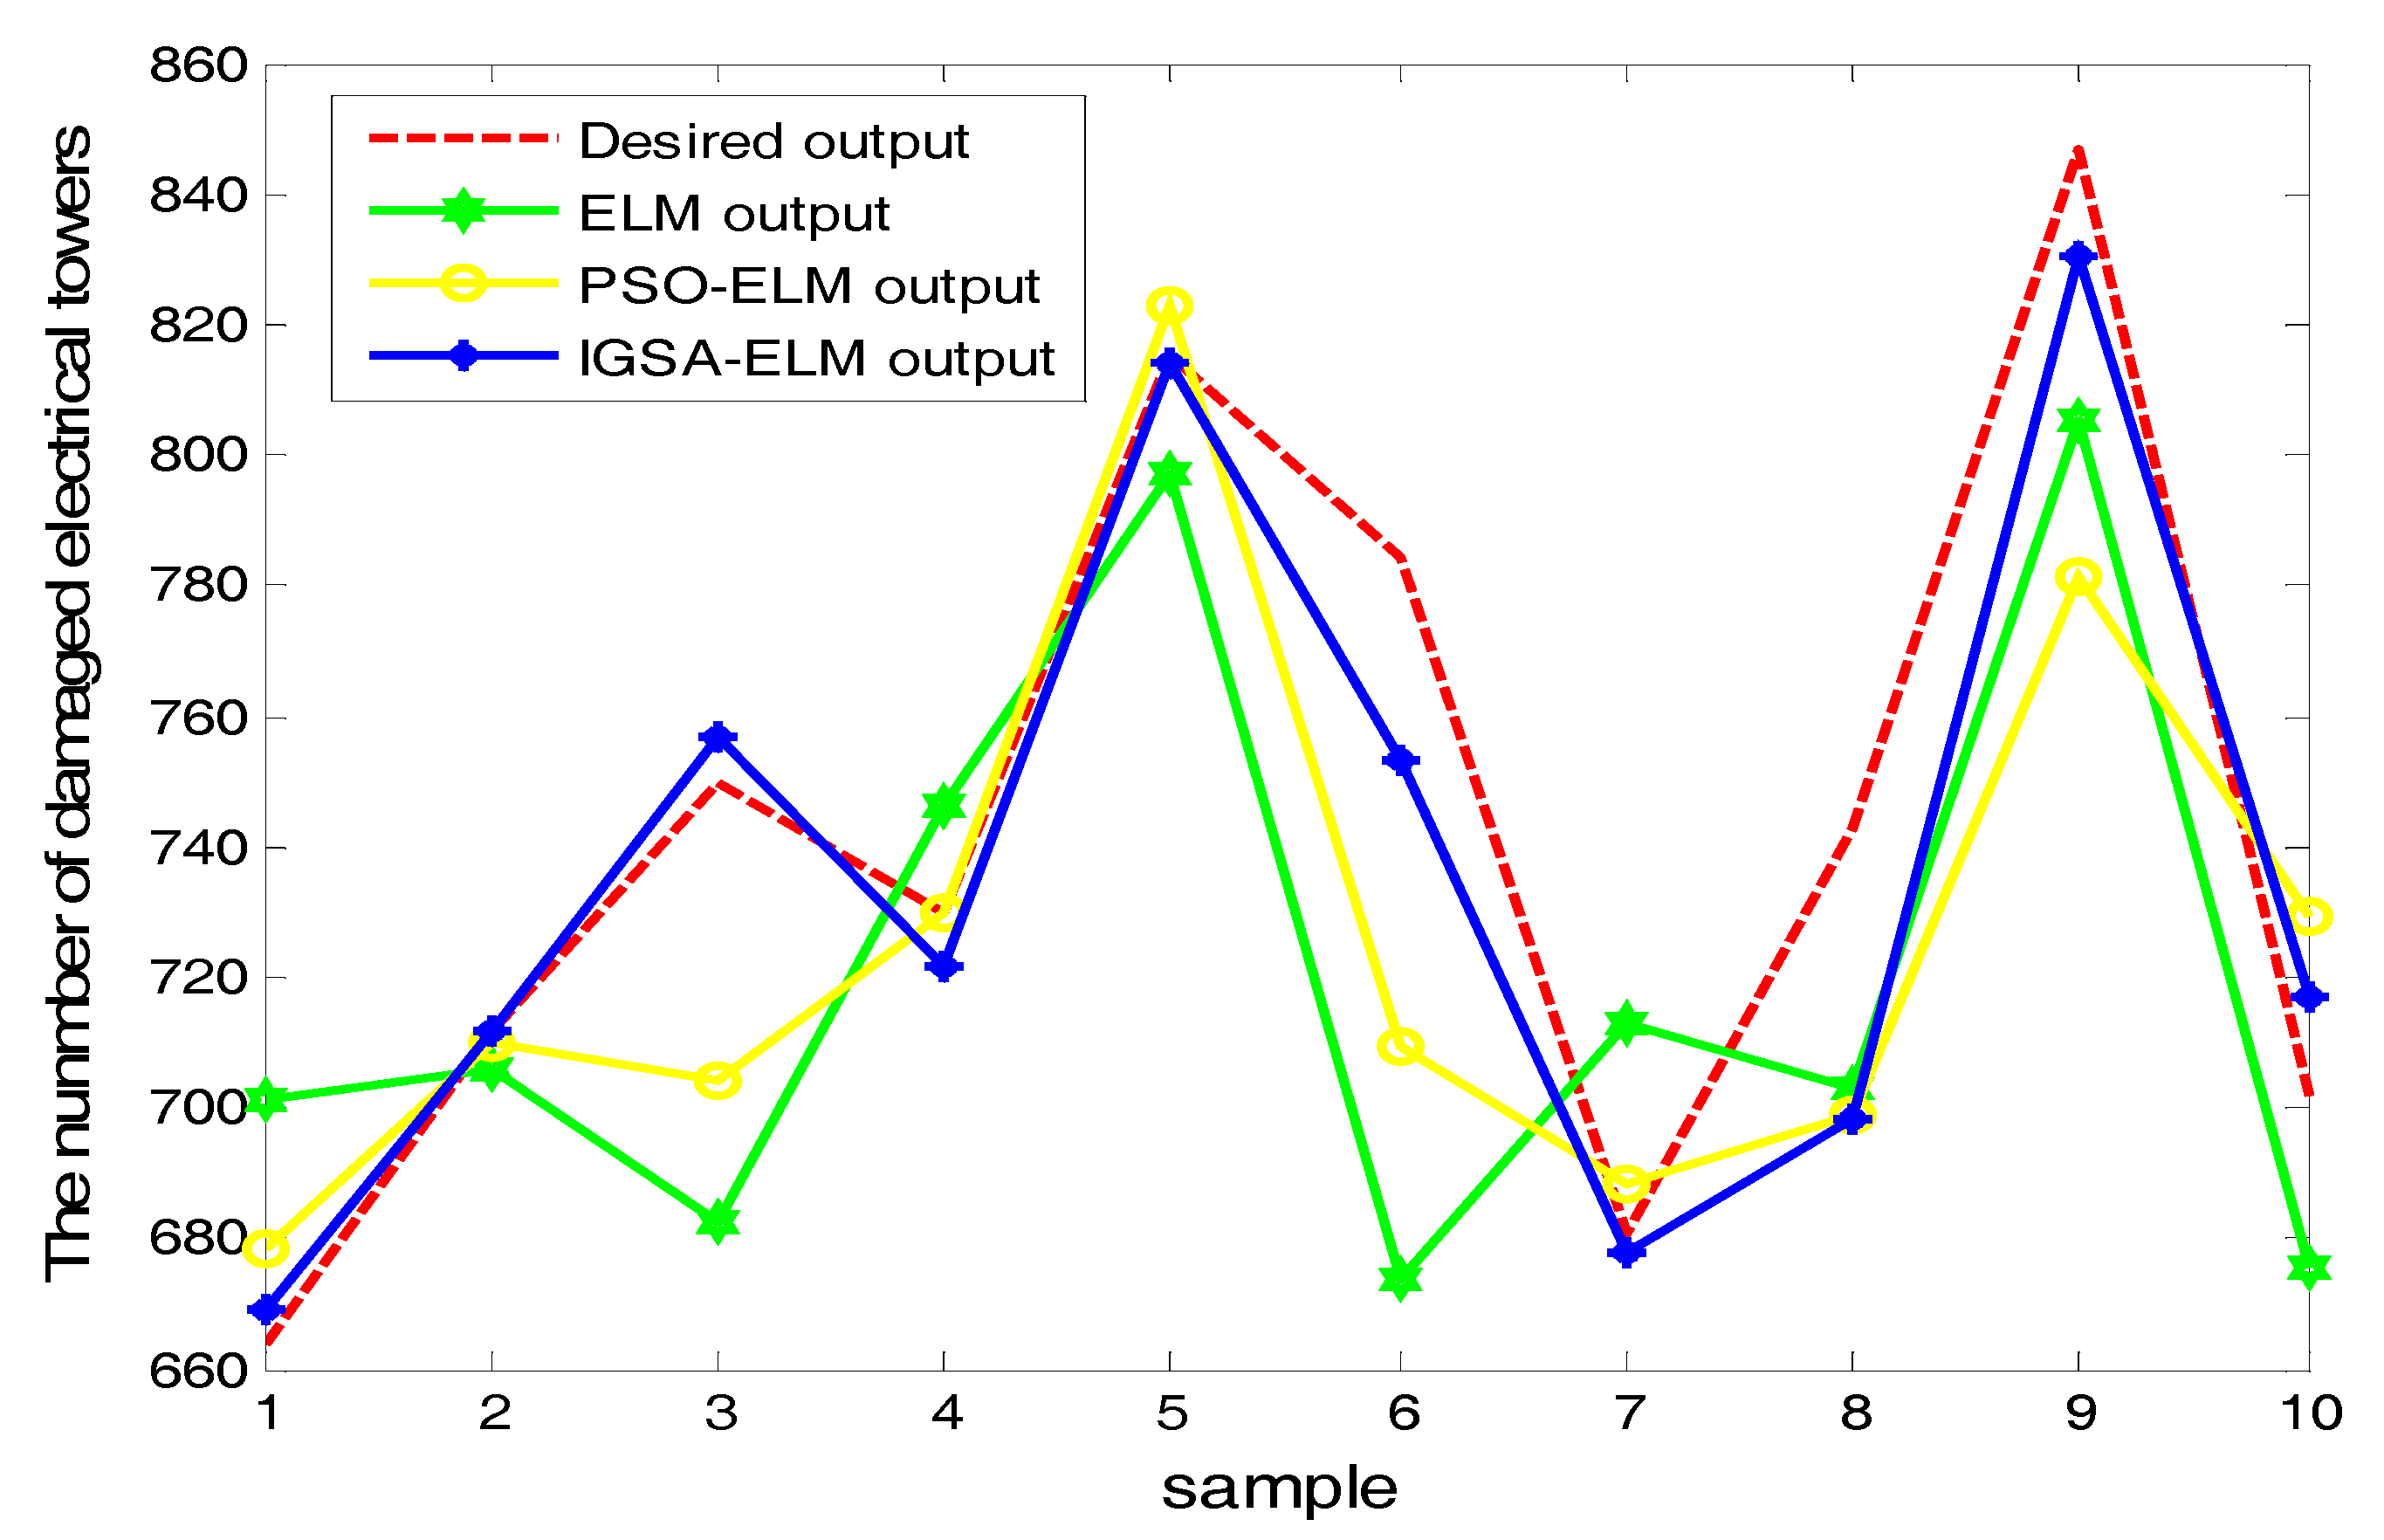
The remainder of this study is organized as follows: firstly, the GRA is applied to analyze the correlation degree between multiple influencing factors and the number of fallen towers, selecting 18 influencing factors to form a perfect index system. Secondly, with the 18 influencing factors divided into five categories, six common factors are proposed as input values of the prediction model by factor analysis, aiming to avoid excessive reduction of factors and information distortion. Thirdly, Compared with ELM and PSO-ELM, the IGSA-ELM model is established to predict the damage, using 50 samples from 1999 to 2015 for training and 10 samples from 2016 to 2017 for testing. Finally, this paper draw conclusions based on the above research.

2. Materials and Methods

2.1. Improved Gravitational Search Algorithm (IGSA)

The Gravitational Search Algorithm (GSA), a new intelligent optimization method proposed by Rashedi et al. in 2009, is a non-memory heuristic algorithm with poor particle learning ability [29]. In this study, the memory and information exchange function in the particle swarm optimization algorithm is introduced to improve the local search accuracy of GSA, for the purpose of finding the optimal solution faster [30]. The new speed update formula is:
v i ( t + 1   ) = R 1 v i ( t ) + c 1 R 2 [ p b x i ( t ) ] + c 2 R 3 [ g b x i ( t ) ] + a i ( t )
where v i is the velocity of the particle i ; R 1 , R 2 , R 3 are random numbers between the values of [0, 1]; p b indicates the optimal position of the individual searched by the particle i ; x i indicates the current position of the particle i ; g b indicates the optimal position which all particles have searched for; c 1 , c 2 are constant between [0, 1], which are used to adjust the information exchange and the memory function between particles. Moreover, a i ( t ) is the acceleration of particle i at time t .
According to the law of universal gravitation and Newton's second law, gravity is directly proportional to the mass of the particles. As the acceleration of the particles is formed according to the superposition of the gravitation from other particles, the effect of itself on other particles can be neglected when the particle mass is relatively small, which contributes to speeding up the convergence. Thereby, the preferred strategy is introduced into the particle acceleration update formula, with the optimal particle affecting the acceleration of other particles [31]. The new acceleration update formula is obtained:
a i = j i   N R 4 × F i j ( t ) M i ( t )
where F i j ( t ) is the gravity between particles i and j ; R 4 represents the random number between [0, 1]; M i ( t ) represents the inertial mass acting on the particle i .

2.2. Extreme Learning Machine (ELM)

ELM is a new method proposed by Huang et al. to solve single-hidden layer feedforward neural network (SLFN) problems [32]. At present, as an emerging machine learning method, ELM, which has been widely studied by many researchers around the world, has become a hot research topic. In terms of SLFN network, ELM uses the number of hidden network layers calculated randomly for network training, which greatly reduces the time and the computational complexity. Since these parameters are independent of the training data, ELM with the generalization ability equivalent to support vector machine (SVM) and traditional back propagation (BP) neural network can achieve the minimum training error and the minimum norm of the output weight [33]. From the structure of the neural network, ELM is a simple SLFN (as shown in Figure 1). With fast learning speed and good generalization performance, ELM has attracted more attention from experts and scholars at home and abroad. To sum up, ELM is not only suitable for classification and pattern recognition, but also for regression and fitting problems, etc. [34].

2.3. Extreme Learning Machine Optimized by Improved Gravitational Search Algorithm (IGSA-ELM)

As we know, ELM has the advantages of small training error and fast learning speed when used for regression prediction analysis. Nevertheless, the stability and generalization ability are poor, due to the connection weight w i j between the input layer and the hidden layer and the threshold b j of the hidden layer neuron, both of which are randomly selected in the ELM. Furthermore, with some useless individual hidden layer nodes and the unstable learning effect, ELM has to set a large number of hidden layer nodes to achieve the desired precision. Nevertheless, excessive hidden layer nodes are prone to over-fitting and reduce the generalization ability of ELM.
In light of this, IGSA, a method with a strong global optimization ability and simple to implement, is introduced into ELM to optimize the connection weight w i j and the threshold b j , where some unimportant hidden layer nodes are identified and deleted to simplify the network structure. Ultimately, the prediction model based on IGSA-ELM is established to improve the regression prediction performance of the neural network. The specific implementation steps are shown in Figure 2. Compared with ELM, IGSA-ELM has better stability and generalization performance, and can achieve higher accuracy with fewer hidden layer nodes. With the space of hidden layer nodes saved, IGSA-ELM has high application value in many fields.
As illustrated in Figure 2, based on literature research and expert consultation, Section 1 obtains 18 influencing factors of the damage caused by typhoons on the low-voltage lines by grey correlation analysis. Furthermore, six common factors are extracted as the input variables of the prediction model by factor analysis. Section 2 is an improved gravitational search algorithm. In Section 3, the amount of damage is predicted using the extreme learning machine.

3. Data Analysis

3.1. Data Sources and Usage

In this article, the initial data was obtained from the Guangdong Provincial Meteorogical Yearbook, China Southern Grid Corp Yearbook [35], China Weather Typhoon network, and Shanghai Typhoon Warning Center (STWC)-Typhoon data center [36]. In particular, the typhoon longitudinal mileage index adopts map ranging, which is 35 km.

3.2. Grey Relational Analysis

Grey Relation Analysis (GRA), proposed by Deng in 1982, was used to quantitatively analyze the interrelationship between complex factors [37]. The advantage is that the data requirement is low, and it is suitable for small sample research under the condition of incomplete information, and the utility model has wide application range and simple calculation. With the advantage of low data requirement and simple calculation, GRA is suitable for small sample research under the condition of incomplete information.
Based on the existing research, there are many influencing factors on the damage of low-voltage lines caused by typhoons, with different correlations among each influencing factor and dependent variable. In the prediction, it is impossible to select all influencing factors as independent variables.
Combined with the actual situation of typhoon damage in Guangdong Province, GRA is adopted to measure the correlation between various influencing factors and the damaged towers, revealing the relevant characteristics and extent of typhoon damage to low-voltage lines. In this paper, the amount of damaged towers is selected as the parameter series, representing the destruction of low-voltage lines by typhoons. Meanwhile, the typhoon landing grade, longitudinal mileage, moving speed, storm level, rainfall duration, designed wind resistance rating, typhoon diameter, line tower rate, path tortuosity, line running time, line density, wind declination, wire cross section, distance from typhoon center, tower ground depth, the number of wire split, line maintenance frequency, and the diameter of typhoon vortex are selected as comparison series. Among them, the line tower rate is the ratio of the number of lines in the common tower to the total number of lines, and the path tortuosity is the ratio of the typhoon moving distance to the displacement. In addition, the line density is the number of lines per square kilometer. The results of the correlation analysis of each factor are shown in Table 1.
As revealed in Table 1, the 18 influencing factors have a strong correlation with the damage of the typhoon on the low-voltage line, with the correlation degrees all above 0.74, and the correlation is strong. The impact of various influencing factors from strong to weak are typhoon landing level, the distance from the typhoon center, the designed wind resistance rating, the line running time, the longitudinal mileage, the wind declination, the moving speed, the path tortuosity, the number of wire splits, the diameter of typhoon vortex, line maintenance frequency, wire cross section, line density, rainfall duration, typhoon diameter, tower ground depth, and line tower rate.

3.3. Factor Analysis

With regard to multivariate statistical analysis, factor analysis is a statistical method which extracts the common factors from the variable group for dimensionality reduction, with multiple indicators converted into a few unrelated comprehensive factors [38]. As the common factors reflect the intrinsic dependence between variables, the original variables can be substituted by them to be more interpretable, making it easier to describe the characteristics of the original object and avoiding the distortion caused by the repetition of the variable.
In this paper, factor analysis is adopted to reduce the dimension of 18 influencing factors. Initially, in order to avoid excessive degree of dimensionality reduction, the influencing factors are classified into five categories consisting of rainfall, wind strength, wind resistance, number of lines, and duration, based on the characteristics of typhoon destruction and low-voltage lines. Then, in the same category, common factors are selected according to the Kaiser-Meyer-Olkin (KMO) and Bartlett tests. The results of factor analysis are shown in Table 2, Table 3, Table 4, Table 5 and Table 6.
In Table 2, there is a common factor F1 among the four influencing factors, of which the cumulative contribution rate is 96.524%, higher than 85%. First, the value of KMO is 0.714, more than the minimum value 0.7, which indicates that it is suitable for factor analysis. As to Bartlett spherical test, the approximate chi-square statistic is 235.442, and the significance level P is 0.00041, less than 0.05, which indicates a significant correlation condition. The result reveals that the null hypothesis of uncorrelated indicators is rejected, indicating that the variables are not completely independent and the correlation is significant. Therefore, the public factor F1 is nominated as rainfall factor.
Similarly, the results of factor analysis for other categories are shown in Table 3, Table 4, Table 5 and Table 6. In particular, two common factors (F21 and F22), are extracted to describe the variables in Table 3. In view of the fact that only 51.73% of the original variable information can be reflected when factor F21 is extracted alone, two common factors F21 and F22 are obtained, with cumulative contribution rate 97.347%, which can fully reflect the original data information without massive loss of information. By comparison, the factor load F21 of typhoon landing level, the distance from the typhoon center, the number of wire splits, and the wire cross section are higher than that of the wind declination. Conversely, the factor load F22 of the wind declination is higher than other influencing factors. Therefore, F21 and F22 are designated as the wind intensity factor and the wind direction factor respectively. Likewise, F3, F4, and F5 are separately defined as wind resistance factor, line quantity factor, and duration factor.
To sum up, this paper extracts six common factors as input variables of the prediction model, including rainfall factor F1, wind intensity factor F21, wind direction factor F22, wind resistance factor F3, line quantity factor F4, and duration factor F5, of which the values are obtained by factor scores. Based on the factor scores, specific factor variables are constructed to predict the damage to low-voltage lines caused by typhoons in Guangdong Province.

3.4. Application of the IGSA-ELM

In the MATLAB 2016a environment, a mathematical software suitable for data analysis and computation, IGSA-ELM is applied to predict the damage of the low-voltage lines caused by typhoons. The root mean square error (RMSE) and mean absolute percentage error (MAPE) are utilized as the error metrics, of which the equations are:
R M S E = 1 n i n | y ^ i y i   y i | 2
M A P E = 1 n i = 1   n | y ^ i y i y i | 100 %
In the IGSA-ELM prediction model, six common factors are taken as inputs, and the number of damaged towers is taken as the output. When optimizing IGSA with PSO, it is critical to set the connection weight and threshold parameters. In PSO, the max-generation = 40, the size of population = 40, whilst in ELM, nodes of the hidden layer is 10. Among the 60 collected samples, samples 1–50 are selected as training samples, correspondingly, samples 51–60 are testing samples used to verify prediction accuracy.

4. Results and Discussions

In order to ensure the rationality of factor analysis, the extreme learning machine (ELM) and the extreme learning machine based on particle swarm optimization (PSO-ELM) are selected as the comparison models to verify the prediction accuracy of the IGSA-ELM model. The results are shown in Figure 3.
As illustrated in Figure 3, by comparing the predicted values with the actual samples, we can draw the conclusion that apparently the predicted values of the IGSA-ELM model are optimally fitted to the real values in the three prediction models, while the ELM and PSO-ELM prediction models have large deviations at individual points. For example, the fitting deviations of ELM in samples 1, 3, 4, 5, 6, and 7 are largest. Meanwhile, the fitting deviations of PSO-ELM in sample 9 is biggest. Obviously, IGSA-ELM is suitable for predicting typhoon damage to low-voltage grid lines, which significantly improves the forecasting accuracy compared with the other methods.
From the perspective of error, Table 7 shows that the prediction errors of IGSA-ELM are smaller than the other two models. As for PSO-ELM, the values of RMSE and MAPE are 0.049485 and 3.6717%, about 22.2611% and 28.3707%, lower than ELM respectively, which represents good prediction accuracy. Nevertheless, the IGSA-ELM, whose RMSE and MAPE values are only 0.025079 and 1.7438%, achieves better prediction results. To sum up, with reasonable selection of factors and higher prediction accuracy, the IGSA-ELM model is suitable for the prediction of typhoon damage to low-voltage lines in Guangdong Province.
Furthermore, extracted from 18 factors with high correlation, the six common factors can reflect the different effects of typhoon damage on low-voltage lines, which can be applied to decision making. Based on the above research, pertinent strategies and measures are provided to reduce the damage of low-voltage lines caused by typhoons in Guangdong Province.
Obviously, wind strength plays a vital role in typhoon damage [39]. In addition of the typhoon itself, the wind strength can be effectively reduced by decreasing the wind load. Considering F2, with higher factor load, the number of wire splits, cross section and wind declination are the key factors of line stress. Therefore, adopting high-tech wire material to reduce the number of splits and wire cross-section, and adjusting the line route according to the wind direction probability are significant measures to reduce the damage.
Referring to wind resistance, it is an effective way to improve the wind resistance of the low-voltage line to resist typhoon damage. In terms of F3, the local power grid company should improve the level of wind-resistant design, which contributes to effectively reducing the typhoon destructive risk. In order to improve stability, the maintenance frequency of lines should be increased, with old line replaced in time.
As regards line quantity factor F4, the low-voltage lines in the Guangdong province are widely distributed, presenting a dense situation. However, regional intensive low-voltage lines have adverse effects on the resistance of typhoons [40]. Therefore, reducing the density of regional low-voltage lines and the line tower rate can effectively decrease the concentrated damage.
As mentioned above, it can be concluded that governments and grid companies can take appropriate actions based on impact factors to reduce the damage to low-voltage lines caused by typhoons. Compared with previous studies, this article analyzes the influencing factors of typhoon damage on low-voltage lines and establishes an accurate prediction model to forecast the number of damaged electrical towers, which is conducive to improving the typhoon resistant capability of power grids and avoiding power interruption. In addition, the predicted results can provide reference for the preparation of electric emergency repair, including manual, materials and machineries. Finally, effective measures should be taken to reduce the loss caused by frequent typhoons in southeast coastal areas of China.

5. Conclusions

In this study, based on the correlation of influencing factors, and the nature of typhoon damage, 18 influencing factors are transformed into six common factors through factor analysis. Afterwards, the six factors are input into IGSA-ELM model to forecast the number of damaged towers. According to the curve fitting effect, it can be known that the IGSA-ELM model with six common factors as input values is accurate. Meanwhile, compared with PSO-ELM and ELM, it is regarded as evident to conclude that IGSA-ELM has the lowest RMSE and MAPE, indicating that IGSA-ELM has better applicability and accuracy in predicting the damage of low-voltage line caused by typhoons in Guangdong Province.
As we know, in recent years, typhoon natural disasters are occurring frequently in the southeastern coastal areas of China, posing a serious threat to the stability of the power supply. Hence, studying the influencing factors of typhoon damage on low-voltage lines in Guangdong Province is of great significance for preventing future damage and service disruptions. In addition, an accurate prediction model is established in this paper to provide evidence for the amount of materials needed for post-disaster power repair, which is conducive to saving maintenance time.

Author Contributions

Investigation, W.W.; Methodology, W.P. and H.W.; Resources, W.P. and C.S.; Supervision, X.T.

Funding

This research was funded by [the Optimal Planning and Operation Control Technology of Cogeneration Based on Wind Power Consumption] grant number [No. 2015BAA01B01]” and [the State Grid Corporation Science and Technology Project Funding] grant number [No. Kjgw2018-014].

Conflicts of Interest

The authors declare no conflict of interest.

References

  1. Wei, C.C. Nearshore wave predictions using data mining techniques during typhoons: A case study near Taiwan’s northeastern coast. Energies 2017, 11, 11. [Google Scholar] [CrossRef]
  2. Bo, Z.; Ouyang, S.; Zhang, J.; Shi, H.; Wu, G. An analysis of previous blackouts in the world: Lessons for China’s power industry. Renew. Sustain. Energy Rev. 2015, 42, 1151–1163. [Google Scholar] [CrossRef]
  3. Guangdong Meteorogical Service. Guangdong Provincial Meteorological Yearbook 2017. Available online: http://www.grmc.gov.cn/qxgk/qxnj/201708/t20170829_25503.html (accessed on 25 April 2018).
  4. Shanghai Typhoon Warning Center. Guangdong Typhoon Overview. Available online: http://www.stwc.info/h-col-175.html (accessed on 4 May 2018).
  5. Mao, S.; Wang, C.; Yu, S.; Gen, H.; Yu, J.F.; Hou, H. Review on economic loss assessment of power outages. Procedia Comput. Sci. 2018, 130, 1158–1163. [Google Scholar]
  6. Yin, J.; Dai, E.B.; Wu, S.H. Integrated risk assessment and zoning of typhoon disasters in China. Sci. Geogr. Sin. 2013, 11, 1370–1377. [Google Scholar]
  7. The 13th Five-Year Plan for Power Development (2016–2020). Available online: http://shupeidian.bjx.com.cn/news/20161107/786746-8.shtml (accessed on 27 April 2018).
  8. Souhu Net. South Network Wisdom and Grid Standard Behind Typhoon. Available online: http://www.sohu.com/a/190755830_99911830 (accessed on 15 May 2018).
  9. Tatebe, W.; Muraji, M.; Fujii, T.; Berg, H. Distribution of impacts of natural disasters across income groups: A case study of New Orleans. Ecol. Econ. 2007, 63, 299–306. [Google Scholar]
  10. Jung, W.S. An Estimation of extreme wind speed of typhoon affecting the damage of public and industrial facilities. J. Environ. Sci. Int. 2015, 24, 1199–1210. [Google Scholar] [CrossRef]
  11. Dai, K.; Chen, S.E.; Luo, M.; Loflin, G., Jr. A framework for holistic designs of power line systems based on lessons learned from super typhoon Haiyan. Sustain. Cities Soc. 2017, 35, 350–364. [Google Scholar] [CrossRef]
  12. Chou, J.S.; Ou, Y.C.; Lin, K.Y.; Wang, C.G. Structural failure simulation of onshore wind turbines impacted by strong winds. Eng. Struct. 2018, 162, 257–269. [Google Scholar] [CrossRef]
  13. Lei, Y.; Liu, C.; Zhang, L.; Li, D. Adaptive governance to typhoon disasters for coastal sustainability: A case study in Guangdong, China. Environ. Sci. Policy 2015, 54, 281–286. [Google Scholar] [CrossRef]
  14. Yang, Y.; Nishikawa, T.; Motter, A.E. Small vulnerable sets determine large network cascades in power grids. Science 2017, 358, eaan3184. [Google Scholar] [CrossRef] [PubMed] [Green Version]
  15. Li, Z.Q.; Chen, S.J.; Ma, H.; Feng, T. Design defect of wind turbine operating in typhoon activity zone. Eng. Fail. Anal. 2013, 27, 165–172. [Google Scholar] [CrossRef]
  16. Zhang, B.; Li, X.; Wang, S. A novel case adaptation method based on an improved integrated genetic algorithm for power grid wind disaster emergencies. Expert Syst. Appl. 2015, 42, 7812–7824. [Google Scholar] [CrossRef]
  17. Zheng, G.; Zhong, H.Z. Risk analysis of Guangdong power grid affected by typhoon. Electr. Age 2015, 3, 80–83. [Google Scholar]
  18. Wang, Y.; Chen, C.; Wang, J.; Baldick, R. Research on resilience of power systems under natural disasters—A review. IEEE Trans. Power Syst. 2016, 31, 1604–1613. [Google Scholar] [CrossRef]
  19. Zhang, Z.Q.; Li, J.; Qin, W. Cause analysis of continuous tower collapse for 138kV transmission line. J. Beijing Inst. Technol. 2016, 15, 18–22. [Google Scholar]
  20. Shumuta, Y.; Kihara, N.; Hattori, Y. Sensitivity Analysis for Estimating Salt-Induced Damage to Voltage–Current Transformers due to Typhoons. Electr. Eng. Jpn. 2015, 193, 34–43. [Google Scholar] [CrossRef]
  21. Geng, H.; Huang, Y.; Yu, S.; Hou, H. Research on Early Warning Method of Overhead Transmission Line Damage Caused by Typhoon Disaster. Procedia Comput. Sci. 2018, 130, 1170–1175. [Google Scholar] [CrossRef]
  22. Schaefer, B.; Witthaut, D.; Timme, M.; Latora, V. Dynamically induced cascading failures in power grids. Nat. Commun. 2018, 9. [Google Scholar] [CrossRef] [PubMed]
  23. Yu, S.; Wu, H.; Geng, H.; Mao, S. Study on Risk Assessment of the Electric Power Tower and Pole Damage in Power System under Typhoon Disaster. Procedia Comput. Sci. 2018, 130, 1164–1169. [Google Scholar] [CrossRef]
  24. Kim, Y.; Jang, S.C.; Lim, T.J. Hazard analysis of typhoon-related external events using extreme value theory. Nucl. Eng. Technol. 2015, 47, 59–65. [Google Scholar] [CrossRef]
  25. Jun, L.U.; Zhu, Y.; Peng, W. Feature Selection Strategy for Electricity Consumption Behavior Analysis in Smart Grid. Autom. Electr. Power Syst. 2017, 41, 58–63. [Google Scholar]
  26. Li, D.J.; Wang, W.J.; Zhang, X.T. Forecasting on damages of typhoon to electricity facilities based on regional sample analysis. Guangdong Electr. Power 2018, 4, 84–89. [Google Scholar]
  27. Yates, D.; Luna, B.Q.; Rasmussen, R.; Bratcher, D. Stormy Weather: Assessing Climate Change Hazards to Electric Power Infrastructure: A Sandy Case Study. IEEE Power Energy Mag. 2014, 12, 66–75. [Google Scholar] [CrossRef]
  28. Mohammadi, A.; Dehghani, M.J.; Ghazizadeh, E. Game Theoretic Spectrum Allocation in Femtocell Networks for Smart Electric Distribution Grids. Energies 2018, 11, 1635. [Google Scholar] [CrossRef]
  29. Rashedi, E.; Nezamabadi-Pour, H.; Saryazdi, S. GSA: A gravitational search algorithm. Inf. Sci. 2009, 179, 2232–2248. [Google Scholar] [CrossRef]
  30. Sarhani, M.; Afia, A.E.; Faizi, R.; Sarhani, M.K. Facing the feature selection problem with a binary PSO-GSA approach. In Recent Developments in Metaheuristics, 1st ed.; Amodeo, L., Talbi, E.G., Eds.; Operations Research/Computer Science Interfaces Series; Springer, Cham: New York, NY, USA, 2018. [Google Scholar]
  31. Mangaiyarkarasi, S.P.; Raja, T.S.R. Optimal location and sizing of multiple static var compensators for voltage risk assessment using hybrid PSO-GSA algorithm. Arab. J. Sci. Eng. 2014, 39, 7967–7980. [Google Scholar] [CrossRef]
  32. Huang, G.B.; Zhu, Q.Y.; Siew, C.K. Extreme Learning Machine: A New Learning Scheme of Feedforward Neural Networks. In Proceedings of the 2004 IEEE International Joint Conference on Neural Networks, Budapest, Hungary, 25–29 July 2004. [Google Scholar]
  33. Luo, J.X.; Luo, D.; Yue-Ming, H.U. A new online extreme learning machine with varying weights and decision level fusion for fault detection. Control Decis. 2018, 33, 1033–1040. [Google Scholar]
  34. Cao, X.; Liu, L.; Yang, P.; Song, Y. The research of locomotion-mode recognition based on multi-source information and extreme learning machine. Chin. J. Sens. Actuators 2017, 30, 1171–1177. [Google Scholar]
  35. China Southern Power Grid. China Southern Grid Corp Yearbook 2015; Guangdong science and Technology Press: Guangdong, China, 2016.
  36. STWC-Typhoon Data Center. Typhoon Yearbook 2000–2017. Available online: http://www.stwc.info/h-col-108.html (accessed on 20 June 2018).
  37. Li, Z.Z. Study on the influence factors of consumption level of residents in Henan based on grey correlation analysis. Value Eng. 2018, 10, 176–177. [Google Scholar]
  38. Sun, W.; Wang, C.; Zhang, C. Factor analysis and forecasting of CO2 emissions in Hebei, using extreme learning machine based on particle swarm optimization. J. Clean. Prod. 2017, 162, 1095–1101. [Google Scholar] [CrossRef]
  39. Luo, J. Discussion on the strengthening measures against typhoon for the power distribution network. South. Power Syst. Technol. 2013, 3, 406–416. [Google Scholar]
  40. Chen, B.Y.; Li, C.Z.; Tong, H.; Bi, W.X. Evaluation of Typhoon Resilience of Distribution Network Considering Grid Reconstruction and Disaster Recovery. Autom. Electr. Power Syst. 2018, 42, 47–52. [Google Scholar]
Figure 1. The structure of ELM model.
Energies 11 02321 g001
Figure 2. Flowchart of the IGSA-ELM model.
Energies 11 02321 g002
Figure 3. Fitting curves of the ten predictions and desired output.
Energies 11 02321 g003
Table 1. Correlation analysis of 18 influencing factors.
Influencing FactorsCorrelationInfluencing FactorsCorrelation
distance from typhoon center0.9514the diameter of typhoon vortex0.8122
typhoon landing grade0.9449line maintenance frequency0.8045
designed wind resistance rating0.9433wire cross section0.7881
line running time0.9367line density0.7684
longitudinal mileage0.9021storm level0.7635
wind declination0.8646rainfall duration0.7572
moving speed0.8244typhoon diameter0.7538
path tortuosity0.8143tower ground depth0.7527
the number of wire splits0.8124line tower rate0.7451
Table 2. Factor analysis of rainfall.
Influencing FactorFactor Load F1Factor Score F1IndexValue
storm level0.9760.261KMO0.714
rainfall duration0.9840.261Bartlett’s test235.442
the diameter of typhoon vortex0.9860.264P0.00057
tower ground depth0.9800.263Contribution rate96.524%
Table 3. Factor analysis of wind strength.
Influencing FactorFactor Load F21Factor Load F22Factor Score F21Factor Score F22IndexValue
typhoon landing grade0.8630.7430.738−1.341KMO0.749
distance from typhoon center0.8710.7710.728−1.880Bartlett’s test269.443
the number of wire splits0.8900.7690.763−1.049P0.00041
wire cross section0.8680.7840.719−0.861Contribution rate97.347%
wind declination0.7540.8430.8335.192
Table 4. Factor analysis of wind resistance.
Influencing FactorFactor Load F3Factor Score F3IndexValue
designed wind resistance rating0.9880.355KMO0.784
line maintenance frequency0.9840.353Bartlett’s test164.51
line running time−0.975−0.351P0.00083
Contribution rate99.025%
Table 5. Factor analysis of number of lines.
Influencing FactorFactor Load F4Factor Score F4IndexValue
longitudinal mileage0.9540.349KMO0.786
line density0.9770.346Bartlett’s test191.357
line tower rate0.9720.348P0.00096
Contribution rate94.547%
Table 6. Factor analysis of duration.
Influencing FactorFactor Load F5Factor Score F5IndexValue
typhoon diameter0.9670.258KMO0.785
path tortuosity0.9840.256Bartlett’s test191.377
moving speed−0.994−0.259P0.00074
Contribution rate97.816%
Table 7. Error analysis of the compared models.
IndexIGSA-ELMELMPSO-ELM
RMSE0.0250790.0639540.049485
MAPE (%)1.74385.25913.7671

