Article

Cavitation Effects on the Structural Resonance of Hydraulic Turbines: Failure Analysis in a Real Francis Turbine Runner

1
Huaneng Clean Energy Research Institute, Lab Building A, CHNG Innovation Base, Beijing 102209, China
2
Department of Energy and Power Engineering, Tsinghua University, Beijing 100084, China
3
College of Water Resources & Civil Engineering, China Agricultural University, Beijing 100084, China
*
Author to whom correspondence should be addressed.
Energies 2018, 11(9), 2320; https://doi.org/10.3390/en11092320
Submission received: 13 July 2018 / Revised: 19 August 2018 / Accepted: 31 August 2018 / Published: 3 September 2018
(This article belongs to the Section A: Sustainable Energy)

Abstract

:
When discussing potential resonances in hydraulic turbine runners, cavitation effects are usually neglected. Nevertheless, recent studies have experimentally proved, that large cavitation volumes in the proximity of flexible simple structures, such as hydrofoils, greatly modify their natural frequencies. In this paper, we analyze a resonance case in a Francis runner that leads to multiple fractures on the trailing edge of the blades, after just one day of operation at deep part load. If simple acoustic Fluid-Structure-Interaction (FSI) simulations are used, where the runner’s surrounding fluid is considered as a homogenous acoustic medium (water), the risk of structural resonances seems to be limited as the predicted natural frequencies are far enough from the excited frequencies by the flow. It is shown that the only hydraulic phenomenon which could have produced such fractures in the present case is the Rotor Stator Interaction (RSI). In order to analyze possible cavitation effects on the natural frequencies of the turbine runner, CFD simulations of the deep part load conditions have been performed, which predict large inter-blade vortex cavities. These cavities have been then introduced in the acoustical FSI model showing that under such conditions, natural frequencies of the runner increase approaching to some of the RSI excited frequencies. In particular, a possible resonance of the four-nodal diameter (4ND) mode has been found which would explain the fast behavior of the crack propagation. Furthermore, the shape and the position of the real fracture found agree with the local maximum stress spots at the junction between the trailing edges and the crown.

1. Introduction

Fluid-Structure-Interaction (FSI) phenomena have received wide attention since decades as they are involved in dynamic problems of real engineering structures in fields such as aerodynamics, buildings& civil structures and submerged structures such as dams, naval architectures and hydraulic turbines. When a structure is surrounded by a heavy fluid, one of the most relevant FSI effects is the added mass [1,2], which is responsible to greatly modify its natural frequencies. As structural resonances can occur if a periodical excitation matches one of the natural frequencies, it is of paramount importance to accurately determine the added mass effect.
Natural frequencies of submerged structures and added mass effect have been deeply studied in the last century. One of the first related studies is the work of Lamb [3] for simple thin plates performed almost one century ago. More recently, the researches of Amabili et al. [4,5] and Kwak [6] revise and improve the analytical work performed by Lamb. Furthermore, many studies performed in the last decade show that acoustical FSI simulations are perfectly capable to predict natural frequencies of submerged structures [7,8,9]. In all the aforementioned studies simple thin plates have been considered.
In the particular case of reaction hydraulic Turbines, which are completely submerged, added mass effects play an important role and have to be considered for the calculation of the natural frequencies as well. In this case the added mass phenomenon is even more complicated, as the gaps turbine-casing (usually considered as rigid boundaries) are extremely small (less than 1% of the turbine diameter), the turbine is rotating, and the water couples the turbine with the casing. Some effects such as rotation [10], influence of non-rigid surfaces [11] and acoustic modes [12] have been recently discussed using numerical FSI simulations and contrasting experimental results. Nevertheless, most of these effects have not been yet determined in real turbines. A review of actual research works shows that for turbine runners in still water, natural frequencies and mode shapes obtained with finite element simulations have a good agreement with experimental ones [13,14,15,16,17]. The simulation of real turbine runners has been also performed by means of two way FSI, combining CFD (Computational Fluid Dynamics) and FEM (Finite Element Model), which requires much more time but it can predict not only the natural frequencies but also the damping ratios [18,19,20].
All the aforementioned studies, which are devoted to determine the natural frequencies and mode shapes of hydraulic turbines, consider the surrounding fluid as homogeneous water with constant density and viscosity properties. Nevertheless, in off-design operation conditions, turbine runners are prone to develop large scale cavitation structures that can be attached to the blades. Under such flow conditions, an accurate estimation of the natural frequencies may be more challenging as additional complexities arising from large cavity structures, which are not considered in the aforementioned studies, will be added to the FSI phenomenon. In fact, as demonstrated in recent studies performed with simple hydrofoils, large cavitation structures reduce the added mass effect and therefore increase the natural frequencies of the submerged structure [21,22,23,24]. The larger the cavity volume is, the lower the added mass effect is and the larger the natural frequencies are. Therefore, according to this conclusion, it would be reasonable to include these effects in the accurate calculation of natural frequencies of turbine runners, particularly at off design conditions, when large cavitation volumes are developed. Nevertheless, according to the authors’ knowledge, these effects have not been considered yet.
This paper reports the case of an actual Francis turbine runner, where many of the blade trailing edges were found broken within one day of operation at deep part load. As a result of this extremely short time it has to be concluded that the runner was working very close to a structural resonance condition. At deep part load, potential FSI effects and complex flow phenomena have been analyzed concluding that the Rotor Stator Interaction (RSI) is the only hydraulic phenomenon that can effectively produce a structural resonance of the actual runner. Nevertheless, when using acoustic FSI methods that considers the surrounding fluid as homogenous water, a resonance case cannot be explained as the predicted structural natural frequencies of the runner are far away from the excited frequencies by the RSI. In order to evaluate possible cavitation effects, firstly a numerical CFD simulation has been performed with the runner working at deep part load, which confirms the presence of severe inter blade cavity vortices. These cavity volumes have been introduced in the FSI acoustic model by considering a two phase flow (vapor-water) inside these cavities. With this improved simulation model, the runner natural frequencies and mode shapes have been recalculated, showing an important increase, especially for high diametrical modes. Therefore, the possibility of a resonance on the runner excited by the RSI, for deep part load operation regimes, has been evaluated.

2. Finite Element Formulation for FSI

The Navier-Stokes (N-S) equations, continuity equations and structural dynamic equations are considered together to analyze the FSI problem. Simplifying the N-S and continuity equations, the acoustic wave equations are obtained assuming that the fluid is compressible, which means that its density can change due to pressure variations (i.e., acoustic medium) [25]. This equation can be expressed as [26]:
( 1 ρ o   ) 1 ρ o c 2 2 p t 2 + [ 4 μ 3 ρ o ( 1 ρ o c 2 p t ) ] = t ( Q ρ o ) + [ 4 μ 3 ρ o ( Q ρ o ) ] ,
where c = K / ρ o is the speed of sound, ρ o is the mean density, K is the bulk modulus, μ is the dynamic viscosity, p is the acoustic pressure, Q is the mass source in the continuity equation, and t is time.
The corresponding finite element formulation is obtained by means of the Galerkin method applied to Equation (1). As a result, the discretized wave equation in matrix notation is:
[ M F ] { p ¨ e } + [ C F ] { p e ˙ } + [ K F ] { p e } + ρ o [ R ] T { u ¨ e , F } = { F F } ,
where M F , C F   and K F   are the fluid mass, damping and stiffness matrices which are related to the terms in Equation (1), p e is the nodal pressure vector at the discretized points and F F is the applied fluid pressure vector at the boundaries (excluding the force exert by the flexible structure) obtained by integrating the pressure over the area of the surface. The force that the flexible structure exerts over the fluid is modeled by the term ρ o [ R ] T { u ¨ e , F } , where u e , F are the nodal displacements at the nodes of the FSI interface. R is the coupling matrix and represents the effective surface associated with each node on the fluid-structure interface.
Both Equation (2) and the discretized structural equations (see, for instance, Reference [27]) must be simultaneously considered in FSI problems because pressure waves are generated by the structure displacement and the structure deformation is affected by the fluid pressure. Therefore, the governing finite element matrix equations of the coupled FSI problem becomes:
[ M s 0 ρ o R T M F ] { U ¨ P ¨ } + [ C s 0 0 C F ] { U ˙ P ˙ } + [ K s R 0 K F ] { U P } = { F s F F } .
P and U are the fluid pressure and the structure displacement vectors at the discretized nodes. M s , C s and K s are the structure mass, damping and stiffness matrices and F s is structural load vector.
Natural frequencies and mode shapes of the structure can be calculated by means of the Fourier transform and considering F s , F F = 0 in Equation (3). The unsymmetrical coupled FSI matrix system can be then expressed as a function of the frequency ω:
( ω 2 [ M s   0 ρ o R T M F ] + j ω [ C s 0 0 C F ] + [ K s R 0 K F ] ) { U P } = 0
Equation (4) is a generic equation, where local changes in the fluid properties, such as densities and speed of sound in cavitation volumes, can be considered. Therefore, it can be used to calculate natural frequencies and mode shapes of the structure as long as the cavitation volumes and its fluid properties are well defined in space.

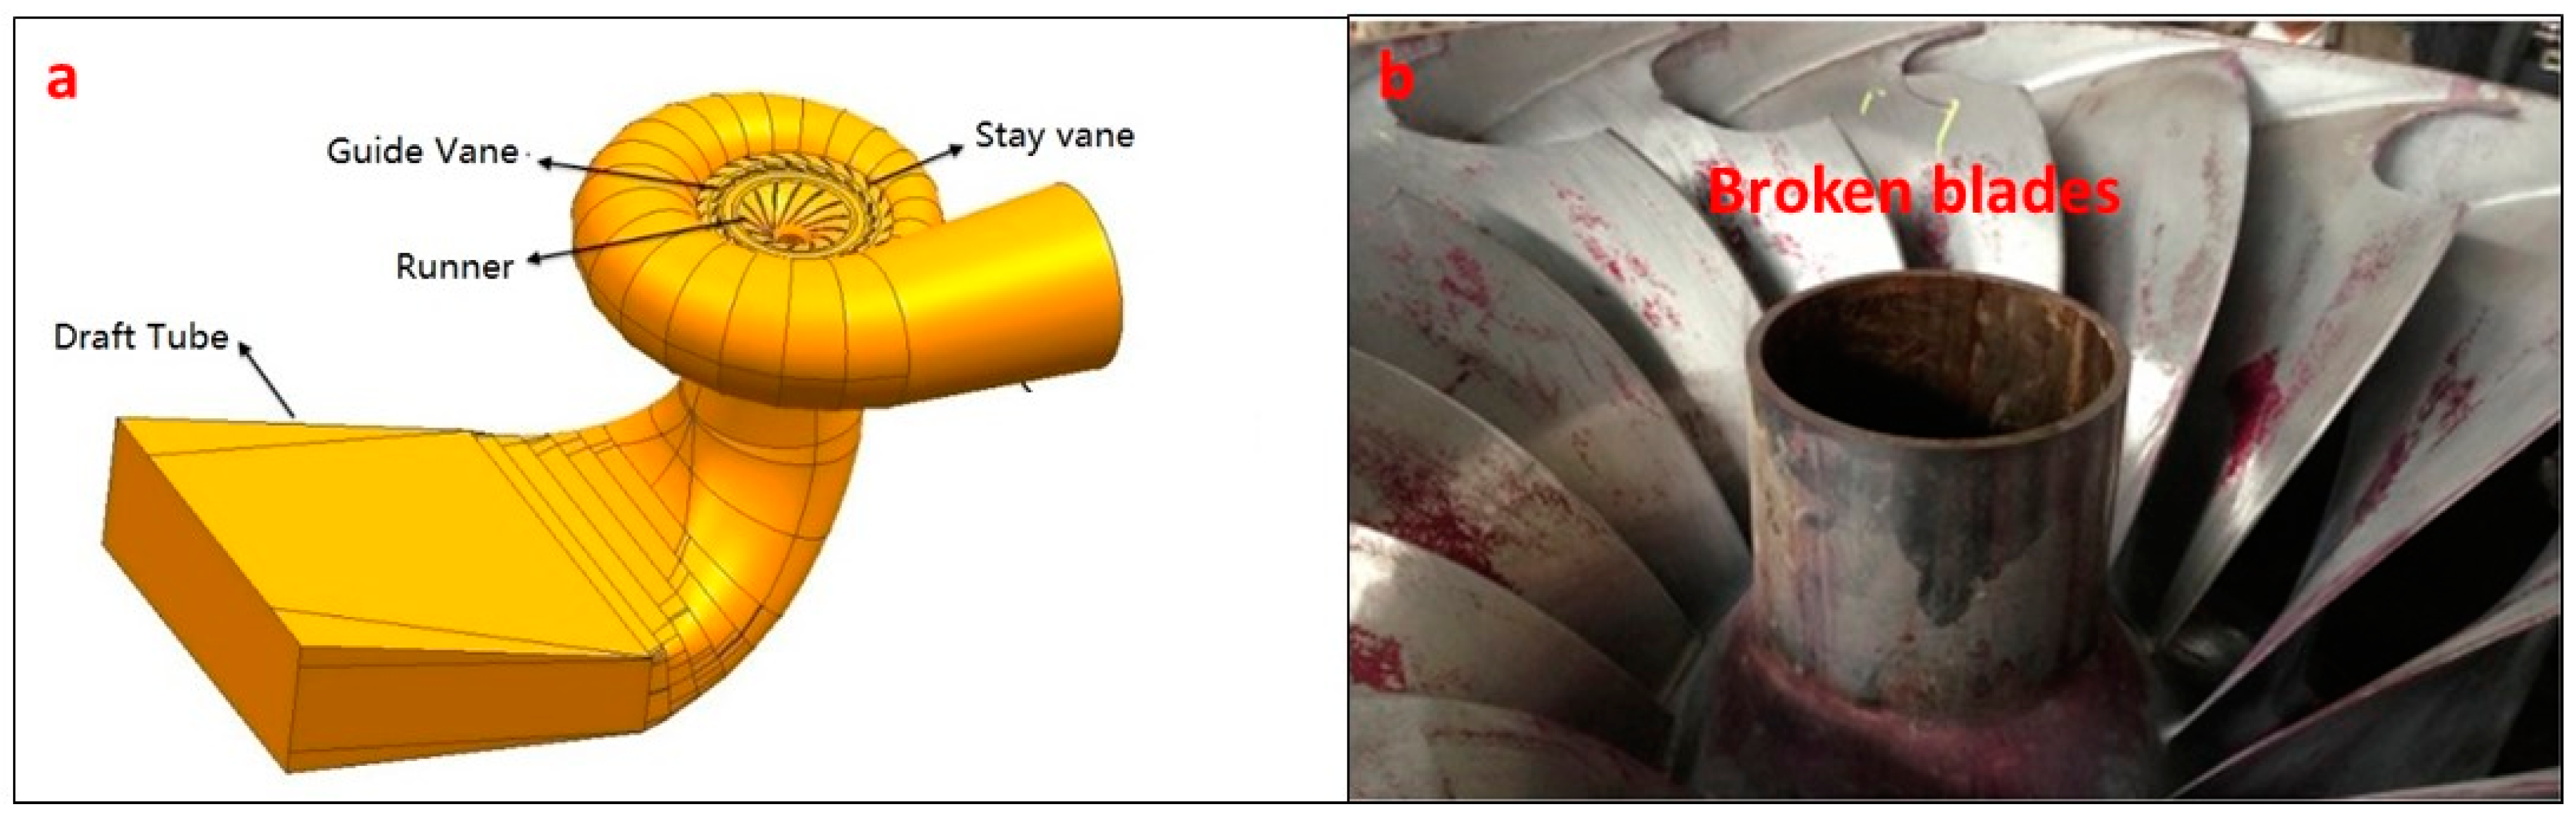
3. Description of Francis Turbine and Failure

3.1. Unit Description and Damage Found

The Francis turbine runner analyzed has 14 blades and its crown diameter is 2.72 m. The distributor has 24 guide vanes. The rated head and power per unit are 102 m and 44 MW respectively. The rotational speed is 250 rpm.
Many blades were found broken after one operating day. In all the broken blades, the fracture was quite similar as seen in Figure 1b. The crack initiated on the outer part of the trailing edge (junction blades-band) and then it propagated forming an approximate half elliptic shape as seen in the same figure.

3.2. Operating Conditions before and after the Damage

The unit operated one single day at deep part load. After that day, excessive vibrations were occurring on the Unit 1, so the machine was stopped. The unit was dewatered and during the inspection the trailing edges of many blades were found broken as shown in Figure 1. Although, during this day the operating power was not absolutely constant, the unit worked around 16 MW (averaged data according to the operating data provided by the power plant operators). This condition is described in the first row of Table 1 and will be numerically simulated (CFD) as explained in the next section.
After several months, the damages were repaired, and the unit was put again in operation. Especially during the first weeks and in order to avoid further damages, the machine was working close to its best efficiency point (BEP) and with a similar head as before. No damages were found after this time. This condition is described in the second row of Table 1 and will be also simulated with CFD techniques.

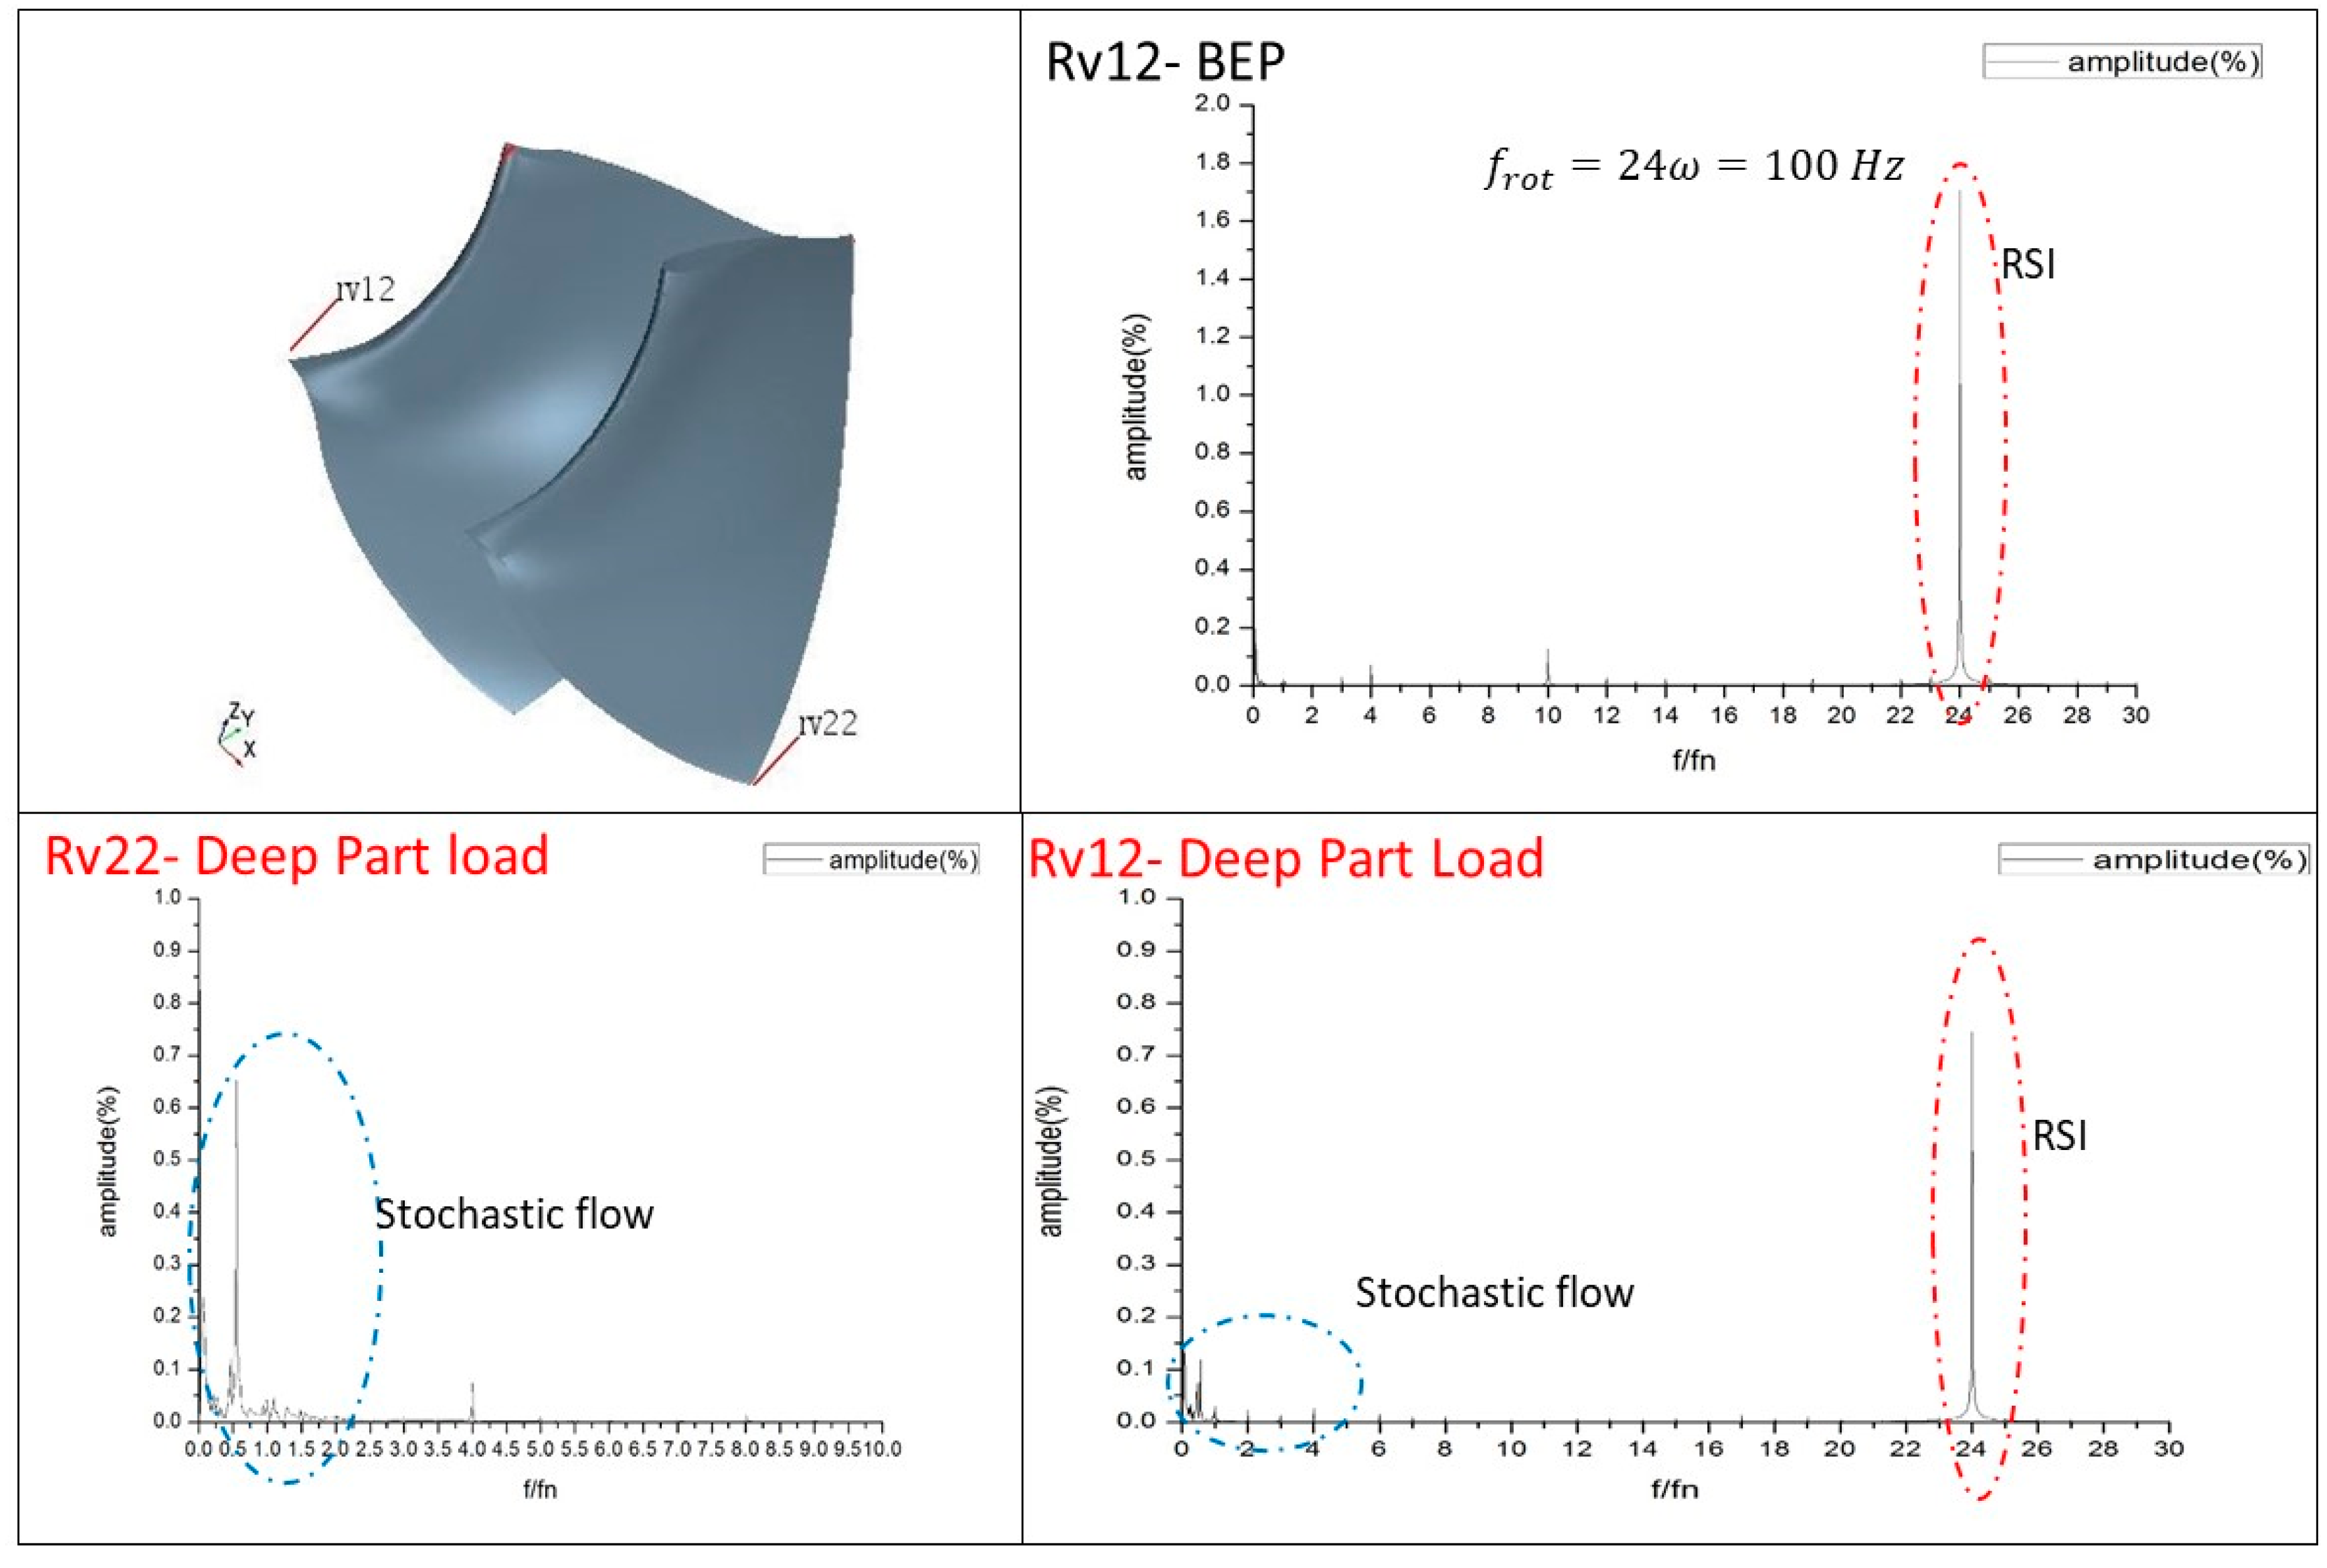
3.3. Hydraulic Excitations

In order to investigate the possibility of the occurrence of a structural resonance in the turbine runner, that could have caused such a rapid fracture, the excitation flow at deep part load has to be analyzed in detail. Here, we briefly summarize the main characteristics of the possible flow phenomena that could excite a structural resonance in the runner.

3.3.1. Deep Part Load Flow and Inter Blade Vortices

According to many authors the flow at deep part load (DPL) is highly stochastic [28,29,30] and characterized by inter-blade vortices [31,32]. Usually the excited frequencies are in the low frequency range from 0 Hz to few times the rotating speed (≈5 Ω) [28,33]. Under these conditions the associated dynamic stresses on the runner can be high and have to be considered for the calculation of long term fatigue [34,35,36]. Nevertheless, due to the fact that the excited frequencies are in the low range and are stochastic rather than periodic, it is believed that these vortices itself cannot explain a structural resonance of the runner.

3.3.2. Vortex Rope

At part load [37,38,39] (and sometimes at full load [40]), a vortex rope can appear. This vortex rope has a frequency below the rotational frequency of the runner and has the ability to excite the whole hydraulic system [37,40,41,42]. Nevertheless, the ability of this rope to excite a structural resonance of the runner may be limited as its characteristic frequency is much below the first natural frequencies of the runner.

3.3.3. Von Karman Vortices

The Von-Karman vortices can damage the trailing edge of the blades as reported in some cases [43], if the frequency of the vortices coincide with one of the natural frequencies of the runner, particularly with high deformation on the trailing edge of the blades. A possible lock-in phenomenon is more likely to occur at high loads [43,44]. In order to calculate the vortex frequencies, the Strouhal number is considered to be in a range of 0.18-0.25 in the trailing edge of the turbine blade [44]. Then the frequency of the Von-Karman vortices can be calculated using the following expression:
f V K = S t · v d ,
where St is the Strouhal Number (0.18–0.25), v the mean velocity at the trailing edge and d the characteristic thickness. Therefore, this excitation, which is periodical, has to be accurately analyzed in the present case.

3.3.4. RSI

The combinations of wicket gates and Guide Vanes permits to theoretically estimate the main excitation frequencies and shapes caused by the Rotor Stator Interaction (RSI). The equation governing the RSI excitation frequencies and shapes is:
m Z v ± k = n Z b ,
where Z v is the number of guide vanes and Z b is the number of rotating blades in the turbine runner. m, n are the harmonic orders so that the excited frequency seen from the rotating frame will be f r o t = m Z v Ω and from the stationary frame f s t a t = n Z b Ω , where Ω is the rotating speed of the machine in revolutions/seconds. k is the excitation shape defined by the number of nodal diameters.
The most dangerous combinations are those ones m, n resulting in a low k, specially also for the first m, n harmonics. Note that a resonance can occur only if the excited frequency f r o t matches one natural frequency of the runner, as well as the excitation shape k matches the corresponding mode shape [45]. For the present, unit the main expected excited frequencies and excitation shapes can be easily calculated with Equation (6). These are shown in Table 2.
Table 3 summarizes the hydraulic excitations, particularized for the present case, from the analytical point of view. For the Von-Karman vortex frequency, the Strouhal number has been considered 0.18–0.25 and the thickness according to the runner blades thickness at the trailing edge (15 mm). The relative speed with respect to the trailing edge of the rotating blade has been obtained close to the periphery ( r = 1300   mm ) where the real cracks have been found (Figure 1), by means of CFD results (Section 4).

4. Flow Conditions through CFD Simulation

In order to investigate the possibility of a resonance condition, the natural frequencies of the runner and the excitation frequencies have to be determined. As the machine was working at deep part load, inter blade vortices may be expected. These cavitation vortices may affect the structural natural frequencies [21], and therefore in this section these cavities are determined by means of CFD simulations. The RSI excitation frequencies have been also determined by means of the same simulation.

4.1. Simulated Cavities at Deep Part Load

The steady Zwart-Gerber-Belamri (ZGB) cavitation model [46] has been used for the present CFD simulation. This simulation has been performed for the deep part load condition and for a condition close to Best Efficiency Point shown in Table 2.
Using trimmed and plyhedral cell meshing technique, the grid convergence test has been carried out based on the flow features. The final mesh adopted has about 227,000 elements or 3D-cells in the spiral case. Furthermore, this mesh has about 150,000 elements in the guide vanes, 347,000 in the runner and 100,000 elements in the draft tube. The Reynolds-averaged Navier-Stokes equations (RANS) with RNG k-ε turbulence model have been applied to solve the fluid field.
The ZGB cavitation model considers the continuity equations of the vapor phase as:
t ( ρ v α v ) + ( ρ v α v u ) = R e R c ,
where ρ v is the density of vapor, u the local velocity and α v = V v / V the void ratio.   V v and V are respectively the volume occupied by vapor and the total volume of the cavity. R e , R c are the source terms, which can be expressed as:
R E = F v a p 3 α n u c ( 1 α v ) ρ v ϑ B 2 3 ( P v P ) ρ l   i f   P P v ,
R C = F c o n d 3 α v ρ v ϑ B 2 3 ( P v P ) ρ l   i f   P > P v .
From these equations, the following flow parameters have been adopted based on previous studies: Evaporation coefficient Fvap = 50, condensation coefficient Fcond = 0.01, bubble radius ϑ B = 2 × 10 6   m , nucleation site volume fraction αnuc = 5 × 10⁻⁴. P is the local pressure, and Pv the vapor pressure. ρ l is the density of liquid (water).
The averaged density of the cavity ρ c can be calculated by using the void ratio α v and its definition. Therefore:
ρ c = α v · V v + ( 1 α v ) V .
In this study ρV and ρL have been taken as 1.74 × 10⁻² (saturated vapor at 20 °C) and 1000 kg/m2 respectively. The void ratio α v is a local variable that determines the density, sonic velocity, geometry and size of the simulated cavities. Therefore, a realistic selection of this value is critical, as it will have a great influence on the added mass. In previous works [21,47], this parameter adopts a wide range of values and thus, a unique specific value cannot be selected. Furthermore, the experimental conditions in those studies are quite different as in the present case. Instead of selecting one value, in this paper we carry out a sensitivity analysis varying this value in a range from 0.1–0.9 (with a step of 0.1). In this way, it can be seen how the simulated cavities characteristic change. Therefore, its influence on the added mass effect can be also determined as will be discussed in the following section.
For the simulation, a submergence level of −4.6 m at the outlet section was considered (transformed in static pressure), according to the design suction head. At the inlet, the pressure and the flowrate were selected according to the parameters shown in Table 1.
Figure 2 shows the predicted cavities with αv = 0.1 and for 16 MW (deep part load condition in Table 1). In this situation the total volume V of the cavities is maximum. In every runner channel, a single inter blade vortex cavity is observed. This vortex detaches from the band, and extends towards the suction side of the blade close to the trailing edge.
As recently analyzed experimentally and numerically, the inter-blade vortices that typically appear at deep part load induce stochastic loads although the volume of such cavities is approximately constant during one cycle of the runner. Thus, the characteristics of the cavitation volume are analyzed at one arbitrary temporary point [31,48,49]. Other cavitation phenomena which are characterized by the variation of the cavitation volume, such as the part load and full load unstable vortex rope, are analyzed at different time points during one cycle [41,50,51,52]. Therefore, although the stochastic pressure fluctuations induced by these vortices are better captured with unsteady CFD models [28,31], the cavity volume, which will be used to compute the natural frequencies of the runner, is determined by the steady CFD model, which is enough to evaluate the risk of a possible resonance.
For the BEP condition defined in Table 2 no large cavities were observed according to the CFD simulation, whatever αv was, but only small cavitation nuclei (typical travelling bubbles at high loads [53]). Therefore, for the FSI simulation of this particular operating condition (Section 5), water will be modelled as a homogeneous fluid around the turbine runner.

4.2. Hydraulic Excitations from the CFD

As discussed in Section 3.3, different types of hydraulic phenomena could excite a structural resonance of the runner and thus provoke the cracks. As shown in Figure 3, two types of phenomena are captured with the CFD simulation at deep part load. One is the typical flow at deep part load which is highly stochastic in a low frequency band [28,33] and the RSI phenomenon. As mentioned before, in order to better capture and analyze the deep part load flow characteristics, unsteady CFD models are necessary. In the present case, the stochastic part of the flow is not relevant for our discussion as the frequency range is very low. At BEP only the RSI is observed with a higher amplitude, which corresponds to the typical behavior in Francis turbines [35]. No vortex rope is observed at deep part load or BEP, and also not detected in the spectrum of the pressure fluctuation, although this rope may appear for some operating condition in between.
The Von Karman vortex shedding, when occurs, is expected at a higher frequency range. Furthermore, the possibility or not that the cracks are originated by a lock-in phenomenon on the trailing edge will be discussed in Section 6, based on the analytical Von-Karman frequencies (Table 3) and the calculated natural frequencies of the runner (Section 5).
The periodical excitation of the RSI can provoke a resonance of the turbine if the excitation frequency and excitation shape coincide with the natural frequency and mode shape of the turbine runner. The theoretical characteristics have been discussed in Section 3.3.4, and summarized in Table 2. According to this table, from the rotating point of view, the principal excited frequency is f r o t = 24 · ω = 100   Hz with a corresponding mode shape of k = 4. Figure 3 shows that at deep part load, and BEP this frequency is clearly observed in the simulation results as predicted with the analytical equation of the RSI (Table 2). For the BEP condition the relative amplitude of this component is higher, as the load is larger [35]. It has been also checked, comparing phase differences between homologous point in the other blades, that the dominating excitation shape in this frequency is a k = 4 mode, rotating in the same direction than the runner. These characteristics validate also the CFD simulation results.

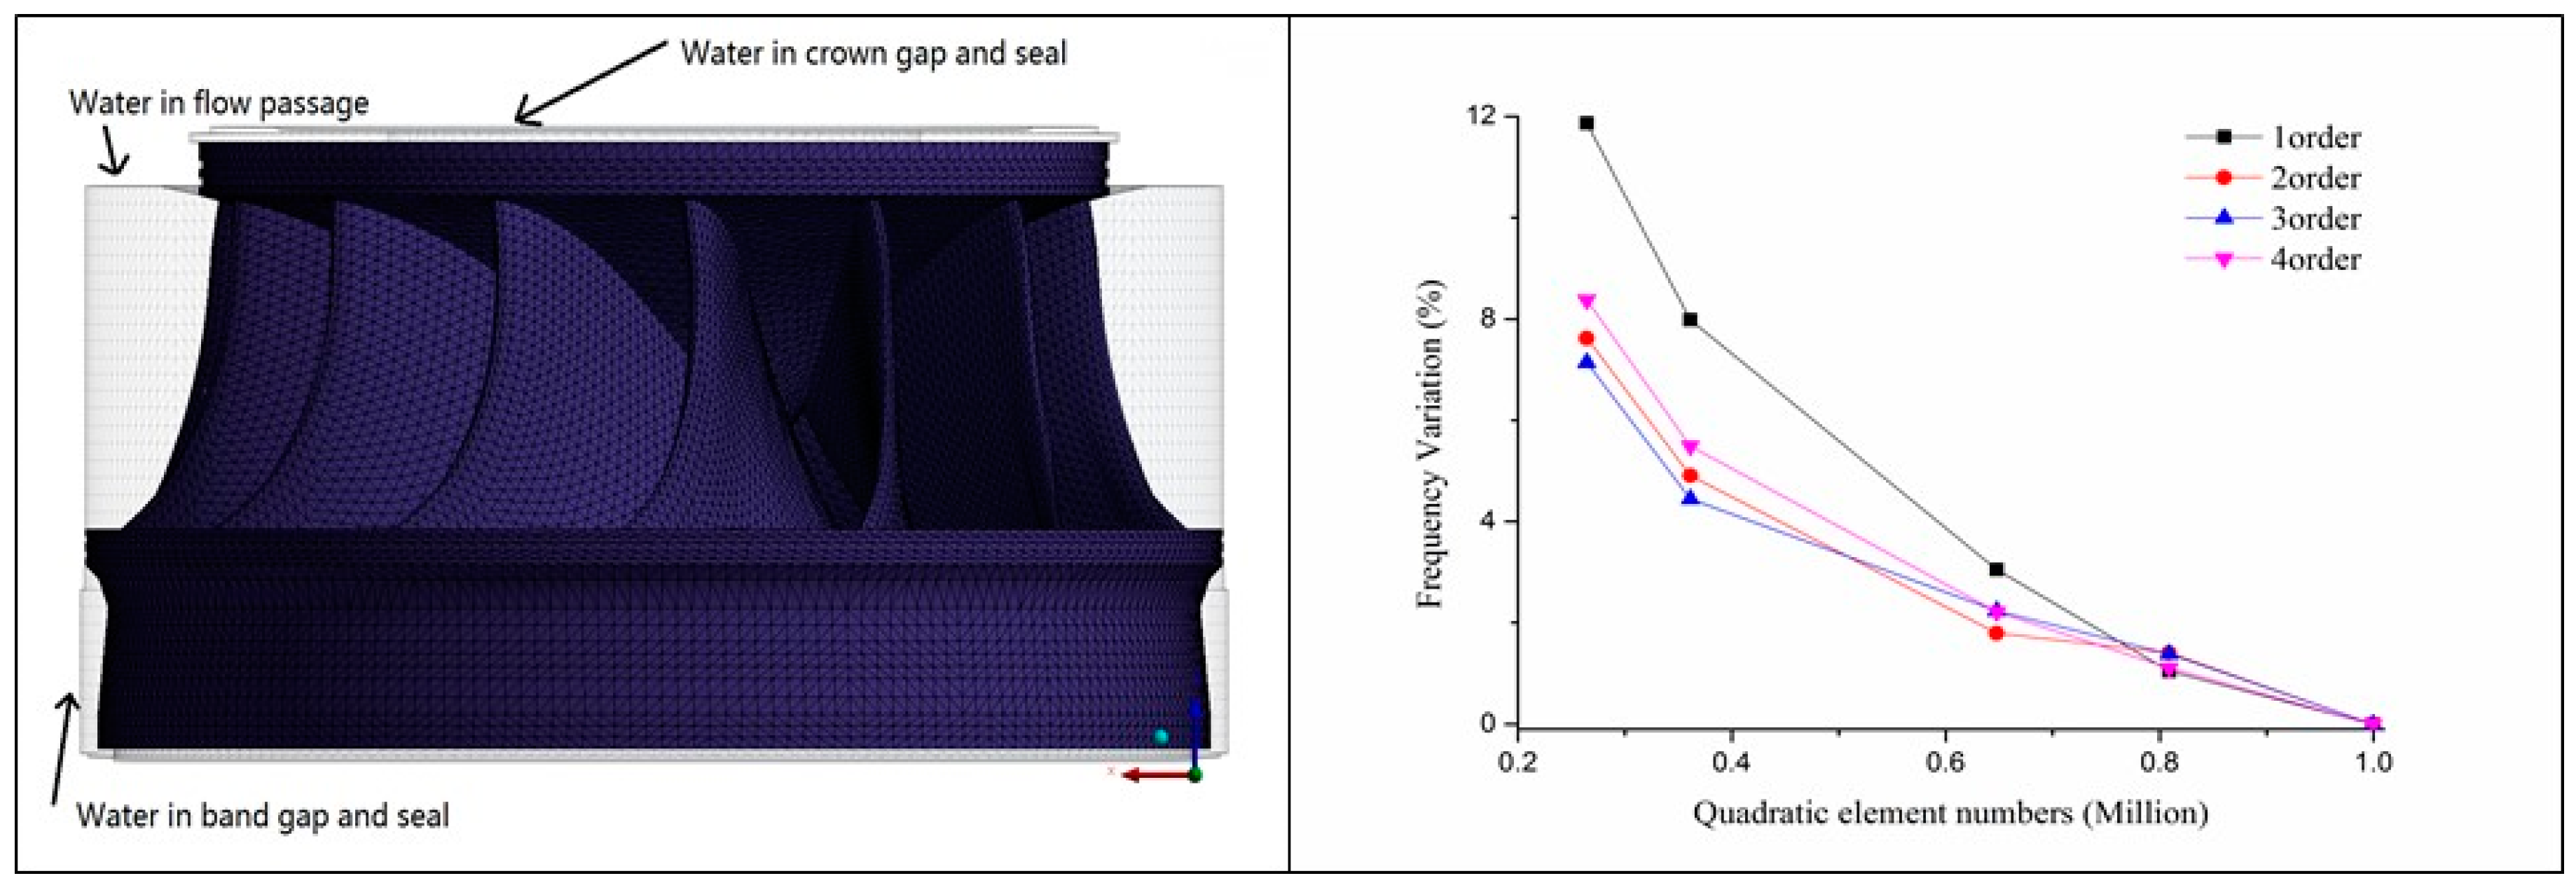
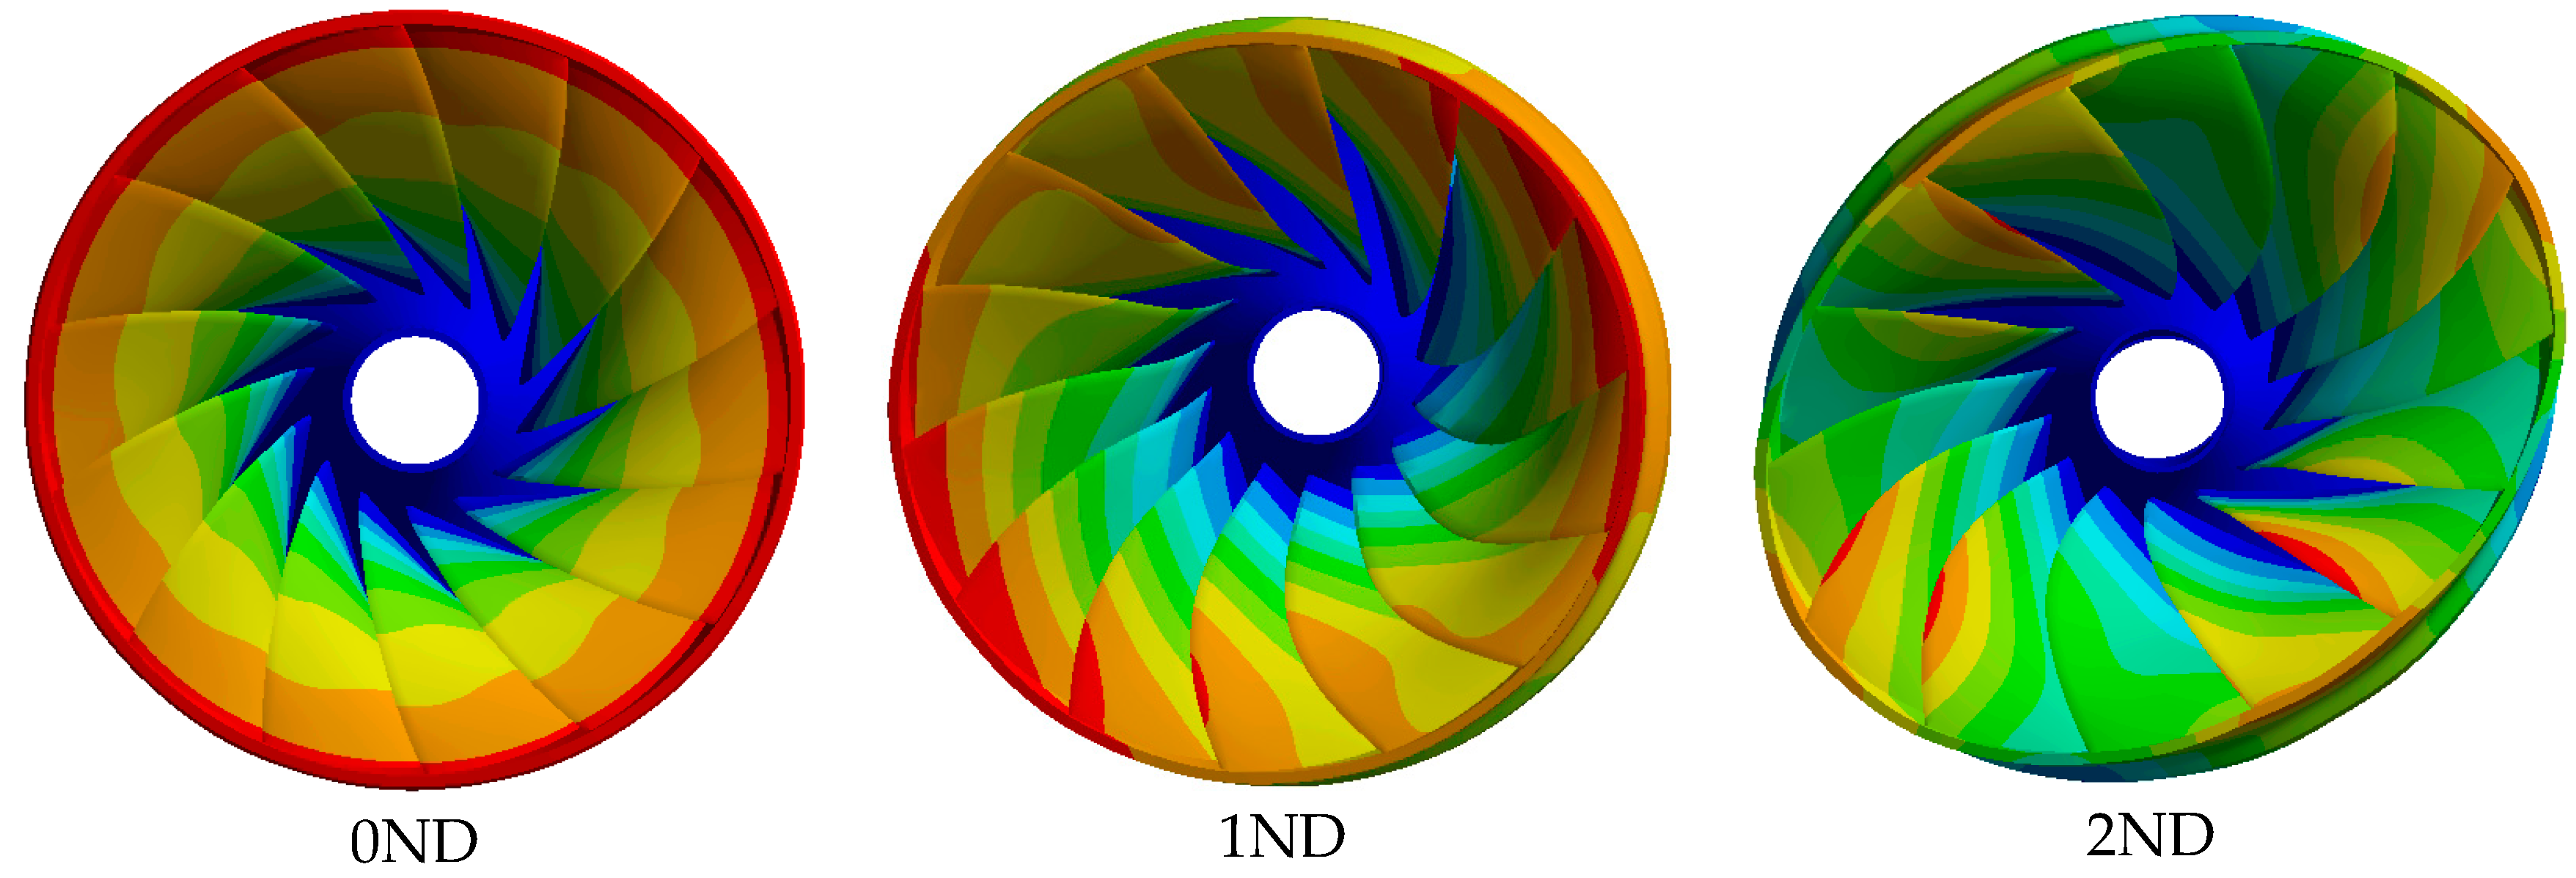
5. Natural Frequencies and Mode Shapes of the Runner without and with Cavitation Effects

To analyze the possibility of a structural resonance of the runner, the natural frequencies and mode shapes of the runner have to be determined considering the boundary conditions. Then, it has to be checked if the natural frequencies, and mode shapes can be excited by one of the hydraulic phenomena considered. For the runner material, stainless steel with density 7850 Kg/m3, Young Modulus of 201 GPa and Poisson Ratio of 0.3 has been adopted.
The runner’s surrounding water has a density of 1000 kg/m3 and speed of sound of 1450 m/s, outside of the possible cavitation volumes. The fluid mesh was built by extending the structure mesh so that the nodes on the interface are shared by both domains.
Special attention has been given to simulate the effects of the gaps between the runner crown and the head cover and between the runner band and the surrounding seal, as some investigations show that the proximity of rigid walls in submerged structures, significantly increases the added mass effect and therefore greatly reduces the natural frequencies [9,54,55,56]. These small gaps can be appreciated on Figure 4.
For the mesh, quadratic tetrahedral elements have been adopted. Before the calculation, a mesh sensitivity analysis has been carried out. On the right of Figure 4, it can be seen that the relative deviation of the first four order modes decrease as the total element number of the runner and of the acoustic fluid increases. The final mesh, with 1 million quadratic tetrahedral elements, combining the solid and fluid domains, has been selected.

5.1. Without Cavitation Effects (Conditions Close to BEP)

When the runner works close to the BEP the water can be considered as a homogeneous medium with constant density and speed of sound as discussed in Section 4.1. Then, the FSI simulation with the aforementioned boundary conditions gives the first natural frequencies and mode shapes, which are shown in Figure 5. They correspond to a zero-nodal diameter (0ND), a one-nodal diameter (1ND), a two-nodal diameter (2ND), a three-nodal diameter (3ND) and a four-nodal diameter (4ND) mode shapes. For mid head Francis runners, which have a similar geometry, but different scales according to the flow rate [57], the first diametrical modes are characterized by a high deformation occurring at outer diameters of the blades (see Reference [17]).
The natural frequencies corresponding to these mode shapes are shown in Table 4. Furthermore, the values of the natural frequencies in air fair have been also obtained in a parallel simulation eliminating the surrounding flow. Then, the frequency reduction ratios (FRR), which are also shown in this table can be defined as:
FRR = ( f a i r f w a t e r ) / f a i r
It can be observed that the added mass effect (and therefore the FRR) in this type of runners, increases with the number of nodal diameters of the mode shape.

5.2. With Interblade Vortices (Deep Part Load Condition)

For this analysis, the same mesh used for the previous simulation has been adopted. In order to include the inter blade vortex cavities in the acoustic FSI model, the vapor volumes shapes calculated with the CFD simulation have been mapped into the FEM model. The rest of the parameters and boundary conditions have been kept unchanged. The nodes of the elements on the cavity surface have been transferred to the FE model using the nearest nodes, as the mesh for the CFD is different than the mesh for FEM. To characterize the mixture of vapor and water inside the mapped cavity volumes, various simulations have been carried out. It has been considered that the average void ratio could vary from 0.1 to 0.9, according to the discussion presented in the previous section. The comparison of the predicted cavity with the CFD, and its transposition to the FEM model is shown in Figure 6 for αv = 0.1.
Then, the natural frequencies and mode shapes of the runner working at deep part load (with cavitation condition) can be numerically obtained for different αv values. Figure 7 shows the increase of the different natural with respect the natural frequencies in homogenous water ( f c a v f w a t ) / f w a t , where f c a v are the natural frequencies considering cavitation effects (depending on αv) and f w a t are the natural frequency in homogenous water (runner working close to BEP). As in other studies [21], when cavitation exist, natural frequencies of the structure are substantially increased and this increase depends on the cavitation volumes and its properties. For the smallest αv considered, the volumes are the largest one and the increase in the natural frequencies can be 10–20%, depending on the mode shape considered. For the 4ND mode, the increase in frequency with respect the non-cavitating case is much higher as for the rest of the modes.

6. Discussion

Due to the extreme short time needed to have such fractures (one day of operation at deep part load), it seems reasonable that a structural resonance of the runner, with high deformation and stress on the trailing edge of the blades occurred. According to the excitation characteristics shown in Table 3, the CFD simulation results (Figure 3) and the natural frequencies calculated (Table 4 and Figure 7) we can conclude that the most probably phenomenon that was exciting that resonance is the RSI as it will be justified in the following lines.
As mentioned in Section 3.3, the inter-blade vortices itself have characteristic frequencies in the low frequency area and these are stochastic rather than periodic. The same reasoning can be made for the vortex rope; although its nature is periodical the extreme low precession frequency below the rotating speed may not excite a natural frequency of the runner. Furthermore, no vortex rope characteristic has been found in the simulations.
The Von-Karman vortex shedding could produce damages on the trailing edge if the vortex frequencies coincides with one of the natural frequencies of the runner (or local natural frequency of the blades). Nevertheless, the calculated Von-Karman frequencies close to the periphery (Table 3) are much higher than the first several mode shapes in water (Table 4). In fact, the modes in the frequency range of the Von Karman frequencies calculated at deep part load or at BEP have very local and complex deformations. Therefore, it seems difficult to explain the real fractures found (Figure 1), which are large and happened in many blades, by such phenomenon. Furthermore, the reported Von Karman problems in the past are for relative high loads [43,44]. For the aforementioned reasons, it seems that the most probably phenomenon that could have excited the resonance is the RSI.
Nevertheless, the lower RSI excitation frequency corresponds to 100 Hz with an excitation shape of k = 4 and if no cavitation effects on the added mass are considered, the natural frequency corresponding to a mode shape with 4 nodal diameters is 90.51 Hz (Table 4). Although there are uncertainties in numerical simulations, past researches reported a discrepancy of less than 5% for the 4ND mode with respect to experimental results using similar simulation procedures. For example, Liang et al. [17] reported an discrepancy of 1% for a submerged structure in infinite water and Valentin et al. [9] reported an error of 5% for a submerged and confined circular structure. If rotational effects are considered, these should be small as the rotating speed is relatively slow, and even they would slightly decrease the natural frequency of the runner, keeping away the possibility of a resonance [58].
Therefore, only if cavitation effects on the added mass are considered a structural resonance excited by the RSI excitation can be explained. As experimentally and numerically proven in simple hydrofoils, if huge cavitation volumes exist close to the structure, the added mass could be reduced and thus the natural frequencies increased (Section 5.2). Even if the assumed values for the void ratio cannot be determined experimentally in this case, Figure 8 shows that the resonance may occur for a wide range of αv considered and particularly for the values calibrated in by De la Torre et al. [21]. Therefore, to evaluate the risk of a structural resonance in a turbine runner, cavitation effects on the added mass, which depend on the operating condition, should be considered.
To summarize our hypothesis and explanation of the real fractures founded; as they occurred in an extreme short time, a structural resonance rather than long term fatigue would have caused such failures. From the possible excitations it has been argued that only the RSI has the capability to excite a structural resonance (with global deformations) in the present case. Nevertheless, without considering cavitation effects on the added mass, the structural resonance cannot be explained as the natural frequencies numerically calculated are far away from the RSI excited frequencies.
Recently, many researchers experimentally and numerically proved, that if huge cavitation volumes exist in the vicinity of a hydrofoil, they have to be considered for an accurate calculation of the natural frequencies. In a Francis turbine, working at deep part load, large inter-blade cavitation vortices appear (see the experimental work of Keita et al. [48]), which have been numerically predicted and included in the calculation of the natural frequencies in the present case. Although experimental values of the void ratio could not be estimated in the prototype, a parametric analysis of these values shows that for a wide range of values, the risk of a structural resonance is high (Figure 8).
Furthermore, the analysis of the static stresses of the 4ND mode of the runner reveal that the maximum stress is at the joint of the trailing edge and the band, which perfectly corresponds to the damage found as seen in Figure 9. The last evidence, that the resonance could have occurred as explained, is that once the machine was repaired it had been working for several weeks close to the BEP, i.e., without important cavitation effects on the added mass, and no fractures were found after that time.

7. Conclusions

A totally uncommon and unexpected fracture case in a Francis turbine, occurred after one day of operation at deep part load, has been systematically analyzed and discussed in this paper. The analysis concludes that cavitation effects have increased the natural frequencies of the turbine runner, tuning one structural resonance excited by the Rotor Stator Interaction.
Although cavitation influences on the structural natural frequencies of simple structures, such as hydrofoils, have been analyzed in the past, no studies have been found where these effects are evaluated in turbine runners. In this paper, the effect of cavitation on the added mass and therefore on the natural frequencies of the runner has been considered combining a CFD simulation with a Finite Element Model. For the runner working at deep part load, large inter blade cavitation vortices have been found, which have been included in the calculation of the natural frequencies by means of a FEM model.
From the numerical perspective, realistic values of the void ratio are fundamental for an accurate calculation of the natural frequencies. Although these values are not still available for a generic Francis prototype, in the present case we have performed a parametric study of possible void ratios, showing that an increase in the natural frequency due to cavitation effects could explain the structural resonance occurred. Particularly, results suggest that large cavitation volumes close to the blades can increase the natural frequencies of the runner around 10–15%, with respect the non-cavitating case. Especially for higher diametrical modes this increase is more important.
For the aforementioned reasons, in this paper we want to emphasize the necessity to include and further investigate cavitation effects on the natural frequencies of generic submerged runners.

Author Contributions

X.L. and L.Y. performed the simulations and analysis. A.P. contribute to the analysis and wrote the manuscript. Z.W. and L.Z. discussed and reviewed the paper.

Funding

This work has been founded by the National Natural Science Foundation of China under Contract (Nos. 51779122 and 51439002) and Tsinghua University Initiative Scientific Research Program (No. 20151080459) for supporting this research.

Conflicts of Interest

The authors declare no conflict of interest.

References

  1. Brennen, C. A Review of Added Mass and Fluid Inertial Forces; Brennen (C.E.): Sierra Madre, CA, USA, 1982. [Google Scholar]
  2. Blevins, R.D. Flow-Induced Vibration; Van Nostrand Reinhold Co.: New York, NY, USA, 1990. [Google Scholar]
  3. Lamb, H. On the vibrations of an elastic plate in contact with water. Proc. R. Soc. Lond. 1921, A98, 205–216. [Google Scholar] [CrossRef]
  4. Amabili, M.; Kwak, M.K. Free vibrations of circular plates coupled with liquids: Revising the Lamb problem. J. Fluids Struct. 1996, 10, 743–761. [Google Scholar] [CrossRef]
  5. Amabili, M. Effect of finite fluid depth on the hydroelastic vibration of circular and annular plate. J. Sound Vib. 1996, 193, 909–925. [Google Scholar] [CrossRef]
  6. Kwak, M.K. Vibration of circular plates in contact with water. J. Appl. Mech. 1991, 58, 480–483. [Google Scholar] [CrossRef]
  7. Rodriguez, C.G.; Flores, P.; Pierart, F.G.; Contzen, L.R.; Egusquiza, E. Capability of structural-acoustical FSI numerical model to predict natural frequencies of submerged structures with nearby rigid surfaces. Comput. Fluids 2012, 64, 117–126. [Google Scholar] [CrossRef]
  8. Jeong, K.-H.; Kang, H.-S. Free vibration of multiple rectangular plates coupled with a liquid. Int. J. Mech. Sci. 2013, 74, 161–172. [Google Scholar] [CrossRef]
  9. Valentín, D.; Presas, A.; Egusquiza, E.; Valero, C. Experimental study on the added mass and damping of a disk submerged in a partially fluid-filled tank with small radial confinement. J. Fluids Struct. 2014, 50, 1–17. [Google Scholar] [CrossRef]
  10. Presas, A.; Valentin, D.; Egusquiza, E.; Valero, C.; Seidel, U. Influence of the rotation on the natural frequencies of a submerged-confined disk in water. J. Sound Vib. 2015, 337, 161–180. [Google Scholar] [CrossRef]
  11. Valentín, D.; Presas, A.; Egusquiza, E.; Valero, C.; Egusquiza, M. Experimental Study of a Vibrating Disk Submerged in a Fluid-Filled Tank and Confined With a Nonrigid Cover. J. Vib. Acoust. 2017, 139, 021005–021011. [Google Scholar] [CrossRef]
  12. Bossio, M.; Valentín, D.; Presas, A.; Martin, D.R.; Egusquiza, E.; Valero, C.; Egusquiza, M. Numerical study on the influence of acoustic natural frequencies on the dynamic behaviour of submerged and confined disk-like structures. J. Fluids Struct. 2017, 73, 53–69. [Google Scholar] [CrossRef]
  13. Egusquiza, E.; Valero, C.; Huang, X.; Jou, E.; Guardo, A.; Rodriguez, C. Failure investigation of a large pump-turbine runner. Eng. Fail. Anal. 2012, 23, 27–34. [Google Scholar] [CrossRef] [Green Version]
  14. Lais, S.; Qwenguei, L.; Henggeler, U.; Weiss, T.; Escaler Puigoriol, F.X.; Egusquiza Estévez, E. Dynamic analysis of Francis Runners-Experiment and numerical simulation. In Proceedings of the 24th IAHR Symposium on Hydraulic Machinery and Systems, Foz do Iguassu, Brazil, 27–31 October 2008. [Google Scholar]
  15. He, L.; Wang, Z.; Kurosawa, S.; Nakahara, Y. Resonance investigation of pump-turbine during startup process. In IOP Conference Series: Earth and Environmental Science; IOP Publishing: Bristol, UK, 2014; p. 032024. [Google Scholar]
  16. Xiao, R.; Wang, Z.; Luo, Y. Dynamic Stresses in a Francis Turbine Runner Based on Fluid-Structure Interaction Analysis. Tsinghua Sci. Technol. 2008, 13, 587–592. [Google Scholar] [CrossRef]
  17. Liang, Q.W.; Rodríguez, C.G.; Egusquiza, E.; Escaler, X.; Farhat, M.; Avellan, F. Numerical simulation of fluid added mass effect on a francis turbine runner. Comput. Fluids 2007, 36, 1106–1118. [Google Scholar] [CrossRef] [Green Version]
  18. Dompierre, F.; Sabourin, M. Determination of turbine runner dynamic behaviour under operating condition by a two-way staggered fluid-structureinteraction method. IOP Conf. Ser. Earth Environ. Sci. 2010, 12, 012085. [Google Scholar] [CrossRef] [Green Version]
  19. Hübner, B.; Seidel, U.; Roth, S. Application of fluid-structure coupling to predict the dynamic behavior of turbine components. In IOP Conference Series: Earth and Environmental Science; IOP Publishing: Bristol, UK, 2010; p. 012009. [Google Scholar]
  20. Liu, X.; Luo, Y.; Karney, B.; Wang, Z.; Zhai, L. Virtual Testing for Modal and Damping Ratio Identification of Submerged Structures using the PolyMAX Algorithm with Two-way Fluid-Structure Interactions. J. Fluids Struct. 2015, 54, 548–565. [Google Scholar] [CrossRef]
  21. De La Torre, O.; Escaler, X.; Egusquiza, E.; Farhat, M. Experimental investigation of added mass effects on a hydrofoil under cavitation conditions. J. Fluids Struct. 2013, 39, 173–187. [Google Scholar] [CrossRef] [Green Version]
  22. Ducoin, A.; André Astolfi, J.; Sigrist, J.-F. An experimental analysis of fluid structure interaction on a flexible hydrofoil in various flow regimes including cavitating flow. Eur. J. Mech. B/Fluids 2012, 36, 63–74. [Google Scholar] [CrossRef] [Green Version]
  23. Benaouicha, M.; Astolfi, J.-A. Analysis of added mass in cavitating flow. J. Fluids Struct. 2012, 31, 30–48. [Google Scholar] [CrossRef] [Green Version]
  24. Lelong, A.; Guiffant, P.; Astolfi, J.A. An Experimental Analysis of the Structural Response of Flexible Lightweight Hydrofoils in Cavitating Flow. J. Fluids Eng. 2018, 140, 021116. [Google Scholar] [CrossRef]
  25. ANSYS Inc. ANSYS Theory Reference; ANSYS Inc.: Canonsburg, PA, USA, 2013. [Google Scholar]
  26. Junger, M.C.; Feit, D. Sound, Structures, and Their Interaction; MIT Press: Cambridge, MA, USA, 1986; p. 460. [Google Scholar]
  27. Ewins, D.J. Modal Testing: Theory and Practice; Research Studies Press: Letchworth, UK, 1984; Volume 15. [Google Scholar]
  28. Wilhelm, W.; Florian von, L.; Philipp, C.; Jiri, K. Dynamic stresses in a Francis model turbine at deep part load. J. Phys. Conf. Ser. 2017, 813, 012014. [Google Scholar] [Green Version]
  29. Mende, C.; Weber, W.; Seidel, U. Progress in load prediction for speed-no-load operation in Francis turbines. IOP Conf. Ser. Earth Environ. Sci. 2016, 49, 062017. [Google Scholar] [CrossRef] [Green Version]
  30. Morissette, J.F.; Chamberland-Lauzon, J.; Nennemann, B.; Monette, C.; Giroux, A.M.; Coutu, A.; Nicolle, J. Stress predictions in a Francis turbine at no-load operating regime. IOP Conf. Ser. Earth Environ. Sci. 2016, 49, 072016. [Google Scholar] [CrossRef] [Green Version]
  31. Sofien Bouajila, J.B. Emmanuel Flores, Claire Segoufin, Thierry Maitre. In Advances in Hydroinformatics, 1st ed.; Gourbesville, P., Cunge, J., Caignaert, G., Eds.; Springer: Signapore, 2018. [Google Scholar]
  32. Yamamoto, K.; Müller, A.; Favrel, A.; Landry, C.; Avellan, F. Guide vanes embedded visualization technique for investigating Francis runner inter-blade vortices at deep part load operation. In Proceedings of the 6th IAHR International Meeting of the Workgroup on Cavitation and Dynamic Problems in Hydraulic Machinery and Systems, Ljubljana, Slovania, 9–11 September 2015. [Google Scholar]
  33. Yamamoto, K.; Müller, A.; Favrel, A.; Landry, C.; Avellan, F. Pressure measurements and high speed visualizations of the cavitation phenomena at deep part load condition in a Francis turbine. IOP Conf. Series: Earth Environ. Sci. 2014, 22, 022011. [Google Scholar] [CrossRef]
  34. Huang, X.; Oram, C.; Sick, M. Static and dynamic stress analyses of the prototype high head Francis runner based on site measurement. IOP Conf. Ser. Earth Environ. Sci. 2014, 22, 032052. [Google Scholar] [CrossRef] [Green Version]
  35. Seidel, U.; Mende, C.; Hübner, B.; Weber, W.; Otto, A. Dynamic loads in Francis runners and their impact on fatigue life. IOP Conf. Ser. Earth Environ. Sci. 2014, 22, 032054. [Google Scholar] [CrossRef] [Green Version]
  36. Monette, C.; Marmont, H.; Chamberland-Lauzon, J.; Skagerstrand, A.; Coutu, A.; Carlevi, J. Cost of enlarged operating zone for an existing Francis runner. IOP Conf. Ser. Earth Environ. Sci. 2016, 49, 072018. [Google Scholar] [CrossRef]
  37. Favrel, A.; Müller, A.; Landry, C.; Yamamoto, K.; Avellan, F. Study of the vortex-induced pressure excitation source in a Francis turbine draft tube by particle image velocimetry. Exp. Fluids 2015, 56, 215. [Google Scholar] [CrossRef]
  38. Duparchy, F.; Brammer, J.; Thibaud, M.; Favrel, A.; Lowys, P.; Avellan, F. Mechanical impact of dynamic phenomena in Francis turbines at off design conditions. In Journal of Physics: Conference Series; IOP Publishing: Bristol, UK, 2017; p. 012035. [Google Scholar]
  39. Bouajila, S.; De Colombel, T.; Lowys, P.; Maitre, T. Hydraulic Phenomena Frequency Signature of Francis Turbines Operating in Part Load Conditions. In IOP Conference Series: Earth and Environmental Science; IOP Publishing: Bristol, UK, 2016; p. 082001. [Google Scholar]
  40. Müller, A.; Favrel, A.; Landry, C.; Yamamoto, K.; Avellan, F. On the physical mechanisms governing self-excited pressure surge in Francis turbines. In IOP Conference Series: Earth and Environmental Science; IOP Publishing: Bristol, UK, 2014; p. 032034. [Google Scholar]
  41. Valentín, D.; Presas, A.; Egusquiza, E.; Valero, C.; Egusquiza, M.; Bossio, M. Power Swing Generated in Francis Turbines by Part Load and Overload Instabilities. Energies 2017, 10, 2124. [Google Scholar]
  42. Presas, A.; Valentin, D.; Egusquiza, M.; Valero, C.; Egusquiza, E. Sensor-Based Optimized Control of the Full Load Instability in Large Hydraulic Turbines. Sensors 2018, 18, 1038. [Google Scholar]
  43. Fisher, R.K.; Seidel, U.; Grosse, G.; Gfeller, W.; Klinger, R. A case study in resonant hydroelastic vibration: The causes of runner cracks and the solutions implemented for the Xiaolangdi hydroelectric project. In Proceedings of the XXI IAHR Symposium on Hydraulic Machinery and Systems, Lausanne, Switzerland, 9–12 September 2002. [Google Scholar]
  44. Neidhardt, T.; Jung, A.; Hyneck, S.; Gummer, J. An Alternative Approach to the Von Karman Vortex Problem in Modern Hydraulic Turbines. Available online: https://www.researchgate.net/publication/320811766 (accessed on 15 August 2018).
  45. Presas, A.; Egusquiza, E.; Valero, C.; Valentin, D.; Seidel, U. Feasibility of Using PZT Actuators to Study the Dynamic Behavior of a Rotating Disk due to Rotor-Stator Interaction. Sensors 2014, 14, 11919–11942. [Google Scholar] [CrossRef] [PubMed] [Green Version]
  46. Zwart, P.J.; Gerber, A.G.; Belamri, T. A two-phase flow model for predicting cavitation dynamics. In Proceedings of the Fifth International Conference on Multiphase Flow, Yokohama, Japan, 30 May–4 June 2004. [Google Scholar]
  47. Coutier-Delgosha, O.; Reboud, J.L.; Delannoy, Y. Numerical simulation of the unsteady behaviour of cavitating flows. Int. J. Numer. Methods Fluids 2003, 42, 527–548. [Google Scholar] [CrossRef]
  48. Yamamoto, K.; Müller, A.; Favrel, A.; Avellan, F. Experimental evidence of inter-blade cavitation vortex development in Francis turbines at deep part load condition. Exp. Fluids 2017, 58. [Google Scholar] [CrossRef]
  49. Yamamoto, K.; Müller, A.; Favrel, A.; Landry, C.; Avellan, F. Numerical and experimental evidence of the inter-blade cavitation vortex development at deep part load operation of a Francis turbine. In IOP Conference Series: Earth and Environmental Science; IOP Publishing: Bristol, UK, 2016. [Google Scholar]
  50. Favrel, A.; Müller, A.; Landry, C.; Yamamoto, K.; Avellan, F. LDV survey of cavitation and resonance effect on the precessing vortex rope dynamics in the draft tube of Francis turbines. Exp. Fluids 2016, 57, 168. [Google Scholar] [CrossRef]
  51. Müller, A.; Favrel, A.; Landry, C.; Avellan, F. Fluid-structure interaction mechanisms leading to dangerous power swings in Francis turbines at full load. J. Fluids Struct. 2017, 69, 56–71. [Google Scholar] [CrossRef]
  52. Presas, A.; Valentin, D.; Egusquiza, E.; Valero, C. Detection and analysis of part load and full load instabilities in a real Francis turbine prototype. In IOP Conference Series: Earth and Environmental Science; IOP Publishing: Bristol, UK, 2017; p. 012038. [Google Scholar]
  53. Escaler, X.; Egusquiza, E.; Farhat, M.; Avellan, F.; Coussirat, M. Detection of cavitation in hydraulic turbines. Mech. Syst. Signal Process. 2006, 20, 983–1007. [Google Scholar] [CrossRef] [Green Version]
  54. De La Torre, O.; Escaler, X.; Egusquiza, E.; Farhat, M. Numerical and experimental study of a nearby solid boundary and partial submergence effects on hydrofoil added mass. Comput. Fluids 2014, 91, 1–9. [Google Scholar] [CrossRef] [Green Version]
  55. Presas, A.; Valentin, D.; Egusquiza, E.; Valero, C.; Egusquiza, M.; Bossio, M. Accurate Determination of the Frequency Response Function of Submerged and Confined Structures by Using PZT-Patches. Sensors 2017, 17, 660. [Google Scholar] [CrossRef] [PubMed]
  56. Presas, A.; Valentin, D.; Egusquiza, E.; Valero, C.; Seidel, U. Dynamic response of a rotating disk submerged and confined. Influence of the axial gap. J. Fluids Struct. 2016, 62, 332–349. [Google Scholar] [CrossRef]
  57. De Siervo, F.; De Leva, F. Modern trends in selecting and designing Francis turbines. Water Power Dam Constr. 1976, 28, 28–35. [Google Scholar]
  58. Presas, A.; Valentin, D.; Egusquiza, E.; Valero, C.; Seidel, U. On the detection of natural frequencies and mode shapes of submerged rotating disk-like structures from the casing. Mech. Syst. Signal Process. 2015, 60, 547–570. [Google Scholar] [CrossRef] [Green Version]
Figure 1. (a) Main components of the Francis Turbine and (b) the bottom view of the Francis turbine with broken trailing edges in some blades.
Energies 11 02320 g001
Figure 2. Visualization of cavitation vortices in the turbine runner by means of isocontours of void ratio 0.1 at 16 MW.
Energies 11 02320 g002
Figure 3. Pressure pulsations at Deep Part Load and BEP condition.
Energies 11 02320 g003
Figure 4. Mesh of the Francis turbine runner with the surrounding water (left) and mesh independence analysis results (right).
Energies 11 02320 g004
Figure 5. First mode shapes obtained with the FSI numerical situation. Bottom view. XND, X-nodal diameters.
Energies 11 02320 g005aEnergies 11 02320 g005b
Figure 6. Mapping of cavity shapes into FEM (right) from CDF simulation results (left) at deep part load condition.
Energies 11 02320 g006
Figure 7. Relative increase of the natural frequencies of the runner under cavitation effects depending on αv considered.
Energies 11 02320 g007
Figure 8. Risk of resonance for the 4ND-mode with cavitation effects.
Energies 11 02320 g008
Figure 9. Maximum stress spot at the joint blade-band and initiation of the real fracture.
Energies 11 02320 g009
Table 1. Operating conditions simulated.
ConditionOperating Point with Respect to Rated PowerHead Water (m)Rotating Speed (rpm)Discharge (kg/s)Torque (Nm)Power (MW)
Deep part load36%10225021,779610,37116
BEP81%10225040,5951,366,63835.8
Table 2. Main excitation frequencies (rotating and stationary point of view) and corresponding excitation shapes.
Harmonics m,n f r o t (Hz) f s t a t (Hz)Excitation Shape k
1,2100116.774
2,3200175−6
2,4200233.338
Table 3. Characteristics of the hydraulic excitations in the present case.
PhenomenonFrequency (Range)TypeOperating Points
Chaotic flow and inter-blade vortices≈0–5 Ω (0–20 Hz)StochasticDPL
Vortex rope≈0–1 Ω (0–4 Hz)PeriodicBetween DPL and BEP
(Part Load)
Von Karman shedding240–290 Hz for Deep Part Load
450–550 Hz for BEP
PeriodicStronger at BEP
RSI100 Hz, 200 HzPeriodicStronger at BEP
Table 4. Natural frequencies in air, water and frequency reduction ratios (FRR). No cavitation condition and machine working close to BEP.
Mode0ND1ND2ND3ND4ND
fair83.67117.9149.81228.83270.52
fwater59.8762.9969.0384.8590.51
FRR28.4%46.6%53.9%62.9%66.5%

