Design, Development and Implementation of a Weather Station Prototype for Renewable Energy Systems


1
Departamento de Tecnologías de la Edificación, Universidad Politécnica de Madrid, 28040 Madrid, Spain
2
Departamento de Economía Financiera, Contabilidad e Idioma Moderno, Universidad Rey Juan Carlos, 28032 Madrid, Spain
*
Author to whom correspondence should be addressed.
Energies 2018, 11(9), 2234; https://doi.org/10.3390/en11092234
Submission received: 23 July 2018
/
Revised: 7 August 2018
/
Accepted: 22 August 2018
/
Published: 26 August 2018
(This article belongs to the Special Issue 10 Years Energies - Horizon 2028)
Abstract
:The production of energy at the global level is conditioned by the use of fossil fuels that have a great environmental impact. In the last decades, renewable energy production systems have been implemented, and networks of nearly zero-energy buildings have been created, with a consequent complexity in the design phase in order to optimize the results. In this way, electronic prototype development methods like the one that is proposed in this paper improve the tasks of design and modelling. Thus, a new weather station based on an Arduino platform has been developed to collect and store ambient temperature, relative humidity, barometric pressure, wind speed and air quality data, comparing the obtained data to those obtained using a validation station containing commercial sensors. The results show how the use of low cost Arduino sensors allow one to obtain similar values to those collected by more professional meteorological stations with insignificant scatter between both technologies.
1. Introduction
Exergy production from the Industrial Revolution to the present day, has been focused on the use of fossil fuels such as coal, oil and natural gas, a tendency followed by such emerging powers as China and India which are replicating the pernicious growth model of industrialized countries [1]. This leads inevitably to two great consequences. Some authors state that the main reason for the progressive exhaustion of natural resources is their overexploitation [2,3]. Other possible cause is the uncontrolled emissions of greenhouse gases, mainly CO2 and CH4, associated to the combustion of fossil fuels until an atmospheric concentration of 413 ppm is reached, that causes an average increase of 1 °C in the planet’s temperature and that are precursors of the climate change [4,5]. As a result, it seems inexorable that developed civilizations must begin a transaction to growth models based on sustainable and durable development without compromising the possibilities of future generations, based on energy efficiency and use of renewable energy. All this in the technological context, where new agents that model the next decades of the world energy scenario appear: distributed generation, smart buildings, nearly zero-energy buildings or massive processing of environmental data [6,7,8].
To properly scale facilities based on renewable energy it is necessary to have the most reliable systems that collect and process environmental data that can be adjusted to any project [9]. So far, the dimensioning of the installations and their models have been based on tabulated databases, indirect or interpolated taken measurements and approximate graphics that model the meteorological behavior of a determined region, that are valid, but there is scope for improvement to use ad hoc values [10,11]. Different authors have tried to improve the capture and treatment of meteorological magnitudes for use in industry, using software with greater data processing capacity or through new systems able to measure environmental variables [12]. Among all the possible variables, the following ones are especially relevant for use in a renewable energy context: solar irradiance, geomagnetic positioning, wind speed, ambient temperature, relative air humidity, air quality, barometric pressure, rain and hail [13].
Climate measurements using traditional monitoring systems require qualified labour and regular equipment maintenance. For this reason some authors have tried to design and implement wireless low cost weather stations equipped with different types of sensors that permit one to establish fluent communication and to register and upload data online to a server for its processing [14,15]. Although it is true that all data recording systems are conditioned by the sensitivity of measuring equipment, some authors have proposed the use of systems based on diffuse control logic that allows adaptation to environmental conditions and established functional models of the devices that affect their measurement rates [16]. Nevertheless, not only big renewable energy production plants are interested in the study and control of environmental parameters. The building sector offers a great potential for the energy savings, where it is necessary to have accurate weather data in the exact location where the building is being built in order to improve the calibration of energy simulation programs, thus obtaining more reliable energy demand and change results that can influence more efficient design [17,18].
Thus, various researchers have tried to implement systems able to obtain specific, efficient and reliable climate condition data with minimum human effort. These devices must be amenable to be calibrated in order to adapt to the latitude and altitude, where they are placed. Only in this way can they report reliable data for investigation or industrial applications to be devised [19]. There are different commercial devices and industrial sensors that can be used for this aim: Controllino PLC Siemens © wireless humidity and temperature transmitters, anemometers controlled by Wi-Fi…etc. This is an open investigation field where any effort to improve the accuracy of existing devices can contribute to improving the energy efficiency of facilities and buildings [20]. Some authors have designed meteorological stations able to collect data in situ using different communication systems to transmit the obtained data, using ATmega 16 microcontrollers, and comparing their reliability through simultaneous measurements with other commercial systems such as the Campbell and Hobo H8 [21]. Furthermore, mobile monitoring systems are being used more frequently because of their fast data collection and the capability to forecast environmental conditions in a determined location, so some authors have focused their research on the development of this type of technology obtaining good results in terms of accuracy and reliability [22].
The Arduino platform was used in this paper as a control device chosen to record and process environmental parameters due to the diversity of compatible sensors and versatility for investigation projects [23,24]. This platform has software tools of modelling, programming, and simulation of control mechanisms that facilitate design work, and sufficient capacity to manage accurate analog and digital inputs and outputs, with reduced economic cost and a leading market position. In addition to the design, fabrication and weather electronic prototype validation, a validation station with more commercial measuring devices was implemented to calibrate and establish the measurement patterns required by the station. In this way, the objective is to put into operation a low-cost weather station that can be used in different climate conditions increasing the potential of renewable energy design equipment and building design through data collection.
The paper consists of the following parts: Materials and Methods, where the components and control and design tasks of both the prototype and the validation station are described; Results, where the collected data is presented; Discussion, where the results are justified and the prototype is validated with the station designed for this purpose; and finally the most significant conclusions and consulted references are presented.
2. Materials and Methods
The implemented weather control modulus monitors and collects data of different meteorological variables, such as hail, rain, air quality, wind speed, relative humidity, ambient temperature and barometric pressure. Once the objectives have been established, a series of design, modelling and prototype construction tasks were carried out on the scale described in this section.
2.1. Definition of Signals and Components
After establishing the scope which is pretended to be reached by the prototype construction, it was necessary to define the typology of sensors to be used for data storage and processing. In this case, an Arduino Mega 2560 proto-board was used as it has sufficient storage capacity to keep all the measurements and sufficient inputs and outputs. Definition of components placed on weather station is shown in Table 1 and Figure 1b.
A recount of inputs and outputs of the prototype is also included in Figure 1a, where the number of analog inputs (EA), digital inputs (ED), analog outputs (SA) and communication ports (P) can be found. The aim of this operation is to check the validity of the chosen electronic processor. Moreover, the majority of components are from the supplier Seeedstudio® (x.factory, B608, Design Commune, Vanke Cloud City, Shenzhen, China) whose Grove product family presents the versatility of plug and play typology that simplifies significantly cable routing with a help of an Arduino shield, making routing more compact and agile in terms of putting it into operation.
2.2. Control Tasks Modelling
Beyond the used programming language, it is necessary to know in a robust and reliable manner, the control actions that have to be performed by the device. There are different tools such as flow charts [25], GRAFCETs [26] or contact charts [27] among others. In this work, it was decided to use flow charts as they are very complete in mechanisms definition and help to anticipate common errors in the ulterior programming process.
As can be observed, the flow chart of Figure 2 represents the setting up of a weather station and its functioning in case of its implementation in a solar tracking facility. Operations for this purpose can be defined as variables definition and initiation, measuring range establishment, tracking system positioning in azimuth and elevation to be used for this purpose, maximum wind speed confirmation, rain and hail tests, recording and storage of the rest of the weather data. Once the operations are modeled, programming intelligible by the robot was performed, which, with the aim to simplify the task, was carried out with the use of free application Visualino v.0.7.1 [28], whose visual programming environment permits one to generate the code in form of a puzzle, letting programming blocks fall and interconnect in order to validate and to restructure the code in the IDE Arduino environment.
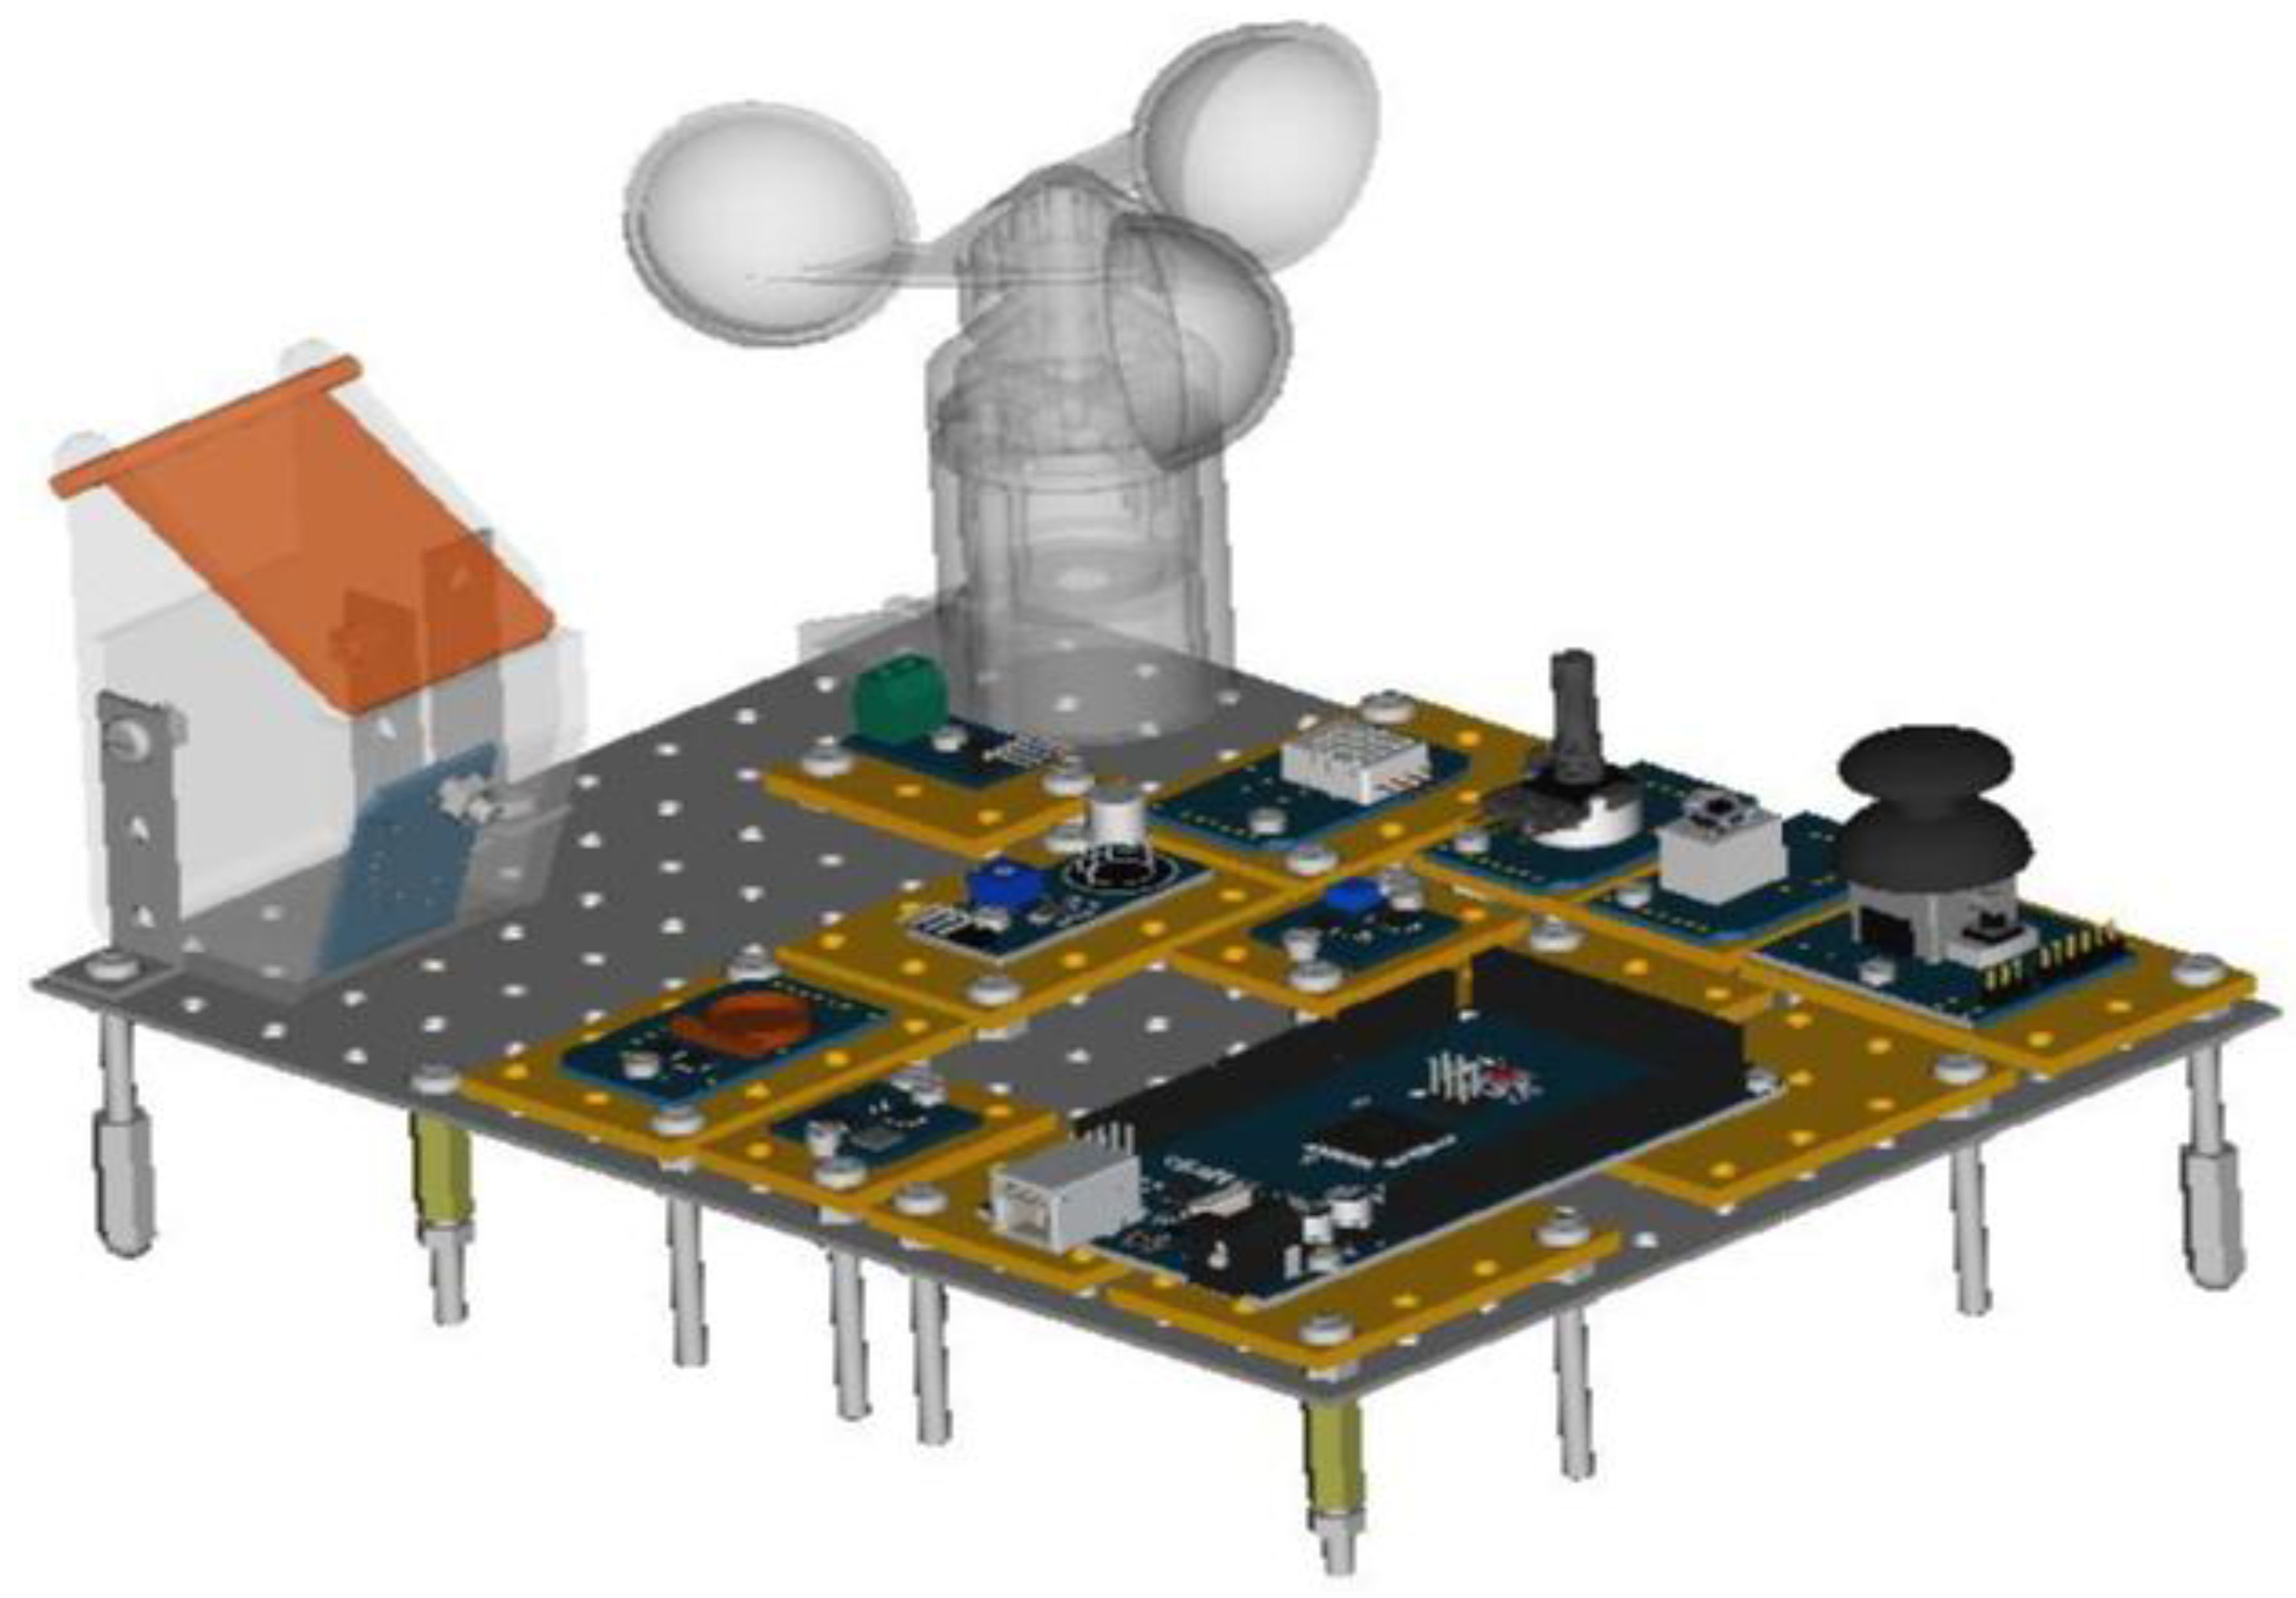
2.3. Prototype 3D Design
After choosing the components and establishing their functions in the weather station, a 3D design of the prototype was carried out in order to obtain a general visualization of all the sensors and assemblies. This design, which is shown in Figure 3, was carried out with the free FreeCAD v.0.16 software (SourceForge Media, LLC dba Slashdot Media, La Jolla, CA, USA) [29], with great graphic power, and requiring scarce use of computer resourses and with the possibility to be adapted to the necessities of C language. It is a parametric design where each graphic element is treated as an object by itself, being defined not only by its space coordinates (x, y, z), but also by its characteristic graphic or functional parameters [30]. On the one hand, the design of mechanical components such as plates and lift profiling was carried out in line with real materials and devices, and on the other hand there was an electronic design, what is the most difficult part, not only because of the diversity of the devices but also because of the complex layout, including the Arduino Mega ADK 2560 card and environmental sensors.
After the design of the prototype, a cost estimate was calculated, which gave a global cost of 300 Euros for the weather station, including the mechanical parts that amount to approximately 14% of the estimate and the electronic parts that represent 86% of the final quote. In this way it is possible to project the cost of a purely industrial prototype able to perform operations similar to those proposed in the paper, with a ten times higher cost of approximately 3000 Euros.
This idea is the result of the comparison, consulting different industrial suppliers such as: RS Components (Corby, UK) and Matmax (Corby, Sardenya, Barcelona, Spain) among others, and having matched in a quick comparison some of the devices installed in the prototype with their industrial homonyms. Additionally, it would be interesting in terms of implementing the design in real facilities to perform a future encapsulation of any electronic components susceptible to be damaged outdoors with methacrylate plates, as well as to use stainless steel screws guaranteeing in such a way its durability. Nevertheless, these final considerations would increase the cost of the prototype and deviate from the final objective of the paper.
2.4. Validation Station
So far the functioning and the applications of the electronic prototype of weather station have been described. However, it is still necessary to check the reliability of the selected sensors, as well as the veracity of programming code to confirm that the system performs the required functions. For this reason it was decided to implement in parallel a validation station, assembled with properly calibrated commercial sensors, that permits one to confirm the obtained values [31]. This validation modulus can be used not only in the process of putting into operation the weather station but also for periodic tasks such as its reliability verification, validation of sensors in cases of substitution after damage, anomalies diagnosis or detection of statistically abnormal values. Figure 4 shows the validation station used for the calibration of the prototype, indicating its components described in Table 2.
3. Results
After the definition and design of the components and validation of devices, an experimental campaign was carried out, placing the prototype in Madrid, Spain (latitude: 40°22′290.574″; longitude: 3°45′9.669″).
3.1. Final State of the Prototype and the Validation Station
After the process of sensors validation and finalization, a real prototype was built on scale as presented in Figure 5.
Figure 5 shows final state of the electronic devices connected to the computer for recording environmental variables, moreover, it also shows the validation station used to confirm the obtained data and check its reliability. The tests were carried out under favorable climate conditions due to the lack of encapsulation of the device and impossibility to place it outdoors for long periods during the development phase.
3.2. Tests Conducted for Different Weather Variables
For taking weather data and validation of the prototype, four specific days were selected because of their relevance in terms of being the beginning of different seasons, trying to perform in this way a complete annual scan. These days correspond to the seasonal changes in chronological order: 21 June 2017 (summer solstice), 22 September 2017 (autumn equinox), 21 December 2017 (winter solstice) and 20 March 2018 (spring equinox).
In Arduino, the process of resetting the microcontroller through an electric reconnection produces a resetting of the memory with data loss. To avoid this, the data has been transferred to EEPROM memory that in case of the Arduino Mega is of 4 kbytes, in a way that, taking into account a matrix table of results sample with 72 time slots, represents a sufficient amount of information to be treated with this memory.
As the tests were conducted in a teaching center, data collection was performed every 10 min from 7:30 a.m. (opening of the center) until 7:30 p.m. (end of working day), obtaining in this way 12 h of data collection per day.
The results for each studied weather variable were presented, including as an example a table of verification taken with the help of validation station, comparing the results obtained by both devices for different variables on 21 December 2017.
3.2.1. Wind Speed
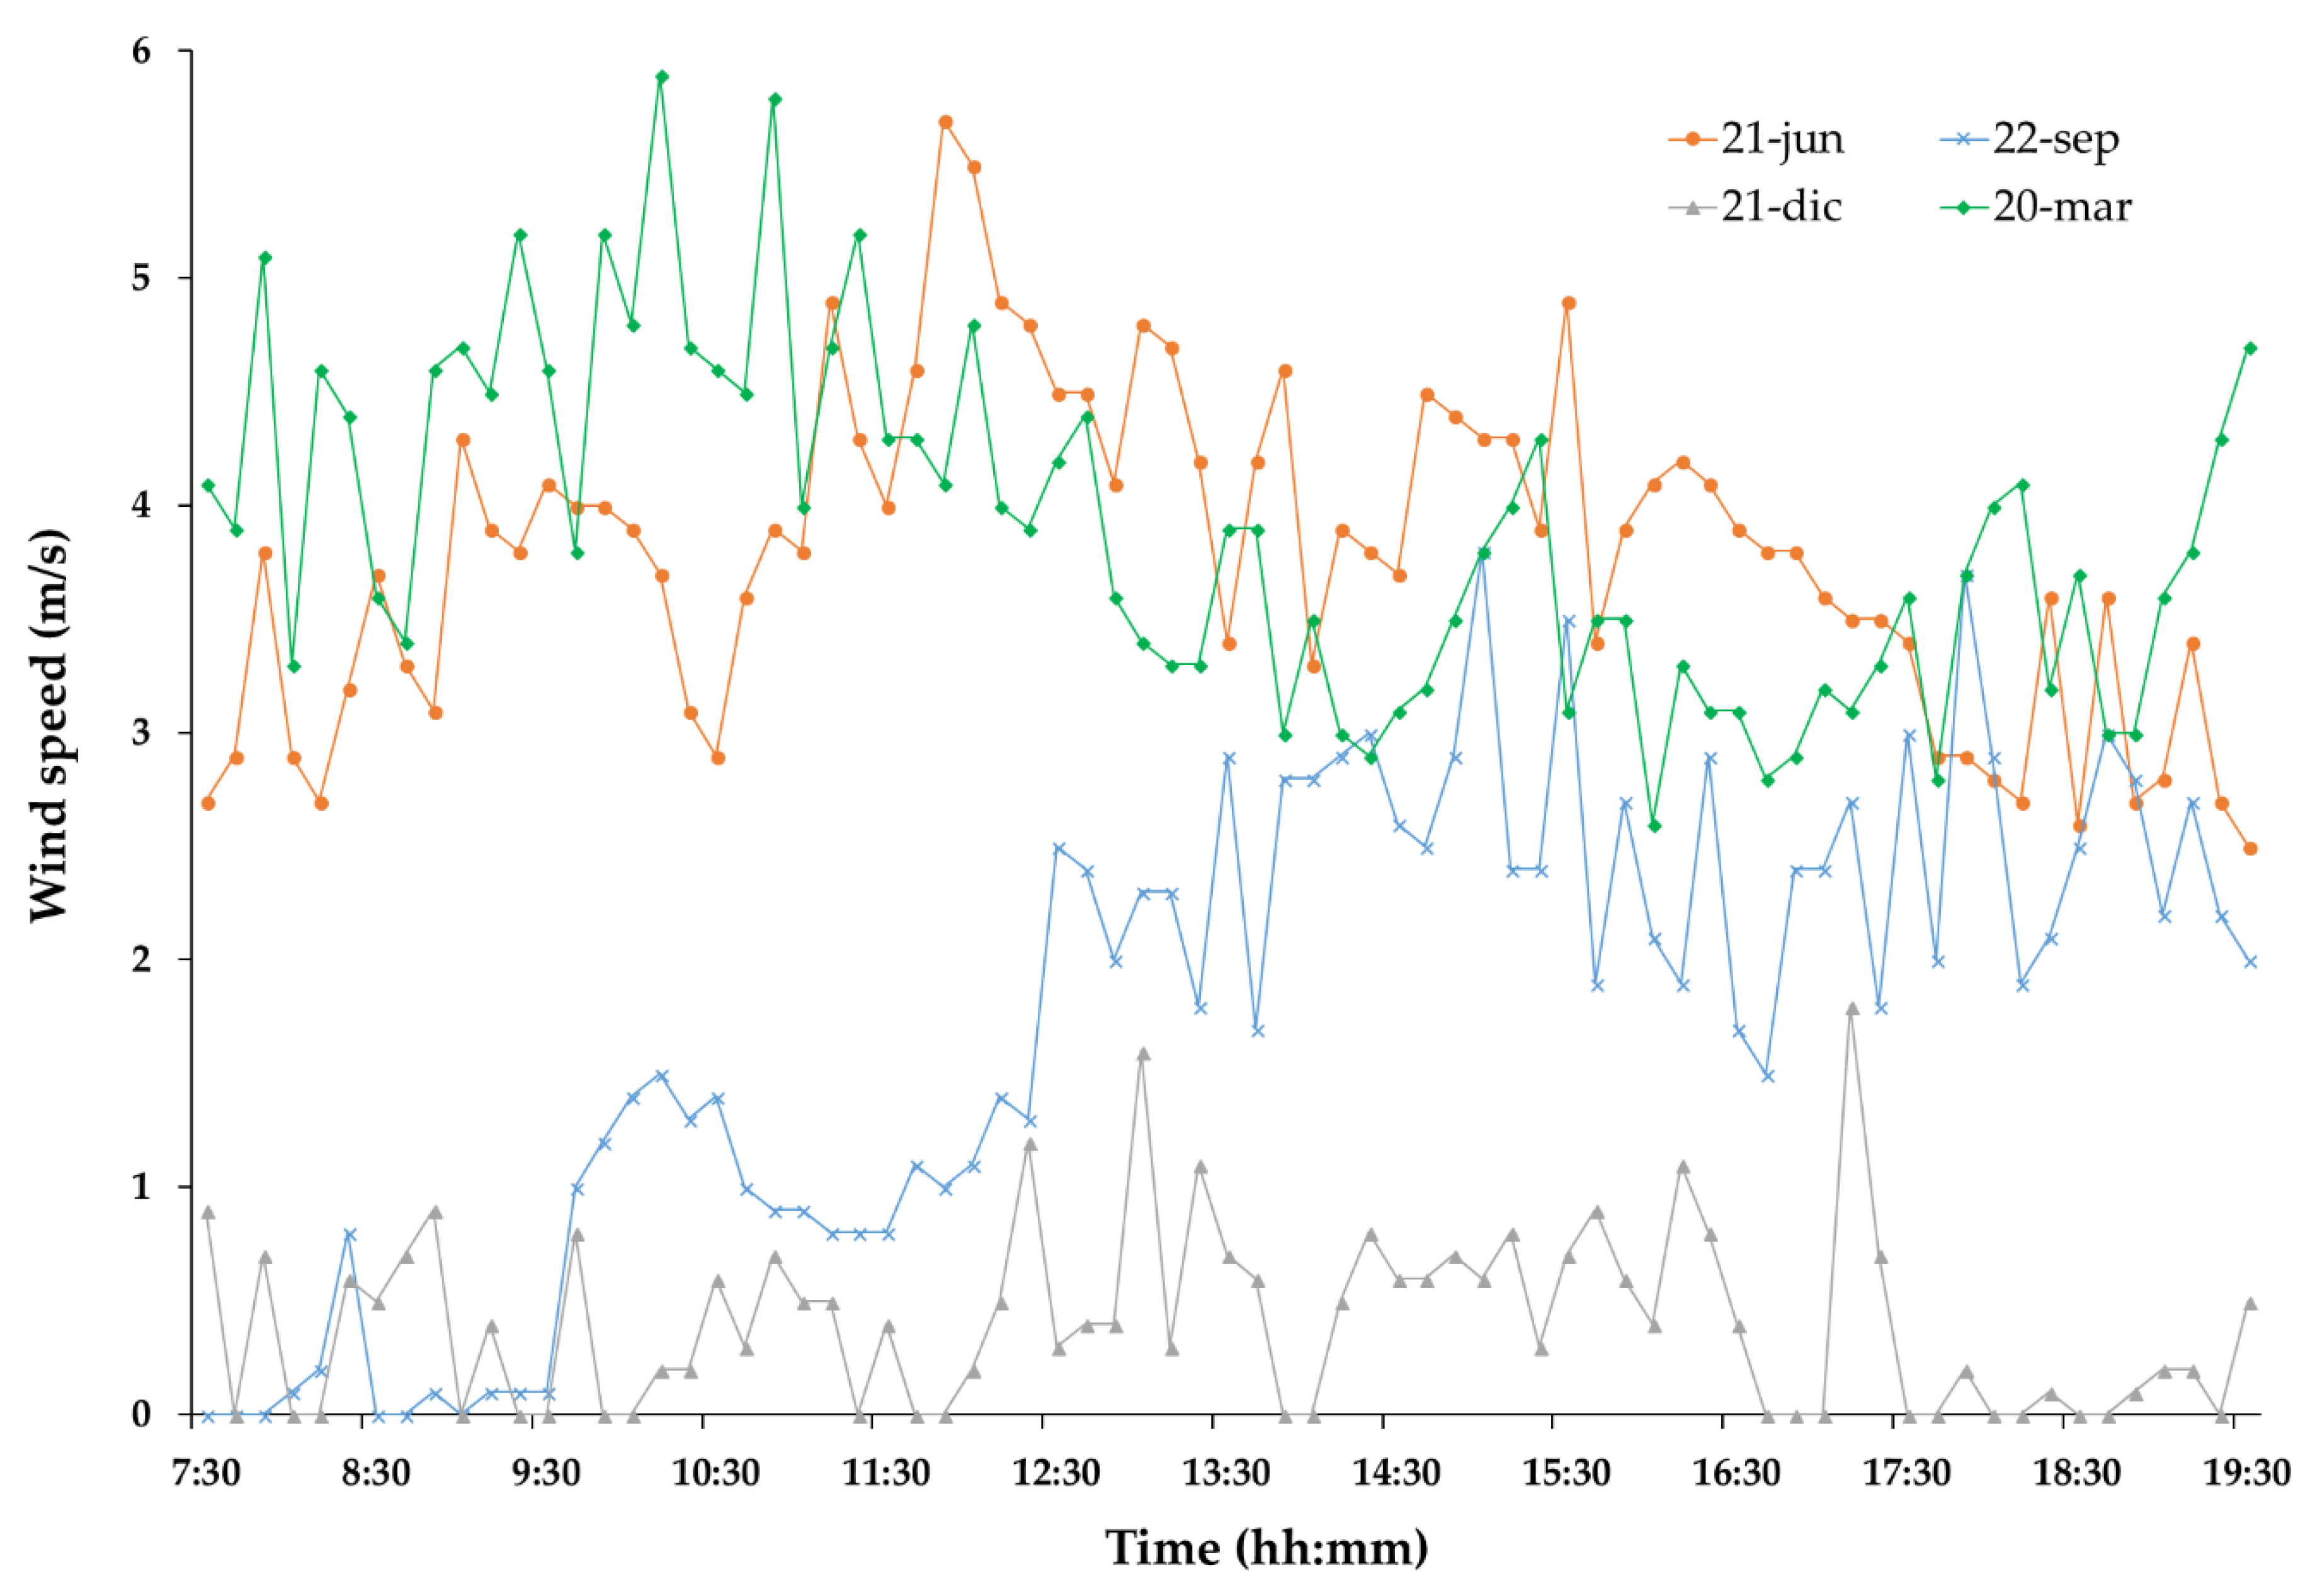
Figure 6 shows the data corresponding to wind speed.
3.2.2. Ambient Temperature
Figure 7 shows the results obtained for ambient temperature.
3.2.3. Relative Humidity
Figure 8 shows the results obtained for relative humidity.
3.2.4. Barometric Pressure
Figure 9 shows the results obtained for barometric pressure.
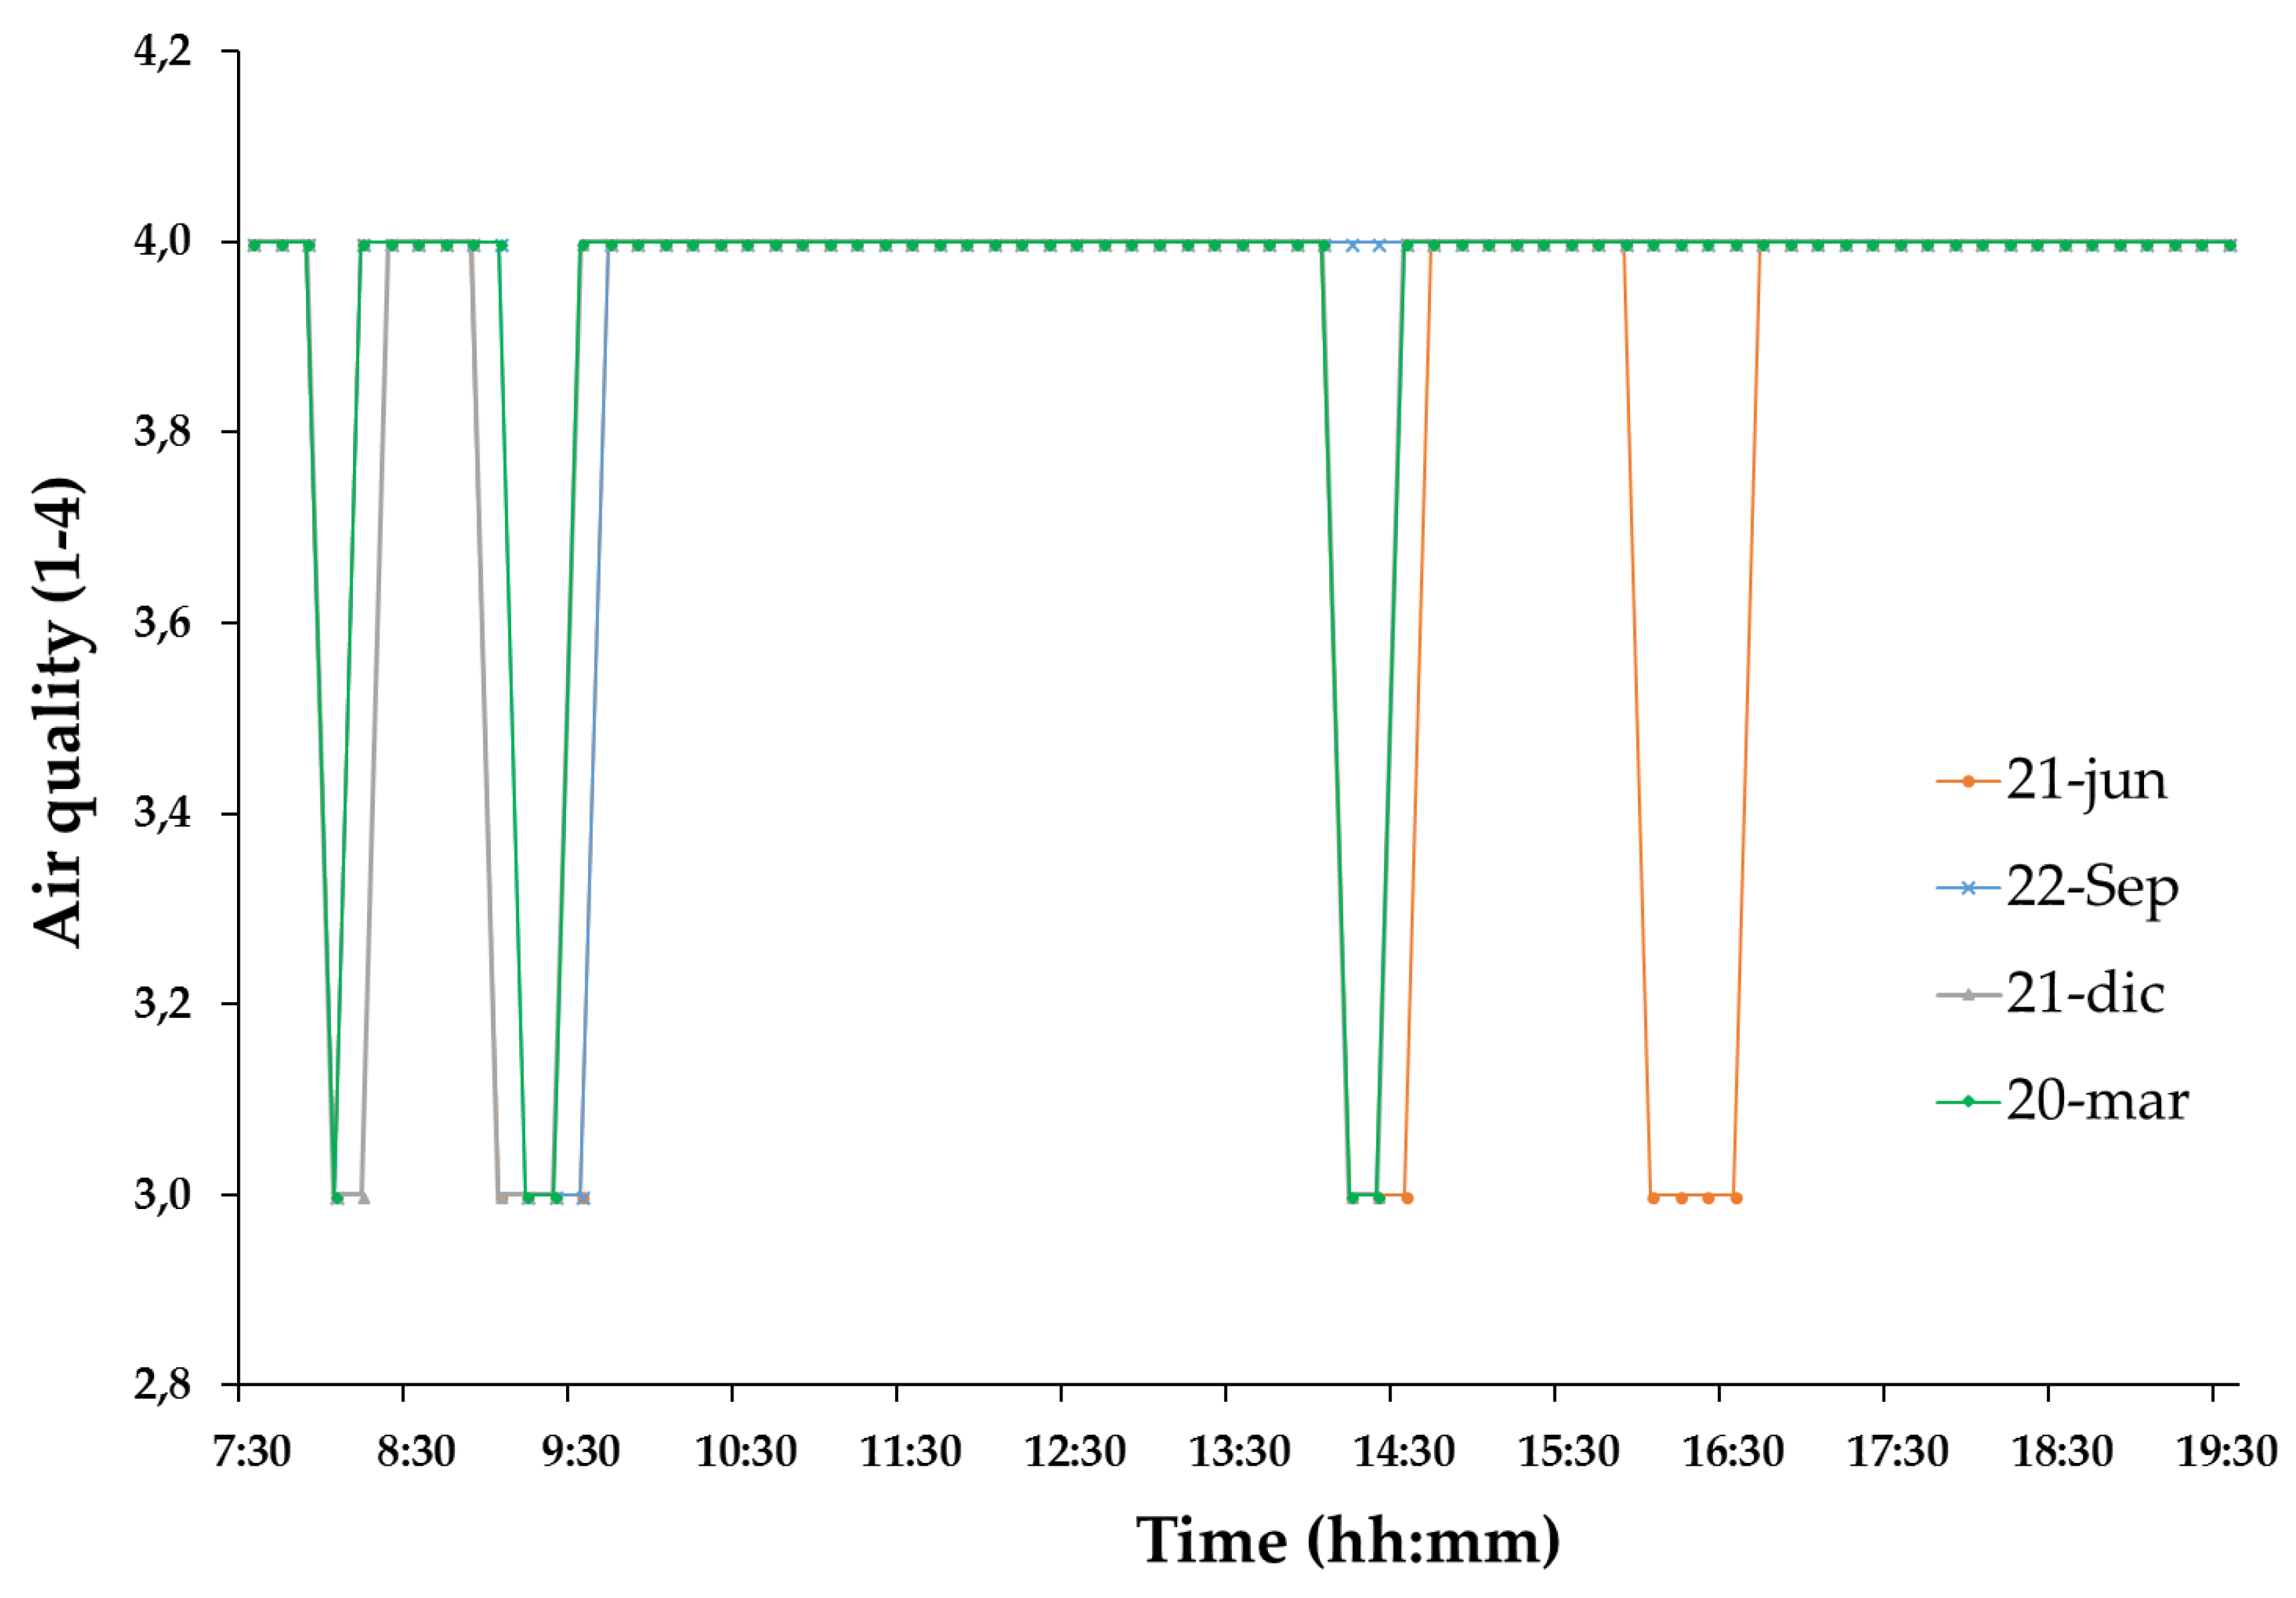
Figure 10 shows the values obtained for air quality. For this, a rating (1 to 4) inversely proportional to the concentration in μg/cm3 of polluting gases (CO, NO2 and O3) has been established. There is thus fresh air under optimal conditions (rate 4 corresponding to a maximum of 50 μg/cm3), air with a small concentration of gases (rate 3 corresponding to a maximum of 80 μg/cm3), high pollution and high concentration of harmful gases but without the necessity to take protection measures (rate 2 equivalent to a maximum of 140 μg/cm3) and high pollution with the need to take precautionary measures (rate 1 equivalent to 180 μg/cm3 at most).
4. Discussion
After obtaining the results and verifying the correct functioning of the weather station, as well as validation of the measurements taken by each sensor and collating them with the AEMET source, each of the obtained graphics can be analyzed.
Considering the wind speed register readings it can be observed how the sensors give values according to different gusts produced throughout the day, obtaining very sharp values. It seems that there is no clear difference between the speed in the morning and in the afternoon. However, on the 21st of June the speed decreases over time, and on the 22 September it increases. In all analyzed cases the wind speed varies between values from 0 to 6 m/s.
The measurement of ambient temperature is crucial for a possible passive conditioning of buildings constructed in an area. The obtained results show a progressive increase as the daytime hours pass, and a decrease afterwards with sunset as expected. The temperature increase seems to be similar in all cases, varying from 7 to 10 °C approximately, without sudden changes, between the winter and summer seasons.
From the relative humidity measures taken under adequate hygrometric conditions for the seasons and susceptible to be interpreted using Givoni diagram, a decreasing tendency can be observed throughout the day. This tendency is caused by the fact that an important percentage of any morning dew evaporates over the day, decreasing the ambient humidity. The driest days (21 June and 20 March) present oscillations of about 40% and 60% and the wettest days (22 of September and 21 of December) oscillate between 40% and 80%. In all of the cases the values are appropriate for the continental type of climate [32].
In terms of barometric pressure, a priori there is no sequence that displays a specific pattern, oscillating from one day to another in a random way. Thus could be similar to the oscillation corresponding to the wind speed, but softer in terms of peak values. In any case, the pressure differences during the same day are not extremely high, never exceeding 5 hPa.
Finally, air quality analysis is one of the most relevant topics in big cities: growing environmental awareness, proliferation of respiratory diseases, even premature deaths imputable to poor air quality, justify the incorporation of these sensors in our weather station [33]. The values indicate a normal air quality of level 4 that only decreased to the acceptable level 3 in determined time frames. This decrease is caused by the agglomeration of cars near the city center during the hours of entry and exit of students from the campus according to the educational schedule. Thus, the prototype can be used by engineers and technicians collecting environmental data with an aim to facilitate more reliable parametrization of the project.
Comparison between Validation Station and Weather Station
Table 3 shows the results obtained by the weather station and by the validation station for different environment variables. In particular, in order to not overload the paper, only the results of 21st of December are presented, where the high accuracy obtained by the designed electronic device can be observed.
5. Conclusions
An electronic prototype of a solar weather station that is able to collect and store great amounts of environment data was built and validated. After conducting tests in a real environment and comparing the results with those obtained by a validation station elaborated with commercial sensors, the veracity of the results obtained by the sensors of the Arduino system was confirmed for further treatment and interpretation in project design.
The studied climatological and environmental variables are of a great scientific relevance for the design of renewable energy plants or for the passive conditioning of buildings. Their use through prototypes on industrial scale allows one to know in advance the boundary conditions in order to fix the variables with accuracy in simulation programs. Additionally, a correct encapsulation of the device and the use of SD memories for the storage of data on a large scale, would provide the industrial prototype with more autonomy, corroborating the validity of the Arduino platform as a microcontroller for the fabrication of robots. Another relevant aspect of the prototype is the economic competitiveness compared to commercial meteorological stations or data collection systems.
During the project free software was used for the design and modelling of control tasks that allowed us to obtain a purer prototype avoiding conflicts between communication protocols inside the device. Thus, the use of these systems allows engineers to have an additional help for energetically more sustainable projects thanks to the data and results that can be obtained by the prototype.
Author Contributions
All the authors worked in an equitable way during the project. J.P.D. created and designed the tests. D.F. and P.S. analyzed the data, J.P.D. and C.M. conducted the tests, J.P.D. and D.F. wrote the paper, P.S. and C.M. translated and reviewed the final manuscript.
Funding
This work has been supported by Universidad Politécnica de Madrid and the students of CFGS of Energy Efficiency and Thermal Solar Energy.
Acknowledgments
The authors would like to express their gratitude to the students of CFGS of Energy Efficiency and Thermal Solar Energy for their collaboration, helping with data taking and the prototype setting up.
Conflicts of Interest
The authors declare no conflict of interest
References
- Zhao, X.; Fan, Y.; Fang, M.; Hua, Z. Do environmental regulations undermine energy firm performance? An empirical analysis from China’s stock market. Energy Res. Soc. Sci. 2018, 40, 220–231. [Google Scholar] [CrossRef]
- Bicer, Y.; Dincer, I. Life cycle environmental impact assessments and comparisons of alternative fuels for clean vehicles. Resour. Conserv. Recycl. 2018, 132, 141–157. [Google Scholar] [CrossRef]
- Ramos, A.; Teixeire, C.A.; Rouboa, A. Environmental Analysis of Waste-to-Energy—A Portuguese Case Study. Energies 2018, 11, 535. [Google Scholar] [CrossRef]
- Hsin-Ning, S.; Moaniba, I.M. Does innovation respond to climate change? Empirical evidence from patents and greenhouse gas emissions. Technol. Forecast. Soc. Chang. 2017, 122, 49–62. [Google Scholar]
- Bohelert, B.; Strzepek, K.M.; Grebetsadik, Y.; Swanson, R.; McCluskey, A.; Neumann, J.E.; McFarland, J.; Martinich, J. Climate change impacts and greenhouse gas mitigation effects on U.S. hydropower generation. Appl. Energy 2016, 183, 1511–1519. [Google Scholar] [CrossRef] [Green Version]
- Madruga, E.P.; Bernardon, D.P.; Vieira, R.P.; Pfitscher, L.L. Analysis of transient stability in distribution systems with distributed generation. Int. J. Electr. Power Energy Syst. 2018, 99, 555–565. [Google Scholar] [CrossRef]
- Stritih, U.; Tyagi, V.V.; Stropnik, R.; Paksoy, H.; Haghighat, F.; Joybari, M.M. Integration of passive PCM technologies for net-zero energy buildings. Sustain. Cities Soc. 2018, 41, 286–295. [Google Scholar] [CrossRef]
- Tang, W.-J.; Yang, H.-T. Data Mining and Neural Networks Based Self-Adaptive Protection Strategies for Distribution Systems with DGs and FCLs. Energies 2018, 11, 426. [Google Scholar] [CrossRef]
- Poggi, F.; Firmino, A.; Amado, M. Planning renewable energy in rural areas: Impacts on occupation and land use. Energy 2018, 155, 630–640. [Google Scholar] [CrossRef]
- Anoune, K.; Bouya, M.; Astito, A.; Abdellah, A.B. Sizing methods and optimization techniques for PV-wind based hybrid renewable energy system: A review. Renew. Sustain. Energy Rev. 2018, 93, 652–673. [Google Scholar] [CrossRef]
- Bartolucci, L.; Cordiner, S.; Molune, V.; Rocco, V.; Rossi, J.L. Hybrid renewable energy systems for renewable integration in microgrids: Influence of sizing on performance. Energy 2018, 152, 744–758. [Google Scholar] [CrossRef]
- Geuder, N.; Wolfertstetter, F.; Wilbert, S.; Schuler, D.; Affolter, R.; Kraas, B.; Lupfert, E.; Espinar, B. Screening and flagging of solar irradiation and ancillary meteorological data. Energy Procedia 2015, 69, 1989–1998. [Google Scholar] [CrossRef] [Green Version]
- Agüera, A.; Palomares, J.C.; González, J.J.; Florencias, O. Weather forecasts for microgrid energy management: Review, discussion and recommendations. Appl. Energy 2018, 228, 265–278. [Google Scholar] [CrossRef]
- Devaraju, J.T.; Suhas, K.R.; Mohana, H.K.; Vijaykumar, A.P. Wireless Portable Microcontroller based Weather Monitoring Station. Measurement 2015, 76, 189–200. [Google Scholar] [CrossRef] [Green Version]
- Tian, J.; Wang, Y.; Liang, X.; Wang, G.; Zhang, Y. WA-MAC: A weather adaptive MAC protocol in survivability-heterogeneous wireless sensor networks. Ad Hoc Netw. 2017, 67, 40–52. [Google Scholar] [CrossRef]
- Prazuek, M.; Konecny, J.; Hamel, A.; Hlavica, J. Fuzzy Energy Management of Autonomous Weather Station. IFAC-PapersOnline 2015, 48, 226–229. [Google Scholar]
- Eguía, P.; Alonso, J.M.; Saavedra, A.; Arce, E.; Granada, E. Improving the calibration of building simulation with interpolated weather datasets. Renew. Energy 2018, 122, 608–618. [Google Scholar] [CrossRef]
- Tae-Keun, O.; Lee, D.; Park, M.; Cha, G.; Park, S. Three-Dimensional Visualization Solution to Building-Energy Diagnosis for Energy Feedback. Energies 2018, 11, 1736. [Google Scholar]
- Abbate, S.; Avvenunti, M.; Carturan, L.; Cesarini, D. Deploying a Communicating Automatic Weather Station on an Alpine Glacier. Procedia Comput. Sci. 2013, 19, 1190–1195. [Google Scholar] [CrossRef]
- Machacek, J.Z.; Srovnal, V. Automated System for Data Measuring and Analyses from Embedded Systems. In Proceedings of the 7th WSEAS International Conference on Automatic Control, Modeling and Simulation, Prague, Czech Republic, 13–15 March 2005; pp. 13–15, 43–48. [Google Scholar]
- Rosiek, S.; Batles, F.J. A microcontroller-based data-acquisition system for meteorological station monitoring. Energy Convers. Manag. 2008, 49, 3746–3754. [Google Scholar] [CrossRef]
- Zumuda, G.; Opalinski, A.; Glowaki, M. Mobile monitoring system for environment parameter. Adv. Intell. Syst. Comput. 2018, 655, 252–261. [Google Scholar]
- Laskar, M.R.; Bhattacharjee, R.; Giri, M.S.; Bhattacharya, P. Weather Forecasting Using Arduino Based Cube-Sat. Procedia Comput. Sci. 2016, 89, 320–323. [Google Scholar] [CrossRef]
- Morón, C.; Ferrández, D.; Saiz, P.; Vega, G.; Diaz, J.P. New Prototype of Photovoltaic Solar Tracker Based on Arduino. Energies 2017, 10, 1298. [Google Scholar] [CrossRef]
- Yokoyama, T.; Axelsen, H.B.; Glück, R. Fundamentals of reversible flowchart languages. Theor. Comput. Sci. 2016, 611, 87–115. [Google Scholar] [CrossRef]
- Julius, R.; Schürenberg, M.; Shumacher, F.; Fay, A. Transformation of GRAFCET to PLC code including hierarchical structures. Control Eng. Pract. 2017, 64, 173–194. [Google Scholar] [CrossRef]
- Tan, A.; Changjiang, J. The application of Maze algorithm in translating ladder diagram into instruction list of programmable logical controller. Procedia Eng. 2011, 15, 264–268. [Google Scholar] [CrossRef]
- Barisic, A.; Amaral, V.; Goulao, M. Usability driven DSL development with USE-ME. Comput. Lang. Syst. Struct. 2018, 51, 118–157. [Google Scholar]
- Falck, D.Y.; Colle‘e, B. Freecad [How-To], 1st ed.; Packt Publishing: London, UK, 2012; pp. 1–70. [Google Scholar]
- Camba, J.D.; Contero, M.; Company, P. Parametric CAD modeling: An analysis of strategies for design reusability. Comput. Aided Des. 2016, 74, 18–31. [Google Scholar] [CrossRef] [Green Version]
- Spicer, R.A.; Valdes, P.J.; Spicer, T.E.V.; Craggs, H.J.; Yang, J. New developments in CLAMP: Calibration using global gridded meteorological data. Palaeogeogr. Palaeoclimatol. Palaeoecol. 2009, 283, 91–98. [Google Scholar] [CrossRef]
- Hosseini, M.; Tardy, F.; Lee, B. Cooling and heating energy performance of a building with a variety of roof designs; the effects of future weather data in a cold climate. J. Build. Eng. 2018, 17, 107–114. [Google Scholar] [CrossRef]
- Van Wart, J.; Grassini, P.; Yang, H.; Claessens, L.; Cassman, K.G. Creating long-term weather data from thin air for crop simulation modelling. Agric. For. Meteorol. 2015, 209–210, 49–58. [Google Scholar] [CrossRef]
Figure 1.
(a) Recount of inputs and outputs; (b) Prototype seen from above.

Figure 2.
Flow chart and 3D design of the sensors.

Figure 3.
Design of the weather station in Free CAD 3D.

Figure 4.
Validation station. (a) Elevation; (b) Seen from above.

Figure 5.
Real prototype of weather station and validation station.

Figure 6.
Wind speed (m/s) throughout the day.

Figure 7.
Ambient temperature (°C) throughout the day.

Figure 8.
Relative humidity (%) throughout the day.

Figure 9.
Barometric pressure (hPa) throughout the day.

Figure 10.
Air quality throughout the day.


Table 1.
Description of the PLC components.
| Component | Description |
|---|---|
| 1 | Aluminium perforated plate, holes diameter 4.2 mm, 15 mm separations. |
| 2 | Water detection sensor SSHU005. Operation at 5.25 V and 20 μA. |
| 3 | Piezoelectric vibration sensor for hail detection PZT LDT0-028. |
| 4 | Anemometer 6710-WINd02. Operation at 5 V, IP44 protection level. |
| 5 | Air quality sensor MQ135. Operation range between 2.25–3.5 V. |
| 6 | Relative humidity and environmental temperature sensor DHT-22. Operation at 6 V and 1.5 mA. |
| 7 | Analogue potentiometer with 300° rotation. Operation between 0 and 5 V. |
| 8 | Commutator ON/OFF in automatic mode for control tasks. |
| 9 | Joystick for manual simulation. Operation between 3.3 and 5 V. |
| 10 | Arduino Mega 2560 ADK Android. Recommended operation voltage 7–12 V, 54 digital pins, 16 analogue inputs, 40 mA, RAM 256 kB memory, Clock speed 16 MHz. |
| 11 | Barometric pressure sensor BMP085. Operation at 5.5 V and 130 μA. |
| 12 | 3-Axis electronic compass HMC5883L. Operation between 3.3 V and 6 V, 116 Hz. |
Table 2.
Description of validation station’s components.
| Component | Description |
|---|---|
| 1 | Vane and anemometer to measure wind direction and speed (0 km/h to 108 km/h) including integrated sensors of relative humidity and environmental temperature. |
| 2 | Magnetic compass. |
| 3 | Thermometer of two channels, model PCE-T312, with precision of 1 °C. |
| 4 | Weather center for outdoor temperature measure with precision of 0.1 °C, relative humidity with precision of 1% and barometric pressure with precision of 10 mbar. |
| 5 | Irradiance measurer, model PCE-SPM1 with precision of 1 W/m2. |
| 6 | Pluviometer with a measurement range from 0 to 9999 mm. |
Table 3.
Comparison of corresponding devices during winter solstice 2017.
| Time (hh:mm) | Wind Speed (m/s) | Ambient Temperature (°C) | Relative Humidity (%) | Barometric Pressure (hPa) | Air Quality | |||||
|---|---|---|---|---|---|---|---|---|---|---|
| Prot. | Val. | Prot. | Val. | Prot. | Val. | Prot. | Val. | Prot. | Val. | |
| 7:30 | 0.9 | 1.0 | 2.7 | 2.5 | 79 | 78 | 946.5 | 902.6 | 4 | 4 |
| 8:30 | 0.5 | 0.5 | 3.7 | 3.4 | 80 | 75 | 946.8 | 903.2 | 4 | 4 |
| 9:30 | 0.0 | 0.0 | 5.1 | 5.1 | 80 | 77 | 947.5 | 976.9 | 4 | 4 |
| 10:30 | 0.6 | 0.6 | 6.5 | 6.2 | 77 | 71 | 947.9 | 941.2 | 4 | 4 |
| 11:30 | 0.4 | 0.4 | 8.2 | 8.4 | 66 | 64 | 947.9 | 942.2 | 4 | 4 |
| 12:30 | 0.3 | 0.3 | 9.4 | 9.0 | 59 | 53 | 947.6 | 945.3 | 4 | 4 |
| 13:30 | 0.7 | 0.7 | 10.2 | 9.6 | 56 | 53 | 947.0 | 943.4 | 4 | 4 |
| 14:30 | 0.6 | 0.6 | 10.3 | 10.5 | 50 | 50 | 945.9 | 912.5 | 4 | 4 |
| 15:30 | 0.7 | 0.7 | 9.6 | 8.7 | 46 | 48 | 946.0 | 933.6 | 4 | 4 |
| 16:30 | 0.4 | 0.4 | 8.3 | 8.9 | 49 | 45 | 946.1 | 952.7 | 4 | 4 |
| 17:30 | 0.0 | 0.1 | 6.8 | 6.5 | 54 | 57 | 946.4 | 958.8 | 4 | 4 |
| 18:30 | 0.0 | 0.0 | 5.5 | 5.4 | 59 | 57 | 946.5 | 951.3 | 4 | 4 |
| 19:30 | 0.5 | 0.5 | 4.2 | 4.0 | 63 | 67 | 946.8 | 960.1 | 4 | 4 |
| Dispersion | 1.54% | 4.78% | 4.28% | 1.75% | 0% | |||||
Pro. = Prototype; Val. = Validation Station.
© 2018 by the authors. Licensee MDPI, Basel, Switzerland. This article is an open access article distributed under the terms and conditions of the Creative Commons Attribution (CC BY) license (http://creativecommons.org/licenses/by/4.0/).
Share and Cite
MDPI and ACS Style
Morón, C.; Diaz, J.P.; Ferrández, D.; Saiz, P. Design, Development and Implementation of a Weather Station Prototype for Renewable Energy Systems. Energies 2018, 11, 2234. https://doi.org/10.3390/en11092234
AMA Style
Morón C, Diaz JP, Ferrández D, Saiz P. Design, Development and Implementation of a Weather Station Prototype for Renewable Energy Systems. Energies. 2018; 11(9):2234. https://doi.org/10.3390/en11092234
Chicago/Turabian StyleMorón, Carlos, Jorge Pablo Diaz, Daniel Ferrández, and Pablo Saiz. 2018. "Design, Development and Implementation of a Weather Station Prototype for Renewable Energy Systems" Energies 11, no. 9: 2234. https://doi.org/10.3390/en11092234
Note that from the first issue of 2016, this journal uses article numbers instead of page numbers. See further details here.