1. Introduction
Local and regional energy systems are important entities in the current energy transition towards a low-carbon, renewable energy system [
1,
2]. At a regional level, in Austria for example, 106 “climate and energy model regions” including 1113 municipalities with 2.5 million inhabitants have been created and initiatives such as climate communities (Klimabündisgemeinden) or e-5 communities (e-5 Gemeinden) have developed since the 1990s [
3,
4]. In Germany, similar initiatives such as the 100% renewable energy regions (100ee-Regionen) have emerged on a regional scale, with similar initiatives at city and community level [
5,
6,
7]. Some of these regions have been quite successful in the energy transition, building new institutional structures and increasing the share of renewable energy sources in the regional energy supply, while being able to export energy to other regions [
8,
9,
10,
11,
12,
13]. In many cases, however, a few years after the initial enthusiasm, a hiatus emerged as the expected outcomes in energy self-sufficiency were not reached within the time they were envisioned [
14,
15,
16].
Empirically, several authors have analysed the relevant factors for an energy transition at a regional level to be successful. As such, they have investigated the role of guiding visions and foresight, the number and characteristics of actors and arenas involved in the transition process, the course of the institutionalization process, or the development of the energy and material flows over time [
8,
9,
17,
18,
19]. A number of studies have developed models for analysing and simulating transition processes towards sustainability [
20,
21,
22]. However, even though there is empirical evidence that the success of a transition depends, amongst others, on the transition pathway itself [
23], none of the studies has explicitly analysed the resilience of a regional energy system in a transition process.
Resilience as a core concept of social-ecological and socio-technical systems research has gained substantial attention in the last two decades, both from a scientific and from a policy-oriented point of view (see [
24] for a comprehensive review). In the socio-ecological systems literature, resilience is traditionally understood as “the capacity of a system to absorb disturbance and reorganize while undergoing change so as to still retain essentially the same function, structure, identity and feedbacks” [
25]. Out of the analysis of critical infrastructures, a specific literature strand on energy resilience has emerged, dealing, that is, with the resilience of the power grid to external shock [
26,
27,
28]. Further applications are in urban infrastructure planning and in risk and disaster management [
29]. Out of these studies, a number of frameworks to conceptualise critical infrastructure resilience and energy system resilience have emerged and various measures and indicator sets have been proposed to understand and measure the resilience of the technical energy infrastructure [
30,
31,
32,
33]. Though helpful for the reflection on the technical aspects of the socio-technical properties of an energy system in transition, energy resilience remains a predominantly static concept, which a focus on restoring functionality of a given energy system after a critical shock. It also lacks a true integration of social aspects, such as social structures and relations. Where social aspects are taken into consideration, the social subsystem is mostly treated subordinate to the technical subsystem and mostly analysed with respect to the resilience of the technical system.
Most of the resilience literature remains conservative in the sense that it presupposes stable system states and advocates for a management approach of complex social-ecological and socio-technical systems (see e.g., [
34]). We build upon an alternative understanding of resilience following in “[that resilience is] less characterized by systemic properties and rather operates on the context [level] of the system” (p. 4). In other words, it is important for the system to maintain its basic functionality, even as key actors, processes and functions change over time [
35]. Inspired by the four stages of the adaptive cycle (exploitation, conservation, collapse and reorganization), a procedural understanding of resilience can be seen as the capacity of a system to navigate all phases of the adaptive cycle, while still providing the basic services of what [
36] call “the net social utility.”
Reference [
1] have theoretically derived an analytical approach to assess the resilience of regional energy systems in transitions. They base their approach on two core-attributes of resilience, namely diversity and connectivity. Building on the indicator set developed in Reference [
1], we aim in this follow-up paper to apply indicators to a specific case-study region in Austria and reflect on the possibilities, added values and potential pitfalls of empirically measuring the resilience of a regional energy transition. We do this along the following four guiding research questions, relating to the application of the indicators and their interpretation:
How can we apply the approach proposed by [
1] to allow to empirically measure the resilience of a regional energy system in transition, with regard to both the social and technical aspects?
Where can the studied regional system be situated with respect to the four ideal-cases presented in Reference [
1] and what can we learn with respect to the (potential) success of the transition process?
Does the approach allow for a resilience assessment that is transferable to other regions and other contextual settings?
What are the policy implications of using this indicator set to analyse an energy region in transition?
In order to tackle these questions, we build on empirical material from a case-study area in Austria. We apply the indicators developed in Reference [
1] and measure the core aspects defining the resilience of the system throughout the transition process. We then compare the results with qualitative insights from another case study area in Germany. We conclude with some general insights and specific recommendations regarding the application of a resilience framework in the context of (energy) transitions.
2. The Resilience of Regional Energy Transitions
The current shift of the energy supply structure from a mainly fossil fuel based system to one built on renewable energy sources takes place on different geographical scales, that is, on a global, national, regional and local level. The regional scale has been emphasised by policy-makers and experts alike to be especially suited for bottom-up initiatives and policy-interventions due to (1) the spatial and social proximity of actors, (2) the regionally accessible resources and (3) the positive regional economic effects of renewable energy development [
37,
38].
Transitions are usually driven by specific actors within a systemic context, who for ideological, economic or technical reasons are convinced that change processes are required and push for systemic change [
39]. Novel ideas, disruptive technology developments and innovative ways of doing business normally develop in “niches,” which offer engaged actors the possibility of trial-and-error experimentation without being fully integrated into the mainstream system. By means of up-scaling and proliferation, the practices and actors can potentially link up to the mainstream systems and the actors of the so-called system regime (see e.g., [
40]). Whereas this view originated in the context of technological innovations, the idea has been taken up in the area of sustainability science linking it to processes of transition towards more durable and responsible ways of organizing society, doing business and using resources (see [
31,
32]).
The transitions of socio-technical systems, systems in which technologies, their social use and governance structure are conceptualised as deeply interlinked and developing in a co-evolutionary way, can be subdivided into four distinct archetypal phases: the pre-development, the take-off, the acceleration and the stabilization phase (see [
41]). In the pre-development phase, the transition process starts to get under way and values, ideas and ways of doing business begin to change, at least for certain actors and actor groups that actively push for change (the actors of the niche, see [
39]). On a system’s level, the pre-development phase is characterized by a dynamic equilibrium and the status quo does not change (yet). The take-off phase is when visible changes in the system’s structure and functioning appear on wider scales not only in the niche but also on the regime level. During the acceleration phase, collective learning processes fundamentally change the system′s functioning, new technologies are broadly adopted and social practices are adapted accordingly. During the stabilization phase, the speed of social change decreases and a new dynamic equilibrium is reached.
2.1. Measuring Resilience along the Transition Pathway
Reference [
1] propose six metrics for measuring diversity and connectivity, accounting for both the social and the technical components of the energy system (
Table 1). Diversity and connectivity are assessed separately for both the technical and the social subsystems.
2.1.1. Social Sub-System
With respect to the analysis of the social subsystem we rely on the concept of “social arenas” [
17,
37]. Social arenas are defined as “societal subsystems or spheres, characterized by their rationality and codes depending on their function” (translated by the authors from [
17]). Commonly these arenas can be identified by their specific structure, that is, network or market-based and the functional characteristics of their central agent groups, such as politicians, entrepreneurs or private households. In the context analysed, we selected the following social arenas based on the specific characteristics of the sector and the case-study areas: industry, associations, research, politics and media. In order for the system to be resilient at all points along the transition pathway, the actors from the different arenas have to collaborate with each other to ensure the functionality of the system and drive the system′s development towards sustainability (see [
42]). Thereby, social connectivity is characterized by the exchange patterns between actors from different social arenas. We can distinguish here between formal and informal exchange patterns [
43,
44]. Formal connectivity can encompass shared business ownership, contractual collaboration arrangements, outsourcing and joint venture activities, membership in industry organizations, or similar. Informal connectivity includes information exchange on a personal and voluntary basis, between business partners or not, which helps build social capital but is not directly linked to formal collaboration agreements (e.g., [
45,
46]). For a formalization of the respective concepts in mathematical form we refer to [
1].
2.1.2. Technical Sub-System
With respect to the analysis of the technical subsystem, we distinguish between different groups of (renewable) energy production technologies (technology groups). The differentiation in production technology groups with respect to their locality has been applied by [
47], as it is more precise than only studying the energy sources and it is less detailed than analysing each specific technology. In the analysed regional context, the most important technology groups in renewable energy production are hydropower (small and big plants), biogas, combined heat power production (CHP), photovoltaic (rooftop and open field) and solar heat. In order for the transition to be resilient, the technical subsystem needs to be changed carefully so that the energy provisioning functions are not endangered. The changing structure of the regional electricity grid and gas network as well as the evolution of local district heating networks, which are highly relevant to allow for a faultless integration of higher shares of renewables, have to be taken into account. The metrics for measuring diversity and connectivity in the technical subsystem based on [
1] are given in
Table 2. For a formalization of the respective concepts in mathematical form we refer to [
1].
3. Data and Methods
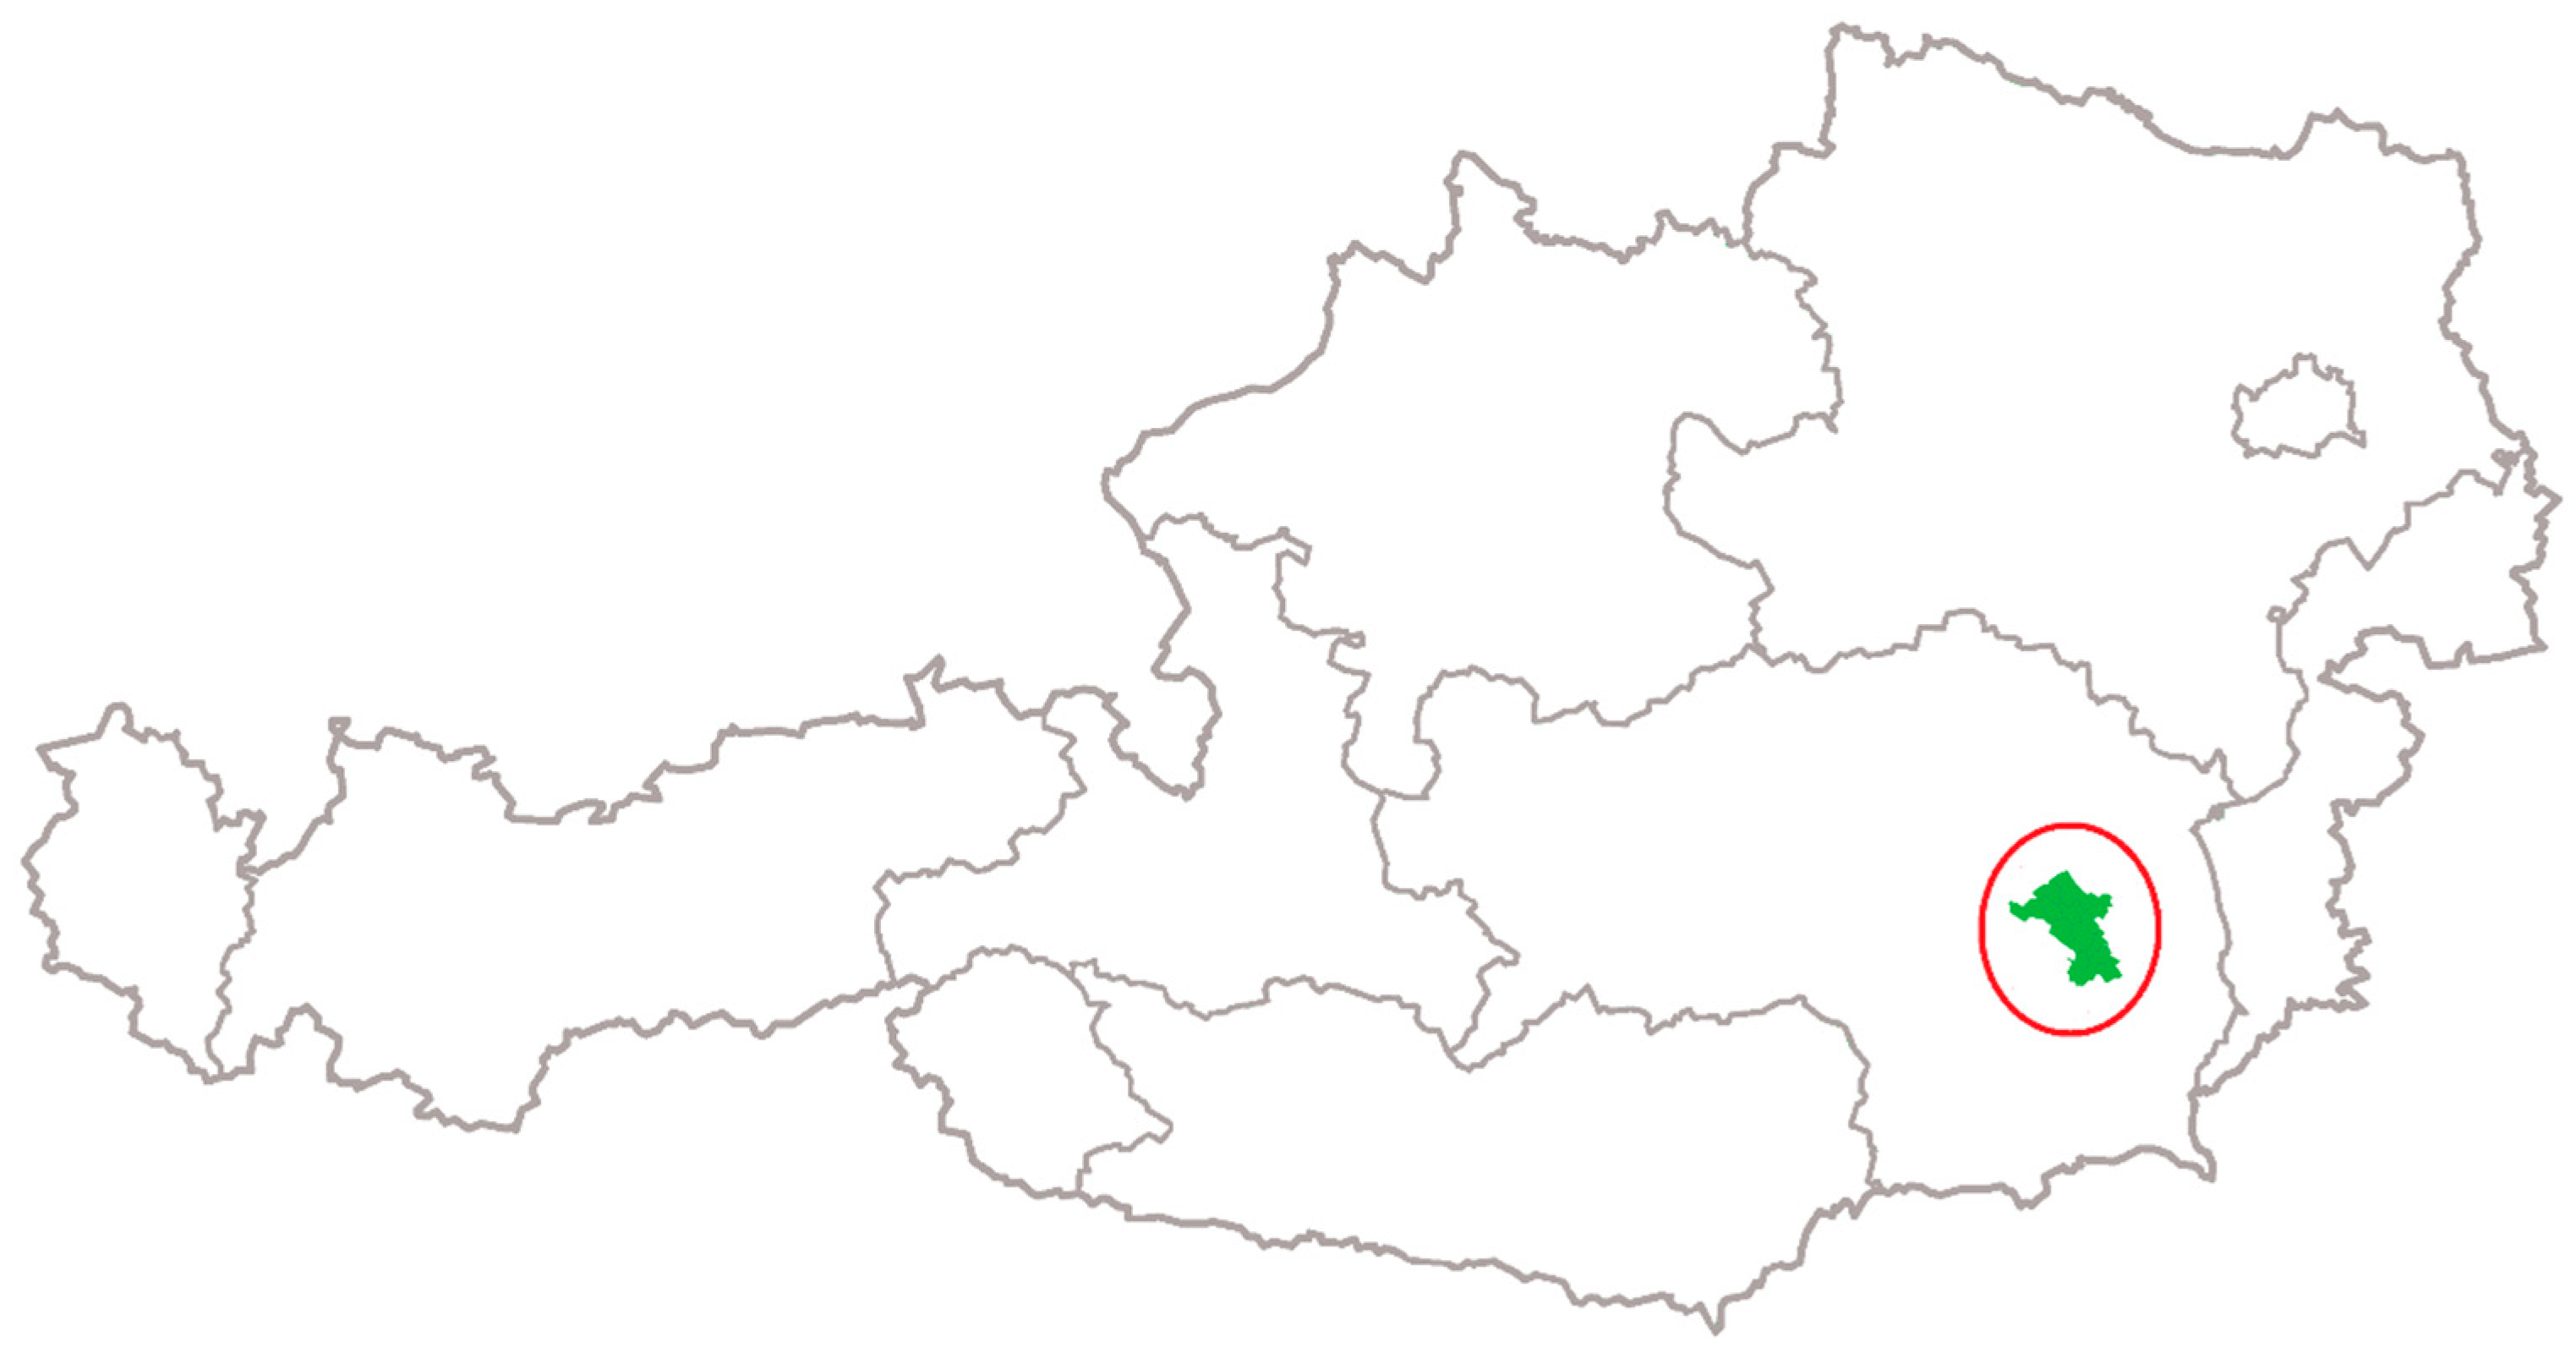
We exemplify our operationalization with results from an analysis of the socio-technical transition in the Energy Region Weiz-Gleisdorf (EWG) in Austria (
Figure 1). The EWG is a “climate and energy model region” located in Styria, Austria and encompasses 18 communes with a growing population of around 42,000 inhabitants [
48]. EWG has a long tradition in technology development for renewables, especially solar heat and photovoltaics [
49]. In 1996, the regional communes founded an energy region association in order to coordinate and foster the regional energy transition endeavours towards higher shares of renewables and energy efficiency innovations. Since 2007 EWG is also an EU LEADER region and since 2011 a “smart region” [
50].
We draw on qualitative and quantitative data from [
8,
9,
20] and on our own investigations in the area in November 2016. We present results for the years from 1990 up to 2016. This period of time was according to important events in the social subsystem, which emerged in the interviews conducted for this study.
For the determination of the constitution of the system and the establishment of the system models, we chose the years 1996, 2011 and 2016. 2011 and 2016 were the years when the interviews were conducted. We chose to include only one additional period in retrospective, due to the difficulty to assess different point in time in the past and potential biases regarding the evaluation of past events (e.g., the rosy effect, seeing the past more positive than the present [
52]). 1996 was chosen since it was considered as an important milestone in the energy transition due, amongst others, to the formal foundation of the energy region structure and the institutions that went hand in hand (secretariat, association) [
8,
9]). For consistency of the analysis, we selected the same years for the technical subsystem (1996, 2011, 2016) but also integrated figures reaching back to 1990 in order to fully assess the predevelopment phase. This allowed us to investigate in the development before and between the dates in the social subsystem.
3.1. Data Collection
For the social subsystem, we built on secondary data from interview transcripts in 2011 [
8,
9,
20]. Additionally, we collected primary data in the region in 2016. Interviews were conducted with the most important actors in the regional energy governance system, who are able to oversee the whole transition process (13 interviews in 2011, 9 interviews in 2016). The 1990 to 2011 evolution of the system configuration was discussed in both cases. While the interviews were held following a semi-structured design in both years, a mental model approach complemented the interviews in 2016 [
53,
54,
55,
56]. The mental models were elaborated by using concept maps as graphical representations of individual perceptions of reality [
57]. Hereby, the interviewees were asked to draw their mental models of the social subsystem of the energy sector in the region, focussing on (1) who were the most important actors in the region with respect to the energy transition, (2) how central were these actors with respect to the other actors in the system and (3) how closely did they collaborate with other actors in order to drive the transition process? The mental models were replicated for the years 1996, 2011 and 2016.
To gather data for the technical subsystem, we used the publicly available energy balance sheet for the federal state of Styria [
58]. A comprehensive data set was only available on the level of the federal state of Styria and not on the regional level of EWG. From the structure of the regional and the state-wide energy system, we assumed that the characteristics of the energy system on the two levels was sufficiently close in order to allow for deductions from the state to the regional level. This assumption has been supported by two interviews with energy experts in the region, a representative of the biggest urban utilities company in the region and a representative of the regional energy grid operator. Additionally, we considered data on the regional level from [
8,
9,
20] and evaluations of further regional experts. However, data for photovoltaics, biomass and solar heat where only available from 2010 onwards. No quantitative data was available for the evolution of the electricity grid and heat network over time. Thus, we rely on qualitative evaluations from regional grid operators, which we collected in semi-structured expert interviews. This approach allowed to complement the former dataset not only by information on the current situation but also by a graphical representation of the perceived configuration of the social subsystem in the past and its changes over time.
3.2. Analytical Methods
Following the approach lined out in Reference [
1] we conducted an indicator-based analysis of the two central resilience aspects diversity and connectivity separately for the social and technical subsystems. We concentrated on the actors and technical installations which are linked to the renewable energy sector, who either taking over an active or passive role in driving the transition of the energy system towards higher levels of sustainability (actors) or are indispensable in bridging production and consumption of renewable energy (technical subsector).
In the social subsystem, we analysed the diversity based on the interview transcripts from [
8,
9] according to the structured qualitative content analysis [
59,
60] by coding the transcripts in MAXQDA (
http://www.maxda.de). We investigated the variety of the social subsystem by revealing the social arenas, which the interviewees perceived as important for the regional energy transition in 1996, 2011 and 2016. Regarding the balance, we analysed the most important actors mentioned by the interviewees and assigned them to their corresponding social arenas—thereby, multiple assignments where possible, for example, politicians who were association members and were in addition working in industry. Regarding disparity, we described the qualitative differences amongst the social arenas based on the criteria proposed by [
1,
61].
We operationalized the connectivity indicators in the social subsystem based our analysis of the interview transcripts. This touches the revealed qualitative descriptions of the connectivity measures put forward in Reference [
1]. Additionally, we aggregated the individual concept maps of the interviewees to work the shared perception(s) of the social subsystem′s configuration in 1996, 2011 and 2016. Thereby, we followed the Cognitive Mapping Approach for Analysing Actors’ Systems of Practices (CMASOP) by [
54] to analyse the mental models of the regional actors from a systems perspective. The CMASOP proposes 4 steps: conducting qualitative interviews, coding the interview transcripts, deriving individual cognitive maps and merging of the individual maps to a common “social cognitive map” [
54]. For the average path length, we derived mentioned relations between actors of different social arenas—whether they were direct or indirect (which causes a higher path length). In addition to the revealed proximity between the actors, we also interpreted the perceived proximity from the conceptual maps. In order to analytically grasp centralities, we derived notions of central actors from the interviews—as representatives of their social arena—and analysed the concept maps regarding the central position of one arena and as well as a relatively higher share of relations to other arenas. Finally, to measure modularity in the social sphere, we looked for stronger relations between actors from particular social arenas in contrast to the average intensity of relations in the regional context.
In the technical subsystem, we analysed the diversity by studying the renewable energy production technologies from 1991 to 2015 in the state of Styria. Following [
1], we started off by defining how many technology groups existed at each point (variety) in time and how much they differed from each other (disparity). For the latter, we described the qualitative differences amongst the involved technology groups, based on the criteria, proposed by [
1]. We calculated the balance as the share of each renewable technology group in the overall energy production over time. We calculated both, the Shannon Weaver S = − ∑
i pi × ln(pi) and the Shannon Eveness S = − ∑
i pi × ln(pi)·lnN indices.
We applied the connectivity indicators in the technical subsystem qualitatively for both electricity and heat. Regarding the average path-length in the electricity grid, we analysed the evolution of the electricity grid′s length on the lower tension levels which are relevant to the region (level four and below). For the heat supply, we analysed the evolution of the gas net as well as the district heating systems and the number of households connected to the gas net or district heating systems. Regarding degree-centrality, we analysed the electricity grid structure regarding its adjustment to the increasing number of decentralised production sites using renewable energies—for heat, we interpreted the changes in the gas net and district heating networks. Finally, we also analysed the grid structures with respect to module formation within the electricity grid and the heat networks and interpreted the results for the modularity indicator.
Table 3 summarizes the measures that have been applied for every indicator.
4. Results
In the following section, we present our results for the six indicators [
1] for both, the technical and the social subsystem—structured according to the four predefined transition phases. As mentioned earlier, we have restricted ourselves to actors in the social subsystem that are in one way or the other engaged in the transition towards higher shares of renewables in the energy system and the infrastructure(s) that are linked to the proliferation of renewable energy. This in order to guarantee for a highest possible consistency, allowing for reproducibility with other actors and a broader set of (incumbent) technologies in the future once data availability issues are resolved.
4.1. Predevelopment Phase (1990–1996)
4.1.1. Social Subsystem
Diversity: In the early phase of the regional transition, we identified medium variety levels, since actors from four arenas were involved in the social subsystem: politics, associations, industry and research. The balance was high, since every arena was represented by only 1–2 actors and no arena was perceived to be dominant. The politics arena was represented by two mayors of the two big municipalities in the region, the industry by a municipal utility and a regional construction firm, research by two regional research centres and the association arena by an association for the promotion of renewables. Finally, the disparity among the arena was also high (see
Table 4), since the arenas clearly differed in their coordination form (hierarchy in politics, networks in associations and research and market for industry), main function (energy and energy-related products from industry, rules and funding from politics, knowledge and technology from research and networks and funding from association) as well as in their time-horizon (short-term for politics, mid-term for industry and mid- to long-term for research and associations). The overall diversity of the social subsystem in the predevelopment phase can be considered as medium to high.
Connectivity: The path length among the actors engaged in renewable energy production in the early phase of the regional energy transition was perceived as very short. All actors knew each other personally. The two mayors (politics arena) were perceived as the centre of the social subsystem, connecting all other actors. At the same time, the classical energy providers and urban utility companies were not yet taking part in the transition. As a consequence, the politics arena had the highest centrality, which resulted in a high overall centrality in the governance system of the transition. At that time, no modules were detectable within the social subsystem. Over all, the connectivity in the social subsystem was high.
4.1.2. Technical Subsystem
Diversity: In the predevelopment phase in Styria only one renewable energy source existed for electricity production, that is, hydropower. The amount of electricity produced with hydropower however slightly increased from 2680 TWh/year to 3250 TWh/year from 1990 to 1996. Variety was 1, balance 0 and no disparity can be calculated, due to the presence of only one technology group. Overall, the diversity regarding energy production from renewable sources was low.
Connectivity: The regional electricity system in the predevelopment phase was characterized by decentralized production in combination with a centralized electricity grid and lower tension levels (up to level 3) were predominant. This system configuration leads to high average path-lengths, based on the fact that there are no large centralised production sites in the region. Additionally, the centrality of the grid was high, since the production and consumption entities were only connected through central transformer units and the regional grid is embedded in the highly centralised national grid. Finally, there was low, respectively no modularity in the grid, since there was no possibility to decouple autarkic parts of the grid which directly connected production and consumptions units on the lowest voltage level. The overall connectivity of the electricity grid can be considered to be situated at medium levels. For heat, the application of the indicators is more difficult since grid- and off-grid technologies existed (wood and oil burning), while there was no overarching grid in place in order to connect them. In the early phase of the transition, the path length was high in the gas net and low for the off-grid technologies. The centrality was high for gas and low for the off-grid technologies, whereas the modularity was low for gas and high for the off-grid technologies. Overall, the connectivity in the technical subsystem can be seen as medium to low.
4.2. Take-off Phase (1996–2001)
4.2.1. Social Subsystem
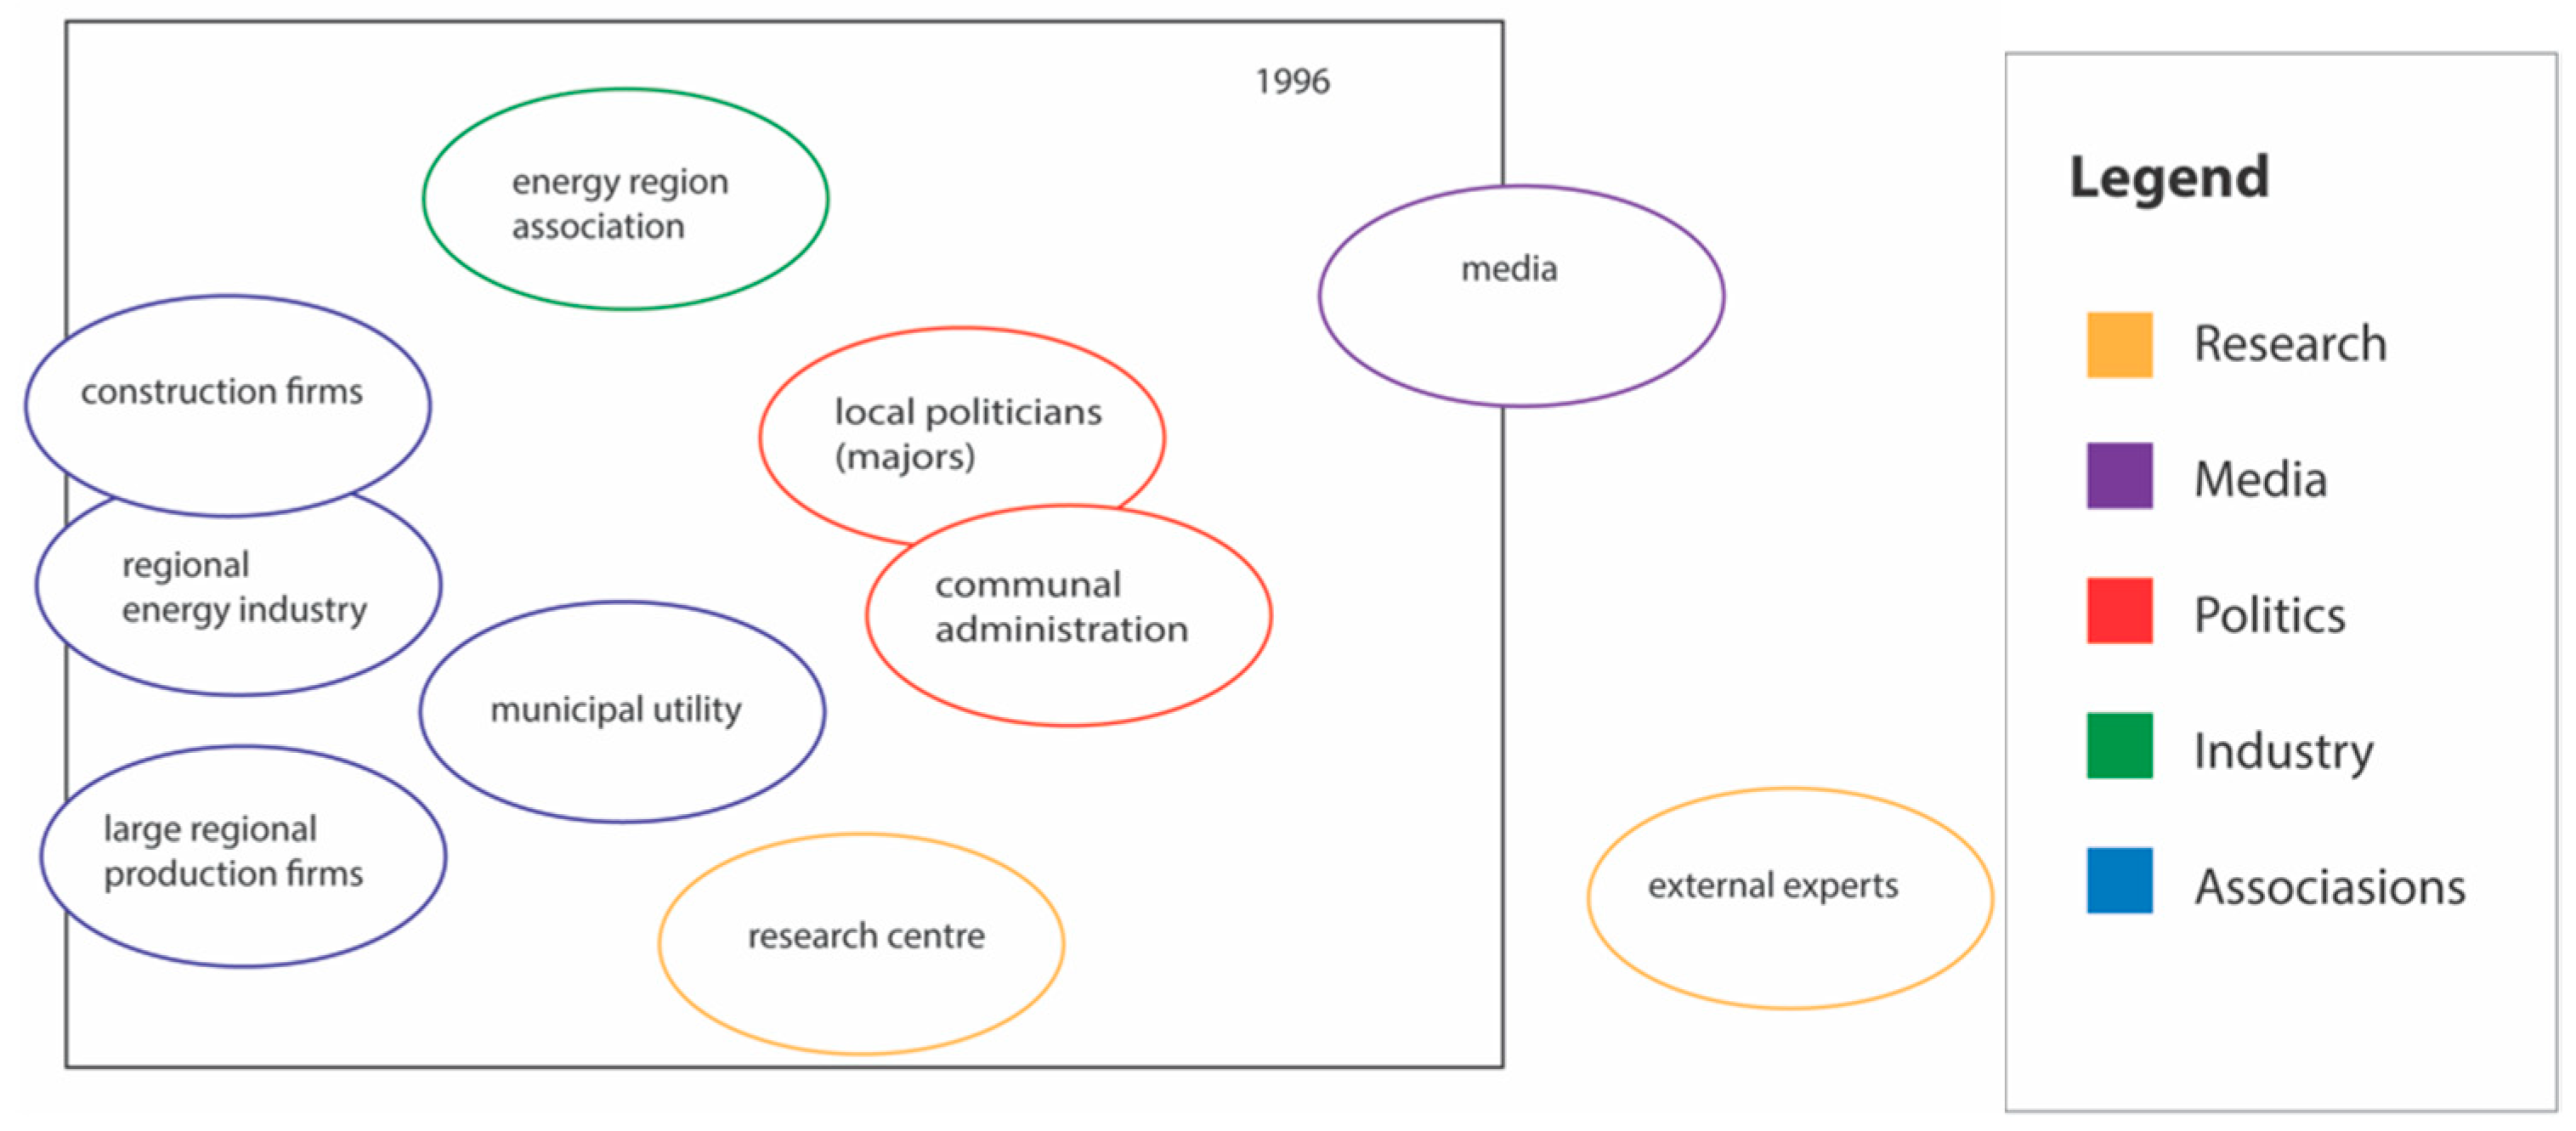
Diversity: In the take-off phase, the variety rose slightly, since the media arena was also perceived as important part of the social subsystem. Regarding the balance, the number of actors in the politics arena increased significantly due to the foundation of the energy region association which unified all 18 municipalities in the region. Moreover, more and more actors in industry and research became active in renewable energies. Investments were made and research collaborations were built, also beyond the regional level. Thus, the politics and associations arenas were perceived as less dominant and the overall balance declined to medium levels. With the appearance of the media arena, the disparity further rose. Media activities are coordinated through the market (like industry) and delivers information and facilitates opinion building, however, it has a very short-term focus. The overall diversity in the social subsystem can be considered as medium to high.
Connectivity: The path length in the social subsystem was perceived to remain at low levels, however, with the foundation of the regional energy agency and the larger engagement of industry and research, more (less central) actors were involved so that the path-length increased. Accordingly, the centrality declined to a medium level. As in the previous phase, the politics arena was perceived to be the most central. Actors from the political arena (including communal administration) were key in connecting actors from other arenas, together with the energy association. Additionally, direct connections among industry and research emerged. Finally, the modularity also slightly increased towards a medium level—due to bilateral projects among research and industry and the institutionalisation of the politics arena in the energy association. Overall, the connectivity in the social subsystem slightly decreased and can be considered to be at a medium to high level. At the same time, the existing collaborations became more formalised and stable with the foundation of the energy region association.
Figure 2 gives an overview of the aggregated mental models that were derived from the interviews in the region. The inner square delimits the regional energy system as perceived by the actors. The ovals depict actor groups belonging to specific arenas. The distance between the ovals equals the perceived proximity of the actor groups in terms of their collaboration in the field of renewable energy, as seen by the interviewees.
4.2.2. Technical Subsystem
Diversity: In the take-off phase, we start seeing a slight increase in the production of renewable energies. As wind power started to be produced, variety increased to 2. As the share of wind to overall electricity production out of new renewables was low (0.9%), both balance indicators are at around 0.01. At the same time disparity was high, with two technologies very different from each other present in the region. The overall diversity was low to medium.
Connectivity: The connectivity of the electricity sector remained without any large changes during the take-off phase. In the expert interviews, central actors in the sector clarified that the rising share of decentral production sites based on renewables was greatly absorbed by the buffering capacity of the grid. In the heat sector, the installation of biomass heat and CHP plants—which are embedded in district heating networks—began to rise. Correspondingly, grid-based heat technology became more and more relevant in the region. As a consequence, rising path-lengths, decreasing centrality and increasing modularity can be observed, as insular heating solutions (mainly based on firing oil) are being replaced by biomass-fired district heating solutions. Overall, the level of connectivity of the technical subsystem can be situated at low to medium levels.
4.3. Acceleration Phase (2001–2011)
4.3.1. Social Subsystem
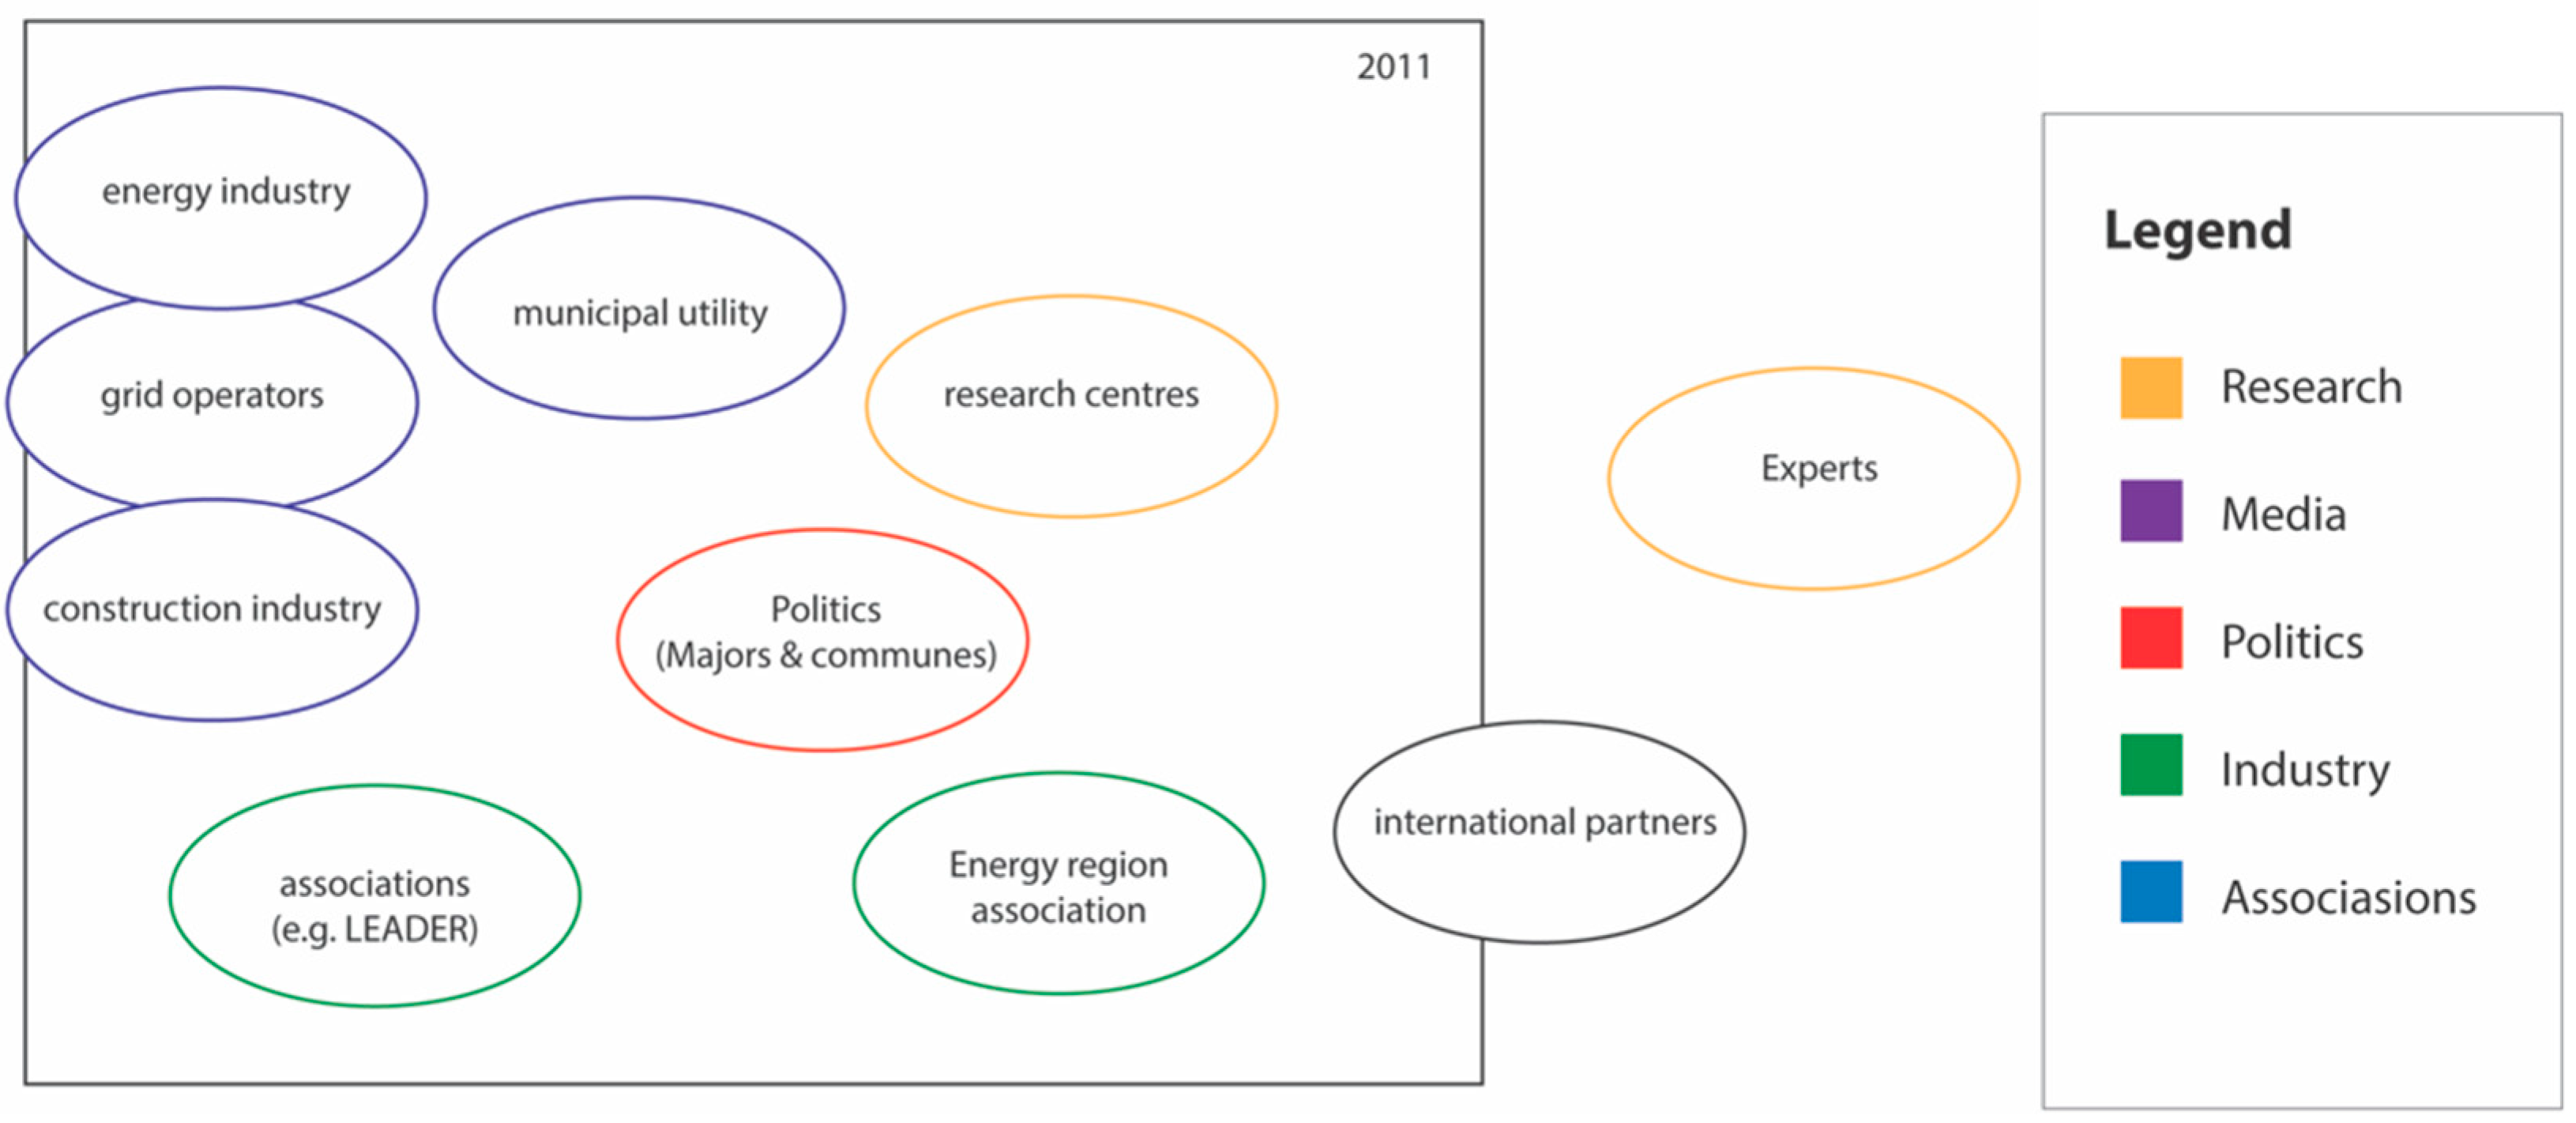
Diversity: In the social subsystem, variety and disparity decreased slightly, since media was no longer mentioned as important arena for the social subsystem. The balance decreased as well: The number of actors in the politics and association arena increased slightly but in the industry arena many new actors were mentioned—especially distribution grid operators and regional utilities and larger production firms which were located in the region. Thus, the industry sector was perceived as dominating the social subsystem. Nevertheless, there were some qualitative changes in the other arenas: in politics, the other municipalities were perceived as becoming more active, in the association arena the foundation of the LEADER region association was an important factor to generate money and networks beyond the region. Additionally, there was the foundation of a new research centre which also attracted partners from outside the region. The overall diversity remained at medium to high levels as the social subsystem was perceived as fast moving and very dedicated to the progress of the transition.
Connectivity: The trend of the increasing path length continued, since more actors were involved, which only had bilateral contact to particular actors from the core network (e.g., industry actors to politicians, research actors or the LEADER group). Nevertheless, the core network from the predevelopment phase remained closely linked (
Figure 3). And although the industry arena was still perceived to be dominating and central, with the LEADER group, the association arena became again more central in linking actors from politics to research and industry. Thus, the centrality can be considered as medium. The modularity increased to a medium level, since several collaborations among the arenas where established around projects like the planning and implementation of new district heating areas, new housing areas or the representation of the region at the national exhibition. The overall connectivity in the social subsystem can thus be situated at a medium level.
4.3.2. Technical Subsystem
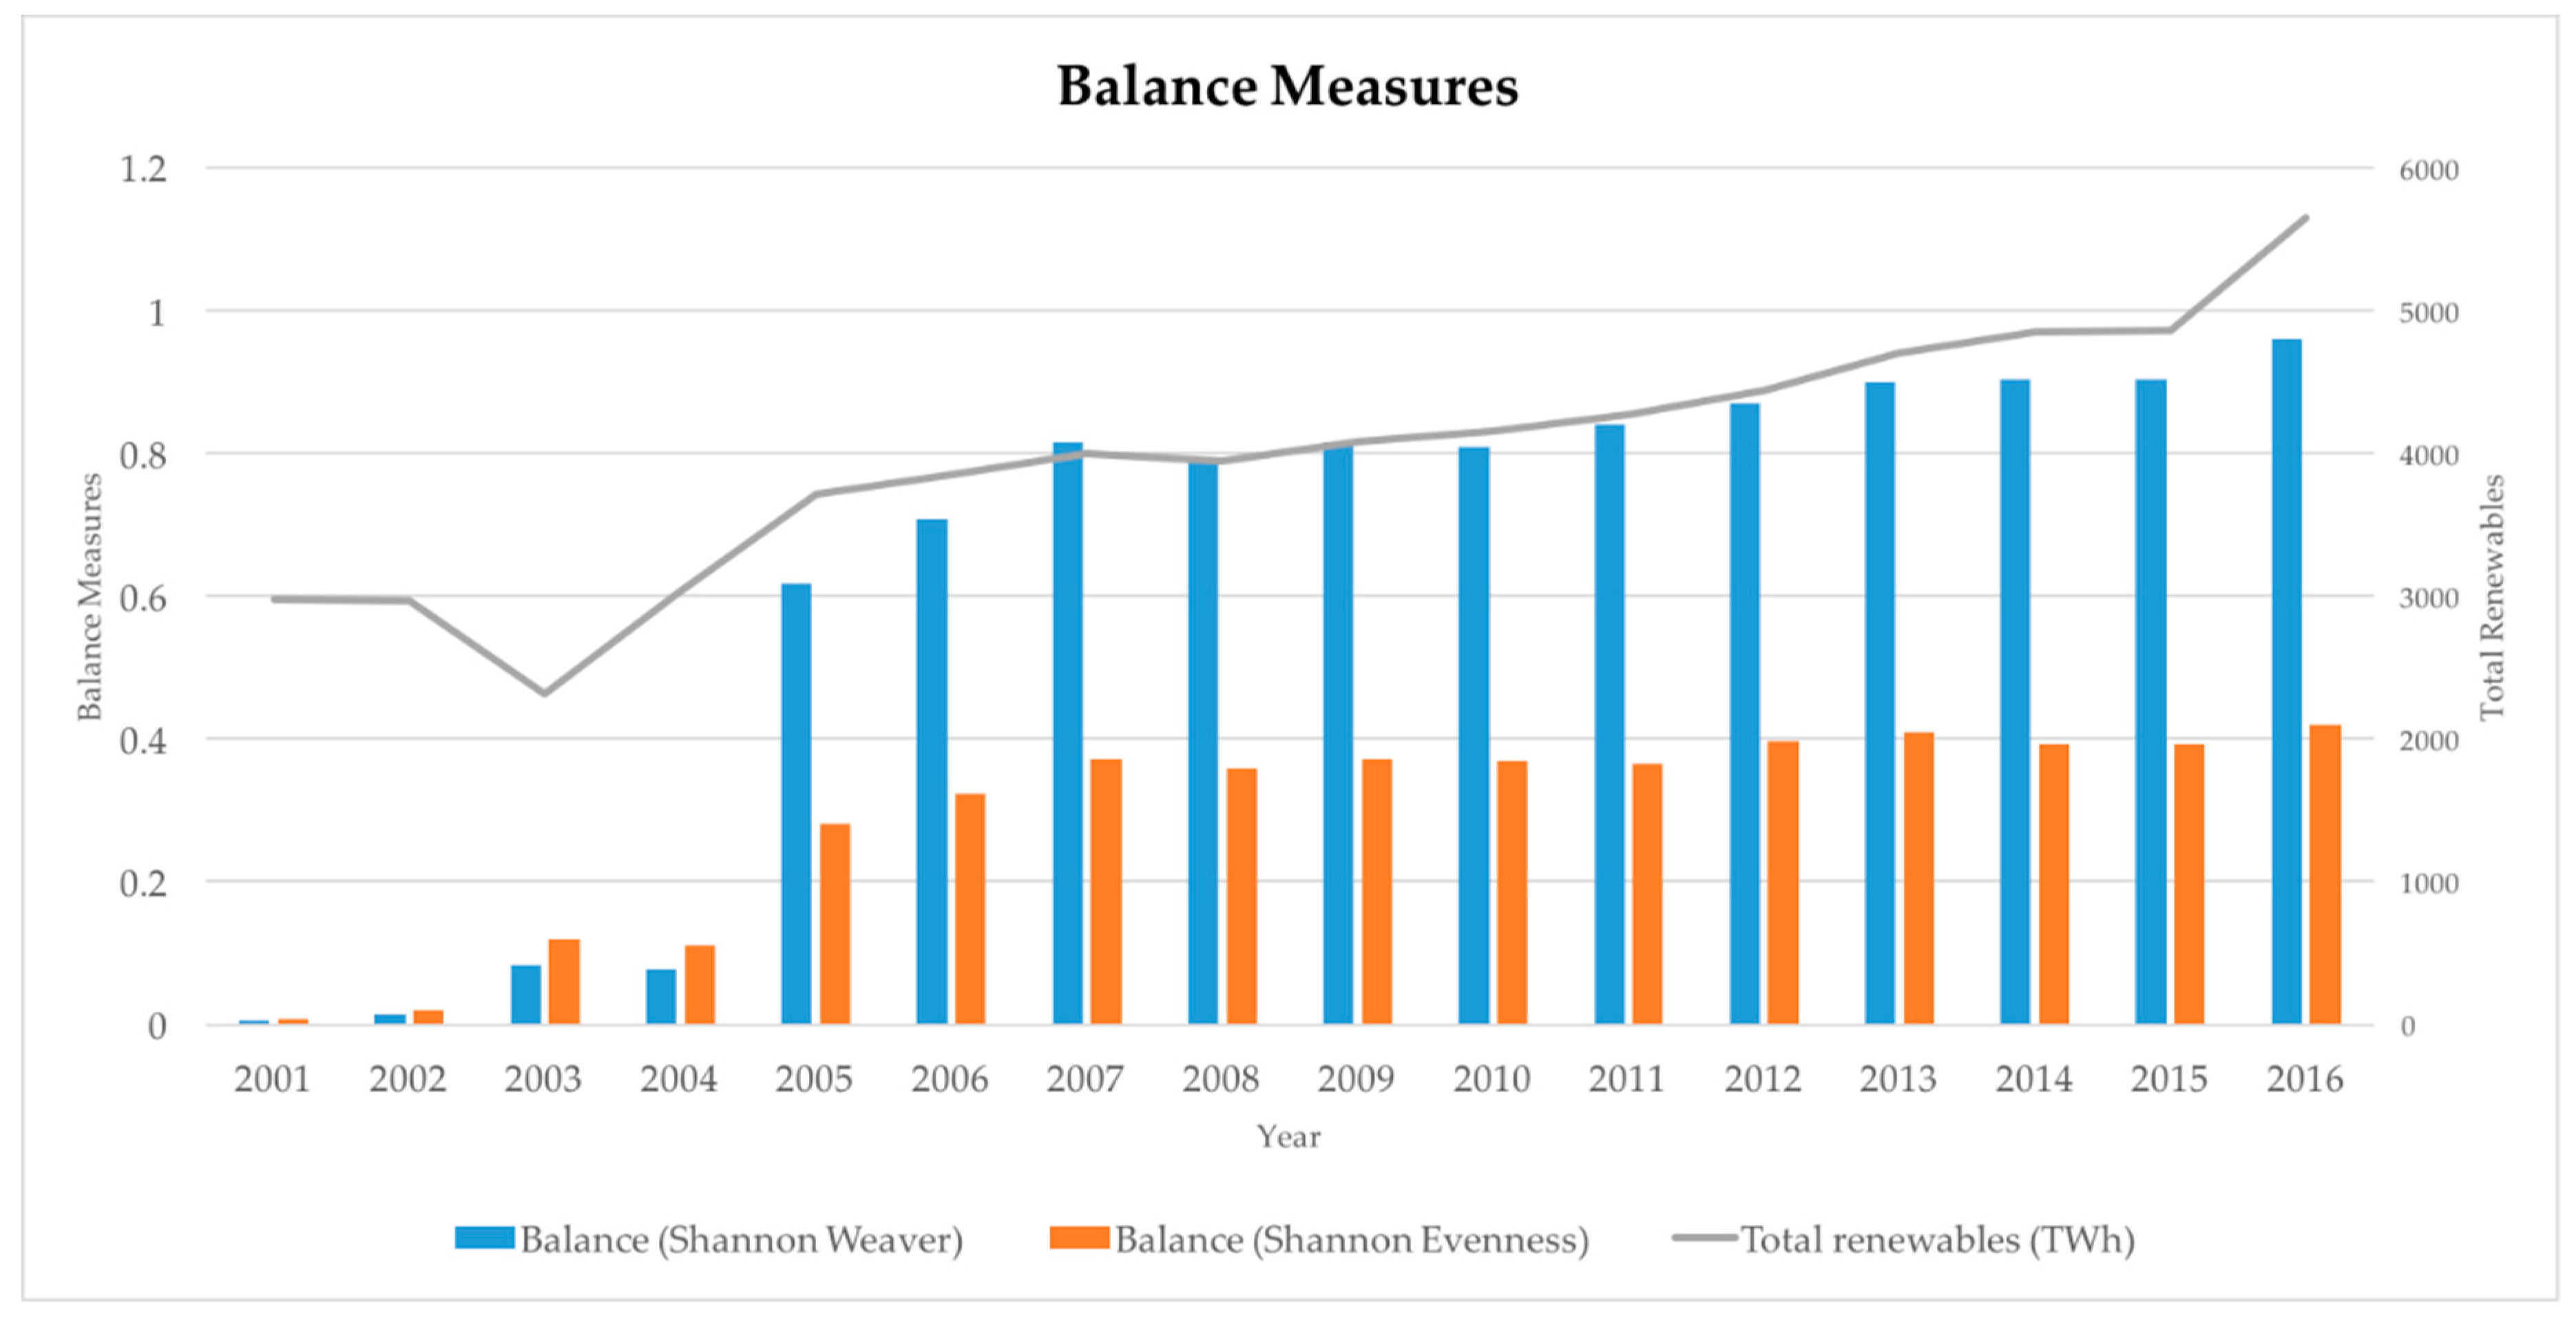
Diversity: During the years 2001–2011, we can observe a rapid increase in the electricity produced by renewables. A high range of technologies was deployed in the region, ranging from photovoltaic, electricity out of geothermal power production all the way to waste related technologies. The total amount of electricity produced in Styria from renewable energy sources increased from 2978 TWh/year in 2001 to 4264 TWh in 2011. The variety increased to 9 distinct technologies. The Shannon Weaver index, which describes the balance by including the variety measures in the calculation, surged from 0.01 up to 0.8 during that period. However, the Shannon Eveness index, increased only up to 0.35 (see
Figure 4). Furthermore, also the disparity increased as very different energy technology groups were included in the production of electricity and heat. Overall diversity attained high levels.
Connectivity: There were no substantial changes in the electricity grid, however, the experts mentioned in the interviews that the regional grid operators began to mesh the grid on the medium voltage levels from around 2006 onwards, which means that they added additional non-linear connections which allow to supply a consumption unit through several distribution entities. With this development, the overall path length rose, the centrality decreased and the modularity remained low, since there was no specific opportunity to form modules in the grid. In the heat sector, the installation of biomass heat plants and CHP plants in district heating networks continued, so that the connectivity in the heat sector increased slightly. Overall, the connectivity of the technical system rose to medium levels.
4.4. Stabilisation (2011–2016)
4.4.1. Social Subsystem
Diversity: The variety remained unchanged in comparison to the previous phase, so does the balance. The industry and the politics arena also remain the two arenas which together comprise the most actors. The disparity of the arenas is constantly high. In the industry arena, new entrants were mentioned in the area of mobility. In the association arena, the merger of the energy region and the tourism region association were perceived as major changes to the composition of the governance system. Additionally, it is interesting to see that the disparity within the industry sector is higher than in any other arena. The arena is not only built up of utilities, operators of the energy distribution systems (DSOs) or electrical engineering firms but also includes regional construction firms, large production firms as well as actors in the tourism sector, which are present in the region and engaged with energy transition issues. The overall diversity remained medium to high.
Connectivity: The average path length remained medium. The densely connected core network of actors remained in place. So were some more loose connections to more peripheral actors, especially those located in industry. The centrality of actors from the politics and industry arena remained high, whereas the perceived centrality of the energy region association declined. Regarding modularity, most of the modules were built around projects and therewith characterized by a clearly defined timeline. New modules were only mentioned around mobility projects. However, some interviewees criticised that the members of the initial actor network remained closely linked with one another while connections to other actors—especially from industry—were rare and remained loose. Moreover, the interviewed actors noted critically that the links to the broader society and especially to non-energy related interest groups in the region, were underdeveloped, so that the main core of actors in the social subsystem were perceived to represent almost a module for themselves. Overall, connectivity in the social subsystem remained at medium levels.
4.4.2. Technical Subsystem
Diversity: The total share of renewables in electricity production reached 52.1% in 2016 (Statistics Austria)
: As shown in
Figure 4, after 2011 the total amount of electricity produced from renewables stayed almost constant. The variety in technology groups increased by 1 to 10. While the Shannon Eveness index remained almost constant, the Shannon weaver index increased slightly as one more technology contributed to the overall renewable share.
Table 5 provides an overview over the disparity of the five most important technology groups employed in the region in 2016 (all data refers to the year 2016). Overall diversity of the technical subsystem is high.
Connectivity: There was no major change in the electricity grid from the acceleration to the stabilization phase, with overall connectivity stabilizing at medium levels. The experts mentioned that meshing was considered as an ongoing maintenance task, which further decreased the centrality and increased the path-length. However, the experts stressed that if the legal framework would allow to build regional modules which could partly be uncoupled from the grid while connecting the regional production and consumption units directly, there might be a major change in electricity grid. This would cause rising path lengths and rising modularity while the centrality would decrease and result in a medium connectivity. In addition, the experts evaluated the technical development of power-to-gas/heat/cold/fuel as an important factor to rise the connectivity. Thus, there would be the possibility to use the gas net, extend it and connect other production technologies to it. Moreover, it would allow for regional storage—especially in combination with battery storage—which leads to a higher potential for modularity. For the time being, connectivity measures remained at medium levels.
4.5. Overview of the Results
When summing up the development in both the social and technical subsystems, the following levels of diversity and connectivity can be reported at the current stage of the transition:
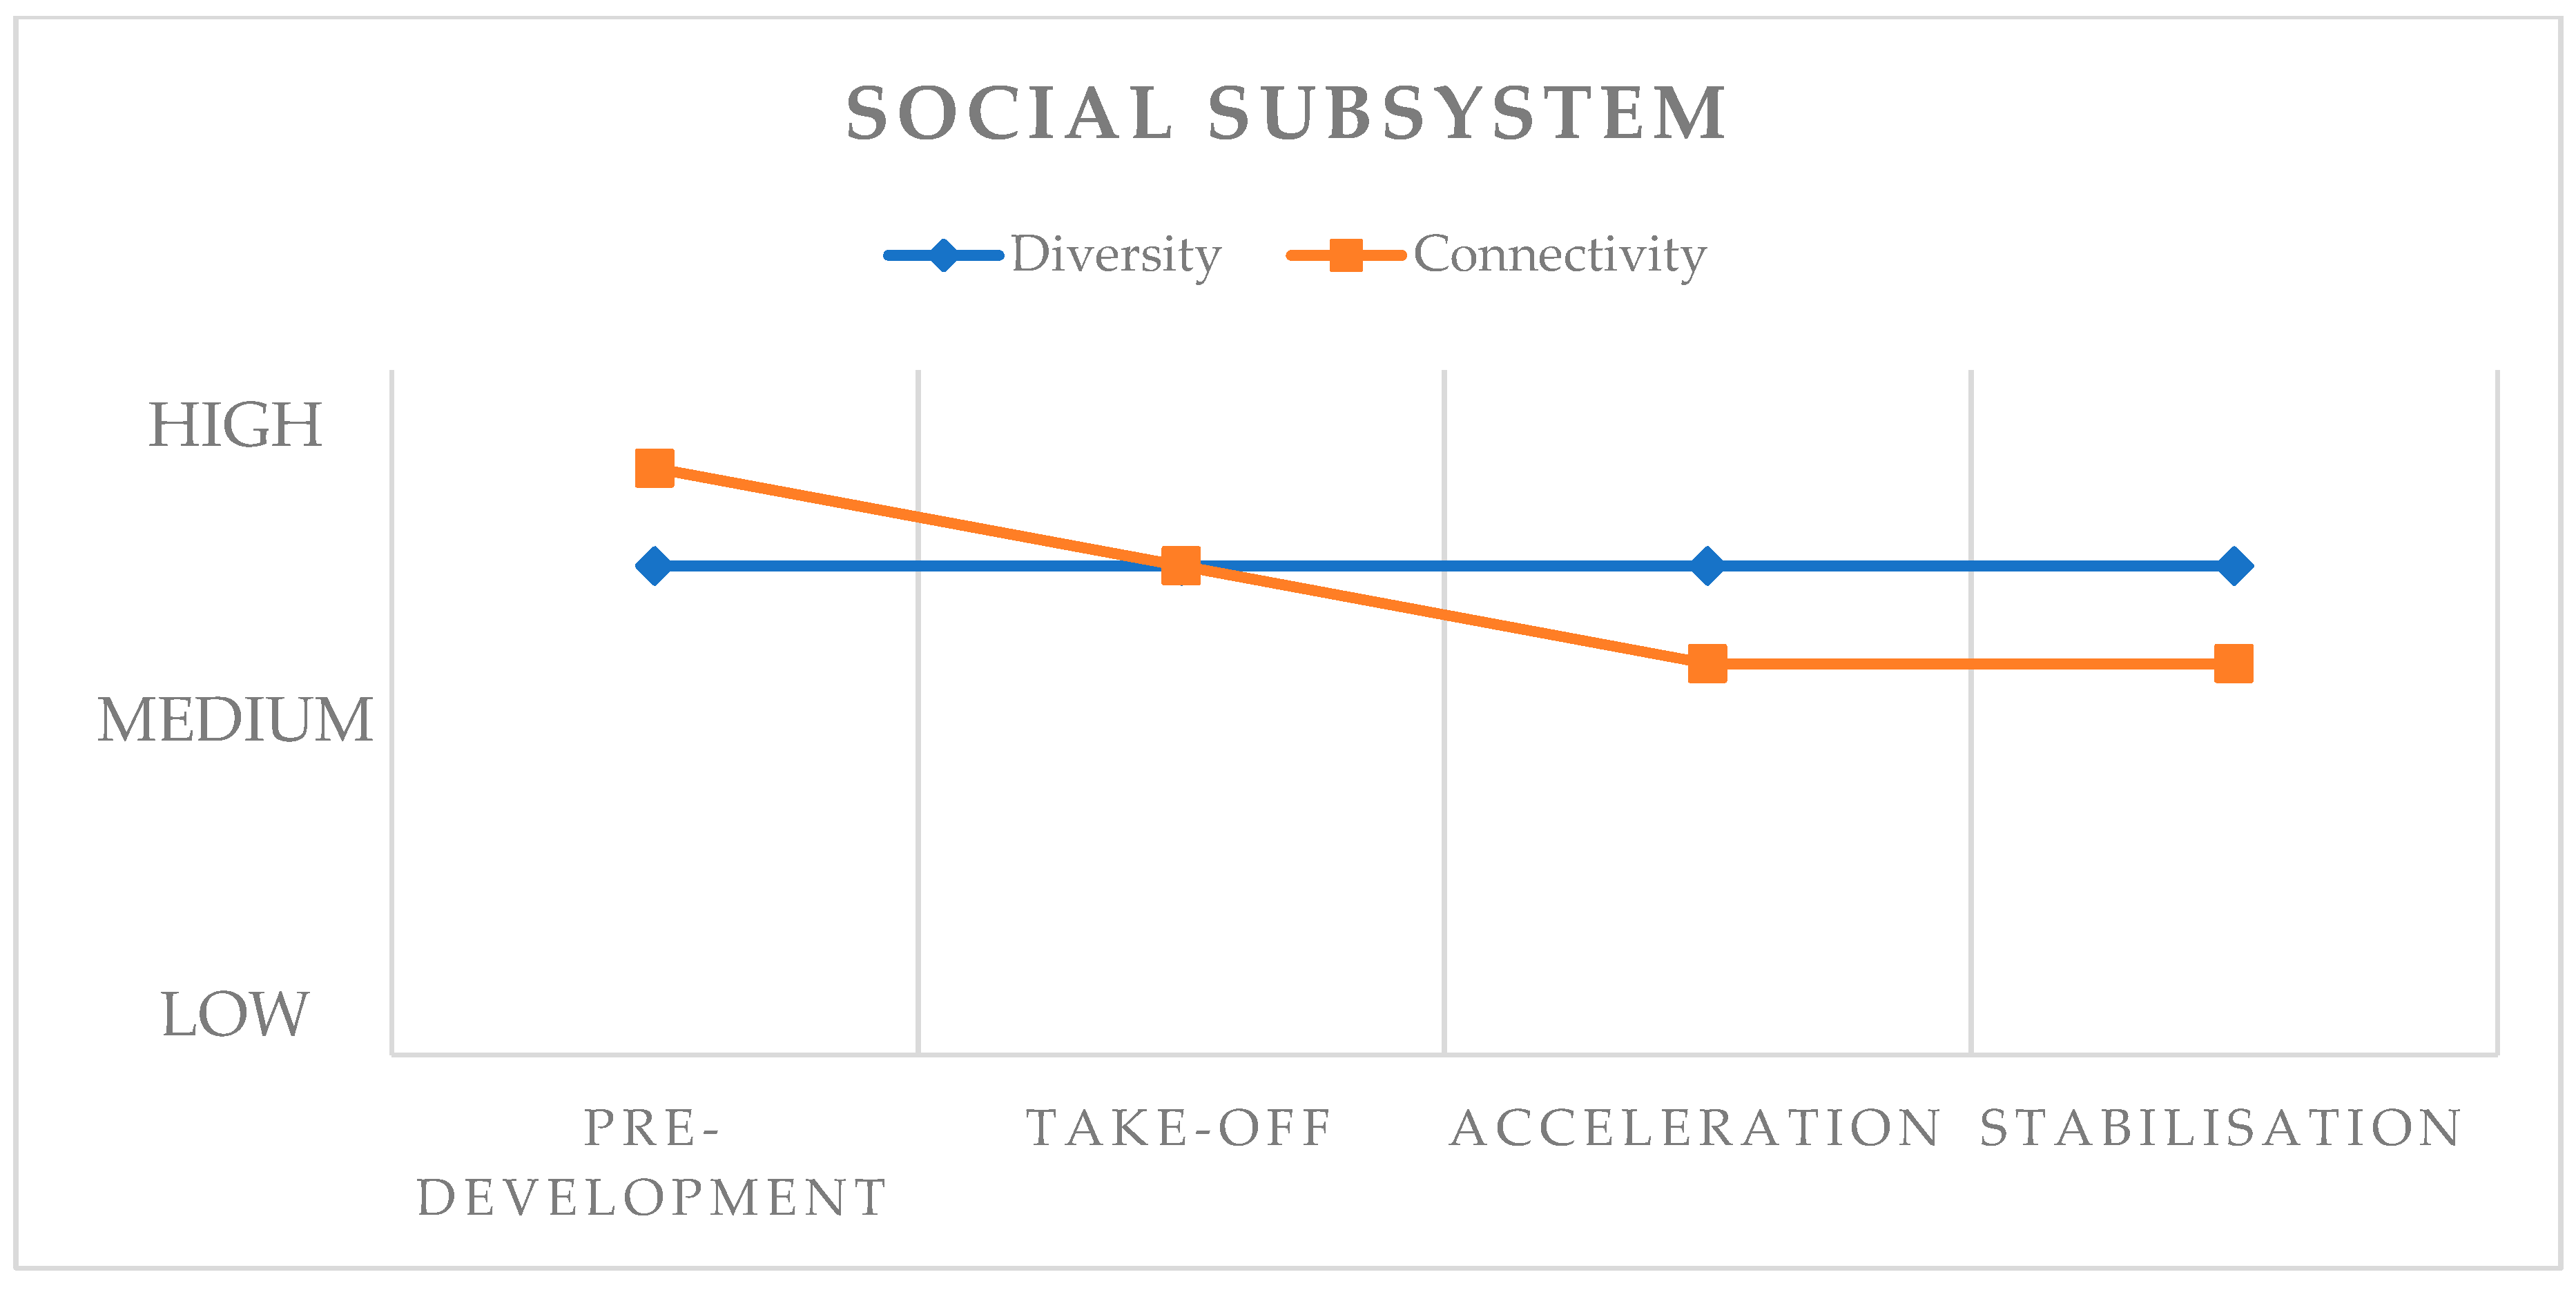
Diversity in the social subsystem: the diversity in the social subsystem of EWG evolved from being very high, to medium levels. While variety and disparity remained at medium and high levels throughout the transition processes, respectively, measures for balance went from high at the beginning of the transition to low towards the stabilization phase.
Connectivity in the social subsystem: with regard to connectivity, the social subsystem of EWG went from being highly centralized and loosely linked to being of medium centralization, long(er) path-ways between the actors and higher modularity within the network as actors from new arenas engaged in the transition and new actors joined the different arenas.
Figure 5 gives an overview of the development of the diversity and connectivity measures in the social subsystem along the transition pathway.
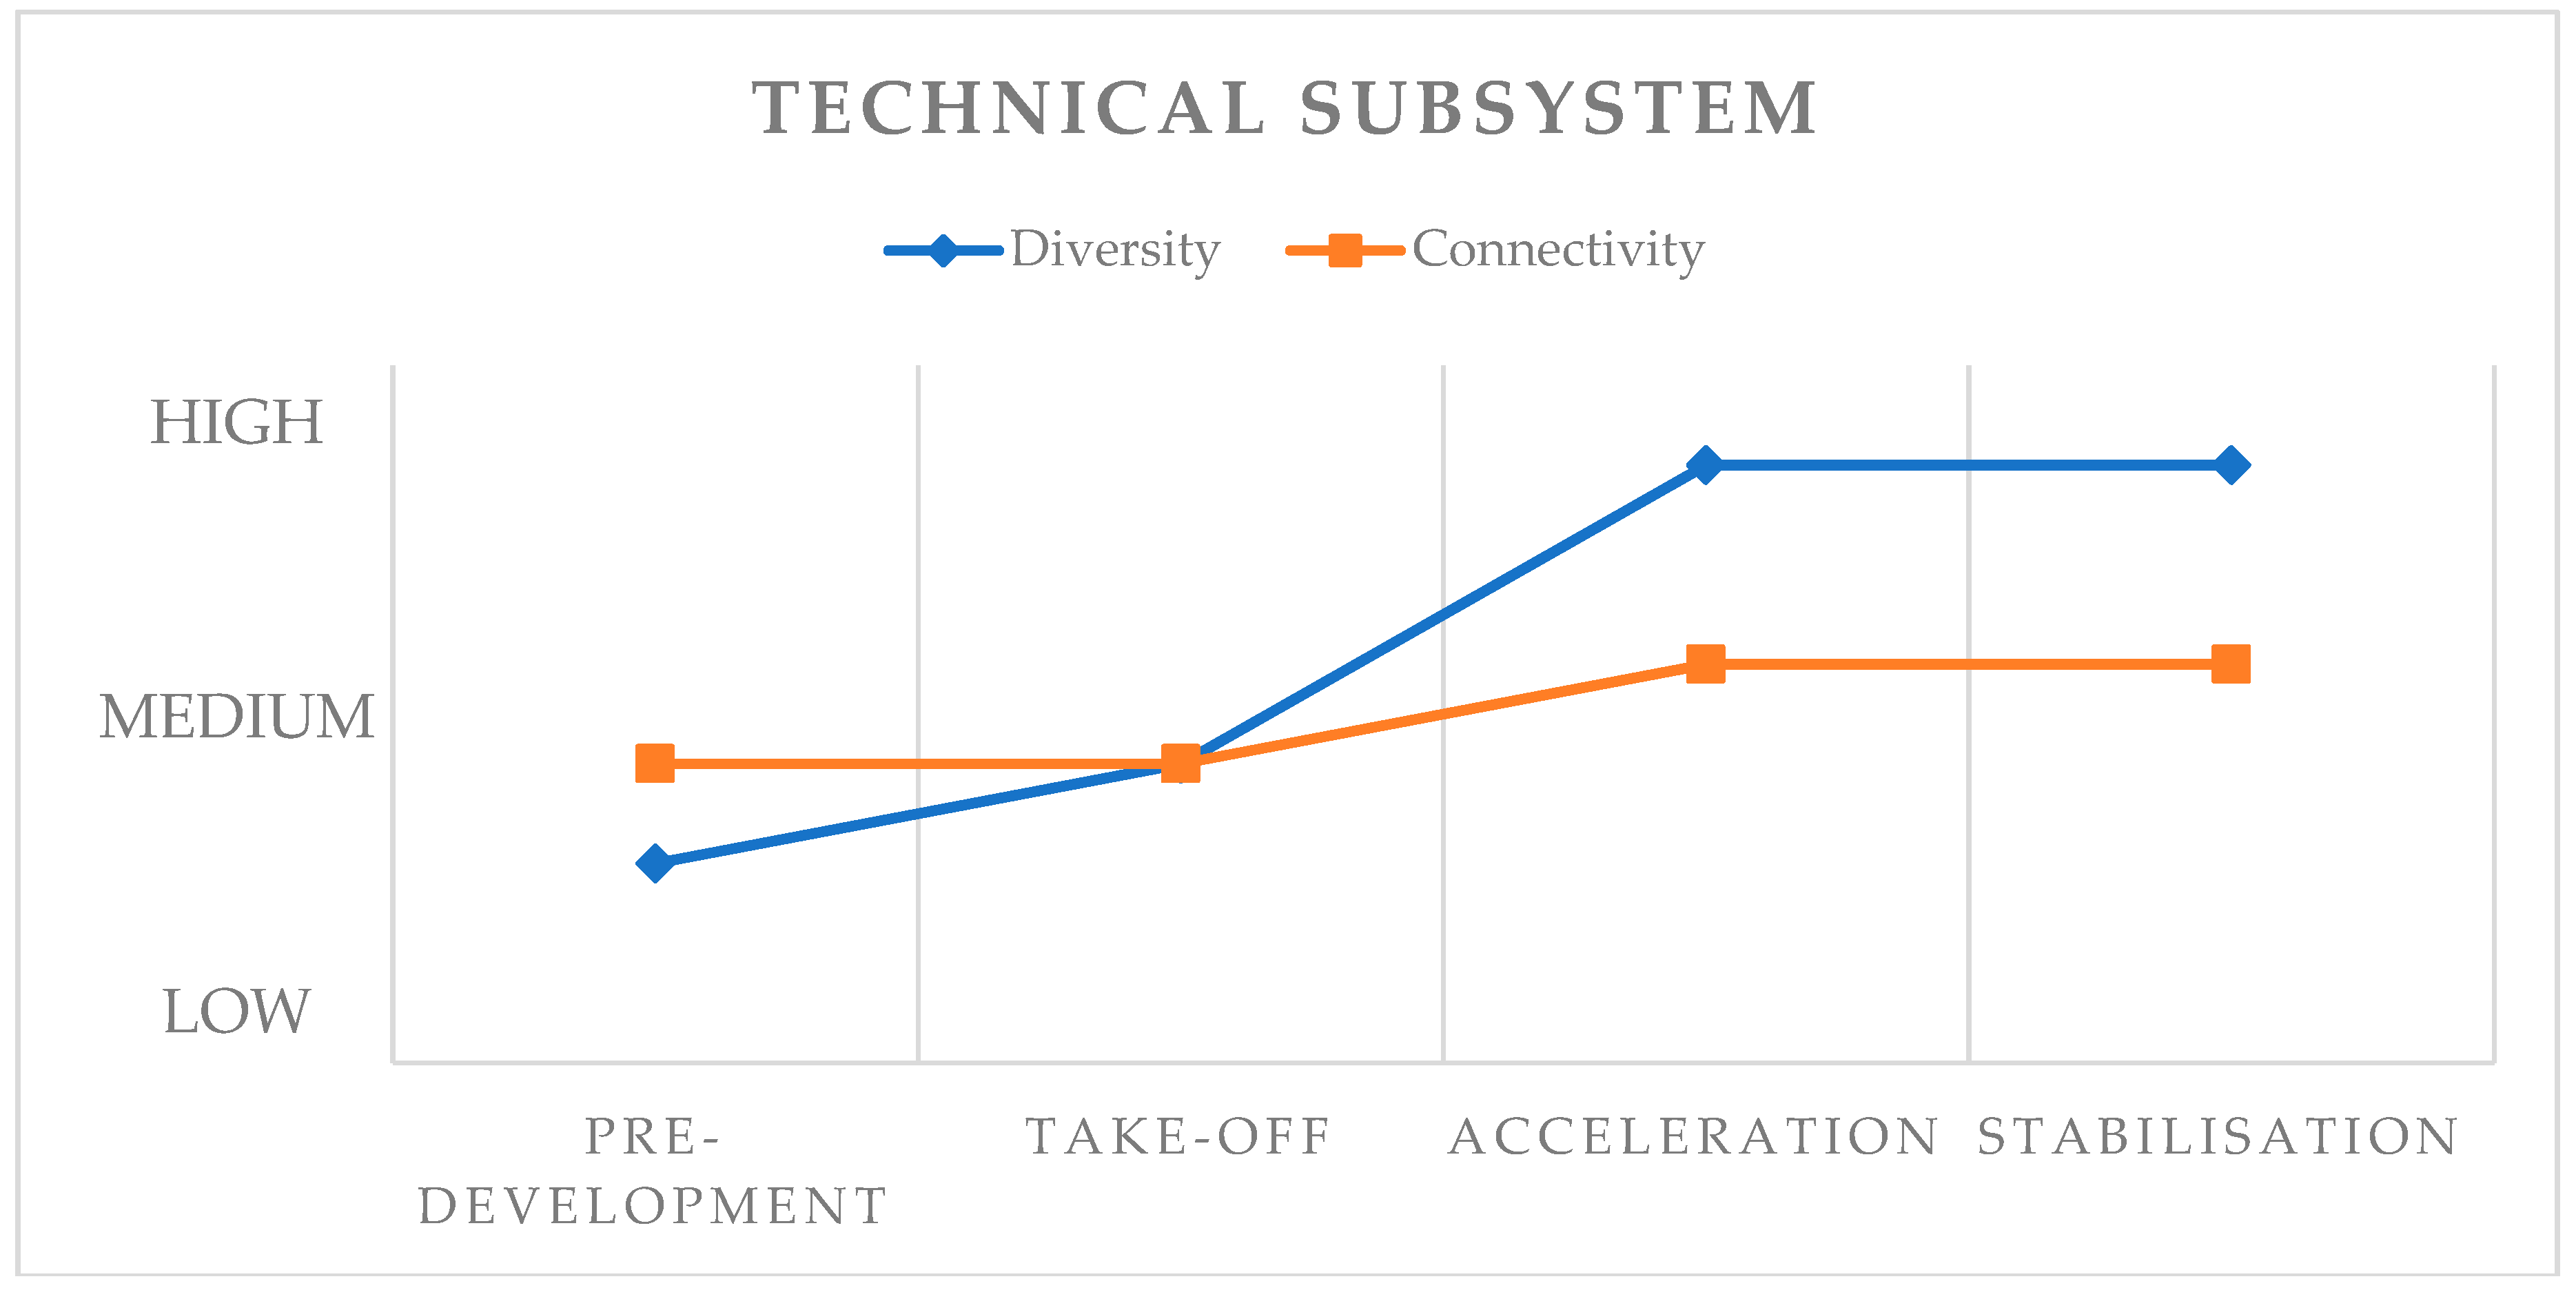
Diversity in the technical subsystem: the diversity in the technical subsystem in EWG went from being dominated by one technology (hydropower) to showing a big diversity when it comes to the renewable energy technology employed in the region. While balance was low and disparity high at the beginning of the transition (take-off phase), as the transition process advanced, both stabilized at medium to high levels.
Connectivity in the technical subsystem: the connectivity in the technical subsystem of EWG was characterized by high centralization and high average path-lengths (in the sense of transmission distances between production and consumption) at the beginning of the transition, with no modularity built in the system. As the transition proceeded, average path-lengths remained at a high level, whereas the centralization of the system was undermined by meshing activities and the emergence of prosumer structures. Modularity stabilized at low levels.
Figure 6 gives an overview of the development of the diversity and connectivity measures in the technical subsystem along the transition pathway.
5. Discussion
In this paper, we have taken up the indicator-set proposed by [
1] and applied these indicators to the EWG region in Austria for the 1990–2016 period, which represents the timespan from the very first initiatives towards renewable energy production in the region, to a situation of stabilisation and can be seen as potentially being a temporally intermediate state before the next push towards higher shares in renewables in the future (2016 being the last year with reliable data).
In Reference [
1] four ideal-typical situations were derived from a theoretical point of view, combining extreme values in terms of diversity and connectivity in the both the social and technical subsystems. A situation with both high diversity and high connectivity was seen to be beneficial for the progress of an (energy) transition with regard to both the support for the transition in the social sphere and the embedding of new technologies into the current technical energy system. Mixed constellations with high diversity/low connectivity and low diversity/high connectivity, respectively, were associated with incomplete transition processes, where two scenarios are likely:
High diversity, low connectivity: intermediate state of a transition.
Low diversity, high connectivity: situation of lock-in, where the lack of integration of central arenas leads to a blocking of the transition.
Finally, a situation with low diversity and low connectivity is likely to lead to technical, economic and social governance inefficiencies and is associated with a failing transition.
If we look at the development of the diversity and connectivity indicators over time in the EWG region, we find that the development in the social and technical subsystems have been running in the opposite direction. While connectivity and diversity have been high in the social subsystem at the beginning of the transition process, equivalent to high resilience following [
1], connectivity and diversity were low in the technical subsystem, undermining the resilience of the technical subsystem. In other words, while actors from very divers social arenas collaborated intensely at the beginning of the transition process, the technical system was not yet in a state that would have allowed the system to withstand major external shocks, for example in terms of declining prices for renewable energy. Over the course of time, with more people engaged in the energy transitions and the core of idealistic pioneers cutting back on their engagement, diversity and connectivity of the social subsystem decreased. Concomitantly, diversity and connectivity in the technical system increased substantially over the years, with a high potential for a further substantial increase of system connectivity with changing regulations under way, that would allow for regional prosumer networks in the electricity system to form.
The current system state can be seen to be at an intermediate state, close to situation sketched out as case C in Reference [
1], with a system-state characterised by medium to high diversity and medium connectivity levels in both the social and the technical subsystem. Such a system configuration provides an optimal starting-point for a further development towards a fully renewable energy system due to the high diversity of production technologies and actors from various social arenas involved in the transition. At the same time, the sub-optimal connectivity, both with regard to the integration of big industrial players on the social side as well as the (partially) underdeveloped connectivity on the technical side, raises questions whether or not a full transition of the system can be achieved. On the social side, big industry players should be actively approached by local actors to contribute to the energy transition and collaborate more intensely by for example by actively engaging in the further development of local district heating systems which could be fed with excess heat from industrial processes and water treatment. On the technical side, the medium level of connectivity is mainly due to lagging development of district heating infrastructure, on the one side and a ban on captive prosumer communities from a regulatory perspective, on the other side. This could be overcome with appropriate policy adjustments.
References [
67,
68] present results for a similar region in Germany, based on a comparable theoretical framework and applying the same set of indicators proposed by [
1]. The Allgäu region investigated in these two studies is characterized by high diversity and medium connectivity levels, both in the social and the technical subsystems. While connectivity and diversity were measured only for one specific moment in time, the analysis of supplementary interview data was—just as in EWG—a major source of information and indispensable in order to understand the drivers and rationales behind the transition process. In the Allgäu we observed that the progress of the transition came more or less to a halt after a very dynamic period from 1990–2010, due to both political decisions on the state level and an unattractive market environment with falling prices for (renewable) energy. Interview partners pointed to the fact that an increase in connectivity within the social subsystem, involving additional actors, for example, from the tourism sector and adding complementary management organisations (e.g., in other cities), would help broaden the support for energy transition issues in the region. Additionally, the analysis showed that to achieve higher levels of resilience, the connectivity of the technological subsystem should be enhanced for example by network and technology convergence (power-to-heat) or the development of regional storage capacities.
In line with the situation in EWG, the resilience of the energy transition in the Allgäu region can be seen as being rather high but being fundamentally challenged by the broader political system it is embedded in. While the support for energy transition processes remains high in Austria on all government levels, the decision taken by the state government in Bavaria has had substantial repercussions for the implementation of specific measures and especially for the further development of wind power, in the region.
Overall, the application of the indicator set developed in Reference [
1] can help provide policy-makers with indications how the system in transition is set up, what main factors in both the social and technical subsystem affect the resilience of the system in a positive or negative way and which potential problems (e.g., due to lock-in and path-dependencies) have to be tackled in order to strengthen the resilience of the system. However, one has to consider that indicators can only depict a part of the system and that for interpreting them the whole system should be taken into account. Thus, the context and boundary conditions might significantly affect the development of the transition of an energy system even though the diversity and connectivity indicators are similar. In addition to these refinements, we propose to integrate redundancy measures in the specification of overall resilience, following, that is, [
28]. Redundancy measures allow to complement the diversity measures by adding a functional perspective, that is, the possibility of an actor, or a technology group, to take over the function of another entity.
Table 6 provides an overview and summarizes the core insights from the analysis and reflection of the results with regard to the social and the technical subsystem in EWG.
Limitations and Further Research
In the present study, we could show the development of the regional energy system over time and reflect on its resilience. Nevertheless, data availability and diverging quality of data remains one major limitation in the context of this study. For the technical subsystem, we could only get reliable data for the electricity system on the state level but not on the regional level, since the states are still the administrative units in the technical subsystem, which collect all the relevant data. Regarding the data for connectivity in the technical subsystem, grid data was only available on the national scale and only for the most recent years. Hence, a longitudinal investigation based on primary data was not possible and we had to resort to expert knowledge from the interviews.
Unlike for the technical subsystem, the region was a straight-forward unit of analysis for data collection regarding the social subsystem. Accordingly, we could grasp a good understanding of the transition in the social subsystem using different qualitative research methods. Nevertheless, a more quantified and comprehensive analysis (e.g., conducting a full sample network analysis in combination with a structured media analysis) would allow for an even deeper understanding of the evolution of interaction patterns between social agents. In addition, decision-making processes at supra-regional level could be taken into account in order to get supplementary information on the further (financial) support of the transition process towards a fully renewable regional energy system.
While previous work suggests that both the diversity and connectivity of a system can change and has to change over time, allowing for the system to adapt to external changes, there is up to now no established literature on what levels of both diversity and connectivity are ideal in order to maximize the resilience of the system throughout the transition.
In other words, while the ideal-typical levels of diversity and connectivity described in the four cases in Reference [
1] apply in general, they might not apply to every moment along the transition pathway, with strong levels of diversity and connectivity potentially leading to a strong degree of stabilization of the system that is not desirable, for example, in the take-off and acceleration phase.
Further empirical research will have to inform the resilience community when high and low levels of diversity and connectivity, respectively, are desirable in the social and the technical subsystems along the transition to a fully renewable regional energy system.
Regarding the individual indicators and the calculations we could carry out, a notable difference could be detected between the Shannon weaver and Shannon evenness indicator. A sensitivity analysis showed that the Shannon weaver index is highly sensitive to how the technologies are defined. If we instead of explicitly using the technology groups suggested in the results section use other secondary electricity sources (e.g., waste, leaching liquid, incineration) as one additional technology group in our calculations, the Shannon Weaver index decreases from 0.96 to 0.79 in the year 2016. The Shannon Eveness index, however is much more robust regarding the technology definition, the effect being however reverse. Here the index increased from 0.39 in to 0.46. Thus, in future studies the balance indicator needs to be selected carefully, depending on the interest of the study and the results need to be reflected accordingly.
6. Conclusions
In this paper, we have applied the indicator set developed in Reference [
1] to the EWG region in south-eastern Austria. The empirical application of the theoretically derived indicators allows to measure the resilience of a socio-technological transition, in this case the transition of the regional energy sector towards a system based on renewable energy sources. The six indicators allow to operationalize the key resilience aspects which are diversity and connectivity in both the social and the technical subsystems.
The region shows medium to high levels of diversity and medium levels of connectivity in the social and technical subsystems. This corresponds to a situation where the transition towards renewable energy sources is well underway but the structure of both the social and technical subsystems might not be fully appropriate (yet) to drive the system towards a fully renewable system state.
In practice, the approach proposed by Binder and colleagues in Reference [
1] provides a solid basis for the analysis of the energy transition in EWG. The measures for diversity and connectivity could be successfully applied to both the technical and the social subsystems and allowed to retrace the system’s composition along the transition path-way. Some difficulties occurred in getting all the required data on a regional level, which was especially the case for some of the indicators in the technical subsystem. Based on our empirical work in the EWG region, an indicator-based approach to measure the resilience of a sustainability transition is a promising and important tool for future policy planning when the goal is to work on a shift of an existing (unsustainable) system status to a more sustainable one in the energy context.
For a further refinement of the indicators, especially with respect to the technical subsystem, we propose integrating redundancy measures. Further research would need to specifically take this factor into account, since the characteristic of diverse actor-groups or technologies being able to functionally supplement each other may become relevant for the resilience of the overall system in times of crises of shocks. Redundancy measures would ideally complement diversity measures by taking into account not only the characteristics but also the functionality of the system components in both the technical and the social subsystems.
Finally, for further investigation of the resilience of socio-technical systems in transition, it would be important to have a closer look at the key-actors’ characteristics and abilities which allow for the transition to proceed while supporting the system’s resilience at the same time. This would apply for the individual actor level but also for the organisation level and could lead to a reflection on which roles to attribute to which actors in the different arenas but also at the different phases of the transition to ensure the resilience of the system undergoing the transition.


