Article

Integrated Control for Small Power Wind Generator

Sorbonne University, Université de Technologie de Compiègne, EA 7284 AVENUES, Centre Pierre Guillaumat CS 60319, 60203 Compiègne CEDEX, France
*
Author to whom correspondence should be addressed.
Energies 2018, 11(5), 1217; https://doi.org/10.3390/en11051217
Submission received: 20 March 2018 / Revised: 19 April 2018 / Accepted: 8 May 2018 / Published: 10 May 2018

Abstract

:
The control strategies of the small power wind generator are usually divided into the maximum power point tracking (MPPT) case, which requires the wind generator produce power as much as possible, and the power limited control (PLC) case that demands the wind generator produce a power level following the load requirement. Integration of these two operating cases responding to flexible and sophisticated power demands is the main topic of this article. A small power wind generator including the sluggish mechanical dynamic phenomenon, which uses the permanent magnet synchronous generator, is introduced to validate different control methods integrating MPPT and PLC cases and based on hysteresis control. It is a matter of an indirect power control method derived from three direct methods following perturb and observe principle as well as from a look-up table. To analyze and compare the proposed power control methods, which are implemented into an emulator of a small power wind generator, a power demand profile is used. This profile is randomly generated based on measured rapid wind velocity data. Analyzing experimental results, from the power viewpoint, all proposed methods reveal steady-state error with big amount of peak resulting from the nature of perturb and observe.

1. Introduction

After decades of development, the concern level about wind power research and application is still escalating. Being a clean and renewable energy resource, the wind power generator system extracts kinetic energy transforming into electrical form. While the wind energy source is apposite to provide the utility grid, small power wind systems can be used mostly as local distributed energy sources or one part of a microgrid since it is easy to be implemented and maintained. The scale of small power is defined by the power production level. In the United States of America, the wind energy system products lower than 100 kW are named small power wind systems; but, the criterion in Europe is 50 kW [1,2]. Due to its small size and light weight as well as its advances in aspects of reliability, energy density, and efficiency, the most used small power wind generator is the permanent magnet synchronous machine (PMSM) [3,4].
The small power wind energy system usually operates at maximum power point tracking (MPPT) case when wind velocity is lower than rated wind velocity; and constant power output is demanded when wind velocity is over rated wind velocity. However, being the local distributed energy source or a part of microgrid, the small scale wind energy system can also be required for the power limited control (PLC) case, at the range lower than rated wind velocity. Consequently, a general control strategy which could deal with both MPPT and PLC cases is necessary to be implemented.
As discussed and presented in [5], the wind kinetic energy is converted into DC electrical energy by means of three possible solutions: the passive electrical structure using a three-phase diode bridge; the active structure using a controllable AC–DC converter; or the active structure using a controllable DC–DC converter with the three-phase diode bridge. Considering the energy conversion efficiency the tendency to decrease the financial cost, the active structure using DC–DC converter presented in [5] was selected in this paper.
Several approaches for MPPT [3,4,5,6,7,8,9,10,11] and PLC [12,13,14,15,16] have been accomplished. Briefly, MPPT algorithms can be sorted into indirect and direct methods as summarized in [3,4]. The former type, indirect methods, indicates that the method relies on a precise mathematical model of the studied system. In [6], the ratio between the electrical output power and the value of DC voltage cube and the ratio between the DC current and the value of the DC voltage square are regarded as constant for all maximum power operating points. Based on these references, the DC voltage is controlled by a proportional-integral (PI) controller with a DC–AC converter at the grid side, while the rotational speed is controlled by another PI controller with an AC–DC converter at the generator side. In [7], the authors used the power coefficient ( C p ) to make a lookup table to supply the reference of the mechanical rotational speed for different wind velocities. Also, this paper used electrical variables three-phase voltages estimating the rotational speed to avoid the usage of mechanical sensors. Both of these two indirect MPPT methods require pre-knowledge of studied system, and are sensitive to the parameter drift, which has not been discussed in these articles. Relatively, the direct method, such as the perturb and observe (P&O) principle used in [5,8] injects operating state disturbance into the system, and based on the system response, it determines the further direction of the variation of system operating point. Different from [5], in [8] it is considered only the mechanic inertia of generator, which is just 0.016 kg·m2, thus the effect of the actually sluggish mechanic inertia of wind blades has been ignored. The direct MPPT method based on the P&O method presents more robustness and flexibility than the indirect method, since it does not require the mathematical model of the objective. However, the direct method usually asks designers with a good know-how level to make a tradeoff between response rapidity and stability. Some advanced algorithms such as the Neural Networks [9] can be used to estimate wind velocity or mechanical rotational speed and to establish a mathematical model of the system trained by a Particle Swarm Optimization method. This combination can avoid the requirement of expensive mechanical sensors and supply a highly precise model of the studied system; but the process of training the Neural Networks demands lots of preliminary work. The application of some advanced controlling techniques, such as the extended Kalman filter [10,11] also has been implemented for MPPT. Those techniques improved performances while increasing the complexity of application of those MPPT methods.
The integrated control strategy of output power also has many approaches [12,13,14,15,16]. In [12], the authors use the variable step-size P&O method, which involves a sectional defined function modifying the output current of DC–DC converter to realize MPPT and a PI controller to realize PLC. Since [12] did not demonstrate the experimental verification, neither the power level of system nor the effect of the mechanical inertia are validated. Therefore, it is hard to determine if this combination is suitable to the small scale wind generator or not. In [13], a modified P&O method is selected for MPPT regulation. However, in this paper, PLC just means the constant power output when wind velocity is over the rated value of the studied system; in addition, a double loop PI control with a voltage inner loop and a power outer loop is implemented to achieve this objective. However, the inertia, combining the generator and the emulator of wind velocity and blades, is determined as 0.03 kg·m2, which does not match the reality of real wind turbines. Thus, it means that [13] has not considered the influence of mechanical inertia which is an important factor focused on in our research. The sliding model control used in [14,15] that demands the system to meet a relatively logical relationship between the mechanical torque (being a ‘sliding surface’) and the actual electrical power, is independent of the mathematical information about the studied system. Hence, sliding model control, applied for the integrated power control, maintains strong robustness. However, similar to the P&O method, the sliding model control also just describes the movement of steady operating points of the wind generator; consequently, the dynamic process of electrical power respecting the change of mechanical torque still needs to be avoided. At the same time, the determination of parameters of sliding model control requires experienced designers. In [16], the authors selected Tip Speed Ratio (TSR) as the feedback parameter of the P&O method, and then compare the actual value of TSR with the ideal value calculated by mathematical model of studied system. Nevertheless, even it used the principle of P&O, and the method still performs with weak robustness. Different from the achievement discussed above, the research objective of the present work focused on the more general and flexible limited power demands, which can be applied in power balancing of a microgrid [5,10,11], when the microgrid may include the small scale wind generator.
This paper presents the modelling of a small power wind PMSM in order to validate the power control strategy methods with hysteresis control loop. Proposed power control methods are designed to cover MPPT and PLC operating cases. In addition, this study faces precisely the problem of the uncertainty of wind velocity and the demanded power amount from load. Therefore, regarding the robustness of the studied system, it should be considered beside the main focus which is the wind speed. One notes that, in this paper, the imposed wind reference is modeled on a real wind measurement with many variations in frequencies and amplitudes. The small power wind turbine is emulated by a test bench and several experiments are implemented to validate characteristics of all proposed methods. Finally, experimental results are given, compared, and analyzed, and strengths and weaknesses of each method are revealed together.
The article is structured as follows. Section 2 presents the small power conversion system including the analysis of characteristics. The formulation of the research problem and proposed power control methods integrating MPPT and PLC operating cases are presented in Section 3. In Section 4, the capability and effectiveness of all methods are evaluated based on a test bench. Conclusions and further studies are given in Section 5 and the final section presents a nomenclature.

2. Small Scale Wind Energy Conversion System

The study in this article concentrates on a system transforming electrical energy into DC form, allowing the output system to supply networks as follows: a DC grid, an AC grid by using an inverter, and microgrids with DC or AC bus [5,10,11]. The power conversion structure implemented for this study, shown in Figure 1 [5], comprises a three-phase diode bridge connected to a controllable DC–DC converter. Based on this combination, the optimization of energy is able to be realized by searching the maximum power operating point or limited power operating point.
Due to their simplicity and robustness in application, P&O methods are chosen to be realized and studied in this article to deal with the issue of PLC which means the wind generation system generates the power value required by loads. The test bench of the small power wind energy conversion system, based on the emulator of a small power wind turbine, is presented in this section and then the distribution of steady-state working points is displayed and used to determine the control strategy.

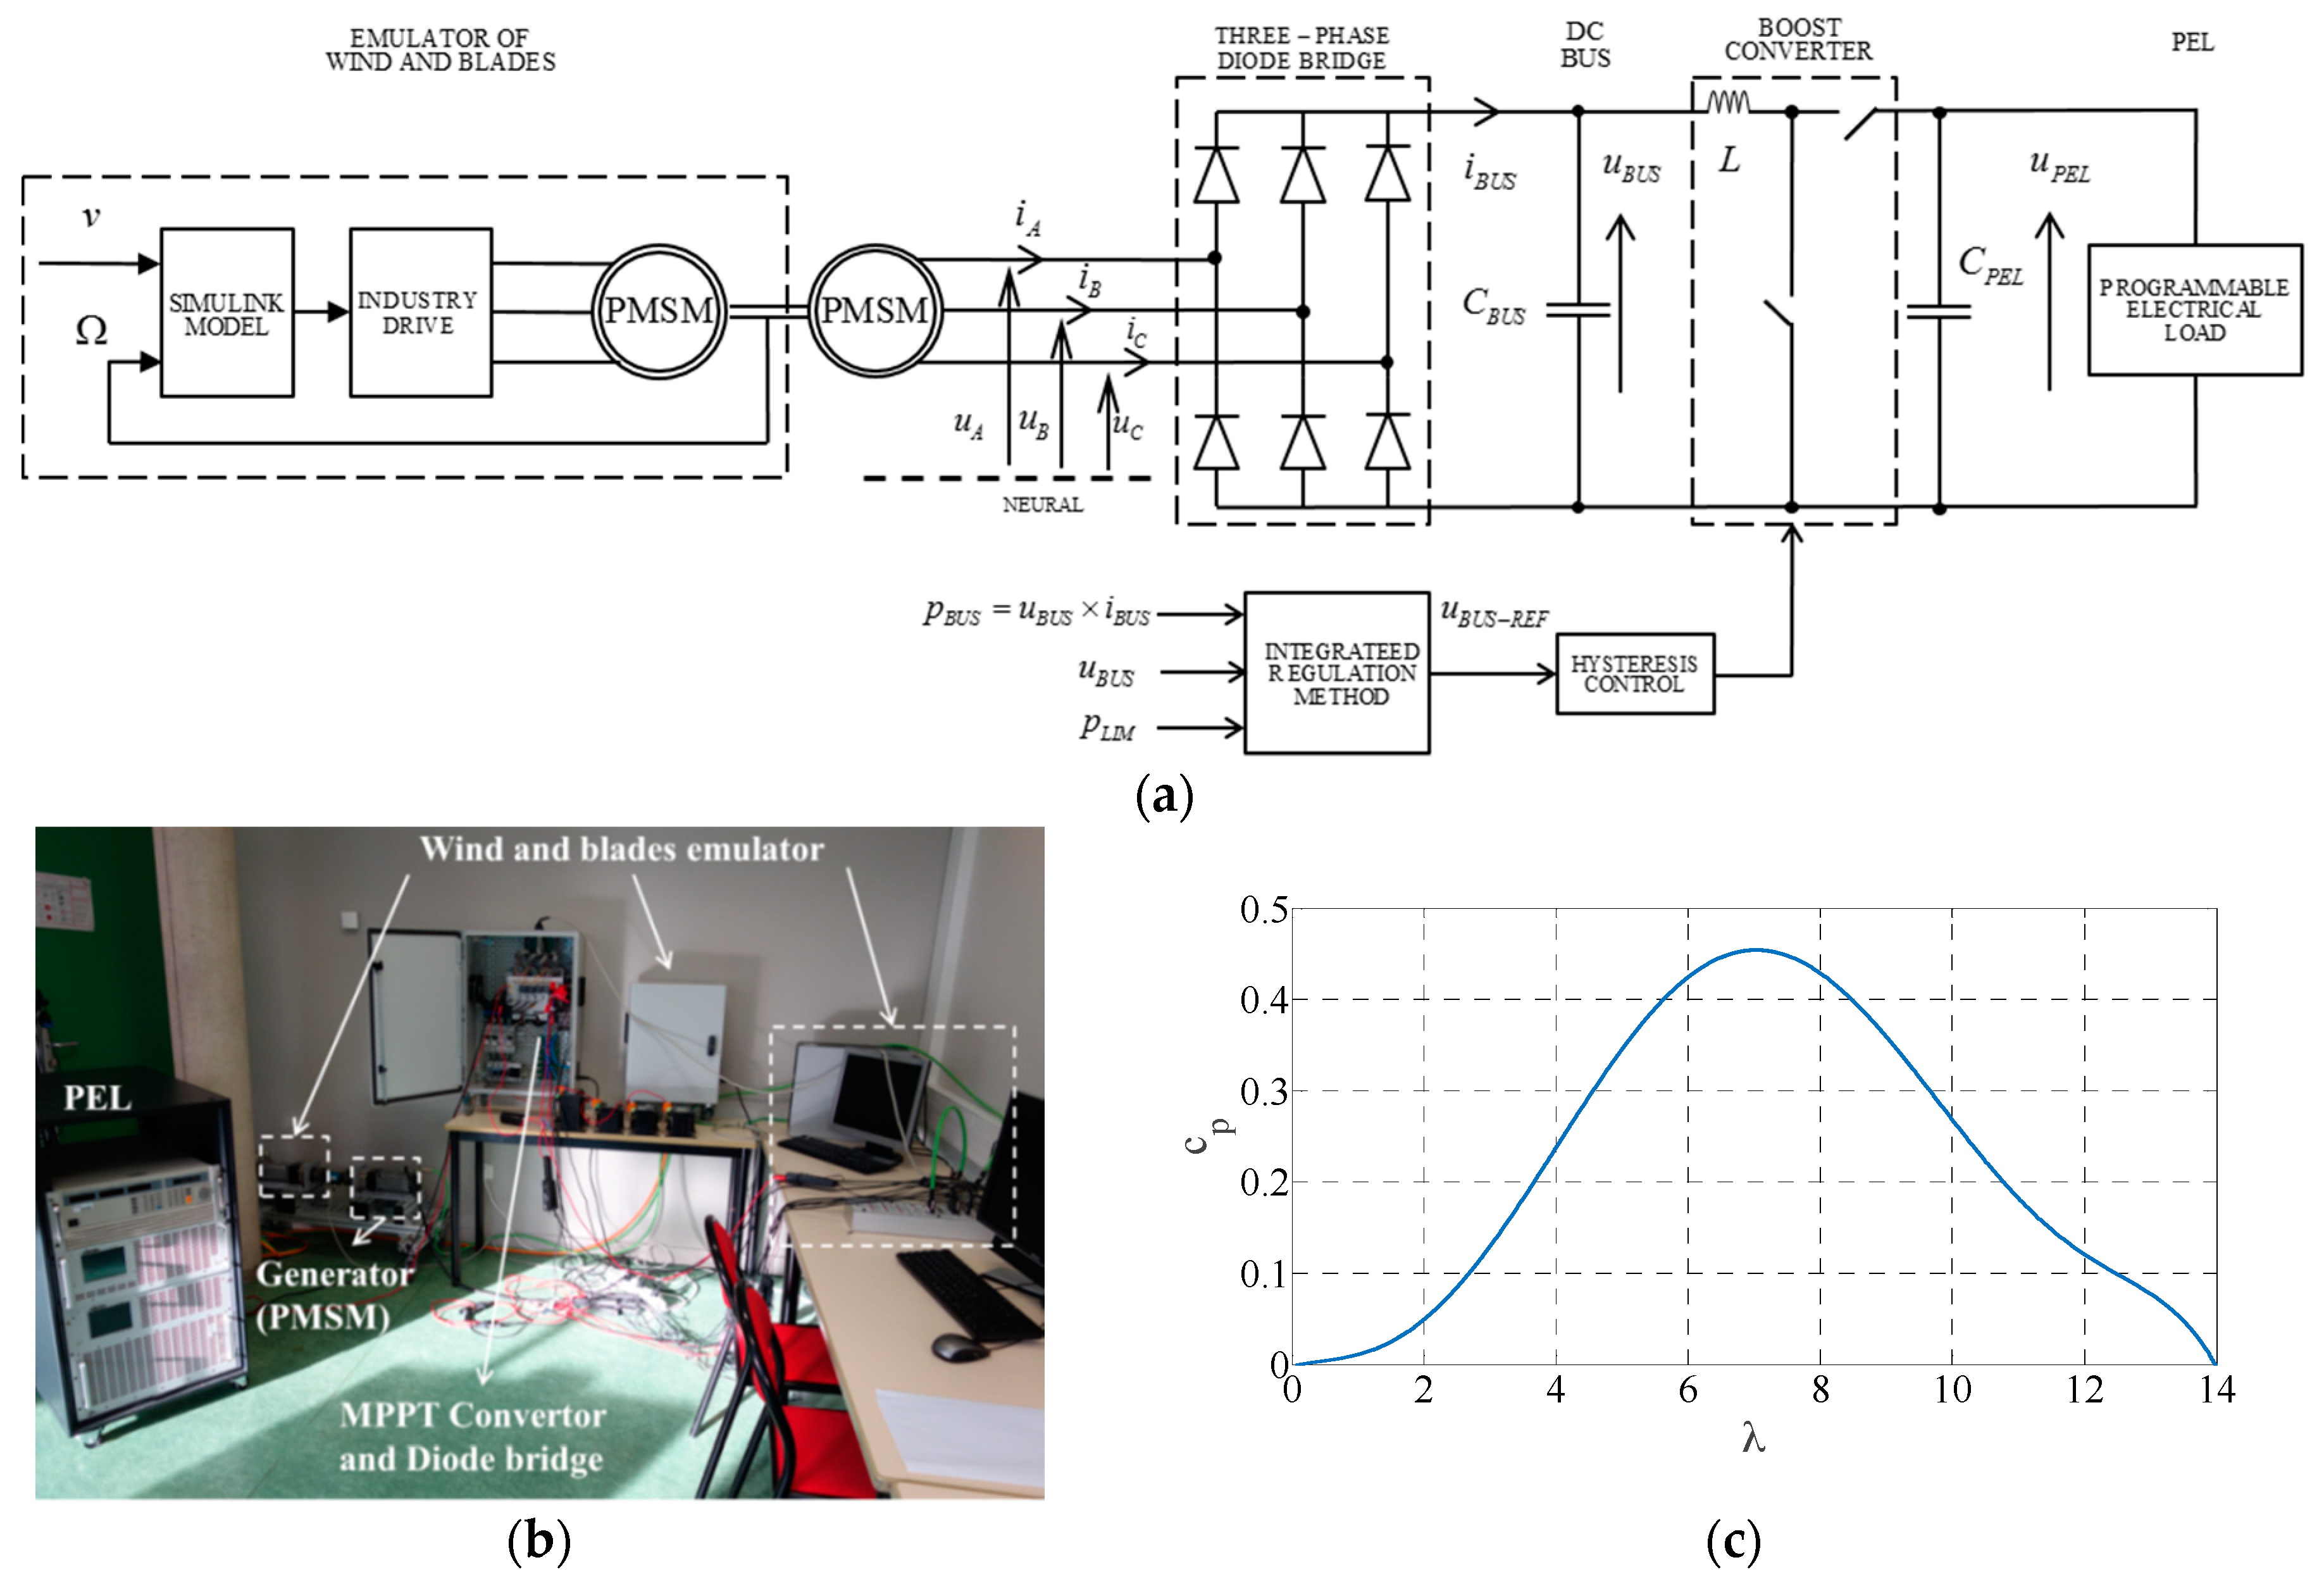
2.1. Overview of Test Bench

The test bench electric scheme is presented in Figure 1a. As presented in [5], a system that consists of a three-phase driver, a three-phase PMSM, and one dSPACE DS1104 control board emulates the dynamic behavior of wind and blades. A second PMSM is used as generator of whole wind energy conversion system. Generator’s output connects a three-phase diode bridge transforming electric energy from AC form into DC form. A capacitor C B U S is implemented to stabilize the voltage of DC bus. An inductance L and an Insulated Gate Bipolar Transistor (IGBT) module driving by dSPACE DS1104 are combined into a DC–DC boost convertor to realize the adjustment of operating point. A programmable electronic load (PEL), shown in Figure 1a, for which the C P E L is associated, emulates the power demand of user. The PEL keeps voltage at 400 V for all operating condition [5,10]. Detailed information of equipment of the test bench is given in Table 1 and all physic equipment is shown in Figure 1b.

2.2. Electrical Power Distribution

The emulating model of the wind energy conversion system is considered as a 1 kW system by Bergey [5]. The extracted amount of electrical power is based on the aerodynamic power p A E R O expressed by Equation (1):
p A E R O = 1 2 ρ π R 2 v 3 c p ,
where the density of air ρ is 1.23 kg/m3, the blade radius R is 1.25 m, the v indicates the wind velocity, and the c p is the power coefficient that is approached by a 7th-order polynomial function as in Equation (2). This power coefficient is given in Figure 1c; it shows the behavior of the emulated wind turbine. The dynamic mechanical function [5] is given by Equation (3).
c p ( λ ) = K = 0 7 a K λ K ,
1 Ω ( p A E R O p E M ) = J d Ω d t + F Ω .
In Equations (2) and (3), the λ is the TSR calculated following λ = R Ω / v , in which Ω is the rotational speed used also in Equation (3), p E M is the electromagnetic power, J and F are separately the mechanical inertia equaling 1.5 kg·m2 and the viscous damping equaling 0.06 Nm/rad.
The distribution of static state operating points is validated based on several pre-research experiments. Figure 2a,b presents the aerodynamic power p A E R O and the electrical power p B U S following the DC bus voltage u B U S and the bus current i B U S as variables. The correlation of these two powers, p A E R O and p B U S is displayed in Figure 2c.
The analysis of the experimental results given in Figure 2 indicates that: (i) operating maximum power points (MPPs) are not identical for p B U S curves and p A E R O curves owing to losses of power from the input side of PMSM to the output side of three-phase diode bridge; and (ii) for limited power demand, p A E R O curves supply operating points different from p B U S curves. Thus, for integrated power control strategy, p A E R O curves are useless even as indirect references. Therefore, the control strategy and the regulating algorithm application have to take into account this remark. Based on the characteristics of p B U S curves, the variable chosen to realize the change of system’s operating point is the DC bus voltage. For each wind speed it is axiomatic that for one value of i B U S there are two different working points within the operating range. Consequently, comparing with i B U S , the variable u B U S is more suitable to be regarded as the reference variable, since each value of u B U S presents a unique operating state.

3. Problem Formulation

Integration of MPPT and PLC cases is the main objective of this paper. The proposed principle of this power control method is to avoid the requirement of distinguishing the MPPT condition from the PLC condition. Based on different theories of direct and indirect MPPT methods, ways to realize the integration of MPPT and PLC methods are dissimilar and they are presented below.

3.1. Control Loop

Whatever the principle, power control methods can only describe movement of system’s steady operating points. Based on the characteristic of studied wind power conversion systems, the bus voltage u B U S is selected as the control variable. Hence, before explanations of proposed power control methods, the dynamic characteristic of whole wind power conversion system with respect to the variation of u B U S needs to be analyzed first. To correctly operate the regulating algorithm, the control loop is regulated by a hysteresis controller due to its good dynamic performance and easy implementation [17]. Figure 3a,b show the response of the actual u B U S with respect to the variation of bus voltage reference u B U S for the hysteresis controller, and respectively its enlarged version. The power response as well as the three phase electrical variables response are analyzed and presented in Figure 3c,d, with enlarge presentation of three-phase electric variables given in Figure 3e,f.
Then, different amplitudes of step input of u B U S were implemented into the test bench, based on 8 m/s wind velocity and the 150 V initial value of the bus voltage. In order to highlight the regulation time of p B U S response to the variation of u B U S , Figure 4 presents the relationship between the regulation time, variation value of p B U S , and the step input values of u B U S . The used values of step input of u B U S are: 10 V, 7.5 V, 5 V, and 2.5 V.
Given the results given in Figure 3 and the discussion expressed in [18], one notes that the hysteresis controller is adequate for a rapid response. Indeed, the wave forms of currents and voltages may be considered as acceptable concerning the distortion. Therefore, mutual restraint resulting from the joint action of the power control methods and the hysteresis control algorithm has to be taken into account.
Due to the non-linearity of the system, as presented in Figure 4, the value of regulation time of output power p B U S responding the variation of u B U S is associated to the perturb step-size Δ u of u B U S and the operating point. According to Figure 4, when demanded step input of u B U S is big, e.g., +10 V, +7.5 V, and even +5 V, the output power needs approximately 2.6 s to stable in the region about 5% of stable value of p B U S . For a decreased step input, e.g., +2.5 V, the value of the regulation time still rests near to 2 s.
To implement the control strategy for all methods demanding information of p B U S and u B U S as accurate as possible, a low-pass filter, which uses a cut-off frequency of 6000 Hz, is added before the entrance of direct methods. This is a compromise between the precision and the rapidity of tracking.
If the p B U S is used by the power control method, certain time step (which should not be smaller than 2 s) has to be added to avoid the dynamic process of p B U S response. However, for the method based on the indirect principle, this operating time step is unnecessary, because used parameters do not include the p B U S or any other parameters containing the high order dynamic characteristics.

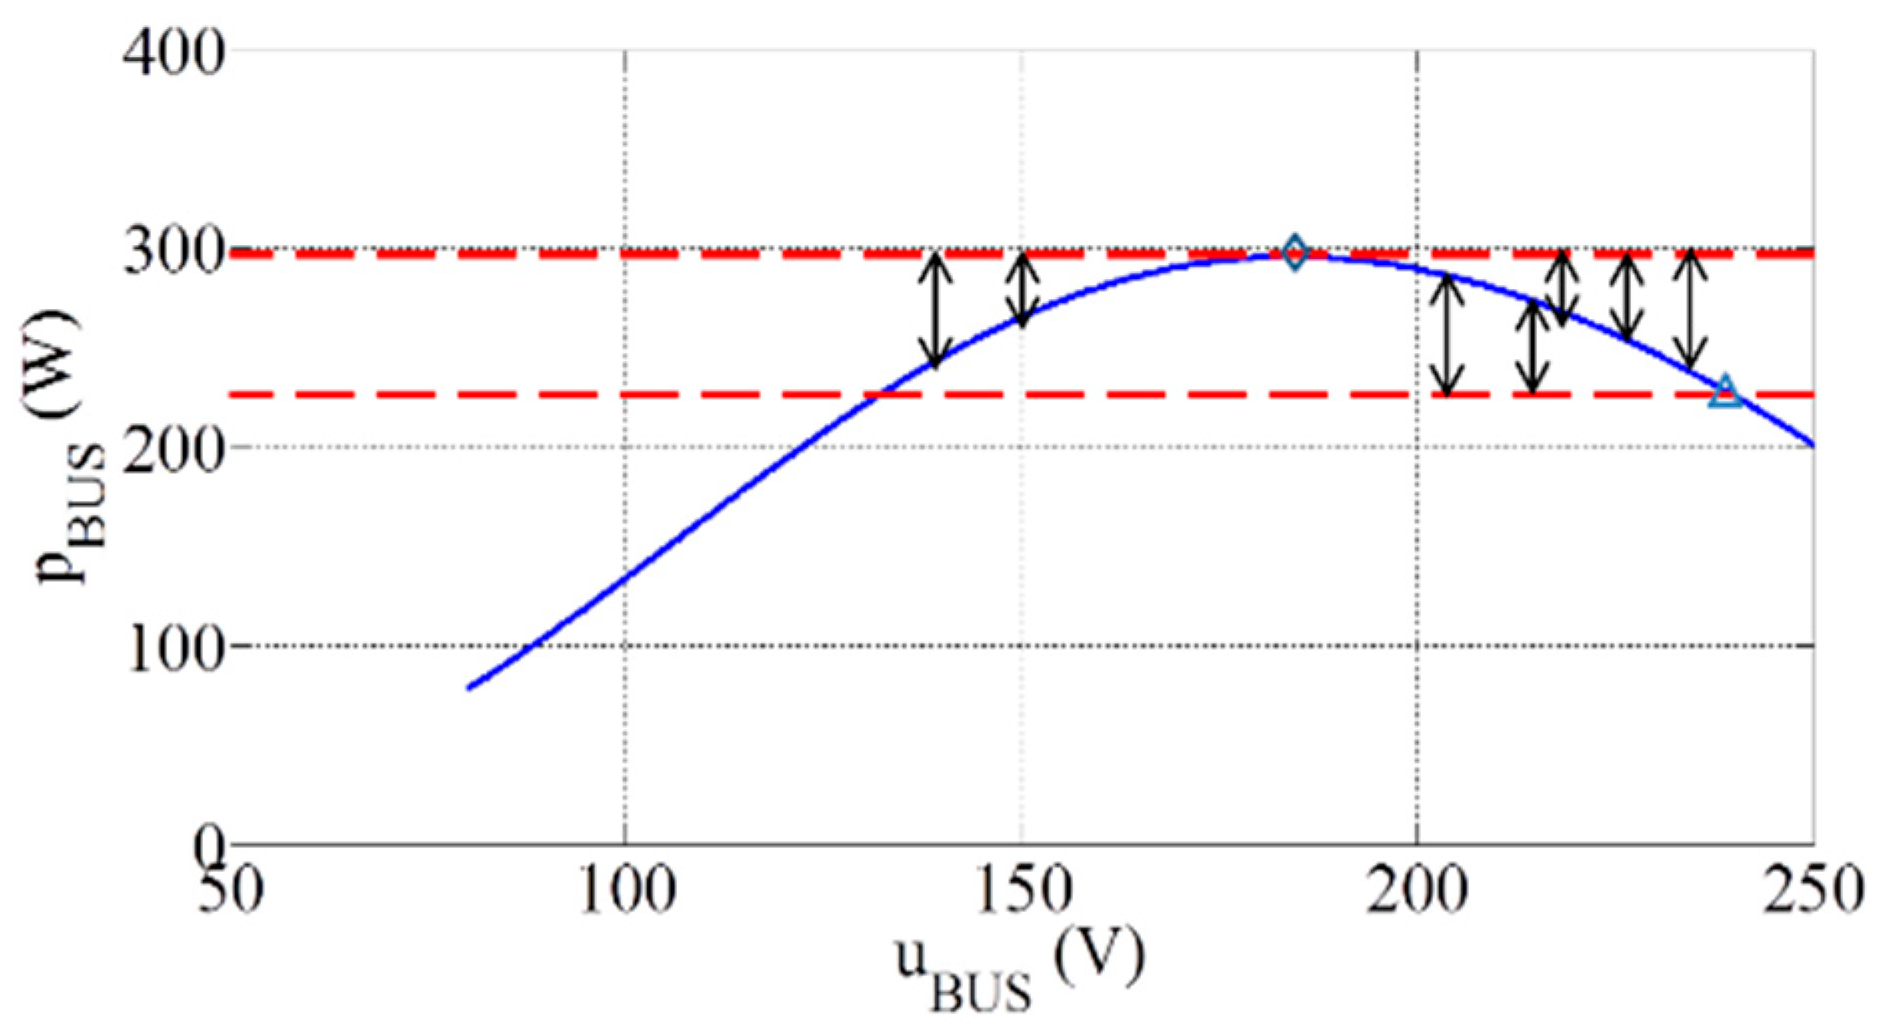
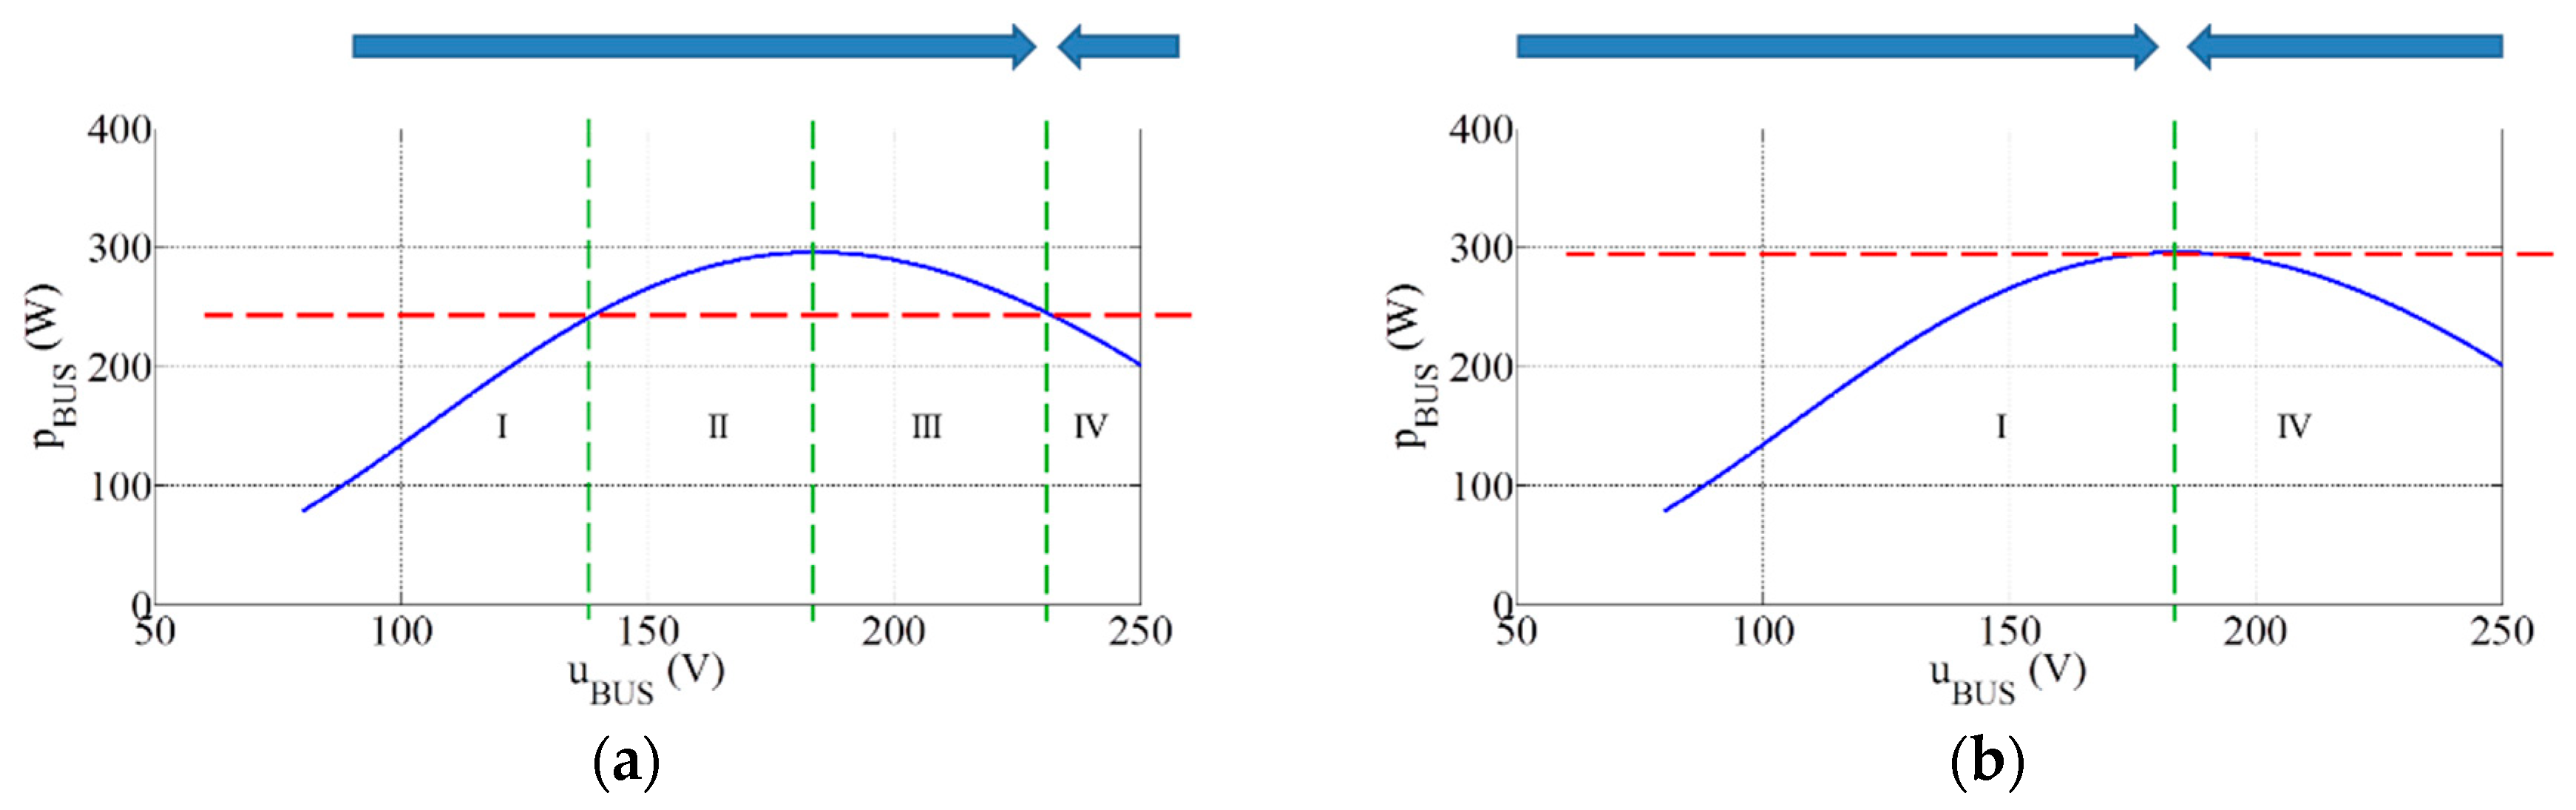
3.2. Principle of Power Control Strategy Methods

Based on our previous studies [5,10,11], the PLC operating case means that the power output of the small scale wind generator should follow the demanded value supplied by the users’ side. Thus, the power control method should focus on the absolute value of the p D I F F = | p B U S p L I M | , where p L I M is the asked power value and the p B U S is the measured actual power value, with the acceptable assumption that p L I M has been obtained. Figure 5 presents the proposed power controlling strategy integrating both of MPPT and PLC cases. Dotted lines in this figure indicate the varying demanded value of power: the upper one shows the demanded values for MPPT case; the lower dotted line indicates the PLC case. Additionally, the solid line displays the power distribution for a given wind velocity. Thus, following the P&O logic principle, the proposed integrating power control methods will be committed to minimize the value of the difference p D I F F .
According to the characteristics of the wind turbine, when the demanded value of p L I M is lower than the potential maximum power value, there are theoretically two operating points supplying the required power value. Considering the transfer of operating points, if the steady component of operating currents is close to equipment’s physical limitations, the dynamic components of current resulting from the transfer between operating points has high possibility for damaging devices. Therefore, in this work, the system will be forced to operate at the “low current–high voltage” side.
Aiming to realize the objective mentioned above, the operating region has been divided into four parts: I, II, III and IV which are defined by changes of variables Δ u B U S , Δ p B U S and Δ p d i f f presented in Figure 6 and Table 2.
Based on the Table 2 and the Figure 6a, for example, after one step of perturbation, if the change of DC bus voltage, Δ u B U S , is positive, the change of DC bus power, Δ p B U S , is still positive and the change of p D I F F is also positive, the operating point can be identified at this moment in the region II. So, since it is desired to drive the system operating at the “low current–high voltage” side, the next perturbation step is selected as positive again.
The Figure 6a and Table 2 indicate the power limited demand conditions, for which the demanded value is lower than the potential maximum power value. The Figure 6b and Table 3 present the region definition of the MPPT demand conditions. It is obvious that, to these two operating conditions, operating regions can be defined by same rules. Therefore, P&O algorithms based on these operating regions’ definition can uniformly cover two conditions of MPPT and PLC. Based on trends of changes of Δ u B U S , Δ p B U S , Δ p D I F F , power control methods based on P&O theory determine the direction of change of system operating state.

3.2.1. Fixed Step-Size

In order to validate the control strategy mentioned above, one simple experiment was designed. Figure 7 present the selected wind velocity and the demanded power value profiles, as well as experimental results of actual electrical power, u B U S and the perturb step-size. The profile of p L I M demands 250 W, which is lower than the maximum power level for given wind velocity, and 378 W, which is the maximum power level. The first step is to confirm this strategy works with fixed perturbation step-size.
According to results in Figure 7, it is clear that the principle presented in Section 3.2 works properly for identifying the actual operating region and detecting the moving direction of perturbation. However, obviously, fixed perturbation step-size cannot drive the system producing stable power output; so, using variable perturbation step-size is the next object to be implemented.

3.2.2. Improved Variable Step-Size Designed with Newton–Raphson Technique

Following the logic of MPPT variable step-size method [3,18], Newton–Raphson method is one worthwhile method of calculating variable step-size for power control method integrating MPPT and PLC cases. Based on the theory of Newton–Raphson method, p D I F F is regarded as one function of bus voltage, p D I F F = f ( u B U S ) . Thus, the calculation of variable step-size matches the following iterative methodology for each k step:
Δ p D I F F ( k ) = p D I F F ( k ) p D I F F ( k 1 ) ,
Δ u B U S ( k ) = u B U S ( k ) u B U S ( k 1 ) ,
Δ u = S i g n × | p D I F F ( k ) / ( Δ p D I F F ( k ) / Δ u B U S ( k ) ) | ,
u B U S R E F = Δ u + u B U S ( k ) .
The value of Sign is determined based on Table 2. When the system works in I, II or III region, its value equals one; otherwise, the system works in IV region and the value Sign equals minus one. To avoid the convergence of variable step-size at the low voltage–high current operating conditions whose region is located at the left side of maximum power operating points, the variable step-size calculating method is used when system works in III and IV operating regions.
Figure 8 presents the experimental results of Newton–Raphson method under the same experimental condition as in Figure 7.
Based on Figure 8, when p L I M equals 250 W, which means the PLC case, the variation of p B U S is significant; even when p L I M equals 380 W, MPPT case, the variation of the stationary component of p B U S around the MPP is not obvious so much. It is clear that when the maximum value of perturbation step-size is selected big, such as 10 V, the perturbation step-size cannot significantly converge to zero (shown in Figure 8). If, the maximum value of perturbation step-size is reduced, the effect of convergence of perturbation step-size is not improved significantly but the seeking speed to a new steady-state will clearly also be decreased.
According to experimental results such as in Figure 8, direct application of Newton–Raphson method cannot converge properly. This is due to the fact that the rate of change of the power respect to the voltage, around operating points of limited power, is usually high, comparing to the response of power nearby MPP with same size of perturbation step. Therefore, one improved Newton–Raphson variable step-size iterative methodology is introduced as follows:
g r a d i ( k ) = p B U S ( k ) p B U S ( k 1 ) u B U S ( k ) u B U S ( k 1 ) ,
Δ u = S i g n × | p D I F F ( k ) / ( Δ p D I F F ( k ) / Δ u B U S ( k ) ) | | g r a d i ( k ) |   ,   with   | g r a d i ( k ) | 1 ,
u B U S R E F = Δ u + u B U S ( k ) .
Based on the results presented in Figure 8, the calculation iteration (Equations (4)–(7)) of variable step-size around the MPPs naturally converge smooth, since, at that place, the distribution of operating points has a large range where the change of power is not significant for at least one perturb. So, dividing classic Newton–Raphson calculation iteration by the gradient of the actual power respecting DC bus voltage could reduce the power transition if the operating goal is PLC. Taking into account the modification in Equation (10), it can be stated that with this variable step-size algorithm, this method can deal with the convergence of variable step-size for both conditions of MPPT and PLC.

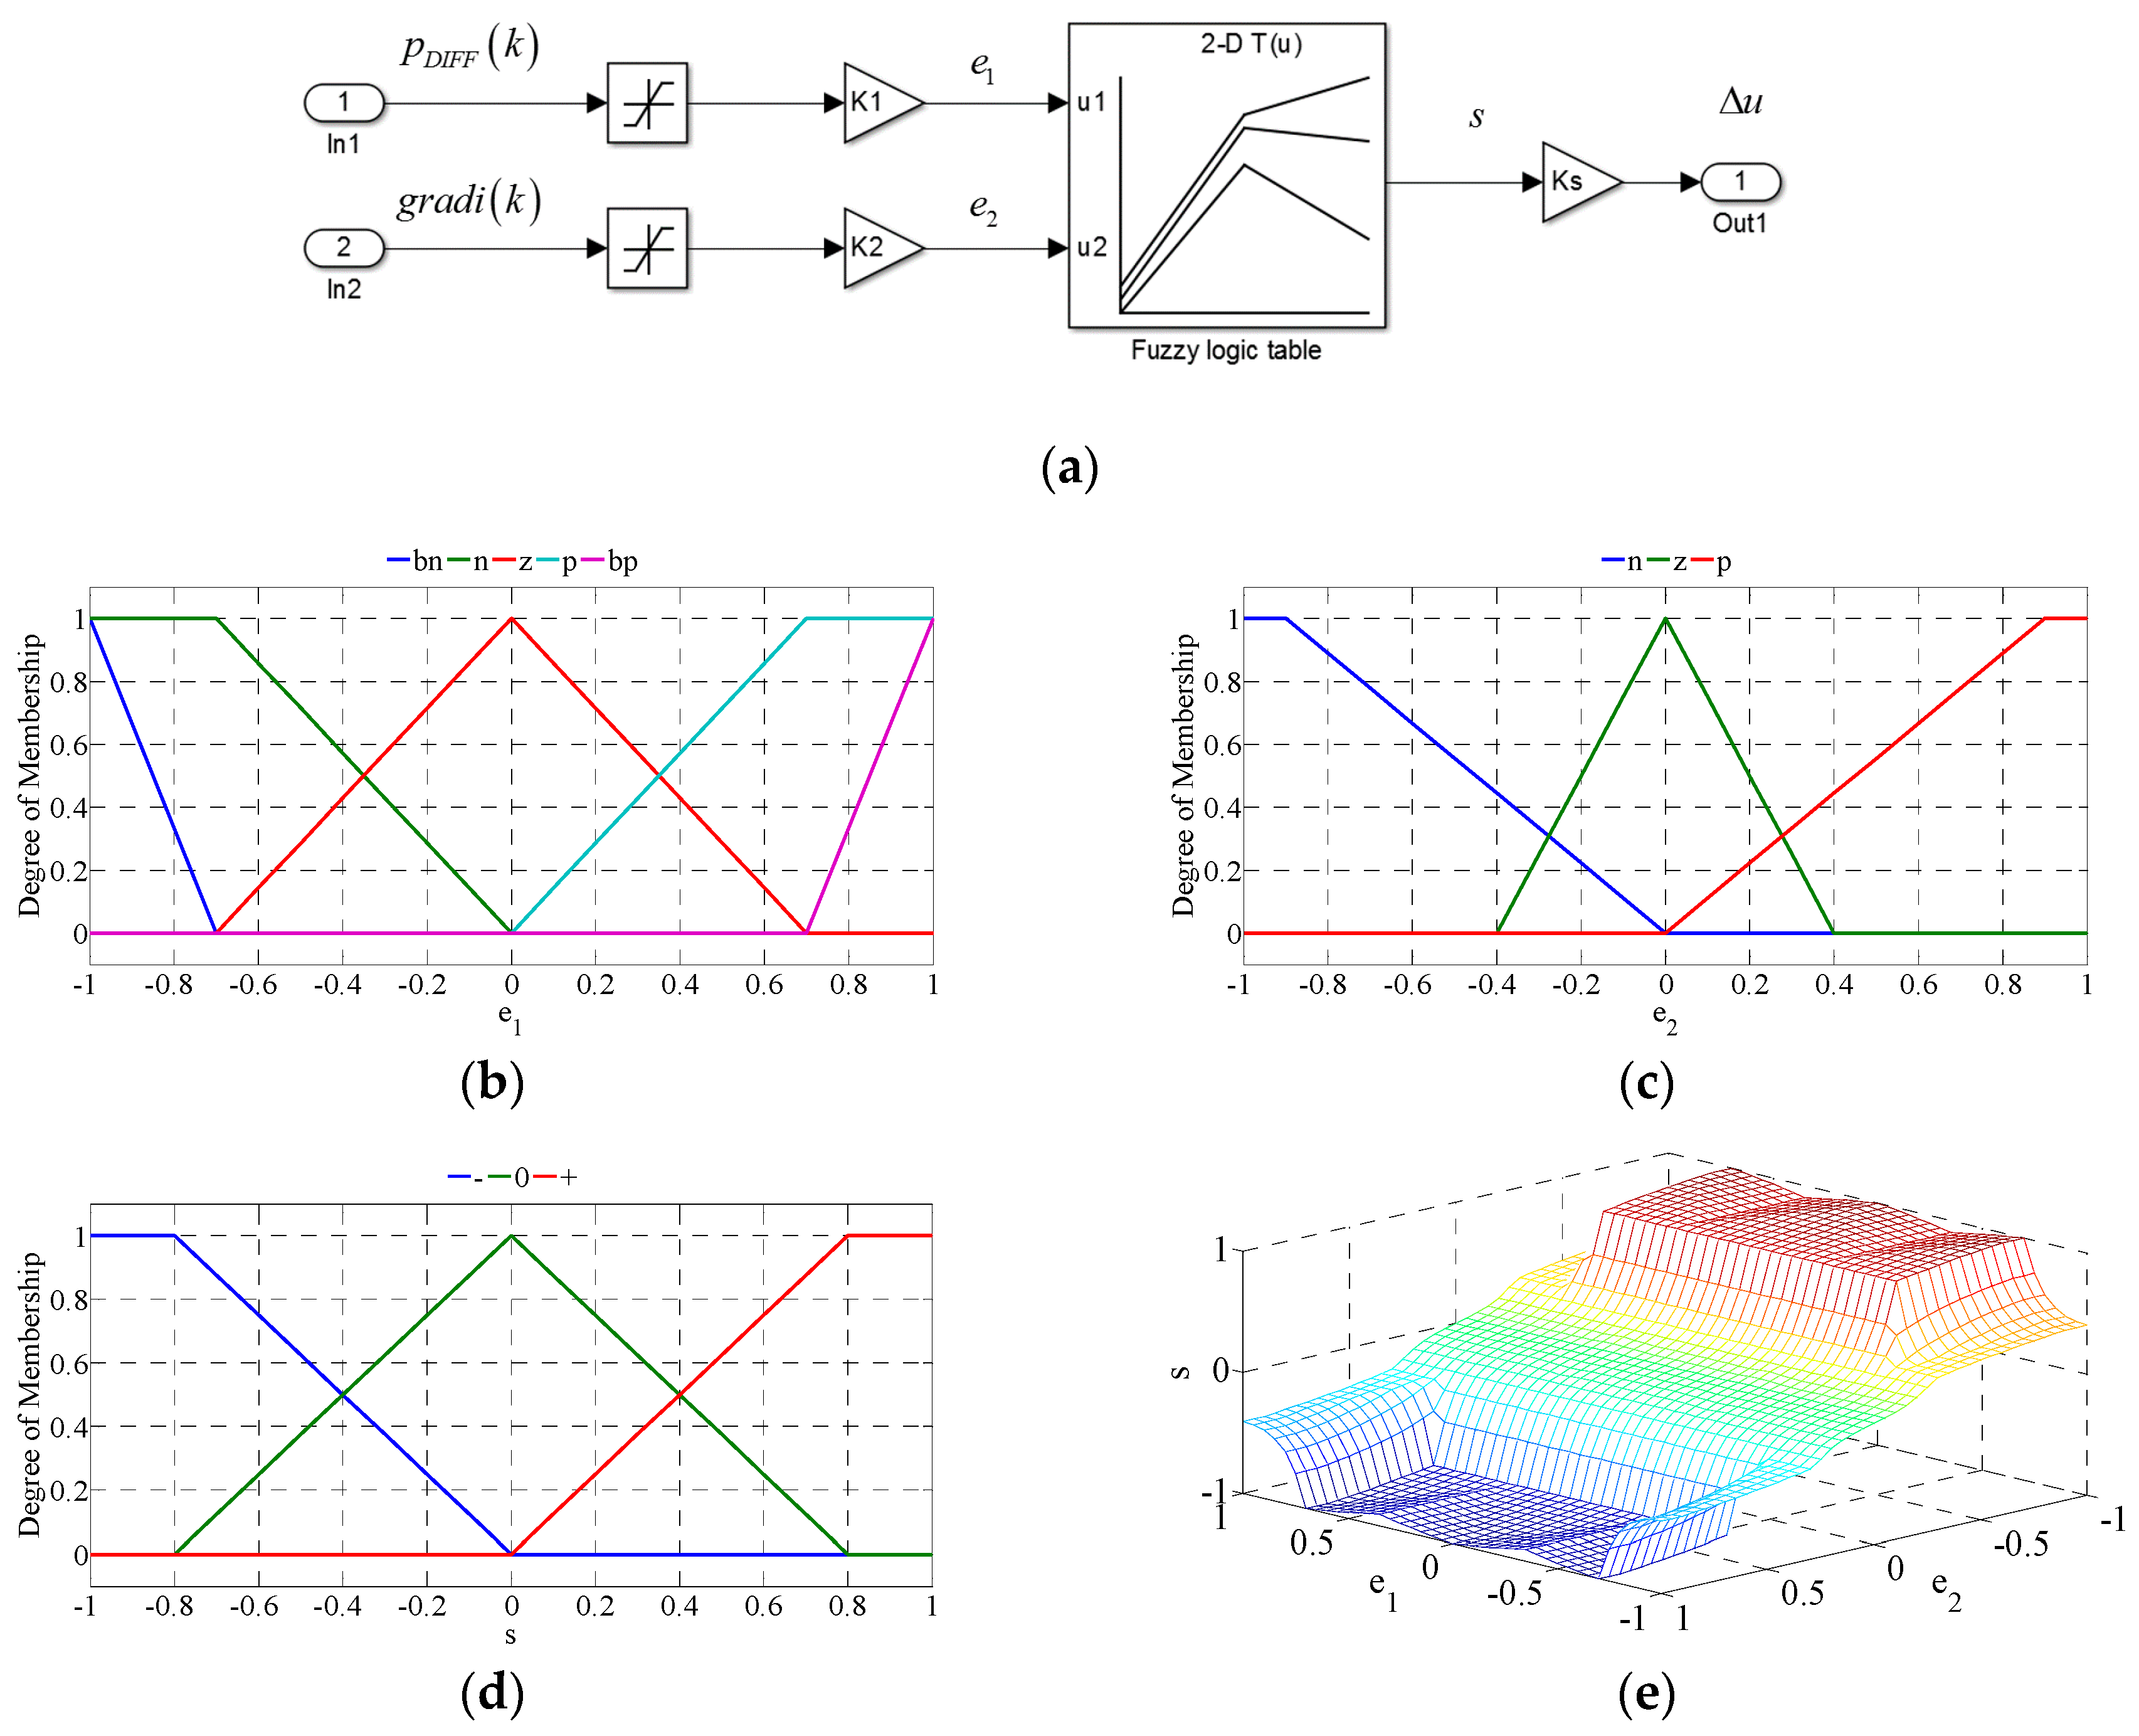
3.2.3. Variable Step-Size with Fuzzy Logic

Another well-known technique of variable perturbation step-size is the fuzzy logic method [3,18], which can handle robust and nonlinear control requirements. However, one notes that this method requires in-depth knowledge concerning the system. Fuzzy logic is based on the input space and the output space mapping through logical actions. As usual, in this work, the process is divided into three phases: the fuzzification, the fuzzy reasoning, and the defuzzification.
Same as the method presented in Section 3.2.2, the fuzzy logic method is introduced into the calculation of variable step-size. So, g r a d i ( k ) and p D I F F ( k ) are chosen as two inputs of fuzzy logic method as presented in Equation (11):
{ e 1 = g r a d i ( k ) = p B U S ( k ) p B U S ( k 1 ) u B U S ( k ) u B U S ( k 1 ) e 2 = p D I F F ( k ) .
During the fuzzification phase, the inputs and outputs numerical values are expressed in fuzzy sets. All points in input space are translated into the “code” in form of the degree of membership which can equal any values between 0 and 1. Considering the universe of discourse of the inputs and the output normalized into [–1, 1], Figure 9b–d present the fuzzy subsets corresponding to the inputs e 1 { b n ; n ; z ; p ; b p } and e 2 { n ; z ; p } , and to the output s { ; 0 ; + } . Aiming to accomplish fuzzy logic as simple as possible, following the principle presented in Figure 9a, these input variables, the g r a d i ( k ) is normalized into e1 by gain K1, and p D I F F ( k ) is normalized into e2 by gain K2. However, there is possibility to adjust values of K1 and K2, to obtain a normalized interval rather than [–1, 1], which can lead to a better regulating performance (presented in Section 4). Forms of membership function were selected as triangular and trapezoidal functions to simplify the study. For e1, a group of five subsets is demonstrated to separate its value range for MPPT and PLC cases. Parameters of each membership function are determined based on experimental tests.
The Figure 9e shows the fuzzy reasoning surface of the proposed fuzzy logic and the Table 4 explains the “if–then” reasoning role. The step of “if” describes a fuzzy area in the input space and the step “then” step states the output in the fuzzy area. With a logical operator, membership functions values, evaluating the degree of each activated rule, summarize the degree of satisfaction for the “if” step of each rule. Subsequently, the fuzzy set in the “then” step of each rule is determined. Finally, outputs of each rule are aggregate into one fuzzy set. The Mamdani Fuzzy Inference System using the fuzzy toolbox is applied in this work.
The defuzzification wishes to “convert” the fuzzy set resulted from the fuzzy reasoning into a numerical value between 0 and 1. Then this value is anti-normalized to be Δ u by Ks. Several defuzzification operators are mentioned in [19]; however, the most used operator is the centroid, or center of gravity, which is chosen in this study, such as the implemented methods mentioned above. Figure 10 presents the experimental results of fuzzy logic method under the same operating condition as presented in Figure 7 and Figure 8.

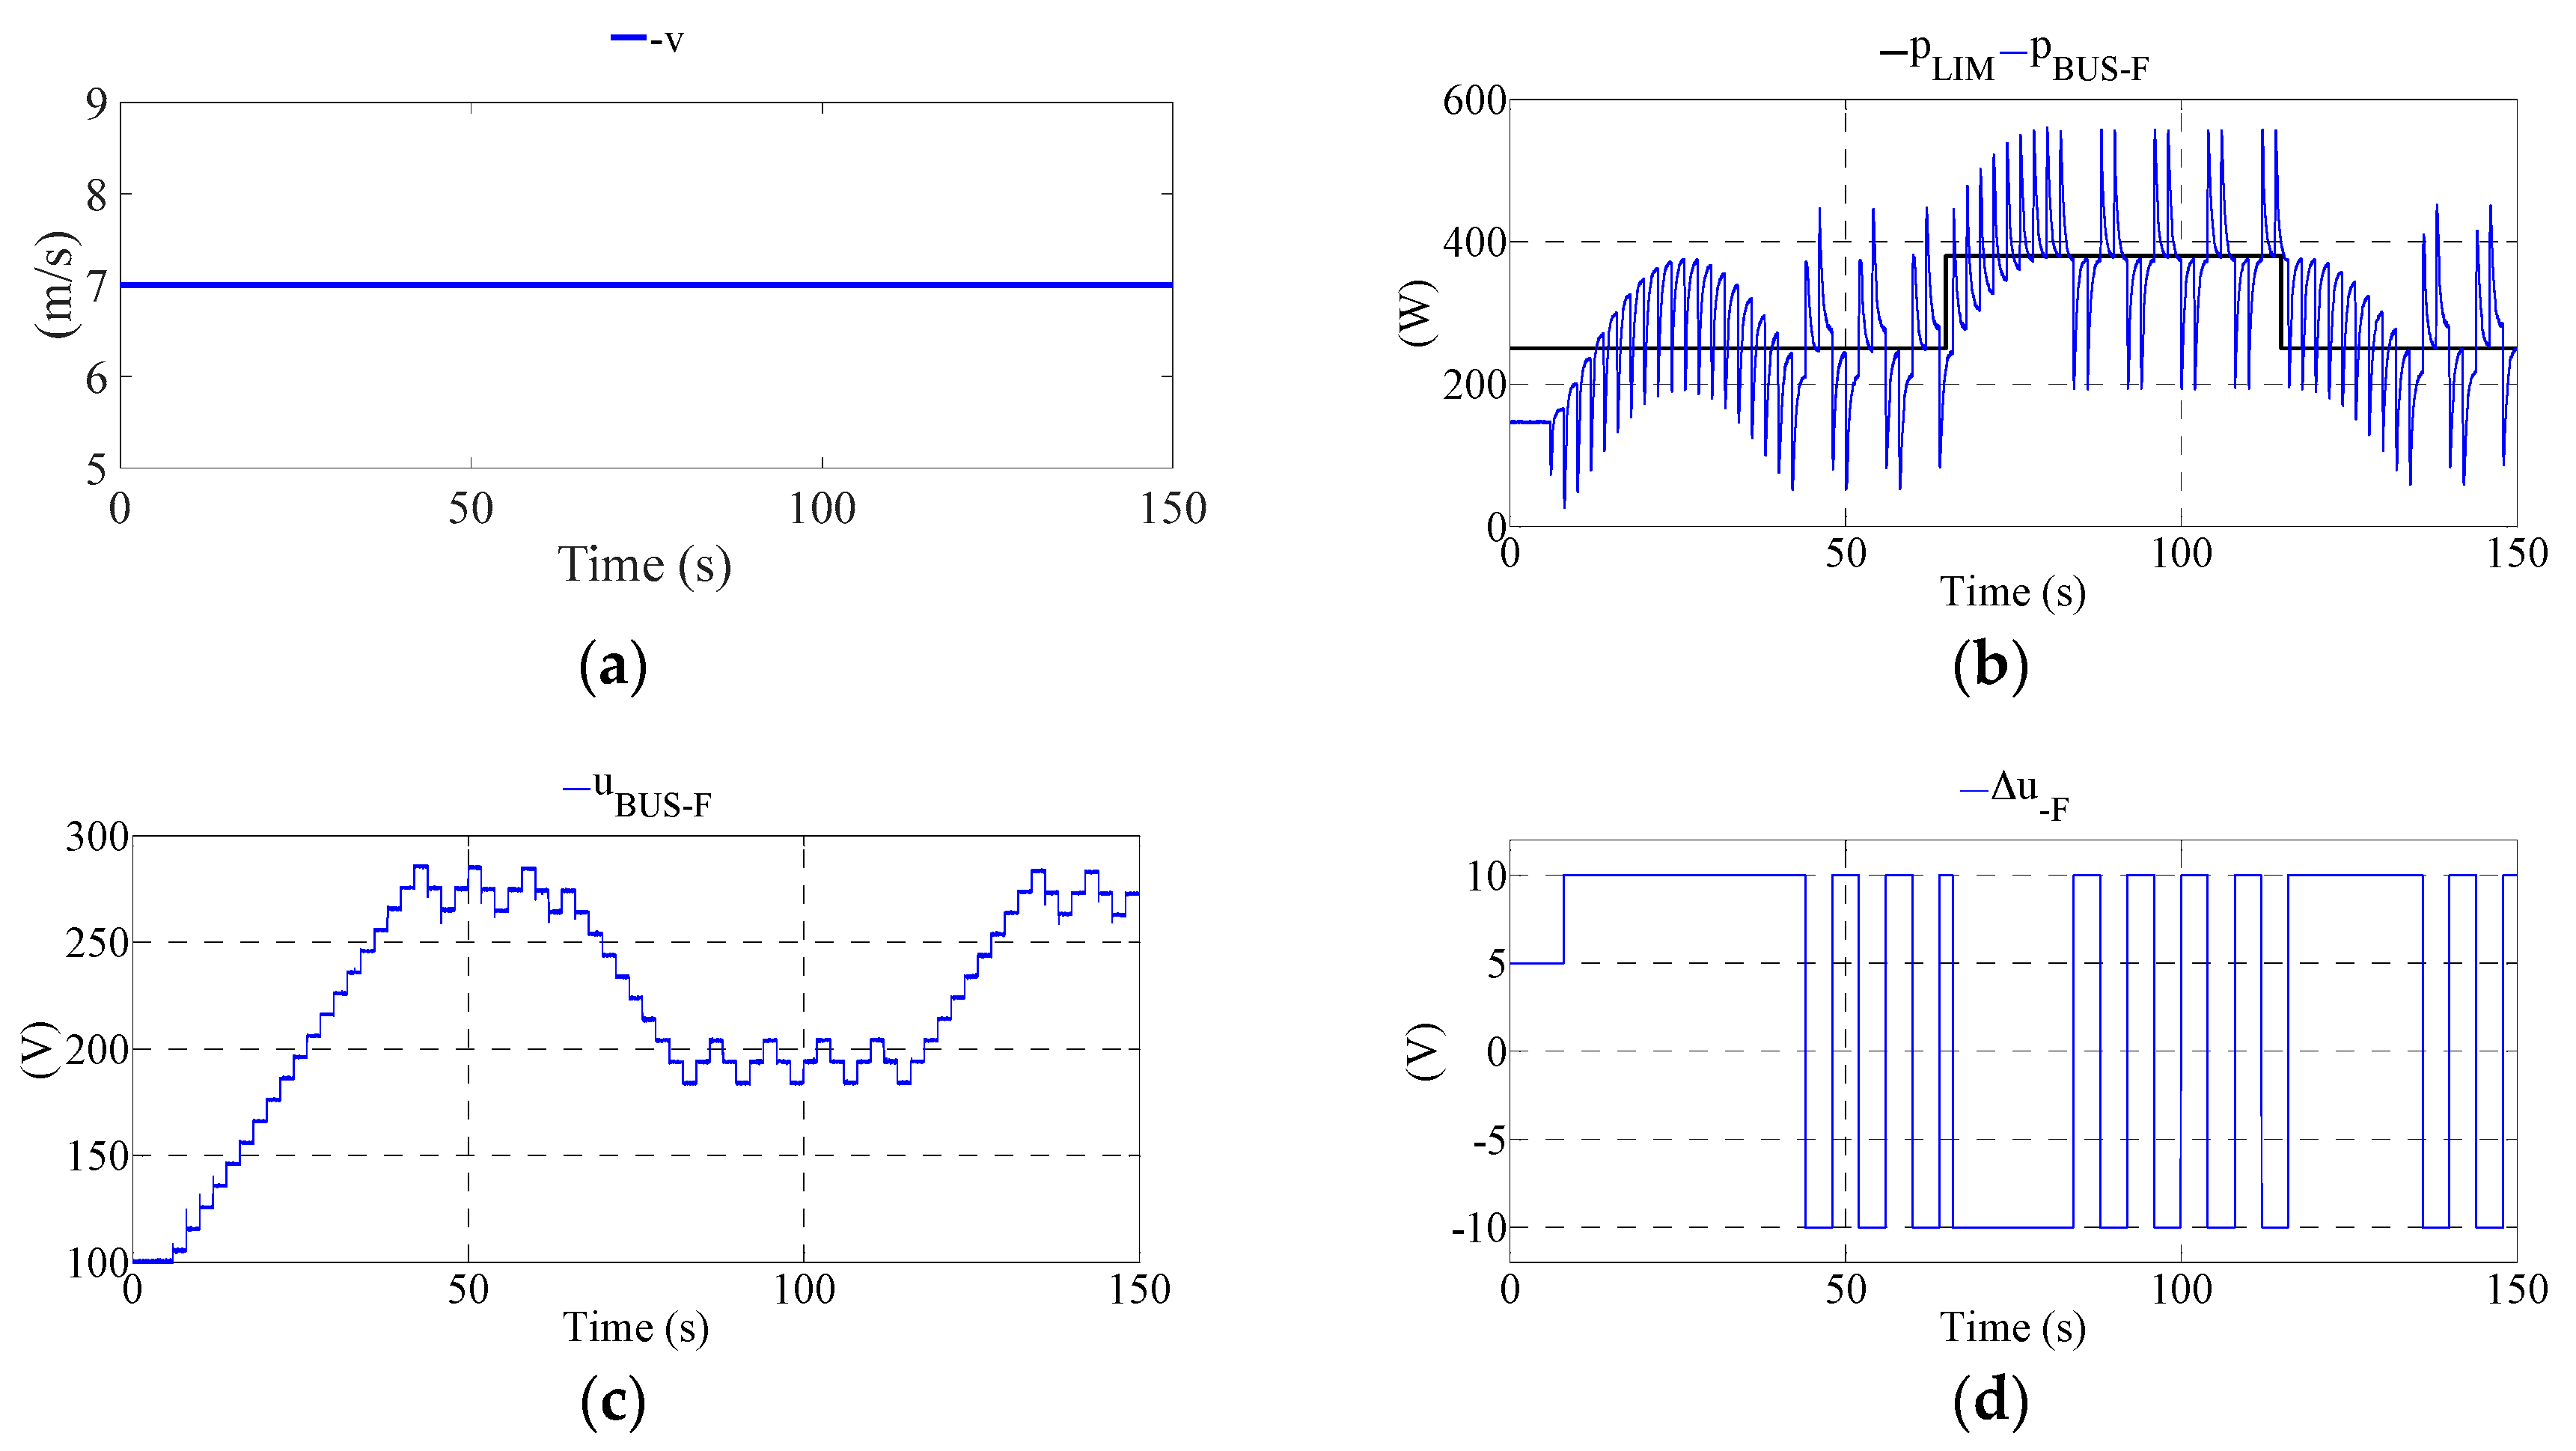
4. Analysis of Comparative Results

In order to compare above-mentioned power control methods, a real wind velocity is considered as the wind velocity input, presented in Figure 11a, from data measured by Météo France, in Compiegne, France, on 15 January 2015, during 15 min; this real wind velocity profile is the same as in [18]. Furthermore, the p L I M profile was chosen based on the potential maximum power and the physical minimum power of the test bench, as presented in Figure 11b. The selected wind profile and power limited profile highlight a strained condition with rapid changes.
Under these experimental conditions, several experimental tests are introduced to compare all above-mentioned power control methods whose characteristics are given as follow:
  • Fixed step-size: step-size equals 10 V, 7 V, 5 V and 2.5 V.
  • Improved variable step-size designed with Newton–Raphson technique: maximum value of step-size equals 10 V, 7 V, 5 V and 2.5 V.
  • Variable step-size based on fuzzy logic: the combination of parameters (K1, K2, Ks) respectively equal: (4.5, 17.5, 7), (4.5, 17.5 10), (5, 15, 7), (5, 15, 10), (5, 20, 7), (5, 20, 10), (10, 20, 7), and (10, 20, 10).
As key variable, p D I F F is used to analyze characteristics of each method. Referencing statistical concepts, the ‘mean’, defined as average value, and the ‘variance’, indicating the expected value of the squared deviation from the mean, are calculated to compare dynamic and steady-state characteristics of different power control methods. At first, to all methods based on the P&O theory, a sampling method is a sampling time equals two seconds, is applied to filter the peak of each perturbation step of P&O (marked as ‘Mean sampling’ and ‘Variance sampling’). Then, the overall comparison (marked as ‘Mean overall’ and ‘Variance overall’) is calculated and analyzed also. Based on those parameters, results for the optimal one test of each kind of method are collected and presented in Figure 12. The ‘Mean’ and ‘Variance’ of those selected tests are listed in Table 5.
Summarizing all presented results, under complex conditions of wind velocity and power demands variation, all three methods based on the P&O principle matched the design target of this integrating power control method. Those methods perform weakly in the view of dynamic, resulting from the mechanical inertia which cannot be ignored; but, overall, their steady-state errors are tiny. From fixed step-size to improved Newton–Raphson method calculating variable step-size till to fuzzy logic method, the dynamic noise is reduced significantly, meanwhile the change of whole steady-state error is not much, in the ‘overall’ view.
Considering the complexity of implementing each power control method, fixed step-size and improved Newton–Raphson method has just one parameter needing to be determined: the value or the maximum limit of step-size. In theory, variable step-size calculated by fuzzy logic has a greater possibility to perform better, since it contains several parameters to be modified. However, this greater freedom increases the complexity of determination of those parameters, which demands a rich experience of application.

5. Conclusions

Three power control methods based on the P&O principle (fixed step-size; improved Newton–Raphson variable step-size and variable step-size based on fuzzy logic) have been studied, designed, and then implemented into a test bench highlighting the sluggish mechanical inertia and dealing with the power control problem integrating MPPT and PLC cases. This study concerns the small power wind energy conversion system.
One experiment, based on designed wind and power demand profile, was used to validate the basic function of each method. In addition, another experiment, using a measured wind velocity profile and one calculated power demand profile, was implemented to compare characteristics of all proposed methods. Evaluations of all methods and several statistical indices of key variable p D I F F were calculated and analyzed. All power control methods present good steady-state characteristics, but their dynamic characteristics are limited by the sluggish mechanical inertia and the control loop’s capability. Furthermore, some of the complex control algorithms, such as fuzzy logic used in this work, have the potential to achieve better performance. Moreover, the studied system uses a PMSM assembly, three-phase diode bridge, and converter with a hysteresis control, which makes it one of the most robust “drivers”.
The future research direction is to improve the dynamic characteristics of the control loop, to suppress the effect from the sluggish mechanical inertia. In addition, a deep robustness analysis may be conducted taking into account unmodeled dynamics, or associated couplings and uncertainties. This can significantly improve the performance of methods based on the P&O principle.

Author Contributions

All authors have conceived and designed the system, performed the experiments, and analyzed the data. All authors contributed jointly to the writing and preparing revision of this manuscript. All authors have read and approved the manuscript.

Conflicts of Interest

The authors declare no conflict of interest and the founding sponsors had no role in the design of the study; in the collection, analyses, or interpretation of data; in the writing of the manuscript, and in the decision to publish the result.

Nomenclature

v Wind velocity
C B U S Capacitor at the DC bus
L Inductance at the DC bus
C P E L Capacitor as the Programmable Electronic Load side
p A E R O Harvested aerodynamic power
c p Power coefficient
R Blade radius
ρ Air density
λ Tip speed ration
J Equivalent inertia of blades and hub
F Viscous damping coefficient
p B U S Electrical DC BUS power of experimental platform
u B U S Electrical DC BUS voltage of experimental platform
i B U S Electrical DC BUS current of experimental platform
u B U S Reference of DC BUS voltage of experimental platform
u A , u B , u C Three-phase voltages
i A , i B , i C Three-phase currents
Δ u Perturbation step-size
p L I M Demanded power value for power limited control
p D I F F Difference between the actual and demanded power
Δ u B U S Change of DC bus voltage
Δ p B U S Change of DC bus power
Δ p D I F F Change of the pDIFF
p B U S F Experimental DC bus power for fixed perturb step-size method in Figure 7
u B U S F Experimental DC bus voltage for fixed perturb step-size method in Figure 7
Δ u F Experimental evaluation of Δu in Figure 7
u B U S R E F Calculated reference of DC bus voltage for variable step-size method
p B U S N R Experimental DC bus power for variable perturb step-size method in Figure 8
u B U S N R Experimental DC bus voltage for variable perturb step-size method in Figure 8
Δ u N R Experimental evaluation of Δu in Figure 8
gradi(k)Ratio between the change of electrical power and the change of voltage
K 1 Gain for normalizing the first input of fuzzy logic method
K 2 Gain for normalizing the second input of fuzzy logic method
K S Gain for antinormalizing the output of fuzzy logic method
p B U S F L 
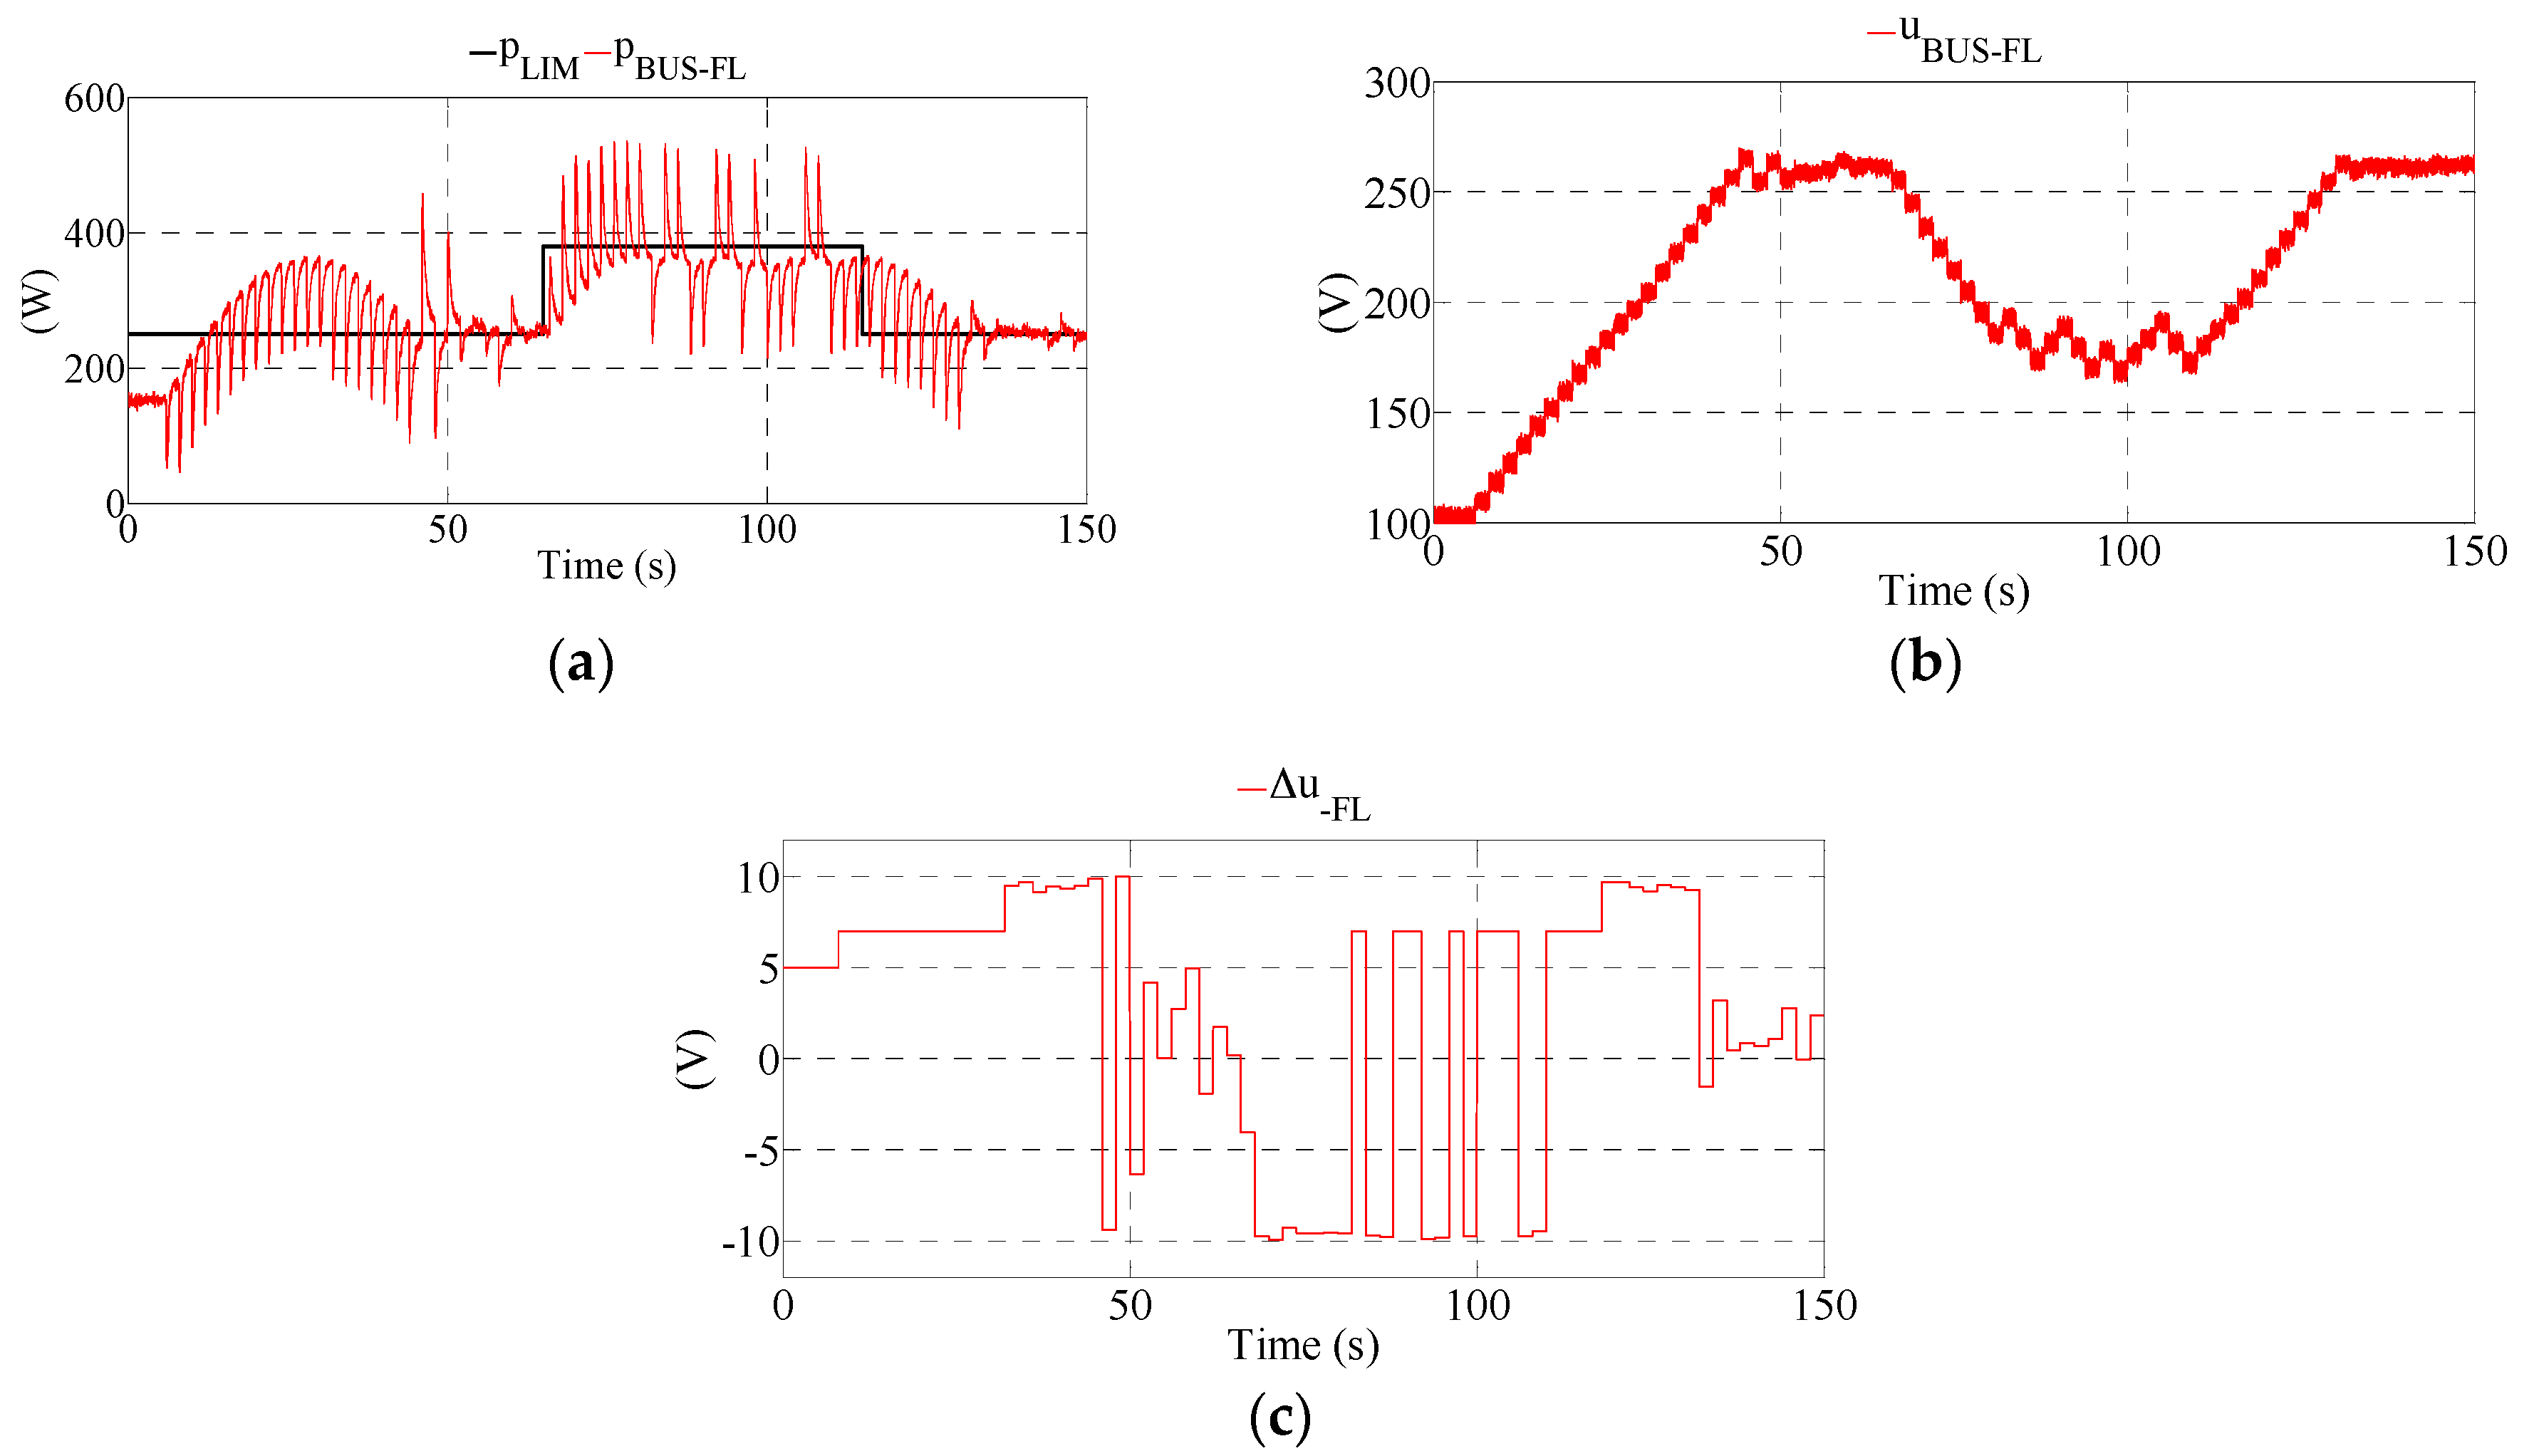
Experimental DC bus power for fuzzy logic method in Figure 10
u B U S F L Experimental DC bus voltage for fuzzy logic method in Figure 10
Δ u F L Experimental evaluation of Δu in Figure 10
p D I F F F 
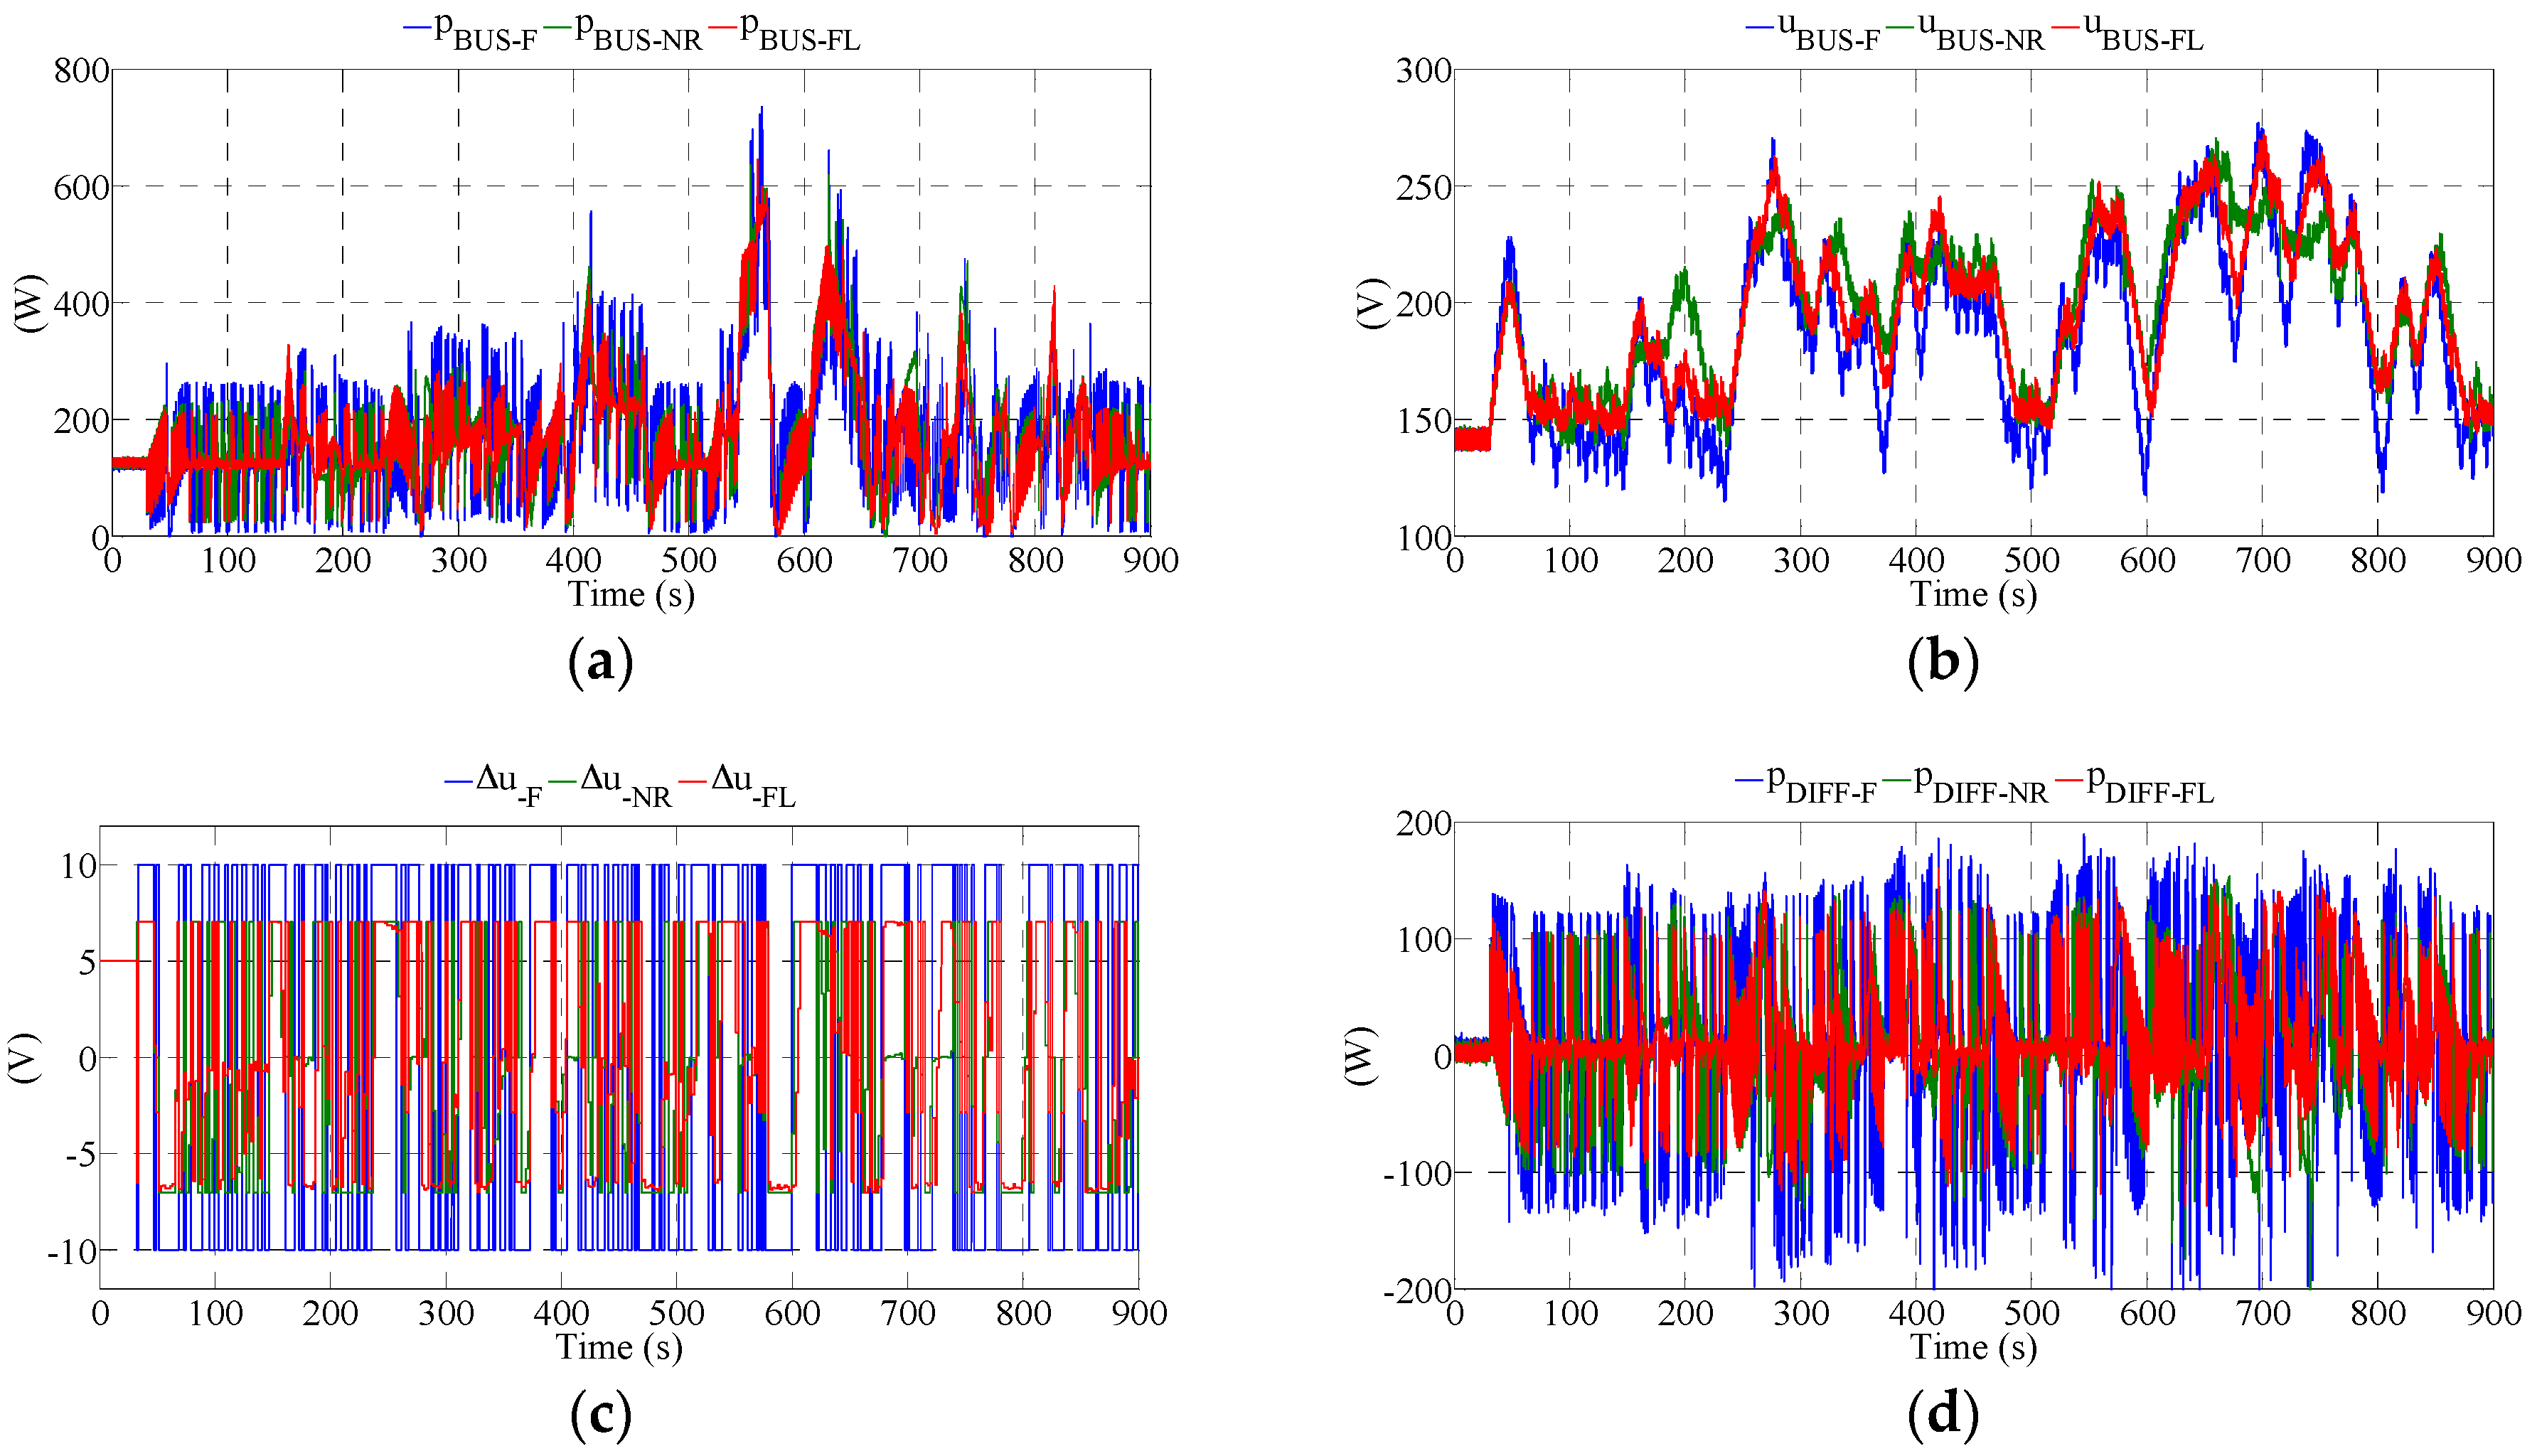
Evaluation of pDIFF for the fixed step-size perturbation and observation method
p D I F F N R Evaluation of pDIFF for the variable step-size perturbation and observation method
p D I F F F L Evaluation of pDIFF for the fuzzy logic method
p M A X Theoretical maximum value of DC bus power based on the wind velocity curve in Figure 11a
p M I N Theoretical minimum value of DC bus power based on the wind velocity curve in Figure 11a

References

  1. American Wind Energy Association. Available online: http://www.awea.org (accessed on 14 March 2018).
  2. Carbon Trust. Small-Scale Wind Energy: Policy Insights and Practical Guidance; Carbon Trust: London, UK, 2008. [Google Scholar]
  3. Abdullah, M.A.; Yatim, A.H.M.; Tan, C.W.; Saidur, C.W. A review of maximum power point tracking algorithms for wind energy systems. Renew. Sustain. Energy Rev. 2012, 16, 3220–3227. [Google Scholar] [CrossRef]
  4. Orlando, N.A.; Liserre, M.; Mastromauro, R.A.; Dell’Aquila, A. A Survey of Control Issues in PMSG-Based Small Wind-Generator Systems. Ind. Inf. 2013, 9, 1211–1221. [Google Scholar] [CrossRef]
  5. Liu, H.L.; Locment, F.; Sechilariu, M. Maximum Power Point Tracking Method for Small Scale Wind Generator Experimental validation. In Proceedings of the SICE 2015 54th Annual Conference, Hangzhou, China, 28–30 July 2015; pp. 864–869. [Google Scholar]
  6. Rahim, A.H.M.A. Optimum relation based maximum power point tracking of a PMSG wind generator through converter controls. In Proceedings of the 7th IET International Conference on Power Electronics, Machines and Drives (PEMD 2014), Manchester, UK, 8–10 April 2014; pp. 1–4. [Google Scholar]
  7. Linus, R.M.; Damodharan, P. Maximum power point tracking method using a modified perturb and observe algorithm for grid connected wind energy conversion systems. IET Renew. Power Gener. 2015, 9, 682–689. [Google Scholar] [CrossRef]
  8. Daili, Y.; Gaubert, J.P.; Rahmani, L. Implementation of a new maximum power point tracking control strategy for small wind energy conversion systems without mechanical sensors. Energy Convers. Manag. 2015, 97, 298–306. [Google Scholar] [CrossRef]
  9. Vijayakumar, K.; Kumaresan, N.; Ammasaigounde, N. Speed sensor-less maximum power point tracking and constant output power operation of wind-driven wound rotor induction generators. IET Power Electron. 2015, 8, 33–46. [Google Scholar] [CrossRef]
  10. Al-Ghossini, H.; Locment, F.; Sechilariu, M. Experimental comparison of small wind turbine vector control with and without position sensor—Extended Kalman filter application. In Proceedings of the 15th European Conference on Power Electronics and Applications, Lille, France, 2–6 September 2013; pp. 1–9. [Google Scholar]
  11. Al-Ghossini, H.; Liu, H.L.; Locment, F.; Sechilariu, M. Estimation of speed rotation for MPPT used by small scale wind generator integrated in DC microgrid. In Proceedings of the 40th Annual Conference of the IEEE Industrial Electronics Society, Dallas, TX, USA, 29 October–1 November 2014; pp. 1–6. [Google Scholar]
  12. Qi, Z.; Lin, E. Integrated power control for small wind power system. Power Sources 2012, 217, 322–328. [Google Scholar] [CrossRef]
  13. Dalala, Z.M.; Ullah Zahid, Z.; Lai, J.S. New Overall Control Strategy for Small-Scale WECS in MPPT and Stall Regions with Mode Transfer Control. Energy Convers. 2013, 28, 1082–1092. [Google Scholar] [CrossRef]
  14. Yin, X.; Lin, Y.; Li, W.; Liu, H.; Gu, Y. Output power control for hydro-viscous transmission based continuously variable speed wind turbine. Renew. Energy 2014, 72, 395–405. [Google Scholar] [CrossRef]
  15. Cheng, J.; Chen, J.; Gong, C.; Deng, X. Energy management and power control for a stand-alone wind energy conversion system. In Proceedings of the IECON 2012—38th Annual Conference on IEEE Industrial Electronics Society, Montreal, QC, Canada, 25–28 October 2012; pp. 989–994. [Google Scholar]
  16. Joanne, H.; Alireza, B.; Praveen, J. Power management supervisory control algorithm for standalone wind energy systems. In Proceedings of the 2014 IEEE 36th International Telecommunications Energy Conference (INTELEC), Vancouver, BC, Canada, 28 September–2 October 2014; pp. 1–6. [Google Scholar]
  17. Mohseni, M.; Islam, S.M.; Masoum, M.A.S. Enhanced Hysteresis-Based Current Regulators in Vector Control of DFIG Wind Generators Power Electronics. Power Electron. 2011, 26, 223–234. [Google Scholar] [CrossRef]
  18. Liu, H.L.; Locment, F.; Sechilariu, M. Experimental analysis of impact of Maximum Power Point Tracking methods on energy efficiency for small scale wind energy conversion system. IET Renew. Power Gener. 2016, 11, 389–397. [Google Scholar] [CrossRef]
  19. Houssamo, I.; Locment, F.; Sechilariu, M. Experimental analysis of impact of MPPT methods on energy efficiency for photovoltaic power systems. Int. J. Electr. Power Energy Syst. 2013, 46, 98–107. [Google Scholar] [CrossRef]
Figure 1. (a) Test bench electric scheme; (b) Image of the test bench; (c) Power coefficient function.
Energies 11 01217 g001
Figure 2. (a) Aerodynamic power p A E R O and electrical power p B U S based on the DC bus voltage u B U S ; (b) Aerodynamic power p A E R O and electrical power p B U S based on the DC bus current i B U S ; (c) Aerodynamic power p A E R O based on power p B U S .
Energies 11 01217 g002
Figure 3. (a) u B U S response of hysteresis controller; (b) Enlarged u B U S response; (c) Experimental evolution of i A , i B , i C and i B U S ; (d) Experimental evolution of u A , u B , u C ; (e) Experimental evolution enlarged of i A , i B , i C and i B U S ; (f) Experimental evolution enlarged of u A , u B , u C .
Energies 11 01217 g003
Figure 4. Relationship between voltage step input, power response and regulation time.
Energies 11 01217 g004
Figure 5. Power controlling strategies.
Energies 11 01217 g005
Figure 6. (a) Operating regions for power limited control (PLC) case; (b) Operating regions for maximum power point tracking (MPPT) case.
Energies 11 01217 g006
Figure 7. Fixed step-size: (a) wind velocity profile; (b) evaluations of p B U S ; (c) evaluations of u B U S ; (d) evaluations of Δ u .
Energies 11 01217 g007
Figure 8. Canonical Newton–Raphson method: (a) Evaluations of p B U S ; (b) Evaluations of u B U S ; (c) Evaluations of Δ u .
Energies 11 01217 g008
Figure 9. Fuzzy logic: (a) structure of fuzzy logic; (b) membership of e1; (c) membership of e2; (d) membership of s; (e) surface of fuzzy reasoning role.
Energies 11 01217 g009
Figure 10. (a) Evaluations of p B U S ; (b) Evaluations of u B U S ; (c) Evaluations of Δ u .
Energies 11 01217 g010
Figure 11. Profile of: (a) the selected v ; (b) p M A X , p M I N and p L I M .
Energies 11 01217 g011
Figure 12. Evaluations of experimental results for selected test: (a) evaluation of p B U S ; (b) evaluation of u B U S ; (c) evaluation of Δ u ; (d) evaluation of p D I F F .
Energies 11 01217 g012
Table 1. Detailed information of equipment. PMSM: permanent magnet synchronous machine; PEL: programmable electronic load.
EquipmentType
Three-phase driverParker C3S063V2F10
PMSMParker NX430EAJR7000
Three-phase diode bridgeSEMIKRON SKD 51/14
Capacitor C B U S 1 mF
Inductance L 50 mH (267.5 mΩ)
IGBT moduleSEMIKRON SKM100GB063D
PELPuissance+ PL-6000-A
Capacitor C P E L 1.1 mF
Table 2. Definition of four operating regions for PLC case.
VariablesIIIIIIIV
Δ u B U S
Δ p B U S
Δ p D I F F
Table 3. Definition of operating regions for MPPT case.
VariablesIIV
Δ u B U S
Δ p B U S
Δ p D I F F
Table 4. Fuzzy rule table.
se2 (pDIFF)
Negative (n)Zero (z)Positive (p)
e1 (gradi)Big Negative (bn)000
Negative (n)+0
Zero (z)+0
Positive (p)+0
Big Positive (bp)000
Table 5. Means and variances for all power control methods.
MethodMean SamplingVariance SamplingMean OverallVariance Overall
Fixed 10 V0.138314.90450.134739.5348
Variable 7 V0.129621.45070.132626.0033
Fuzzy (10, 20, 7)0.161319.03790.166222.0579

