Article

Energy Performance and Pressure Fluctuation of a Multiphase Pump with Different Gas Volume Fractions

State Key Laboratory of Hydroscience and Engineering, Department of Energy and Power Engineering, Tsinghua University, Beijing 100084, China
*
Author to whom correspondence should be addressed.
Energies 2018, 11(5), 1216; https://doi.org/10.3390/en11051216
Submission received: 14 April 2018 / Revised: 1 May 2018 / Accepted: 2 May 2018 / Published: 10 May 2018

Abstract

:
Large petroleum resources in deep sea, and huge market demands for petroleum need advanced petroleum extraction technology. The multiphase pump, which can simultaneously transport oil and gas with considerable efficiency, has been a crucial technology in petroleum extraction. A numerical approach with mesh generation and a Navier-Stokes equation solution is employed to evaluate the effects of gas volume fraction on energy performance and pressure fluctuations of a multiphase pump. Good agreement of experimental and calculation results indicates that the numerical approach can accurately simulate the multiphase flow in pumps. The pressure rise of a pump decreases with the increasing of flow rate, and the pump efficiency decreases with the increasing of GVF (the ratio of the gas volume to the whole volume). Results show that the dominant frequencies of pressure fluctuation in the impeller and diffuser are eleven and three times those of the impeller rotational frequency, respectively. Due to the larger density of water and centrifugal forces, the water aggregates to the shroud and the gas gathers to the hub, which renders the distribution of GVF in the pump uneven. A vortex develops at the blade suction side, near the leading edge, induced by the leakage flow, and further affects the pressure fluctuation in the impeller. The obvious vortex in the diffuser indicates that the design of the divergence angle of the diffuser is not optimal, which induces flow separation due to large diffusion ratio. A uniform flow pattern in the impeller indicates good hydraulic performance of the pump.

1. Introduction

The fast development of industry has brought unprecedented transformations in the lives of human beings with the rapid pace of the economy. Improving production efficiency and reducing the environmental pollution of energy exploitation have become important issues. The need for exploration of offshore oil resources is urgent due to its huge potential impact on petroleum supply. However, various phases with oil, sea water, gas, and so on coexist in crude oil, which provides a challenge for transportation in a pump. The multiphase pump, which can pump oil and gas together with a high efficiency, is important to the production of oil and gas in the petroleum industry.
The flow in a multiphase pump is complex, and pump performance may be affected by many factors, such as frictional loss [1], corrosive circumstances [2], leakage loss under different inlet gas volume fractions (GVF) [3], and gas pockets [4]. The evaluation of performance reliability can be verified by analyzing pressure rise, head, efficiency, and tip clearance [5]. Furthermore, Yu et al. [6] revealed that there were interphase forces in the gas–liquid flow, including drag force, turbulent dispersion force, virtual mass force, and lift force. Due to the virtual mass force, the pump fluctuation of transient phenomena and the decrease of the pump head were under unsteady conditions [7]. Therefore, evaluation of pressure fluctuation and flow pattern analysis in a multiphase pump is important.
Pressure fluctuation is a common phenomenon in pumps [8], and many scholars have conducted research on multiphase pumps using experimental measurements and numerical simulations. Räbiger et al. [9] investigated pressure fluctuations by evaluating transient signals with pressure sensors in different chambers with GVFs of 90% and 98%. Yu et al. [10] conducted numerical analyses to explore the transport process of a multiphase pump and found that pressure fluctuations were violent in the inlet region. Yu et al. [11] also found that the head of a multiphase pump would decrease at first and then fluctuate periodically under different GVFs. Serena et al. [12] experimentally investigated transient phenomena in multiphase pumps and found that pressure fluctuation amplitude would be higher, and frequency would be lower at a low flow rate. Zhang et al. [13] revealed that a gas pocket developed on the pressure surface of a blade near the hub, which caused the separation of gas and liquid, and, therefore, induced pressure fluctuations. Zhang [14] also found that pressure, shaft power, and liquid volume all fluctuated during the experiment. Tan et al. [15] investigated the pressure fluctuation of a mixed-flow with a T-shape blade. Results showed that the amplitude at the leading edge was maximum. Furthermore, pressure fluctuations and flow patterns under the effect of tip clearance [16,17,18], and the effect of the blade rotational angle [19] were investigated.
Various research studies about the internal flow mechanism and flow patterns have been conducted in recent years. Zhang et al. [20] found that GVF distribution was improved in the hub part after shape optimization of a multiphase pump. They numerically found that a secondary flow could be distinguished. As gas–liquid separation increased, the streamlines in the impeller got closer to the pressure surface, because bubbles gathered at the suction side [21]. Zhang et al. [22] also conducted research on the flow patterns of bubble flow, and found that small bubbles showed a spherical shape, while bigger bubbles showed an ellipsoidal shape. Furthermore, bubble size and number increased as GVF increased. Zhang et al. [4,14,23] found that the flow pattern in the impeller demonstrated isolated bubble flow with GVF = 0.8%, bubbly flow with GVF = 8%, gas pocket flow with GVF = 26%, and segregated gas with GVF = 42%. Results showed that the gas pocket was caused by the massive, intensively-gathered bubbles, and the scale of the gas pocket was different in the respective stages of the multiphase pump. Zhang et al. [24] put forward that the gas distribution would gradually decrease from the inlet region to the outlet region, the GVF of 90% span of the impeller was lower due to the effects of centrifugal force, caused by the rotating impeller. Kim et al. [25] numerically analyzed that bubbles in a multiphase pump were repeatedly damaged as pressure increased, and the liquid was pushed to the shroud because of the centrifugal force. The velocity vectors depicted flow separation swirl in the diffuser. The multiphase pump was optimized to suppress flow separation [26]. Serena et al. [27] conducted visualization experiments to explore instability mechanisms of multiphase pumps, and found that gas gathered at the suction side with a low pressure.
Research on pressure fluctuations and corresponding flow pattern analyses in multiphase pumps under different GVFs is significant with respect to operation stability and efficiency—a reason the influence of different GVFs on pressure fluctuation and flow pattern analyses for multiphase pumps are investigated.

2. Physical Model and Computational Mesh

2.1. Physical Model of a Multiphase Pump

In the present work, a model multiphase pump is selected by referring to Kim [26]. The parameters of the pump are listed in Table 1.
Figure 1 shows the computational domain of the multiphase pump viewed from inlet to outlet, which consists of four parts: Inlet pipe, impeller, diffuser, and outlet pipe. Numerical simulations were conducted in this computational domain under different inlet GVFs.

2.2. Computational Mesh of a Multiphase Pump

A structural mesh was used for the inlet pipe and outlet pipe with hexahedron blocks using ICEM 14.5 (ANSYS Inc., Pittsburgh, PA, USA), and TurboGrid 14.5 (ANSYS Inc., Pittsburgh, PA, USA) for mesh generation of the impeller and diffuser. The meshes of the impeller and diffuser were firstly created as a single channel, and then periodically rotated around the z-axis to generate the whole mesh. Figure 2 shows the mesh details of the impeller and diffuser, where the O-Block topology and blade refinement were used for the purpose of high simulation precision.

2.3. Data Collection Sites Setting

Figure 3 shows the data collection sites in the multiphase pumps. Five data collection sites at the blade pressure side (IPS1-IPS5) were set in the impeller, and five data collection sites at the vane pressure side (DPS1-DPS5) were set in the diffuser, respectively.

3. Numerical Methods and Setting

3.1. Numerical Methods

Numerical simulations of multiphase pumps were conducted using the computation fluid dynamics software, CFX 14.5 (ANSYS Inc., Pittsburgh, PA, USA). In the calculations, the liquid phase was considered as a continuous fluid and the gas phase was considered as a dispersed fluid. The Navier-Stokes equations with sthe hear stress transport (SST) model, suitable for the calculation of instability conditions, was chosen to solve the steady and transient flows of liquids under different gas volume fractions. The static pressure inlet was set as the inlet boundary condition, while the mass flow rate was set at the pump outlet according to experimental measurements. The physical walls in a multiphase pump were taken as no-slip walls, and the scalable wall function was chosen to simulate the flow near the wall. To couple the rotational and stationary parts, the frozen rotor and transient rotor stator methods were used in steady and unsteady numerical simulations [8,19], respectively. The steady simulations were defined as a convergence when the value of root-mean-square residual was under 10−5. Unsteady simulations were then conducted with the results of the steady simulations [28,29,30]. Initially, the time step was determined in accordance with impeller rotation Ti = 60/3600 = 8.6806 × 10⁻⁵ s, and then the time step independence evaluation was carried out based on time steps of Ti/96, Ti/192, Ti/384. In calculations, the value of GVF was set at the pump inlet. For example, for GVF = 5%, the volume fractions of gas and liquid was set as 0.05 and 0.95, respectively.

3.2. Independence Test of Mesh Number

It was significant to choose a reasonable mesh to conduct numerical simulations for the purpose of saving time and computational resources; therefore, five sets of mesh were used in the mesh independence test. The total elements of each mesh varied from 1,153,560 to 4,654,173, and Table 2 shows the elements of each computational domain, respectively. Pressure rise pr was defined as follows:
pr = p2p1
where p2 is the pressure at the multiphase pump outlet, and p1 is the pressure at the pump inlet.
The definition of efficiency η is the ratio of actual head H to theoretical head Ht, as follows:
η = H/Ht
where actual head H is defined as:
H = (p2p1)/ρmultig
ρmulti = GVF × ρgas + (1 − GVF) × ρliquid
where ρmulti, ρgas and ρliquid are the densities of multiphase, gas, and liquid, respectively.
In addition, the theoretical head Ht is defined as:
Ht = (M × ω)/ρmultiQg
where M is the torque, ω is the angular speed of the rotational impeller, and Q is the flow rate.
The results in Table 2 indicate that the difference in pump pressure rise and efficiency variation was slight, with Δpr/pr1 ≤ 0.001 and Δη/η1 ≤ 0.01, where pr1 is the pressure rise of mesh 1, Δpr is the pressure rise difference between each set of mesh and mesh 1, η1 is the efficiency of mesh 1 and Δη is the efficiency difference between each set of mesh and mesh 1. Finally, mesh 4 with 3,494,153 elements is chosen in the following simulations.

3.3. Independence Test of Time Steps

Time steps of 1.7361 × 10⁻⁴ s, 8.6806 × 10⁻⁵ s and 4.3403 × 10⁻⁵ s, corresponding with Ti/96, Ti/192 and Ti/384 were employed to conduct an independence test of time steps. Figure 4 shows the pressure fluctuations in DPS2, DPS3 and DPS4, which were located at the pressure side of the vane. The curves among the three data collection sites indicated that the discrepancy of these points was tiny. The time step of 8.6806 × 10⁻⁵ s was, consequently, selected for the following simulations.

3.4. Simulation Validation

Experimental data of pressure rise and pump efficiency under GVF = 0%, 5%, 10%, and 15% and different flow rates [26] were used to compare with the numerical simulations. Figure 5 shows that numerical results were in remarkable agreement with the experimental data, which demonstrates the high reliability and accuracy of the numerical simulations.

4. Result and Discussion

4.1. Energy Performance

Figure 5 shows the variations in pump efficiency and pressure rise under different GVFs. Results revealed that pressure rises presented a decreasing trend with the increase in flow rates for GVF = 0%, 5%, 10%, and 15%. The pump efficiency gradually increases in the range of 0.4 Qd to 1.1 Qd, and then it decreases from 1.1 Qd to 1.2 Qd. For the same flow rate, the pressure rise and efficiency both decreased with the increase of GVFs, which indicated that GVF had a great impact on the energy performance of a multiphase pump. Under design flow rates, the pressure rises were 198.79 kPa, 190.75 kPa, 178.42 kPa, and 156.99 kPa for GVF = 0%, 5%, 10%, and 15%, respectively. In comparison of pressure rise for GVF = 0%, the pressure rises of pump decreased by 4.04%, 10.25% and 21.03% for GVF = 5%, 10% and 15%, respectively. The efficiencies were 62.73%, 60.61%, 56.73% and 54.19% for GVF = 0%, 5%, 10% and 15%, respectively. In comparison of efficiency for GVF = 0%, the efficiencies of pump dropped by 3.38%, 9.56% and 13.61% for GVF = 5%, 10% and 15%, respectively.

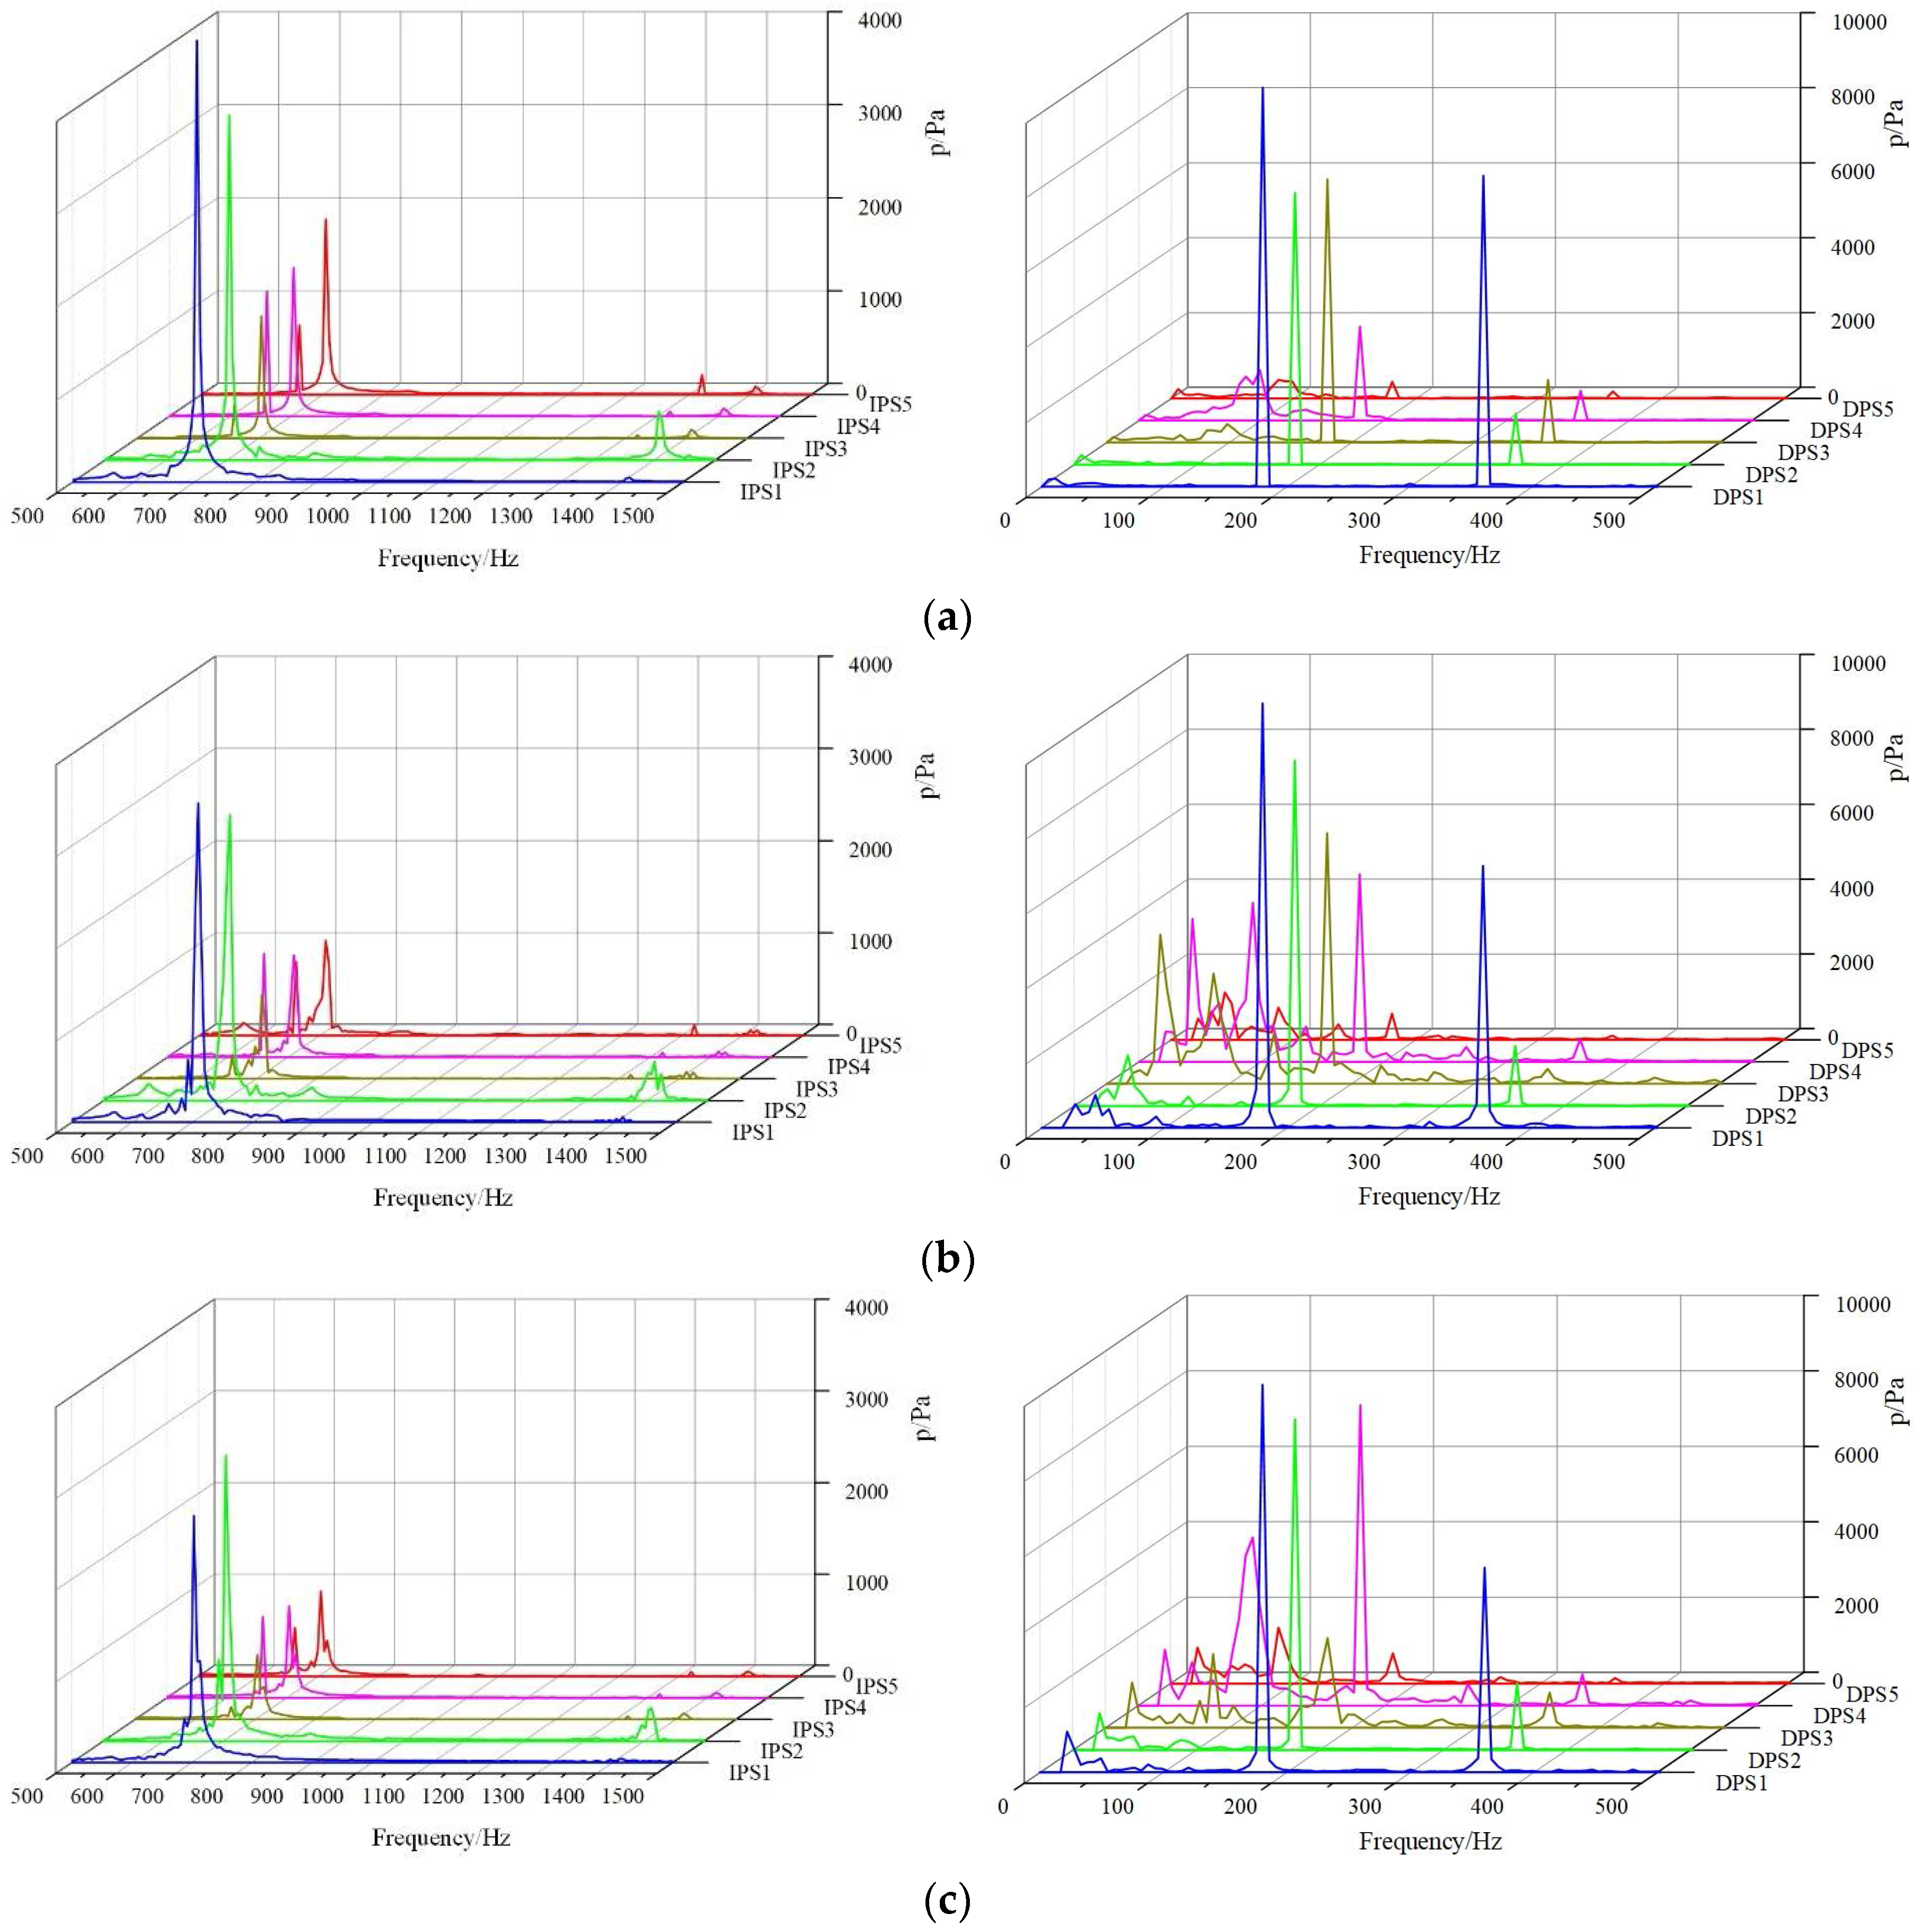
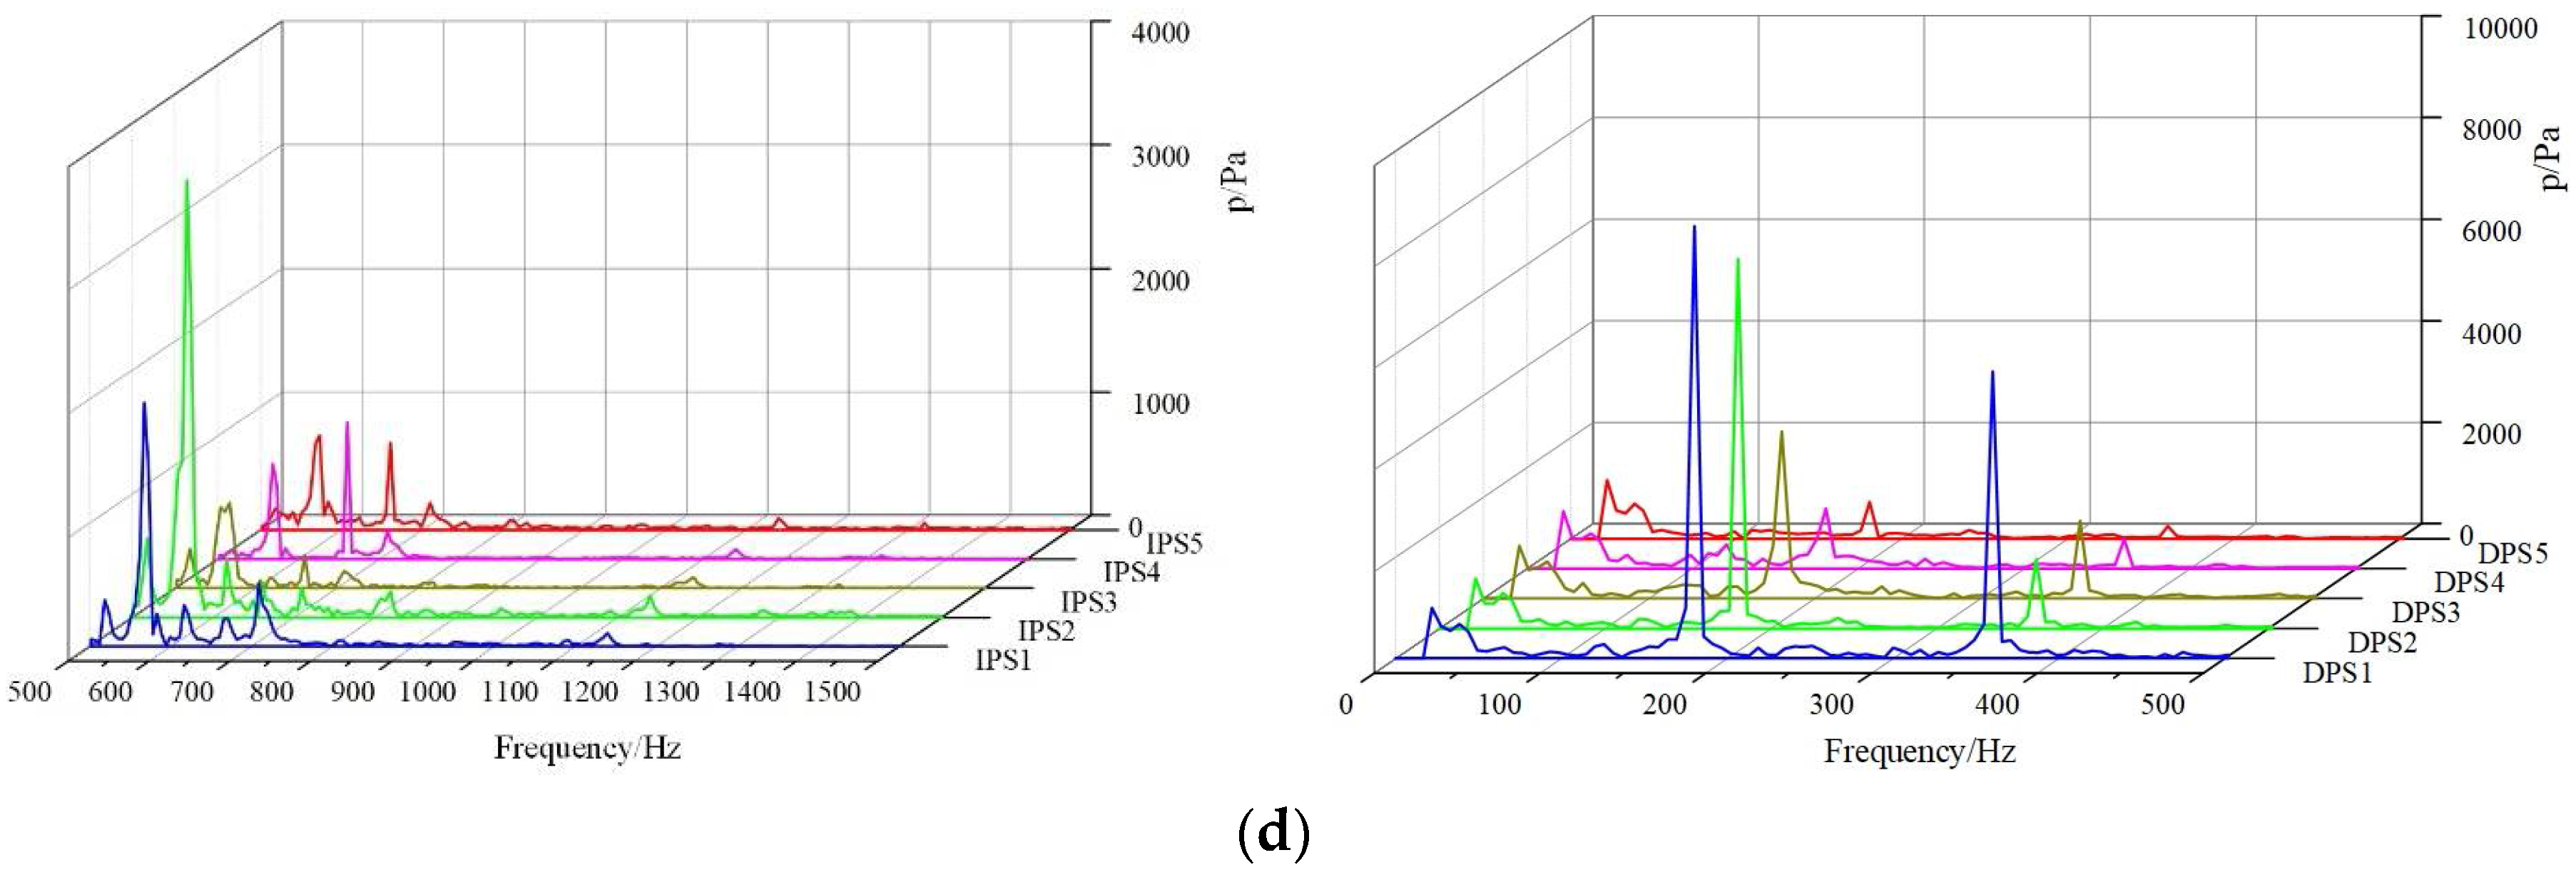
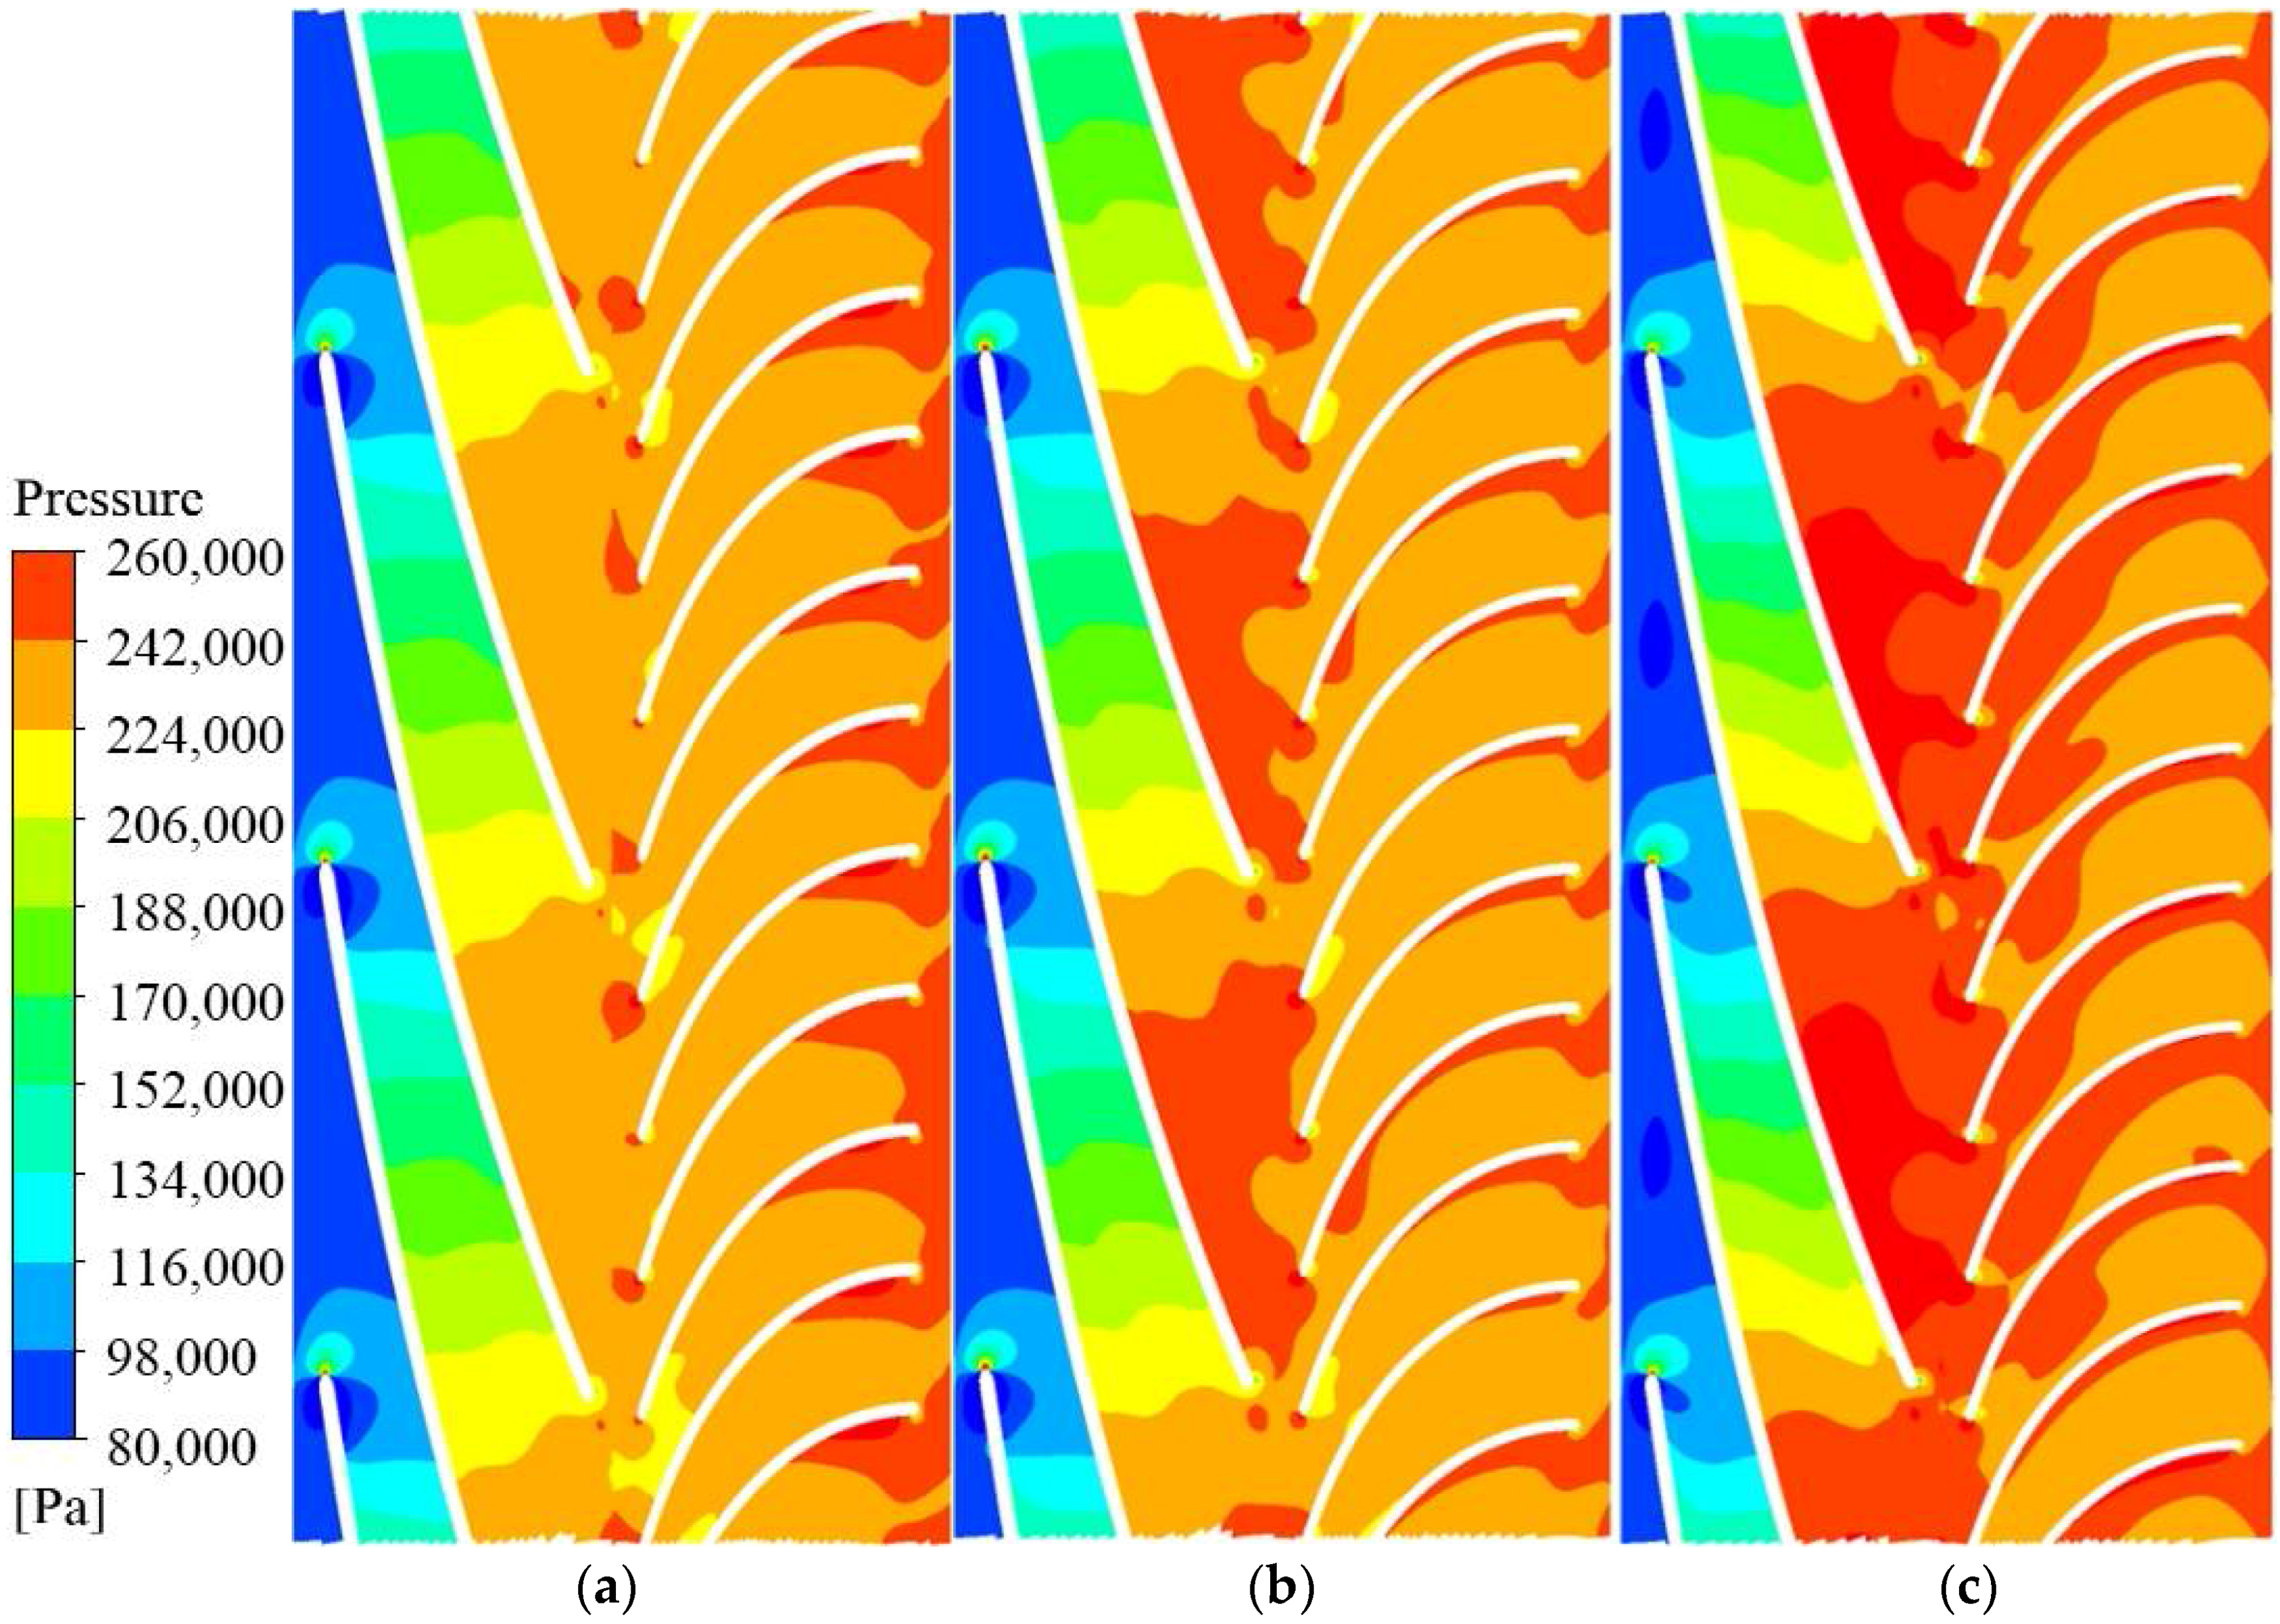
4.2. Pressure Fluctuation

Figure 6 shows the frequency spectra of pressure fluctuations on IPS1-IPS5 and DPS1-DPS5 under different GVFs at 1.0 Qd. Obviously, the amplitudes of pressure fluctuations in the diffuser are stronger than those in the impeller, because the pressure rises from impeller to diffuser. The amplitudes of pressure fluctuations on IPS1-IPS2 and DPS1-DPS2 are higher than that on the other points, and the reason can be ascribed to the flow impact at the impeller inlet and diffuser inlet.
In the impeller, the dominant frequency for most cases is 660 Hz, which is eleven times fi and related to the vane number of eleven. In the diffuser, the dominant frequency for most cases is 180 Hz, which is three times impeller rotation frequency fi and is related to the blade number of three. There are other dominant frequencies, such as 703.64 Hz for GVF = 0%, 709.09 Hz for GVF = 5%, 703.64 Hz for GVF = 10% and 567.27 Hz for GVF = 15%. This phenomenon that the dominant frequencies were larger than 660 Hz can be ascribed to the tip clearance of the impeller, which has a great impact on the frequency of pressure fluctuations and results in higher dominant frequencies [31].
Figure 7 shows the pressure fluctuation amplitudes of IPS1-IPS5 on the dominant frequency and the secondary frequency.
For the dominant frequency, the amplitudes generally decrease with the increasing of GVF. The obvious decrease of amplitude on point IPS1 from 4747.59 Pa to 1968.70 Pa can be observed, because the impact effect at blade inlet varies with the GVF. In the middle position of the impeller, the amplitude of IPS3 is the minimum. The reason is that the mixing of water and gas is sufficient, and the flow pattern is relatively even in this position. For IPS5 at the impeller outlet, the amplitude increases due to the rotor-stator interaction between impeller and diffuser. For the secondary frequency, it also presents the similar trend on IPS1 to IPS5. The amplitudes of IPS3, IPS4 and IPS5 are lower than that of IPS2 by an average of 73.25%, 77.76% and 75.54%, respectively. The overall amplitudes of the secondary frequency are much smaller than that of the dominant frequency.
Figure 8 shows the pressure fluctuation amplitudes of DPS1-DPS5 on the dominant frequency and secondary frequency. The variation trends of amplitudes are similar for different GVFs, and the differences of amplitudes are small for different GVFs. Generally, the amplitudes decrease from the diffuser inlet to outlet, because the two-phase flow becomes uniform due to the rectification of the diffuser. Therefore, the GVF plays an important role on the reducing pressure fluctuation in the diffuser.
Figure 9 shows the blade-to-blade view of the pressure distribution at the 10%, 50%, 90% blade heights under GVF = 15%. The pressure rises at different blade heights are different, which indicates that the work ability of the impeller from hub to shroud is different. At the shroud, the pressure is higher than that at the hub, which indicates that the work ability at the shroud is stronger. A violent variation of pressure appears at the impeller inlet and diffuser inlet, which induces higher amplitudes of pressure fluctuations as shown in Figure 7 and Figure 8.

4.3. Gas Volume Fraction

Figure 10 shows the GVF distribution in the impeller and diffuser under different GVFs. In the impeller, the GVF near the hub is higher than that near the shroud. The reason for this is that the density of water is greater than that of gas, so the centrifugal force on water is stronger and pushes the water to the shroud. At the blade outlet, a local region with a high GVF appears due to the wake-jet flow pattern, which can also strengthen the amplitude of pressure fluctuations at point IPS5. In the diffuser, the centrifugal force disappears, so the multiphase of water and gas becomes even.

4.4. Vortex Structure

Figure 11 shows the vortex structures at the blade leading edge and the trailing edge under different GVFs. Obviously, the vortex strengthens with the increase of GVFs at the blade inlet, as shown in Figure 11a–c. At the blade inlet, the vortex mainly develops at the blade suction side, because the leakage flow passes across the blade tip clearance to the suction side. The leakage vortex disturbs the flow pattern in the impeller, especially at the impeller inlet, which makes the amplitudes of pressure fluctuations on IPS1 and IPS2 greater than other points. The vortex at the blade outlet also strengthens with the increasing of GVFs, which will further influence the pressure fluctuations in the diffuser.

4.5. Velocity Distribution

Figure 12 shows the blade-to-blade view of the velocity distribution at 10%, 50% and 90% blade heights under GVF = 15%.
The velocity distributions at different blade heights are different, which is related to the distributions of pressure and GVF. The velocity gradually increases in the impeller due to the energy input, while the velocity in the diffuser gradually decreases because the function of the diffuser is to convert kinetic energy into pressure energy. When the multiphase passes into the stationary diffuser, the rotational inertia of multiphase still exists, so the velocity at the pressure side of the vane is larger than that at suction side.
Figure 13 shows the streamline distribution in the impeller and diffuser under different GVFs. The streamlines in the impeller are smooth for different GVFs, which indicates good hydraulic performance of the impeller. While in the diffuser, an obvious vortex appears near the diffuser outlet, the reason is that the divergence angle of the diffuser is too large and then induces the flow separation and vortex. The vortex intensity strengthens as GVF increases.

5. Conclusions

Based on experimental results, the accuracy of the numerical simulations on multiphase pumps was validated. The pressure fluctuations and flow patterns in a multiphase pump at 1.0 Qd under different GVFs were investigated. The following conclusions can be drawn:
(1)
The pressure rise decreases with the increase in flow rate, and the pressure rise and efficiency both decrease with the increase of GVFs.
(2)
The dominant frequency of pressure fluctuations in the impeller are eleven times those of the impeller rotational frequency, and the dominant frequency of the pressure fluctuations in the diffuser are three times those of the impeller rotational frequency. GVF has a great influence on the pressure fluctuations of the dominant frequency, but little impact on the secondary frequency.
(3)
Due to the larger density of water and the centrifugal force, the water is pushed to the shroud, which makes the GVF near the hub higher. A vortex develops at the blade suction side near the leading edge, induced by the leakage flow, and further affects the pressure fluctuation in the impeller. An obvious vortex in the diffuser indicates that the design of the divergence angle of the diffuser is not correct, which induces flow separation due to the large diffusion ratio.

Author Contributions

Jinsong Zhang and Lei Tan proposed the simulation method; Jinsong Zhang completed the numerical simulations; Jinsong Zhang and Lei Tan analyzed the data and wrote the paper.

Acknowledgments

This work has been supported by the National Natural Science Foundation of China [Grant number 51741906], the State Key Laboratory of Hydroscience and Engineering [Grant number 2018-KY-02], the Open Research Fund Program of State Key Laboratory of Hydroscience and Engineering [Grant number sklhse-2018-E-01], the Key Laboratory of Fluid and Power Machinery (Xihua University), Ministry of Education [Grant number szjj-2017-100-1-004].

Conflicts of Interest

The authors declare no conflicts of interest.

References

  1. Yang, X.; Qu, Z.; Wu, Y. Frictional Loss Studies and Experimental Performance of a New Synchronal Rotary Multiphase Pump. J. Fluids Eng. 2011, 133, 041303. [Google Scholar] [CrossRef]
  2. Hoehbusch, J.; Bucher, S.; Haensel, H.; Scholten, J. Evaluation of the fatigue strength of multiphase pump components under corrosive conditions using a short crack fracture mechanics approach. Eng. Fail. Anal. 2015, 47, 265–272. [Google Scholar] [CrossRef]
  3. Yang, X.; Qin, Y.; Qu, Z. Leakage Loss Study of a Synchronal Rotary Multiphase Pump with a Full Range of Inlet Gas Volume Fractions. J. Fluids Eng. 2016, 138, 071301. [Google Scholar] [CrossRef]
  4. Zhang, J.Y.; Li, Y.J.; Cai, S.J.; Zhu, H.W.; Zhang, Y.X. Investigation on the gas pockets in a rotodynamic multiphase pump. In IOP Conference Series: Materials Science and Engineering; IOP Publishing: Bristol, UK, 2016; Volume 129, p. 012007. [Google Scholar]
  5. Kim, J.H.; Lee, H.C.; Kim, J.H.; Lee, Y.K.; Choi, Y.S. Reliability Verification of the Performance Evaluation of Multiphase Pump. Int. J. Mech. Aerosp. Ind. Mech. Eng. 2014, 24, 1782–1786. [Google Scholar] [CrossRef]
  6. Yu, Z.Y.; Zhu, B.S.; Cao, S.L. Interphase force analysis for air-water bubbly flow in a multiphase rotodynamic pump. Eng. Comput. 2015, 32, 2166–2180. [Google Scholar] [CrossRef]
  7. Yu, Z.; Zhu, B.; Cao, S.; Liu, Y. Effect of Virtual Mass Force on the Mixed Transport Process in a Multiphase Rotodynamic Pump. Adv. Mech. Eng. 2014, 6, 958352. [Google Scholar] [CrossRef]
  8. Liu, Y.; Tan, L.; Liu, M.; Hao, Y.; Xu, Y. Influence of Prewhirl Angle and Axial Distance on Energy Performance and Pressure Fluctuation for a Centrifugal Pump with Inlet Guide Vanes. Energies 2017, 10, 695. [Google Scholar] [CrossRef]
  9. Räbiger, K.; Maksoud, T.M.; Ward, J.; Hausmann, G. Theoretical and experimental analysis of a multiphase screw pump, handling gas–liquid mixtures with very high gas volume fractions. Exp. Therm. Fluid Sci. 2008, 32, 1694–1701. [Google Scholar] [CrossRef]
  10. Yu, Z.Y.; Zhang, Q.Z.; Huang, R.; Cao, S.L. Numerical analysis of gas-liquid mixed transport process in a multiphase rotodynamic pump. In IOP Conference Series: Earth and Environmental Science; IOP Publishing: Bristol, UK, 2012; Volume 15, p. 032062. [Google Scholar]
  11. Yu, Z.Y.; Zhu, B.S.; Cao, S.L.; Wang, G.Y. Application of two-fluid model in the unsteady flow simulation for a multiphase rotodynamic pump. In IOP Conference Series: Materials Science and Engineering; IOP Publishing: Bristol, UK, 2013; pp. 257–260. [Google Scholar]
  12. Serena, A.; Bakken, L.E. Flow Visualization of Unsteady and Transient Phenomena in a Mixed-Flow Multiphase Pump. ASME. In Proceedings of the ASME Turbo Expo 2016: Turbomachinery Technical Conference and Exposition, Seoul, Korea, 13–17 June 2016. [Google Scholar]
  13. Zhang, J.; Zhu, H.; Yang, C.; Li, Y.; Wei, H. Multi-objective shape optimization of helico-axial multiphase pump impeller based on NSGA-II and ANN. Energy Convers. Manag. 2011, 52, 538–546. [Google Scholar] [CrossRef]
  14. Zhang, J.; Li, Y.; Cai, S.; Zhu, H.; Zhang, Y. Investigation of gas-liquid two-phase flow in a three-stage rotodynamic multiphase pump via numerical simulation and visualization experiment. Adv. Mech. Eng. 2016, 52, 8–14. [Google Scholar] [CrossRef]
  15. Tan, L.; Xie, Z.F.; Liu, Y.B. Influence of T-shape tip clearance on performance of a mixed-flow pump. Proc. Inst. Mech. Eng. A J. Power Energy 2017, 095765091773312. [Google Scholar] [CrossRef]
  16. Liu, Y.B.; Tan, L.; Hao, Y. Energy performance and flow patterns of a mixed-flow pump with different tip clearance sizes. Energies 2017, 10, 191. [Google Scholar] [CrossRef]
  17. Xu, Y.; Tan, L.; Liu, Y.; Cao, S. Pressure fluctuations and flow pattern of a mixed-flow pump with different blade tip clearances under cavitation condition. Adv. Mech. Eng. 2017, 9, 1–12. [Google Scholar] [CrossRef]
  18. Hao, Y.; Tan, L.; Liu, Y.; Xu, Y.; Zhang, J.; Zhu, B. Energy performance and radial force of a mixed-flow pump with symmetrical and unsymmetrical tip clearances. Energies 2017, 10, 57. [Google Scholar] [CrossRef]
  19. Tan, L.; Yu, Z.Y.; Xu, Y. Role of blade rotational angle on energy performance and pressure fluctuations of a mixed-flow pump. Proc. Inst. Mech. Eng. A J. Power Energy 2017, 231, 227–238. [Google Scholar] [CrossRef]
  20. Zhang, J.; Zhu, H.; Li, Y.; Yang, C. Shape Optimization of Helico-axial Multiphase Pump Impeller Based on Genetic Algorithm. In Proceedings of the International Conference on Natural Computation, Tianjin, China, 14–16 August 2009; pp. 408–412. [Google Scholar]
  21. Zhang, J.Y.; Zhu, H.W.; Ding, K.; Qiang, R. Study on measures to improve gas-liquid phase mixing in a multiphase pump impeller under high gas void fraction. In IOP Conference Series: Earth and Environmental Science; IOP Publishing: Bristol, UK, 2012. [Google Scholar]
  22. Zhang, J.; Cai, S.; Zhu, H.; Zhang, Y. Experimental Investigation of the Flow at the Entrance of a Rotodynamic Multiphase Pump by Visualization. J. Pet. Sci. Eng. 2015, 126, 254–261. [Google Scholar] [CrossRef]
  23. Zhang, J.; Cai, S.; Li, Y.; Zhu, H.; Zhang, Y. Visualization study of gas–liquid two-phase flow patterns inside a three-stage rotodynamic multiphase pump. Exp. Therm. Fluid Sci. 2016, 70, 125–138. [Google Scholar] [CrossRef]
  24. Zhang, Y.; Zhang, J.; Zhu, H.; Cai, S. 3D Blade Hydraulic Design Method of the Rotodynamic Multiphase Pump Impeller and Performance Research. Adv. Mech. Eng. 2014, 6, 1–10. [Google Scholar] [CrossRef]
  25. Kim, J.H.; Lee, H.C.; Yoon, J.Y.; Lee, K.Y.; Lee, Y.K.; Choi, Y.S. Multi Objective Optimization of a Multiphase Pump for Offshore Plants. In Proceedings of the ASME 2014 4th Joint Us-European Fluids Engineering Division Summer Meeting, Chicago, IL, USA, 3–7 August 2014. [Google Scholar]
  26. Kim, J.H.; Lee, H.C.; Kim, J.H.; Choi, Y.S.; Yoon, J.Y.; Yoo, I.S.; Choi, W.C. Improvement of Hydrodynamic Performance of a Multiphase Pump Using Design of Experiment Techniques. J. Fluids Eng. 2015, 137, 081301. [Google Scholar] [CrossRef]
  27. Serena, A.; Bakken, L.E. Design of a Multiphase Pump Test Laboratory Allowing to Perform Flow Visualization and Instability Analysis. In Proceedings of the ASME Power Conference, San Diego, CA, USA, 28 June–2 July 2015. [Google Scholar]
  28. Lei, T.; Shan, Z.B.; Liang, C.S.; Chuan, W.Y.; Bin, W.B. Numerical simulation of unsteady cavitation flow in a centrifugal pump at off-design conditions. Proc. Inst. Mech. Eng. C J. Mech. Eng. 2014, 228, 1994–2006. [Google Scholar] [CrossRef]
  29. Tan, L.; Zhu, B.; Wang, Y.; Cao, S.; Gui, S. Numerical study on characteristics of unsteady flow in a centrifugal pump volute at partial load condition. Eng. Comput. 2015, 32, 1549–1566. [Google Scholar] [CrossRef]
  30. Liu, M.; Tan, L.; Cao, S.L. Design method of controllable blade angle and orthogonal optimization of pressure rise for a multiphase pump. Energies 2018, 11, 1048. [Google Scholar] [CrossRef]
  31. Feng, J.; Luo, X.; Guo, P.; Wu, G. Influence of tip clearance on pressure fluctuations in an axial flow pump. J. Mech. Sci. Technol. 2016, 30, 1603–1610. [Google Scholar] [CrossRef]
Figure 1. Computation domain.
Energies 11 01216 g001
Figure 2. Meshes of impeller and diffuser. (a) Impeller; (b) diffuser.
Energies 11 01216 g002
Figure 3. Data collection sites. (a) Impeller; (b) diffuser.
Energies 11 01216 g003
Figure 4. Independence test of time steps.
Energies 11 01216 g004
Figure 5. Comparison of pump performance between experimental and numerical results. (a) GVF = 0%; (b) GVF = 5%; (c) GVF = 10%; (d) GVF = 15%.
Energies 11 01216 g005
Figure 6. Frequency spectra of pressure fluctuations on IPS1-IPS5 and DPS1-DPS5. (a) GVF = 0%; (b) GVF = 5%; (c) GVF = 10%; (d) GVF = 15%.
Energies 11 01216 g006aEnergies 11 01216 g006b
Figure 7. Amplitudes of pressure fluctuations on IPS1-IPS5. (a) Dominant frequency; (b) secondary frequency.
Energies 11 01216 g007
Figure 8. Amplitudes of pressure fluctuations on DPS1-DPS5. (a) dominant frequency; (b) secondary frequency.
Energies 11 01216 g008
Figure 9. Pressure distribution in impeller and diffuser of different spans under GVF = 15%. (a) span = 0.1; (b) span = 0.5; (c) span = 0.9.
Energies 11 01216 g009
Figure 10. GVF distribution in impeller and diffuser of different spans under GVF = 15%. (a) span = 0.1; (b) span = 0.5; (c) span = 0.9.
Energies 11 01216 g010
Figure 11. Vortex structure at blade leading edge and trailing edge. (a) Leading edge of GVF = 5%; (b) leading edge of GVF = 10%; (c) leading edge of GVF = 15%; (d) trailing edge of GVF = 5%; (e) trailing edge of GVF = 10%; (f) trailing edge of GVF = 15%.
Energies 11 01216 g011aEnergies 11 01216 g011b
Figure 12. Velocity distribution in impeller and diffuser of different spans under GVF = 15%. (a) span = 0.1; (b) span = 0.5; (c) span = 0.9.
Energies 11 01216 g012
Figure 13. Streamline distribution in the impeller and diffuser under different GVFs. (a) GVF = 0%; (b) GVF = 5%; (c) GVF = 10%; (d) GVF = 15%.
Energies 11 01216 g013
Table 1. Parameters of the model multiphase pump.
ComponentItemValue
Multiphase pumpRated volume flow rate Qd (m3/h)100
Rated pressure rise pr (at GVF0 %) (kPa)230
Rated rotational speed n (r/min)3600
ImpellerNumbers of blade Zi3
Tip clearance (mm)0.5
Diameter of impeller inlet D1 (mm)22
Diameter of impeller outlet D2 (mm)15
Tip clearance (mm)0.5
DiffuserNumbers of vane Zd11
Diameter of diffuser inlet D3 (mm)16
Diameter of diffuser outlet D4 (mm)22
Table 2. Multiphase pump pressure rise pr and efficiency η versus mesh elements.
ItemMesh 1Mesh 2Mesh 3Mesh 4Mesh 5
inlet pipe103,132201,780201,780201,780443,916
Impeller367,074819,3241,629,4172,324,4122,784,096
diffuser297,880387,244476,608518,925518,925
outlet pipe107,996201,608201,608449,036907,236
total meshes876,0821,609,9562,509,4133,494,1534,654,173
pr (kPa)190.34196.74197.63198.79198.74
η (%)62.27%62.61%62.70%62.73%62.76%
pr/pr111.03361.03831.04441.0441
η/η111.00551.00691.00741.0079

