Article

Solar Reflector Materials Degradation Due to the Sand Deposited on the Backside Protective Paints

by
Aránzazu Fernández-García
1,*,
Adel Juaidi
2,
Florian Sutter
3,
Lucía Martínez-Arcos
1 and
Francisco Manzano-Agugliaro
4
1
Plataforma Solar de Almería, Senes Road, Km. 4.5, P.O. Box 22, E04200 Tabernas, Almería, Spain
2
Mechanical Engineering Department, An-Najah National University, P.O. Box 7, Nablus, Palestine
3
Deutsches Zentrum für Luft- und Raumfahrt, Institute of Solar Research, PSA, Senes Road, Km. 4.5, P.O. Box 44, E04200 Tabernas, Almería, Spain
4
Department Engineering, University of Almería, Ctra. Sacramento s/n, E04120 La Cañada, Almería, Spain
*
Author to whom correspondence should be addressed.
Energies 2018, 11(4), 808; https://doi.org/10.3390/en11040808
Submission received: 28 February 2018 / Revised: 22 March 2018 / Accepted: 28 March 2018 / Published: 31 March 2018
(This article belongs to the Special Issue Urban Generation of Renewable Energy and Energy Saving in Cities)

Abstract

:
Concentrating solar power (CSP) technologies are foreseen to be a crucial actor in the future renewable energy mix. Soil accumulation on the optical surfaces of CSP plants involves significant expenses of the operation and maintenance activities because a high cleanliness level is required to achieve proper plant revenues. Normally, only the front side of the solar reflectors is cleaned to reflect the maximum possible amount of direct solar radiation towards the receiver. However, soil deposited on the backside of the reflector could provoke degradation and might need to be considered in the cleaning strategy. As this possible degradation has never been studied, this work is dedicated to assess if the backside of reflectors should be regularly cleaned. The influence of the sand in the possible paint degradation depends on its chemical composition and the weather conditions. Therefore, several climatic conditions of artificially soiled reflector samples with different types of sand were simulated in accelerated aging tests. Concerning the results obtained, the ambient conditions simulated by the damp heat and thermal cycling tests were the only ones that produced a significant degradation of the backside paints. Also, the sand from Ouarzazate was responsible for higher deterioration.

Graphical Abstract

1. Introduction

Energy supply might be one of the main financial issues that our society is currently facing. Renewable energies appear to be a meaningful solution because several of the conventional energy resources exploited at present are being depleted [1]. In particular, the MENA region (Middle East and North Africa), where non-renewable energy resources are unsustainable, is suffering a significant increase in energy consumption [2]. This issue has been intensively addressed in recent years, with the implementation of several renewable energy programs [3,4,5], some of them specifically focused on solar energy [6,7]. Solar energy is leading the renewable energy scene because it is both free and endless [8,9]. This importance is also highlighted by the scientific community as the solar energy topic has been addressed more intensively over last three decades [10]. Essentially, there are two techniques to directly harvest energy from the Sun: photovoltaic (PV) solar cells, and solar thermal collectors (STC) [11].
Concentrating solar power (CSP) plants (also named solar thermal electricity, STE, plants) are considered key actors in the renewable energy mix [12,13,14,15], as well as PV technologies [16,17] and non-concentrating solar thermal collectors [18]. According to a report published by the International Energy Agency (IEA) in 2014, 79% of the total electricity generation will be delivered by renewable sources by 2050, and it is expected that STE will represent about 11% [15].
Solar reflectors are a key component in CSP plants because they are the first element that the solar radiation intercepts in the energy conversion process. In a CSP plant, more than the 30% of the overall cost is spent on the solar field, and 6% is related to the investment costs of mirrors. Additional costs arise from the labor costs accrued during the mounting, cleaning tasks, replacement of mirrors due to breakage, etc. [19,20,21]. Besides, the area covered by solar reflectors in a solar power plant is significantly high and involves a large land cost (0.58–1.02 ha of reflective area per MWe produced) [22]. The specular reflectance demanded from solar reflectors must be high across the entire solar spectrum [23]. The current maximum reflectance for silvered-glass reflectors of with a 4-mm thickness is around 0.945, and the target efficiency in the coming decades (2020–2030) is established at 0.950–0.960, using thinner glass mirrors as first surface reflectors [24]. To ensure a high global yield of a CSP plant, this solar reflectance must be maintained during the whole life of the plant [25,26], which is expected to be from 20 to 30 years [27,28].
The European Union published a materials roadmap enabling low carbon energy technologies, which mentions that solar reflectors are associated with numerous requirements with respect to their optical behavior, durability, cost, and environmental concerns. [24,29]. The European Solar Thermal Electricity Association (ESTELA) also published a strategic research agenda (2020–2025), which includes the study of anti-soiling coatings for solar reflectors to reduce water consumption [30]. This paper is focused on the environmental concerns of solar reflectors, and particularly on the goal of reducing the water consumption required to clean the reflective surfaces, as a result of soil accumulation.
In addition to climate conditions (temperature, humidity, solar irradiance, etc.), soiling has been identified as key issue for solar technology reliability [31,32]. To achieve high direct normal irradiance (DNI), CSP plants are often located in arid and semi-arid locations with harsh weather conditions that can involve severe dust deposition, reducing the reflectance and consequently the CSP plant power production [33,34]. Moreover, dust can completely terminate the system operation in some cases [35]. The absorption and scattering of radiation are the two mechanisms responsible for the reflectance reduction caused by dust and soil deposition on the reflectors [34]. In particular, the scattering phenomenon indicates that surface dirtiness affects CSP more seriously than PV plants because CSP mirrors only exploit the DNI [35,36]. In addition, soil accumulation is the main aspect considered in the cleaning strategy. As a routine activity, the operation and maintenance (O&M) staff of CSP plants measures the reflectance of the solar field and washes it regularly, which leads to significant water consumption [37,38].
The soiling of solar reflectors is a recurrent research topic, recently intensified [31]. While some studies address the dust properties [39,40,41,42], others are focused on the reflectance status over time [43,44] or the influence of the location on the soiling level [33,45,46,47]. With respect to soiling modeling, a predictive model was published by Reference [48] and advanced mathematical tools based on dynamic models and time series approaches were proposed in References [34] and [49].
Soil deposits depend on site environment, climatic conditions, and solar field orientation in combination with wind directions [50,51,52]. Consequently, the impact of soiling must be included as a major role when performing the potential exposure site study [53].
Another effect of soiling on CSP plants is the higher probability of solar materials degradation due to the interaction with airborne particles [54,55,56,57,58]. This damage can be both physicochemical and mechanical (scratches and cracks). Mechanical degradation might be due to dust particles traveling at high wind speeds or cleaning activities with contact means. On one hand, the possible mechanical damage due to the interaction with particles traveling by winds is a function of multiple factors, such as particle parameters (size, form/shape, hardness, and density), surface parameters (type of surface and its elasticity), and the sand transport mechanism towards or across the surface (saltation, shifting), in correlation with weather parameters (wind speed and direction and relative humidity) [53,59,60]. On the other hand, contact cleaning is frequently applied to restart solar reflectance, which might provoke mechanical surface degradation [61,62,63].
Finally, soiling may cause additional damage to CSP plants through the degradation of the backside protective paints of silvered-glass reflectors due to chemical interaction with the soil deposition. This crucial aspect has never been specifically addressed until now and it is important not only for the durability of solar reflector materials but also for the water consumption of CSP plants. Generally, the backside of the concentrators is not washed during the solar field cleaning task, but it may be recommended if significant degradation is discovered.
This paper examines the effect of the soil deposits on the backside paints of the silvered-glass reflectors. As this influence may depend on the weather conditions and the chemical composition of the sand, several climatic conditions under the effect of different types of sand (from Dubai and Ouarzazate) were simulated in accelerated aging tests. The aim of the testing procedure under accelerated aging conditions was to identify those tests that are more representative to evaluate the possible deterioration of the back-paint layers due to the sand depositions as well as to distinguish which sand is more aggressive.

2. Materials and Methods

This section is dedicated to describe the material types tested and the methodology applied in this experimental campaign, which was carried out in the Optical Aging Characterization (OPAC) laboratory. This laboratory is located at the Plataforma Solar de Almería (PSA), and is integrated by a research group between German Aerospace Center (DLR) and the Spanish Energy, Environment, and Technology Research Center (CIEMAT). Reflector samples with sand deposited on the backsides were submitted to a set of weathering tests under accelerated aging conditions to analyze the possible degradation of the backside protective paints.

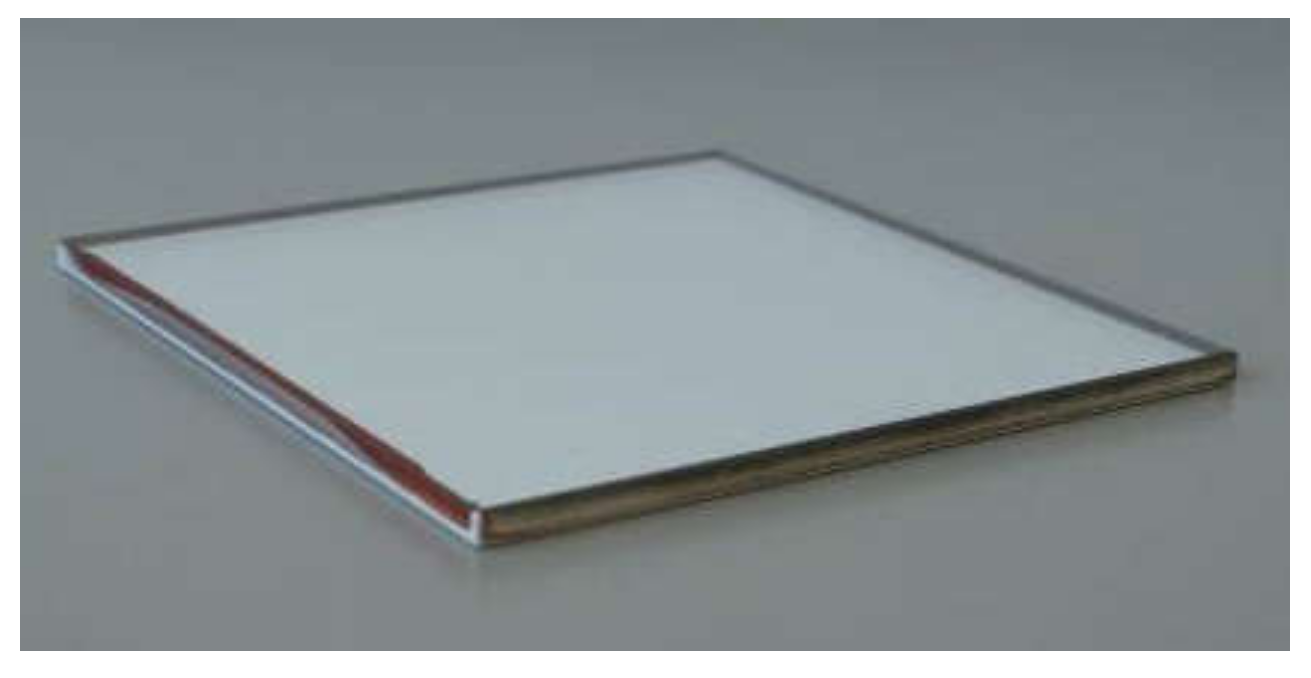
2.1. Reflector Samples
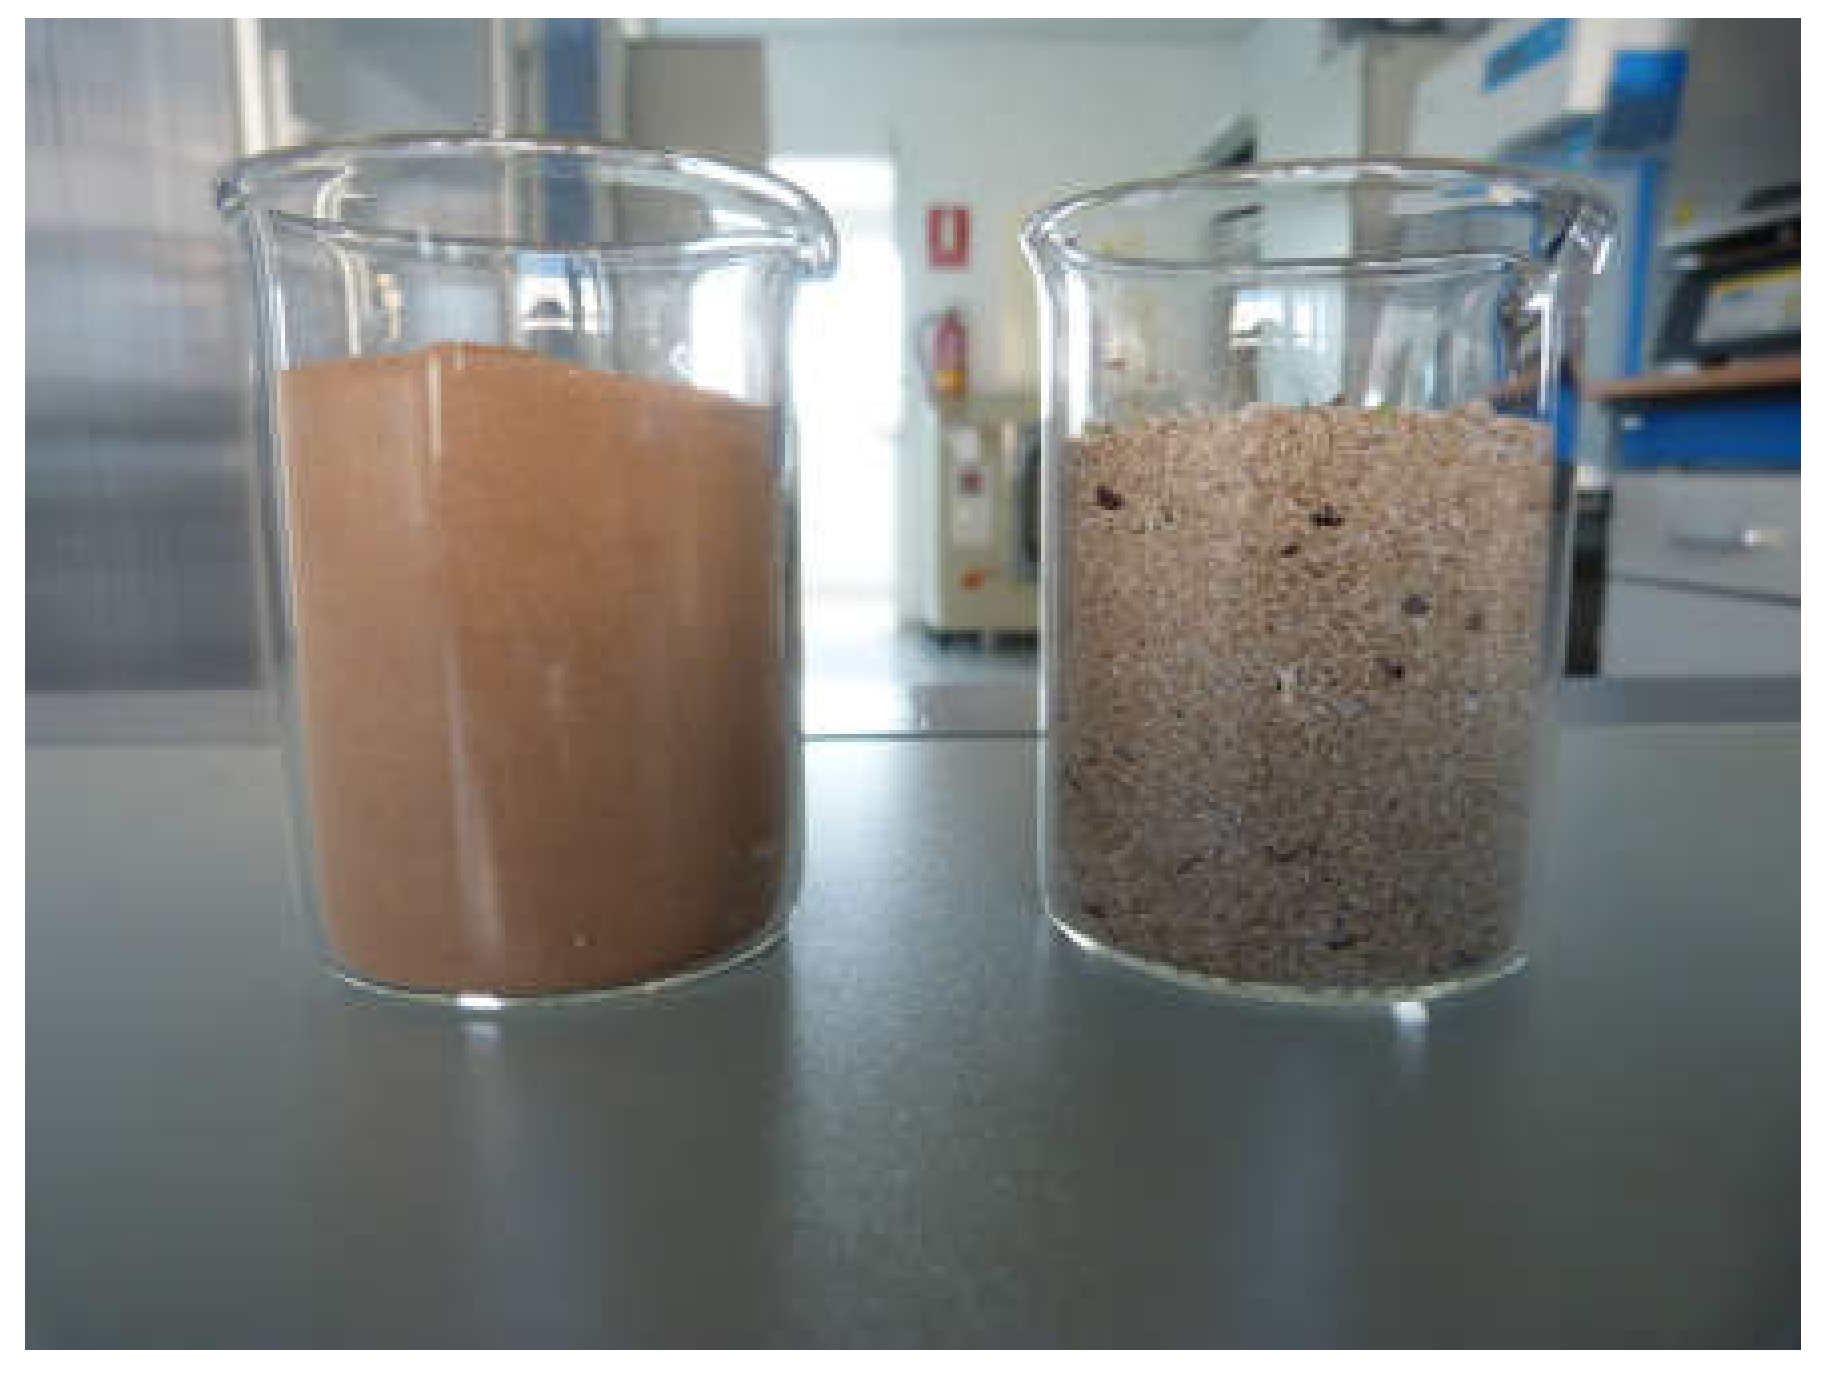
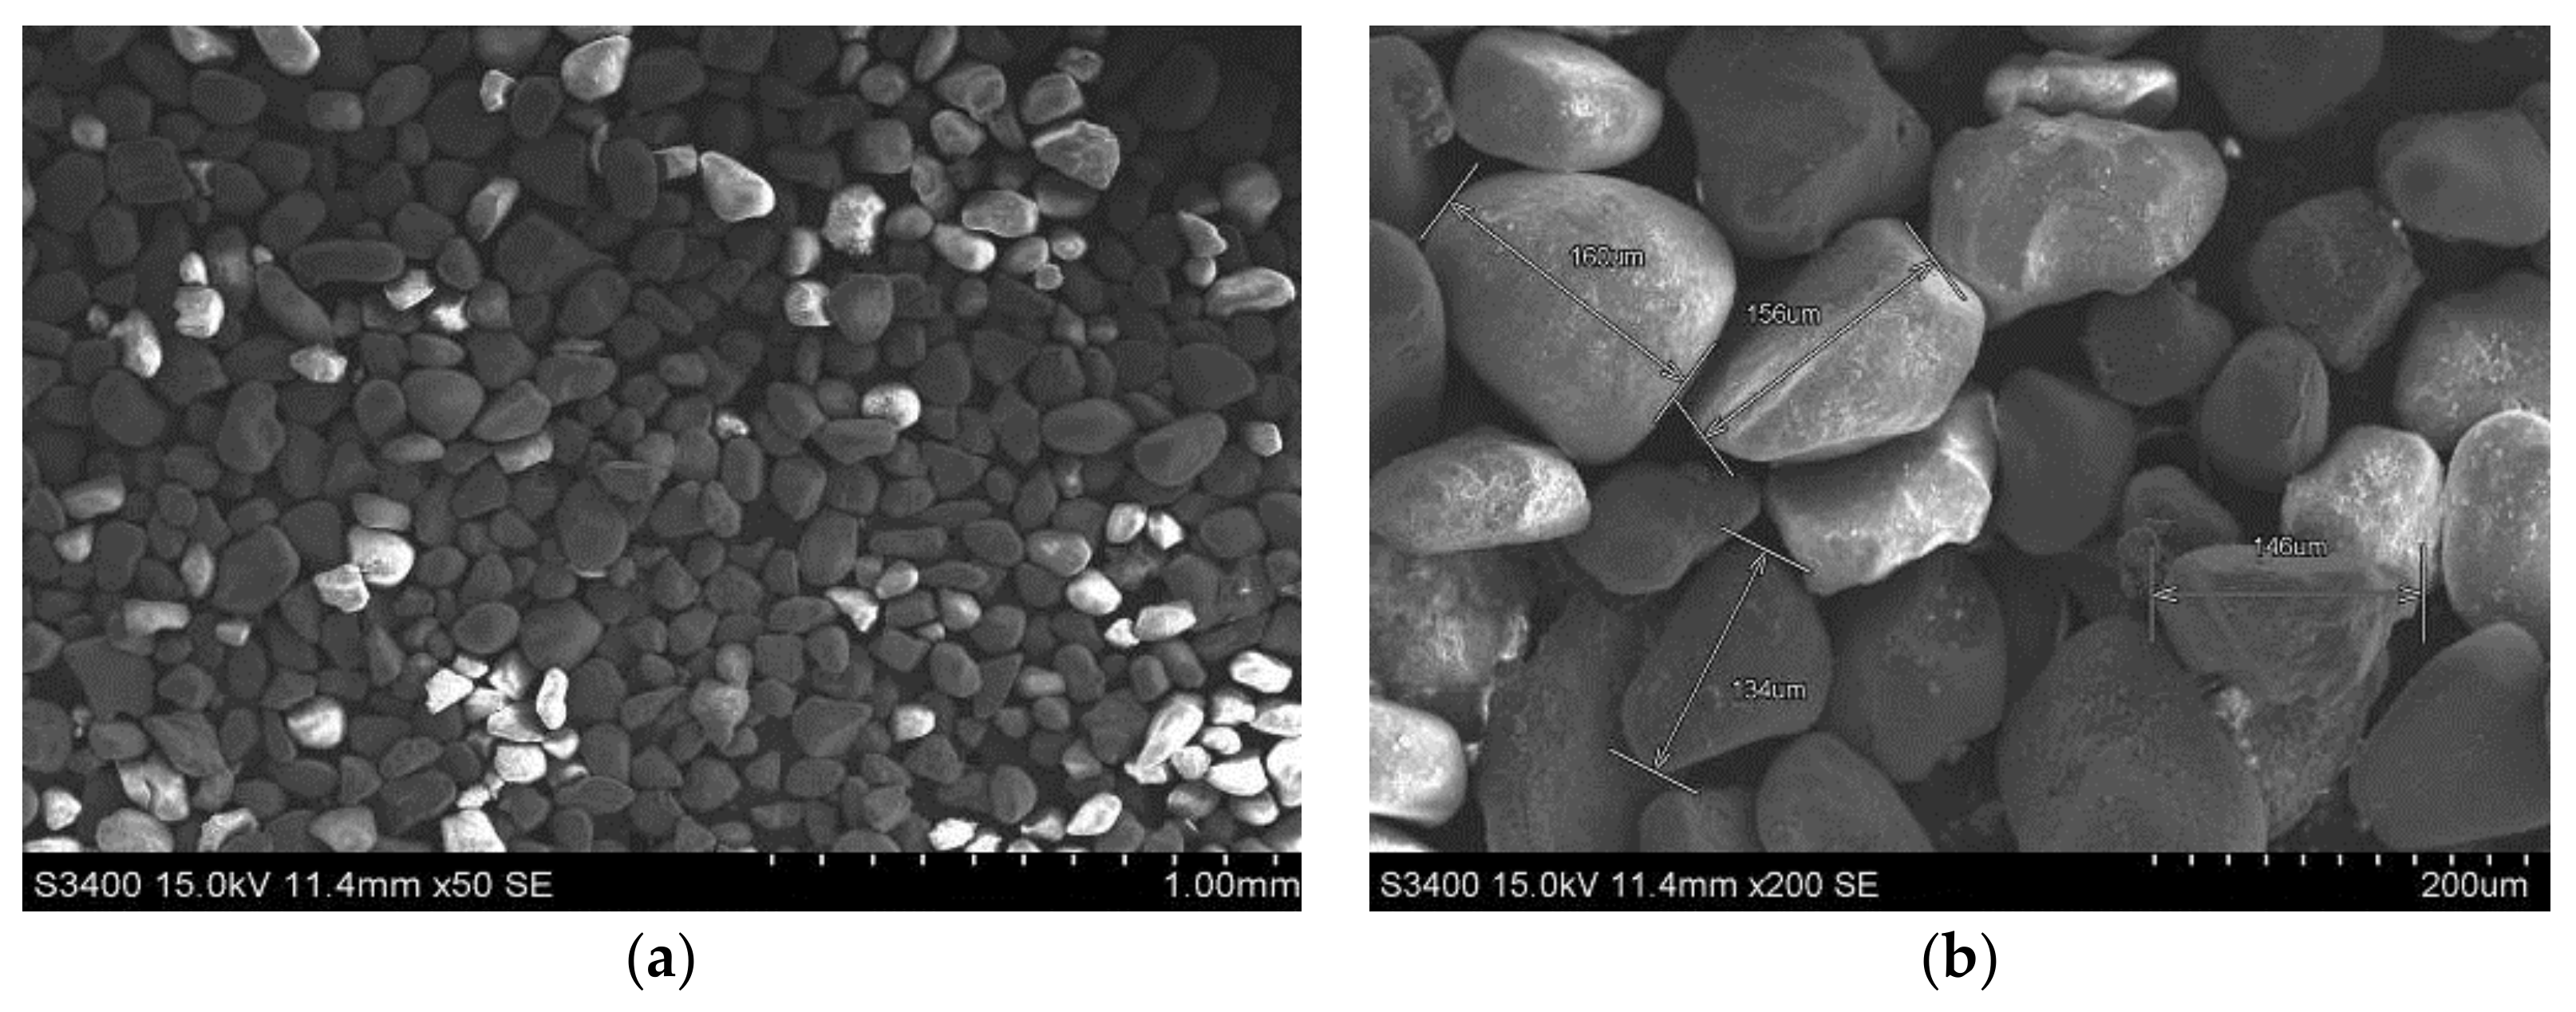
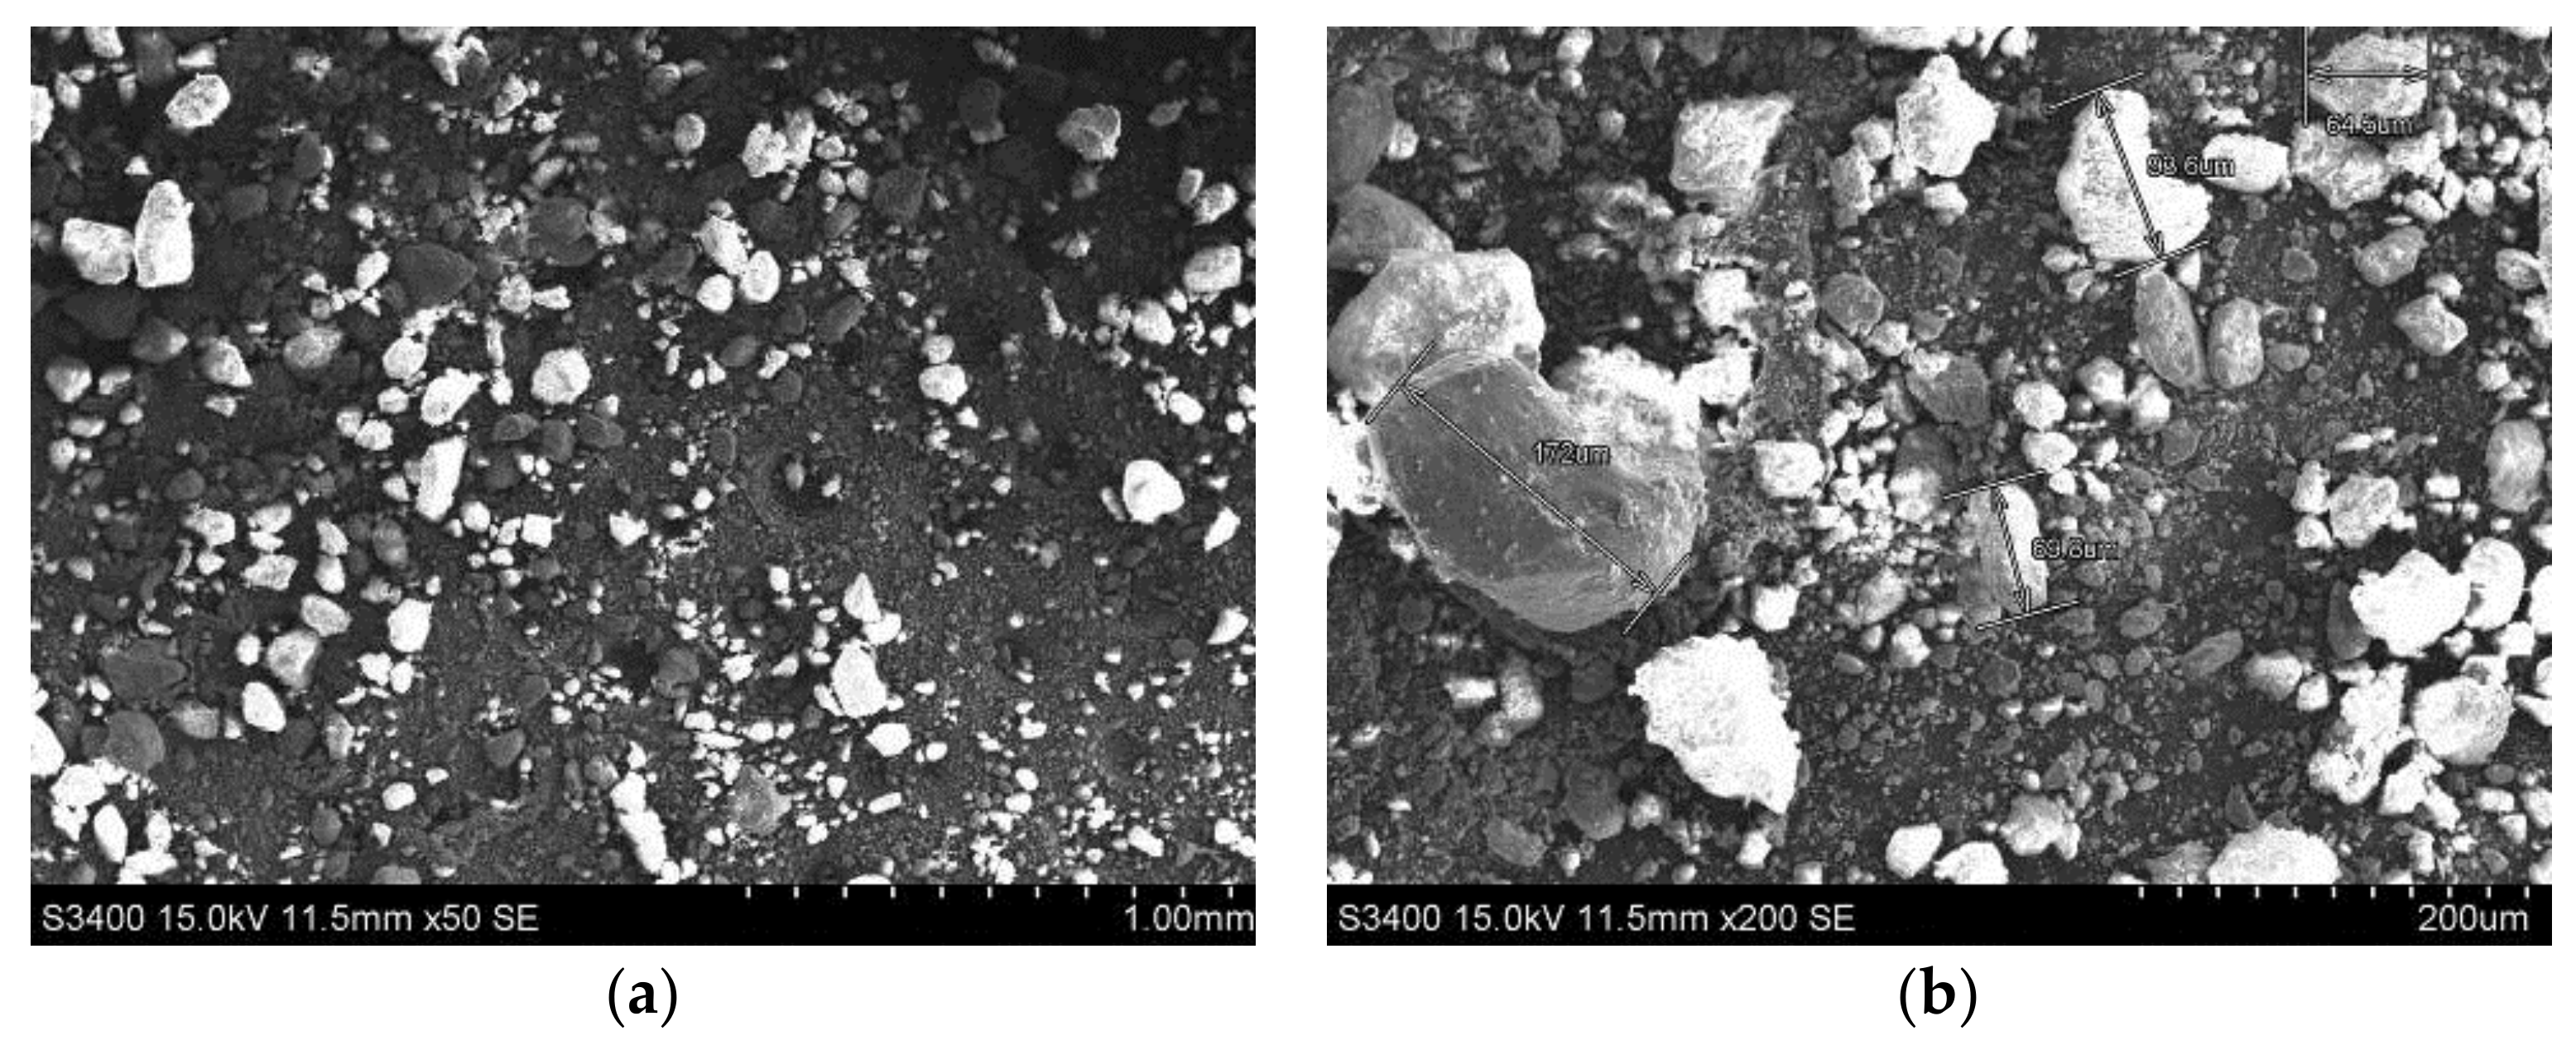
Mirror samples from one manufacturer were subjected to a set of accelerated aging tests. The tested samples were silvered-glass reflectors with a thickness of 4 mm and a size of 10 cm × 10 cm. All samples contained the four edges properly protected by the manufacturer (see Figure 1). The total number of samples included in this study was 38.

2.2. Sand Samples

Two types of sand were employed in this study. They were taken from sites that are highly representative of CSP plants; the United Arab Emirates (UAE) and Morocco. This section presents a summary of the representative particle size and chemical composition of the two sands considered in this work. This information is useful for the further selection of CSP plant locations because the characteristics of the sand from such locations might be compared with those presented here and so the results achieved in this work could be extrapolated to those sites.
The two sand types are shown in Figure 2. As can be observed, the color of the sand from Morocco is red and the color of the sand from Dubai is light brown. The sand was shifted with a sieve shift, imposing a maximum of 180 μm to simulate the particle sizes that might be expected to be deposited on the backside of the reflectors.
The first type of the sand samples was collected from The Sustainable City at Dubai (UAE). Figure 3 shows microscopic pictures taken with a scanning electron microscope (SEM, S-3400N, Hitachi, Chiyoda, Tokyo, Japan), which is described in Section 2.6.4. As can be seen, the typical size of the sand is around 150 µm.
The second type of sand was collected by MASEN (Moroccan Agency for Solar Energy) from the Ouarzazate Solar Complex in Ouarzazate, Morocco. Figure 4 shows microscopic pictures taken with the SEM. As can be noted, the typical size of the bigger particles of the sand is around 100 µm, although most particles are smaller.
The composition of the two sand types was analyzed by X-ray fluorescence spectrometer (S4 PIONEER, Bruker, Karlsruhe, Germany) and the results obtained are presented in Table 1. It can be seen that the sand from Dubai mainly contains CaO (62.05) and in a second position SiO2 (26.79%), while the sand from Ouarzazate has a higher content of SiO2 (51.11%), followed by Al2O3 (14.70%) and CaO (17.76%).

2.3. Reflector Samples Preparation

To deposit the sand on the backside of the reflector samples, the first step consisted in spraying demineralized water to wet the surface. After that, a weight of 1 g of sand was deposited with the fingers over the entire surface. Finally, demineralized water was sprayed again on the backside surface and the sand was kept dry for 24 h. The result after the 24 h is presented in Figure 5.

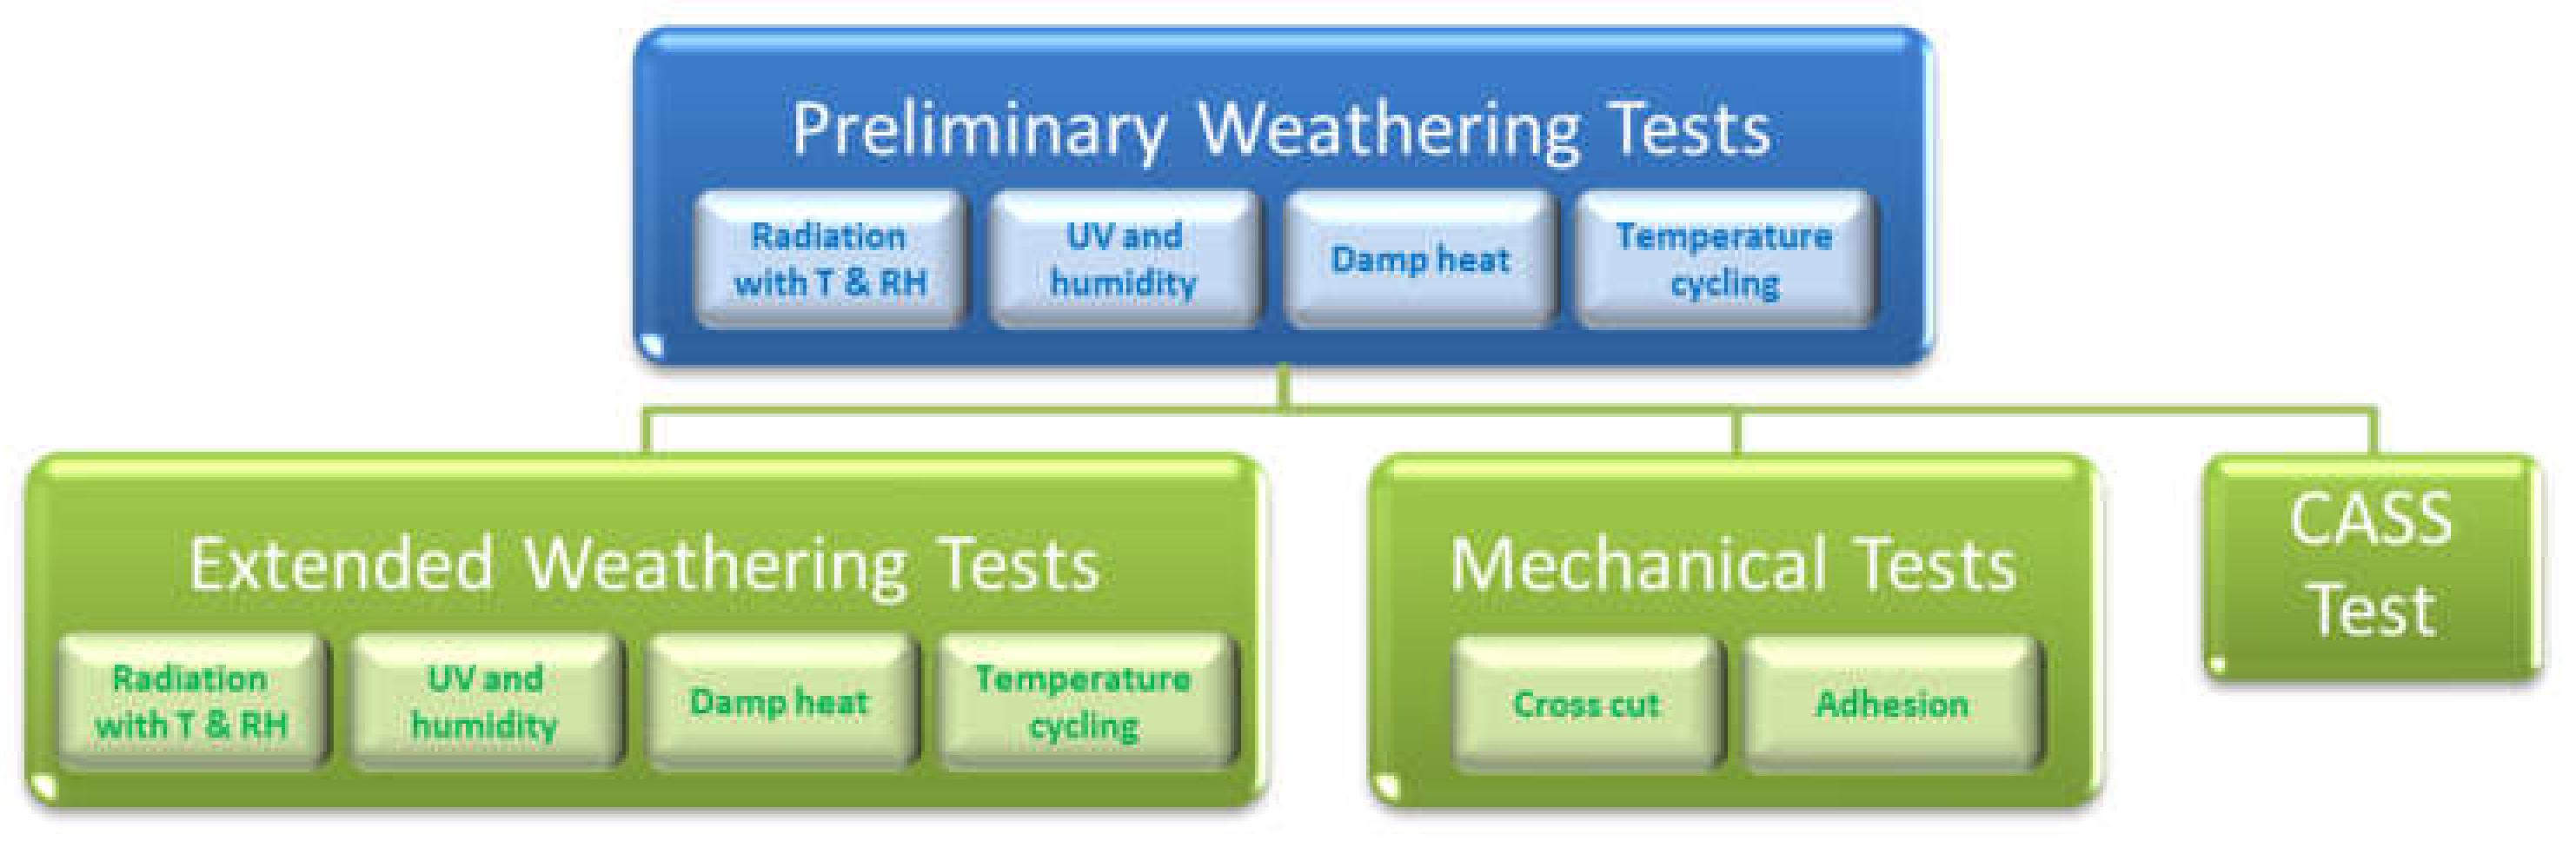
2.4. Testing Approach

The experimental campaign started with a first round of four key preliminary weathering tests [64], aiming to apply an initial pre-damage to the samples. The experiments selected were radiation with temperature and humidity, UV and humidity cycling, damp heat, and temperature cycling (see Section 2.5.1, Section 2.5.2, Section 2.5.3 and Section 2.5.4). For each test, three samples with sand from Ouarzazate, sand from Dubai, and without sand (as a reference) were included. Therefore, nine samples were incorporated for each study, which involved a total of 36 samples. After the tests, sand was removed from the backside of the samples with demineralized water.
After the preliminary weathering test, the samples were divided into three sets of 12 samples. Each set contained one sample type (that is, one replicate with sand from Dubai, one replicate with sand from Ouarzazate, and one replicate without sand) from the four initial weathering tests. The three sets were distributed as follows:
  • The first set of 12 samples continued with the four weathering tests, which was named the extended weathering test. The testing time was increased to check if a longer time in the accelerated aging chambers could report more relevant results. The sand was again deposited before the long-term weathering tests and then removed with demineralized water after the tests were complete.
  • The second set of 12 samples was submitted to two mechanical tests (cross-cut and adhesion tests, see Section 2.5.5 and Section 2.5.6) that modified the backside paint layers to investigate how the weathering tests might affect the resistance of the backside paint layer and to provoke further weakness in the mechanically pre-damaged area. A reference sample (named Ref. 01) without any previous weathering test was included in the cross-cut and adhesion tests.
  • The third set of 12 samples was directly exposed to the copper-accelerated acetic acid salt spray (CASS) test (see Section 2.5.7). This is the most suitable test to remark corrosion in the silver layer produced by a weakness point or area in the backside paint layers. A reference sample (named Ref. 02) without any previous weathering tests was also included.
Figure 6 includes a scheme of the testing protocol followed.

2.5. Tests Description

This section describes the methodology and the equipment used to carry out the accelerated aging test campaign.

2.5.1. Radiation with Temperature and Humidity Test

There is no standard for this test. The maximum conditions of radiation (1000 W/m²) were selected (employing a metal-halide lamp, which covers the whole solar spectrum), and conditions of temperature, T, and relative humidity, RH, were set at T = 50 °C and RH = 85%. The chamber employed for the experiment was the model SC340 by Vöstch (Reiskirchen-Lindenstruth, Germany) with the radiation module by Atlas. The backside of the mirror sample with the sand deposition faced upwards. In the preliminary weathering tests, nine samples were included (three of each type) for 500 h, while in the extended weathering tests three samples were tested (one of each type) for a further 500 h, accumulating in total 1000 h of testing.

2.5.2. UV and Humidity Cycling

The UV light and humidity test, which is based on the standard ISO 16474-3 (Method A) [65], is used to determine the effect of UV radiation in combination with high humidity on the solar reflectors. It consists of several cycles composed of two steps. In the first step the samples are exposed to UV radiation (λ = [290–400] nm) for 4 h at a temperature of T = (60 ± 3) °C. The UV lamps exhibit a peak at 340 nm, with a radiation of 0.83 W/m2/nm. Further, the mirror samples are submitted to 4 h of condensation (RH = 100% without irradiation) at T = (50 ± 3) °C. Therefore, one cycle lasts for 8 h. The test was carried out in an UV-Test chamber from Atlas. In the preliminary weathering tests, nine samples were included (three of each type) for 1000 h, while in the extended weathering tests three samples were tested (one of each type) for a further 1000 h, accumulating in total 2000 h of testing.
This chamber was designed to insert the test samples in the support structures located at the two sides of the chamber. This way the samples received the appropriate doses of UV irradiation. However, in this particular case, the samples were located at the bottom of the chamber, in a horizontal position with the backside (paint with the deposited sand) facing upwards, to prevent the sand deposited on the backside reflector paint from become detached during the experiment. Therefore, the testing performed is a modification of the test originally presented in the standard ISO 16474-3 because it cannot be guaranteed that the UV doses received by the samples are the same as those received in the original supports.

2.5.3. Damp Heat Test

The so-called damp heat test applies extreme constant conditions of both T and RH. The combination these two parameters is typically quite aggressive and leads to the corrosion of the silver layer. This experiment is normally applied to test the resistance of solar reflectors against humidity diffusion through the paint coatings at elevated T. It was performed according to the international standard IEC 62108 (test number 10.7, Procedure b) [66]. The samples were submitted to constant conditions of T = (85 ± 2) °C and RH = (85 ± 5)%. The test was carried out in a HCP108 model (Memmbert, Schwabach, Germany) weathering chamber.
The samples were positioned horizontally in the bottom of the chamber with the backside facing upwards. Both weathering tests (preliminary and extended) were performed for 1000 h, with a total testing time of 2000 h. In the preliminary weathering tests, nine samples were included (three of each type), while in the extended weathering tests three samples were tested.

2.5.4. Temperature Cycling

The purpose of this test is to determine the capacity of a solar reflector sample to resist extreme changes in T and RH. This test can detect possible failures due to stress in the component layers of the material from repeated thermal changes. The temperature differences between day and night are expected to be quite high in summer for a desert site. For this reason, the following testing conditions were selected: 32 h at T = 65 °C and RH = 85% + 4 h at T = 85 °C + 4 h at T = −40 °C, according to UNE 206016, method B2 [67]. The total duration of one cycle is 40 h. The chamber used in the tests was the model SC340 by Vöstch. The backside of the mirror sample with the deposited sand faced upwards. In the preliminary weathering tests, nine samples were included (three of each type) and 10 cycles were applied (400 h), while in the extended weathering tests three samples were tested (one of each type) for another 10 cycles (400 h), involving a total testing duration of 800 h.

2.5.5. Cross-Cut Test

According to the approach followed (see Section 2.4), after the preliminary weathering tests the second set of samples was subjected to mechanical tests. The cross-cut was the first mechanical test applied. This test was conducted according to ISO 2409 [68] and consists of cutting the backside paints with a special tool (forming a lattice pattern) and applying tape on the cut area to check if the affected surface is removed.
The spacing and number of the cuts selected were 2 mm and five cuts, respectively, according to the hardness of the substrate and the coating. The cuts were applied to the coating at a constant speed and pressure, assuring a proper penetration up to the substrate surface. This task was repeated with a second set of cuts at 90°, to create a grid. After the cutting, the surface was brushed with a soft brush. Then, the center of the tape (with a width of 50 mm) was placed over the grid in a parallel direction to one set of cuts. Within 5 min of applying the tape, the tape was removed by pulling it off. The time was between 0.5 s and 1.0 s, and the angle was near 60°. Finally, the cut area of the test coating was carefully examined to determine the affected area (according to Reference [68]).

2.5.6. Adhesion Test

The second mechanical test was the adhesion one, based on Reference [69]. It was achieved with an automatic adhesion tester, PosiTest AT-A (DeFlesco Corporation, Ogdensburg, NY, USA), and consists of gluing a dolly with a diameter of 20 mm (with a specified adhesive) to the backside of the samples, curing the adhesive for 24 h, and pulling it off with a hydraulic pump. This electronic pump applies the pull-off pressure to remove the dolly in smooth and continuous mode. The result is that the pull-of pressure acts as an indicator of the paint adhesion. Pictures were taken to analyze the effect of these experiments (area affected and paint layer removed).

2.5.7. CASS Test

As explained in Section 2.4, after the preliminary weathering tests, the third set of samples was submitted to the CASS test. According to ISO 9227 [70], the samples were exposed to T = (50 ± 2) °C and RH = 100%, with a continuous pulverization of a water solution including (50 ± 5) g/L of NaCl and (0.26 ± 0.02) g/L of CuCl2. To achieve a pH between 3.1 and 3.3, HCl, NaOH, or NaHCO3 were used. This test was selected for this study because, according to Reference [71], it is very aggressive and thus useful to provoke corrosion in the silver of those areas of the reflectors where the backside paint layers are degraded. The chamber used was the model VSC450 by Vöstch. In this study, three time intervals were applied: 24, 48, and 120 h.
The arrangement of the test samples was as follows:
(1)
The test samples were located in the chamber room to avoid direct exposure to the spray from the nozzle.
(2)
The samples were located in the chamber room facing upwards at an angle close to 20° to the vertical.
(3)
The test samples were organized to avoid any contact with the chamber walls and to permit free circulation of the spray around the sample surfaces.

2.6. Experimental Evaluation

Before and after the weathering tests, an optical reflectance analysis of the samples was performed according to the actual SolarPACES reflectance measurement guideline [72], by measuring specular and hemispherical reflectance of the silver layer (and backside paint layer) with a reflectometer and a spectrophotometer, respectively [73]. Additionally, images of interesting areas (for both weathering and mechanical tests) were taken with a camera and a light microscope. Finally, sand size and composition were analyzed before testing with the SEM. Nomenclature is based on the standard UNE 206009 [74].

2.6.1. Spectrophotometer

The spectral hemispherical reflectance, ρλ,h(λ,θi,h), was measured in λ = [320, 2500] nm, with 5-nm steps at an incidence angle of θi = 8°. The equipment used was a Perkin Elmer Lambda 1050 spectrophotometer, which incorporates a 150-mm diameter integrating sphere accessory. The data were evaluated with a second surface reference reflectance standard (calibrated in the same λ range). Three measurements were taken on each sample, rotating the sample by 90° each time to check possible anisotropies.
Following ASTM Standard E903 82 (92) [75], the solar-weighted hemispherical reflectance, ρs,h([λab]i,h), can be calculated by weighting ρλ,h(λ,θi,h), with the solar direct irradiance, Gb, on the earth surface for each wavelength, λi, according to Equation (1).
ρ s , h ( [ λ a λ b ] , θ i , h ) = λ a λ b ρ λ , h ( λ , θ i , h ) G b ( λ ) d λ λ a λ b G b ( λ ) d λ
For European and North American latitudes, typical solar direct irradiance spectra are given by the current standard ASTM G173-03 (air mass AM 1.5) [76].

2.6.2. Reflectometer

The monochromatic specular reflectance, ρλ,ϕ(λ,θi), within a defined acceptance half-angle, ϕ, of ϕ = 12.5 mrad, was measured with a Devices and Services 15R-USB portable specular reflectometer (Dallas, TX, USA). This instrument uses a parallel beam with θi = 15° and λ = [635, 685] nm, with a peak at λ = 660 nm.
The specular reflectance is the relevant value for CSP technology and the ϕ selected is considered to be appropriate for parabolic-trough designs. Each sample was measured in five different positions. To characterize the specular quality of the mirror, the specular reflectance at 660 nm was compared with the hemispherical reflectance at 660 nm, which should show approximately the same value for a mirror without surface scattering effects.

2.6.3. Optical Inspection

The degradation mechanisms were visually analyzed with a camera LUMIX model DMC-F745 by Panasonic (Kadoma, Osaka, Japan). In addition, their microscopic appearance was verified with a three-dimensional (3D) light microscope, model Zeiss Axio CSM 700 (Oberkochen, Germany). Both sides of each sample were checked before and after the tests.

2.6.4. Scanning Electron Microscope

The SEM model S 3400N by Hitachi (Chiyoda, Tokyo, Japan) was employed in this study. This kind of microscope generates high-resolution images of surfaces by scanning it with a focused beam of electrons which interact with atoms and produce several signals that comprise information about topography and composition. The sand composition was analyzed with an X-ray fluorescence spectrophotometer equipment model S4 by Bruker Pionner (Karlsruhe, Germany).

3. Results and Discussion

This section comprises the results achieved with these experiments performed to examine the effect of the soil deposits on the backside paints of the silvered-glass reflectors.

3.1. Preliminary Weathering Tests

Table 2 includes the results of the reflectance for the preliminary weathering tests, applied to all of the samples. In this table, the reflectance decreases before and after the tests, compared to the results of the samples without sand, which was used as a reference level. This means that the reflectance loss of the sample with sand for each test was obtained by subtracting the reflectance loss of the samples without sand for this particular test. With this approach, only the effect of the reflectance degradation due to the sand is considered, and no effect of the test itself is added to avoid any misunderstanding in the conclusions. According to this method, the results of the samples without sand are zero and consequently they are not incorporated in the table. As can be observed, the reflectance loss of the silver layer was not significant in any of the tests, with a maximum decay of −0.002 ppt, which is in the range of the instrument uncertainty. This is the expected behavior because the sand was deposited in the backside of the samples and the possible degradation will appear in the back coating but not reaching the silver layer. Regarding to the paint layer, the sand from Ouarzazate provoked more reflectance decrease of the back coating in all tests. The highest reflectance loss was noticed in the damp heat test followed by the temperature cycling test, with sand from Ouarzazate in both cases. The other two tests also presented a reflectance degradation, but on a lower scale.
In addition, all of the samples were analyzed microscopically in order to identify and check the aspect of the degradation mechanisms in the tests performed. As indicated before, the microscopic analysis on the back layer of the samples showed that the most aggressive tests were the damp heat and temperature cycling tests, with sand from Ouarzazate in both cases (see Figure 7 and Figure 8). Meanwhile, no degradation was detected in the samples without sand. Therefore, the degradation noticed in the paint layer of the samples with sand from Ouarzazate was due to the sand deposition in combination with the weathering tests, not due to the test itself. No significant changes were detected in the rest of the tests.

3.2. Extended Weathering Tests

Table 3 summarizes the reflectance results of the extended weathering experiments (applied to the first set of samples after the preliminary weathering tests), that is, the same tests already applied, but for a longer time. As stated in Table 2, reflectance decreased before and after the tests, as indicated by subtracting the result of the sample without sand from the results of the samples with sand. As can be seen in Table 3, no significant reflectance decay of the silver layer was achieved because the resulting values are in the range of the instrument uncertainty. With respect to the paint layer, no reflectance losses were noticed, except on two occasions. The first one is the sample tested with the sand from Ouarzazate in the damp heat test. This result is in accordance with the conclusions already stated in the preliminary test. The only extra information reached with these extended weathering test is that the sample tested with sand from Dubai in the UV and humidity test also suffered a significant reflectance loss (similar to that detected in the sample with sand from Ouarzazate tested in the damp heat test). Therefore, this is the main conclusion from this experiment.

3.3. Mechanical Tests

This section includes the results of the two mechanical tests applied to the second set of samples, after the preliminary weathering tests.

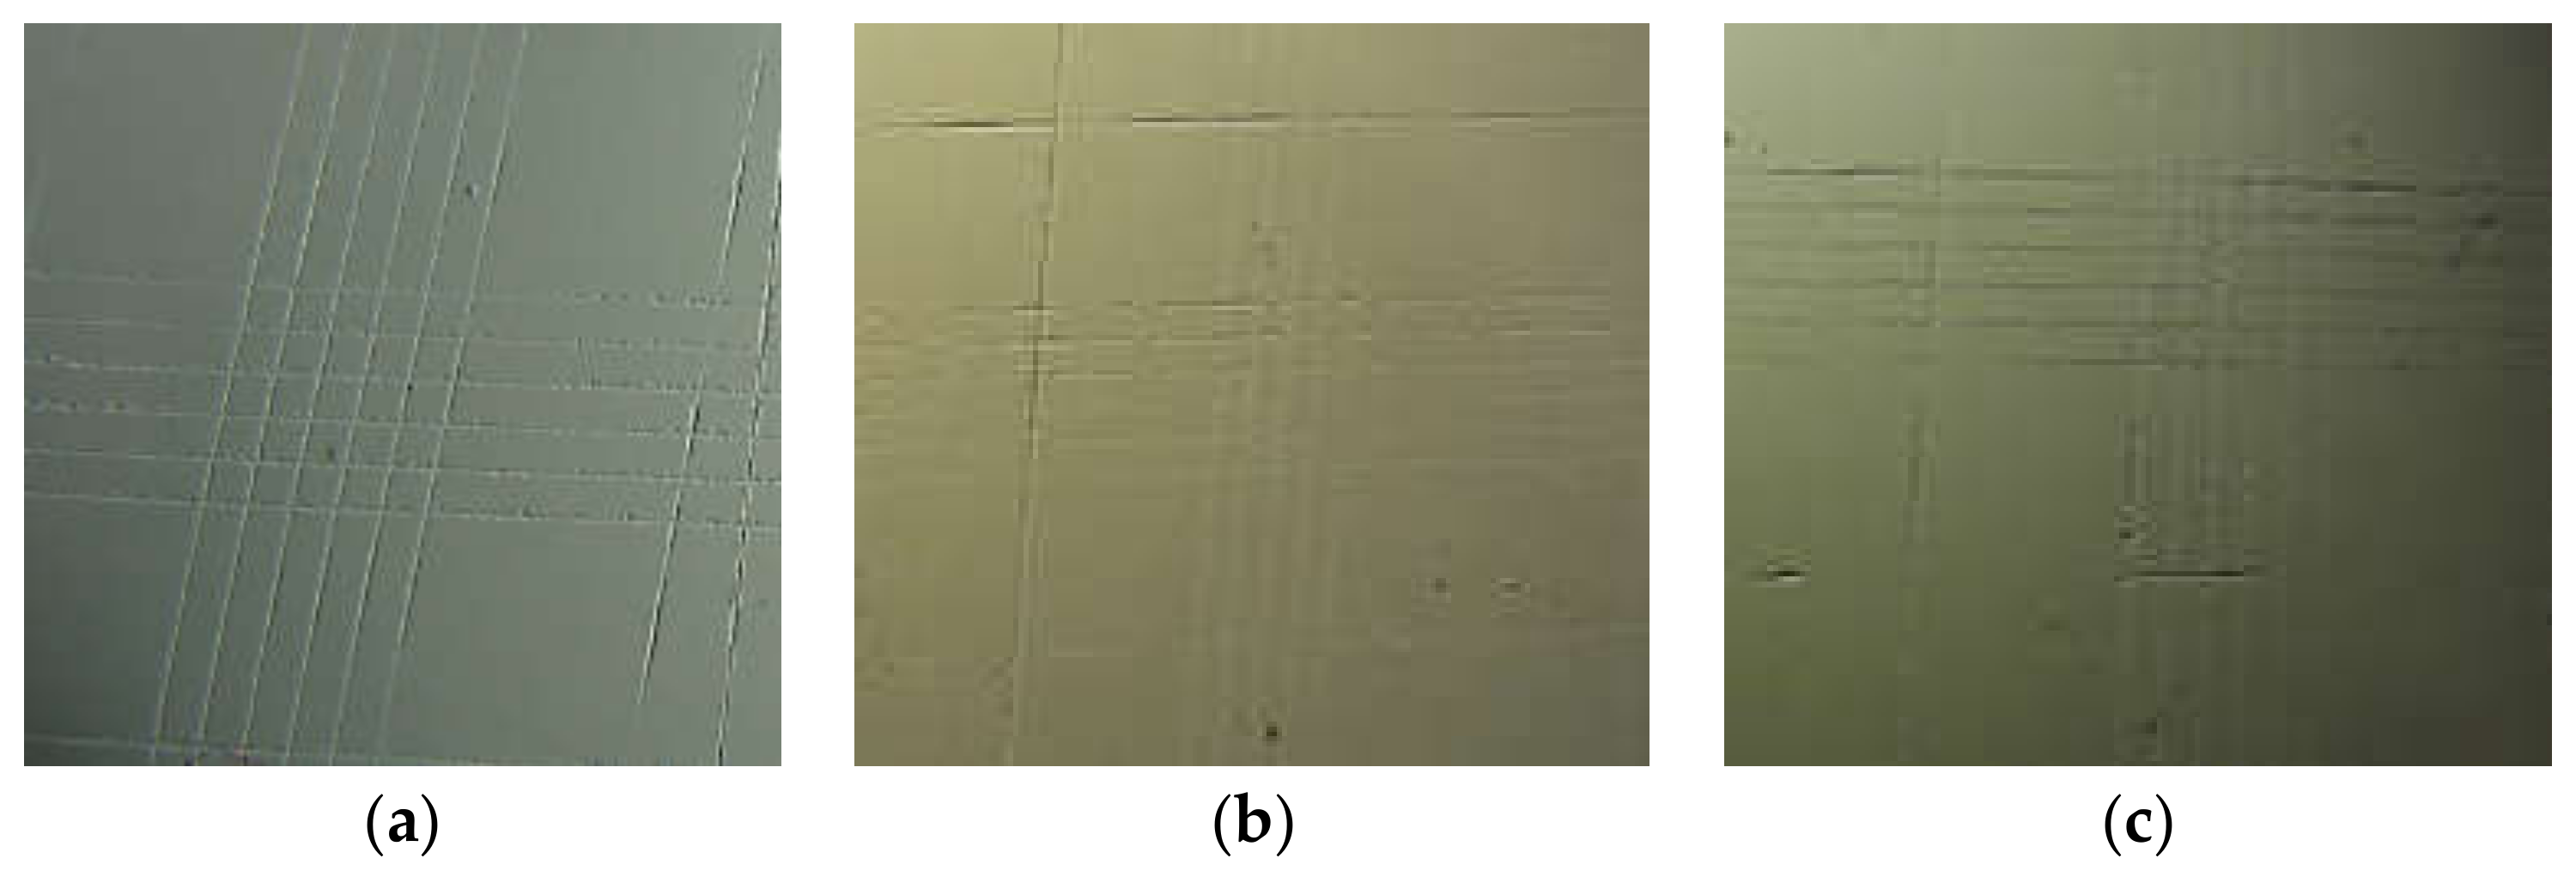
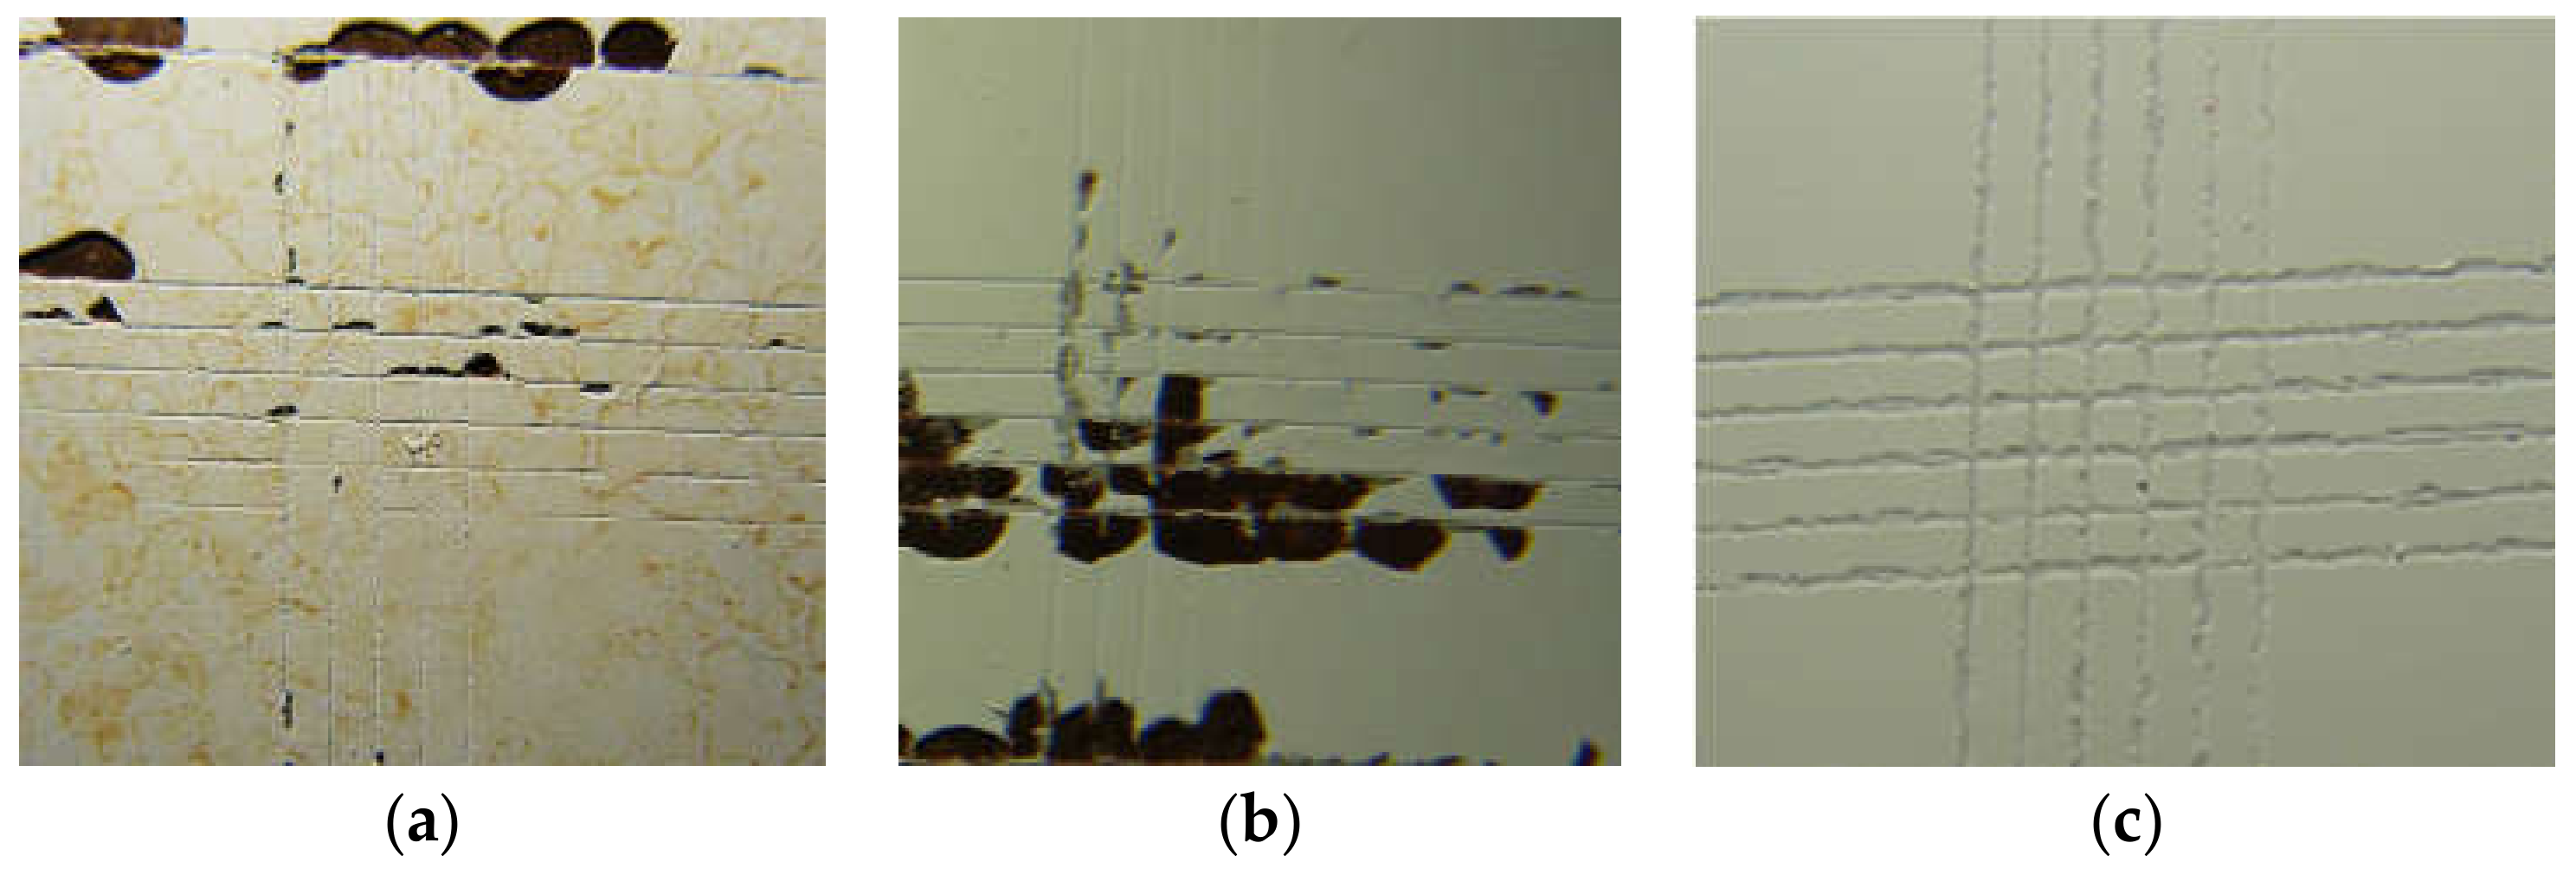
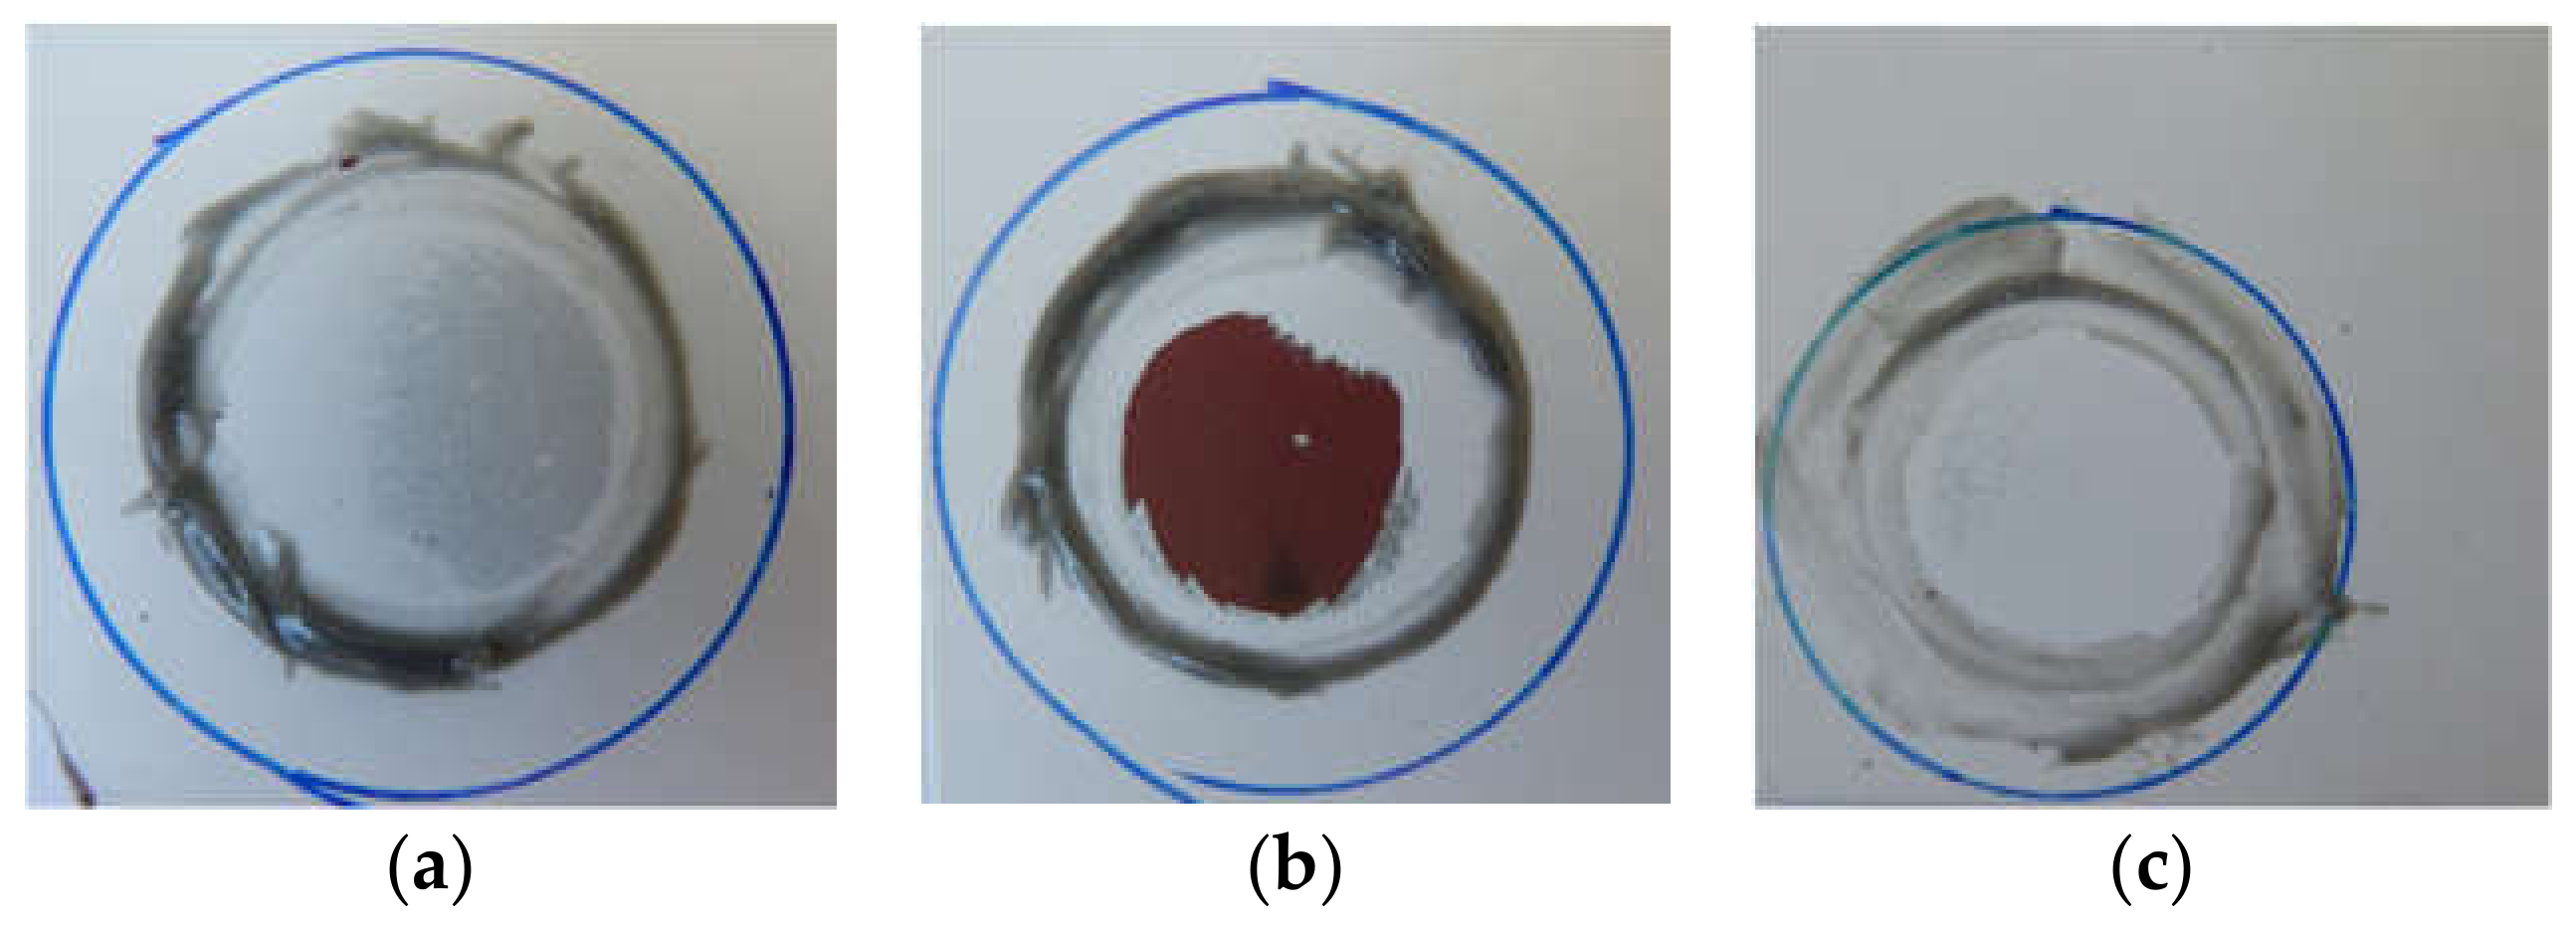
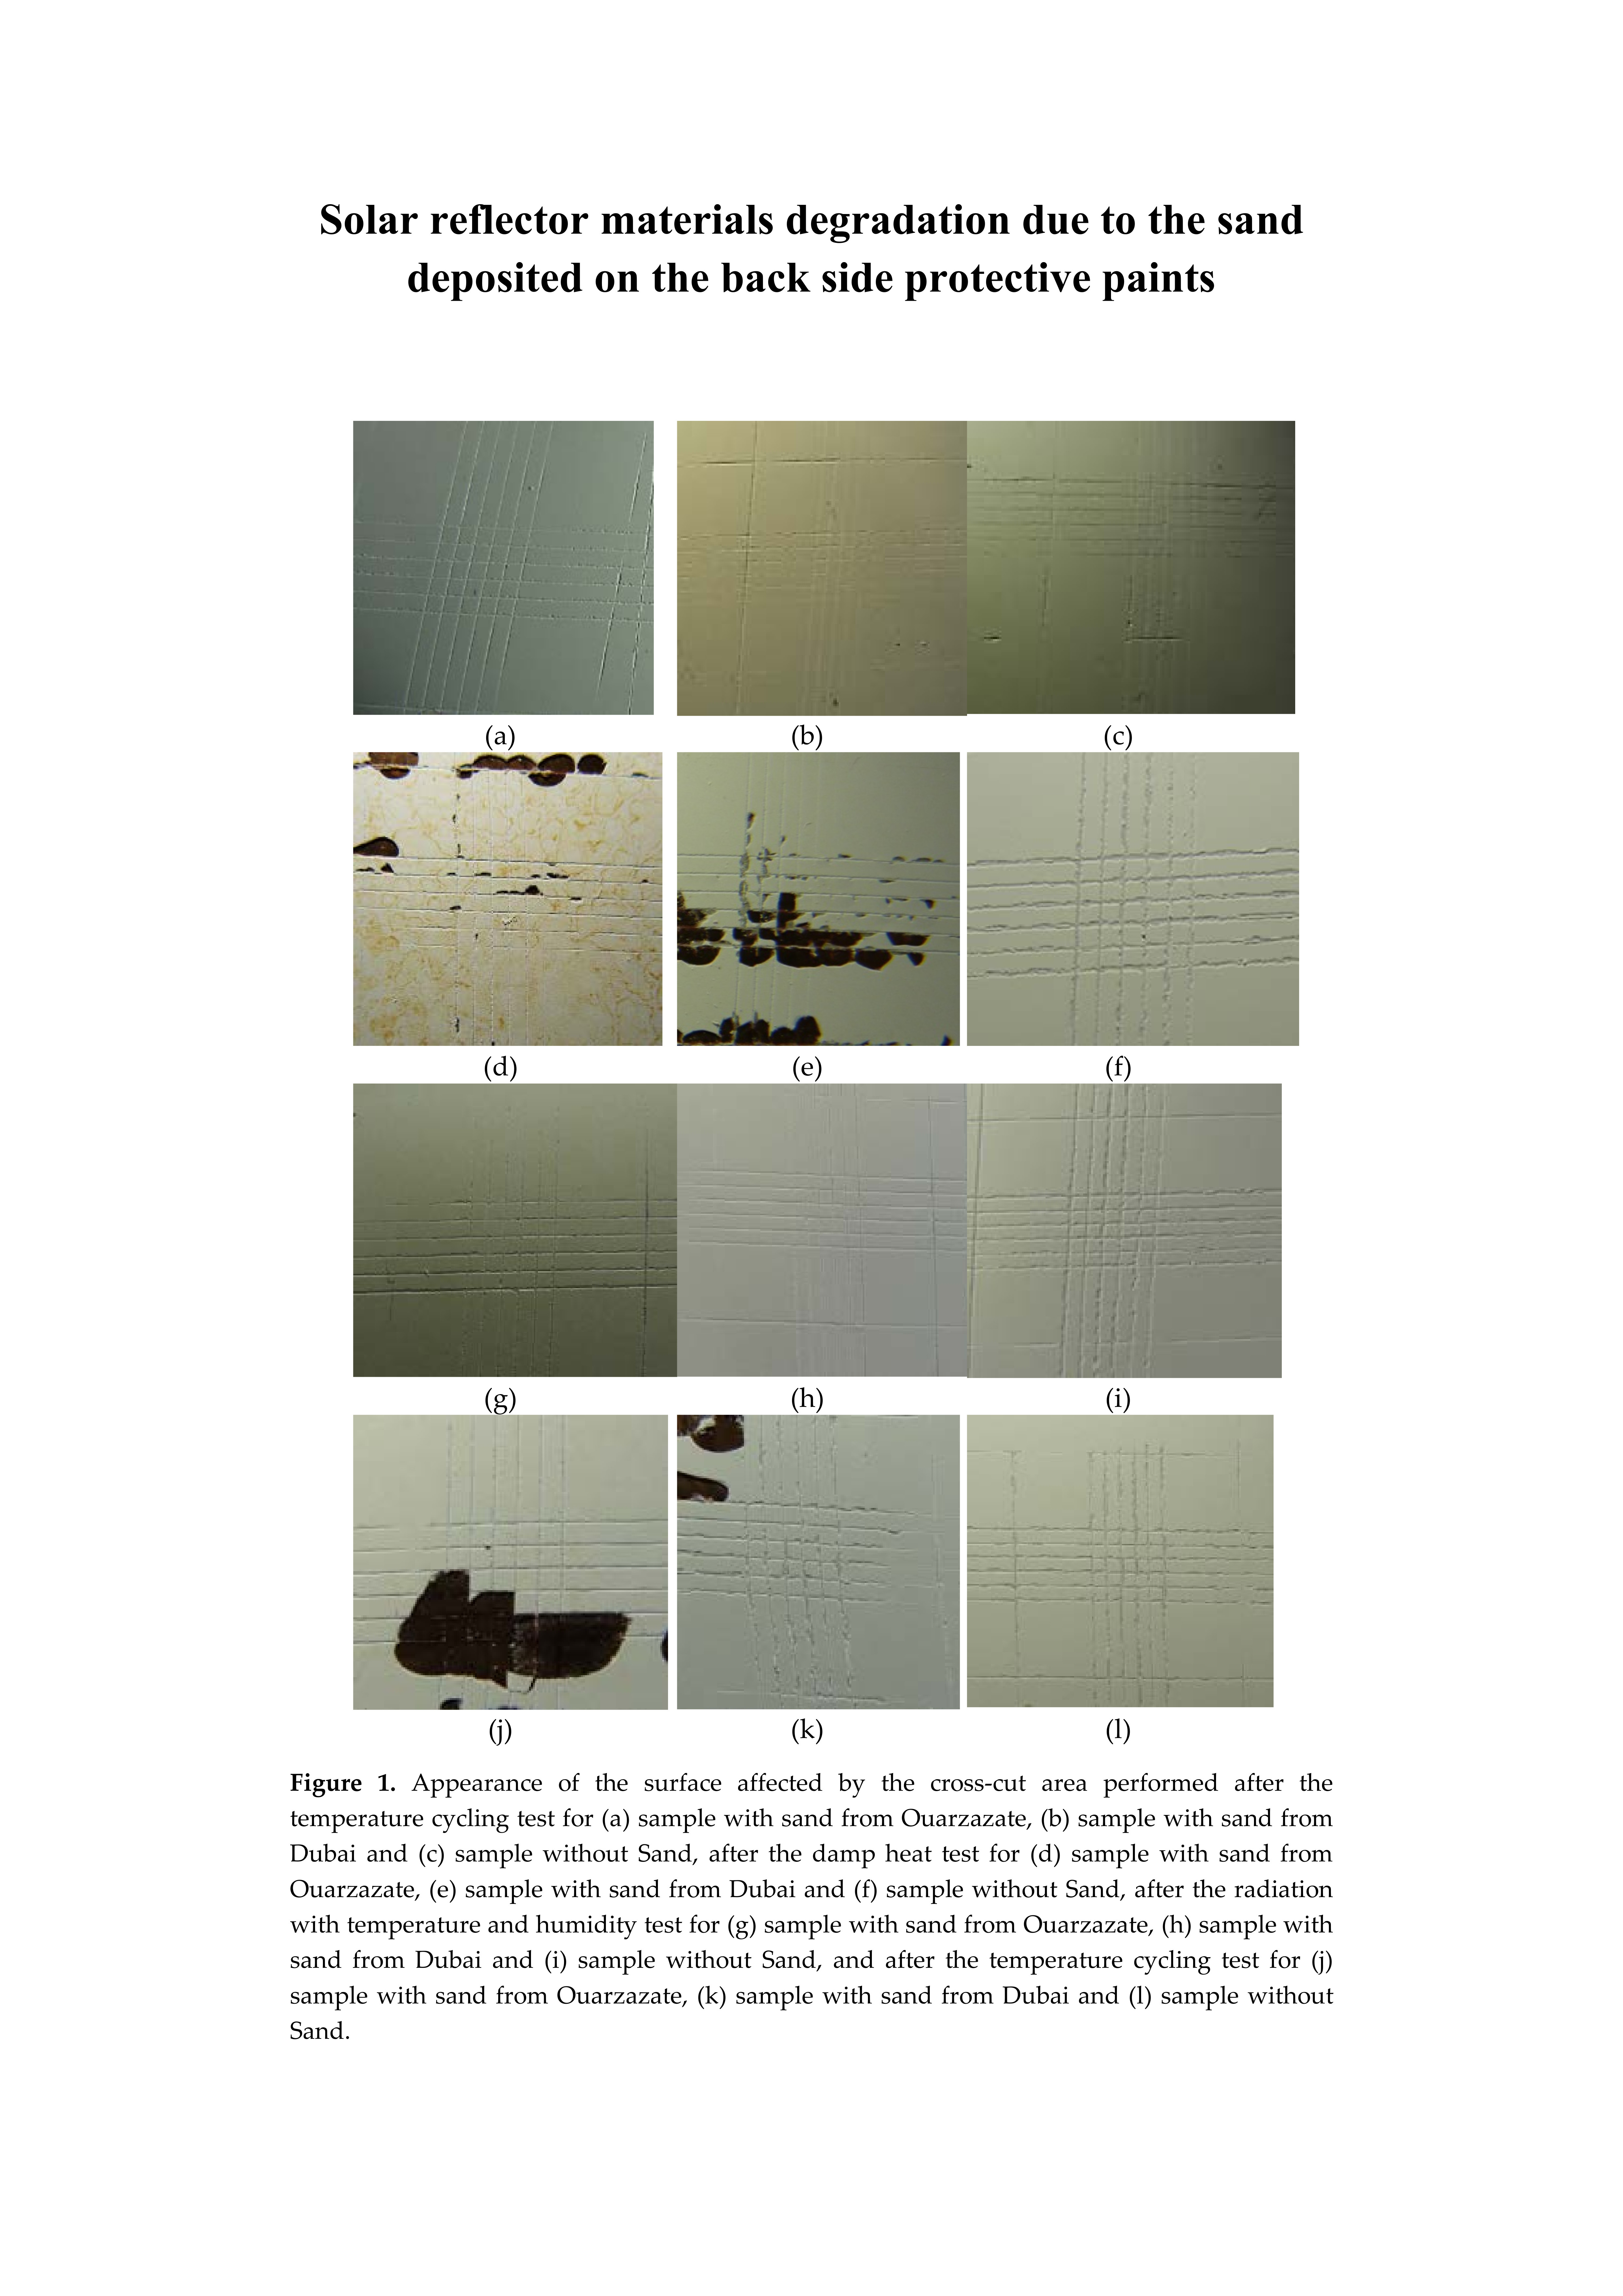
3.3.1. Cross-Cut Test

Table 4 summarizes the results of the cross-cut experiment, based on the visual inspection of the affected area and the classification according to ISO 2409 [68]. According to these results, the damp heat test was the most aggressive (with similar degradation caused by both sand types), followed by the temperature cycling test (with higher degradation caused by the sand from Ouarzazate). Both the UV and humidity and the radiation with temperature and humidity tests did not damage the paint layer for any sample. Also, it is very important to remark that the samples tested in the weathering experiments without sand were not affected at all by the cross-cut test. This means that the deterioration produced in the backside paint layers in some of the samples after the cross-cut test was clearly due to the interaction between the deposited sand and the paint layers during the accelerated aging experiments.
For a clear understanding, Figure 9, Figure 10, Figure 11 and Figure 12 show some illustrative pictures of the lattice created after the cross-cut tests, for the samples previously submitted to the UV and humidity test (Figure 9), the damp heat test (Figure 10), the radiation with temperature and humidity test (Figure 11), and the temperature cycling test (Figure 12). In all figures, the samples with the two types of sand and without sand are presented. As can be seen in these figures, only the damp heat and temperature cycling tests resulted in damage in the lattice area of the cross-cut test.

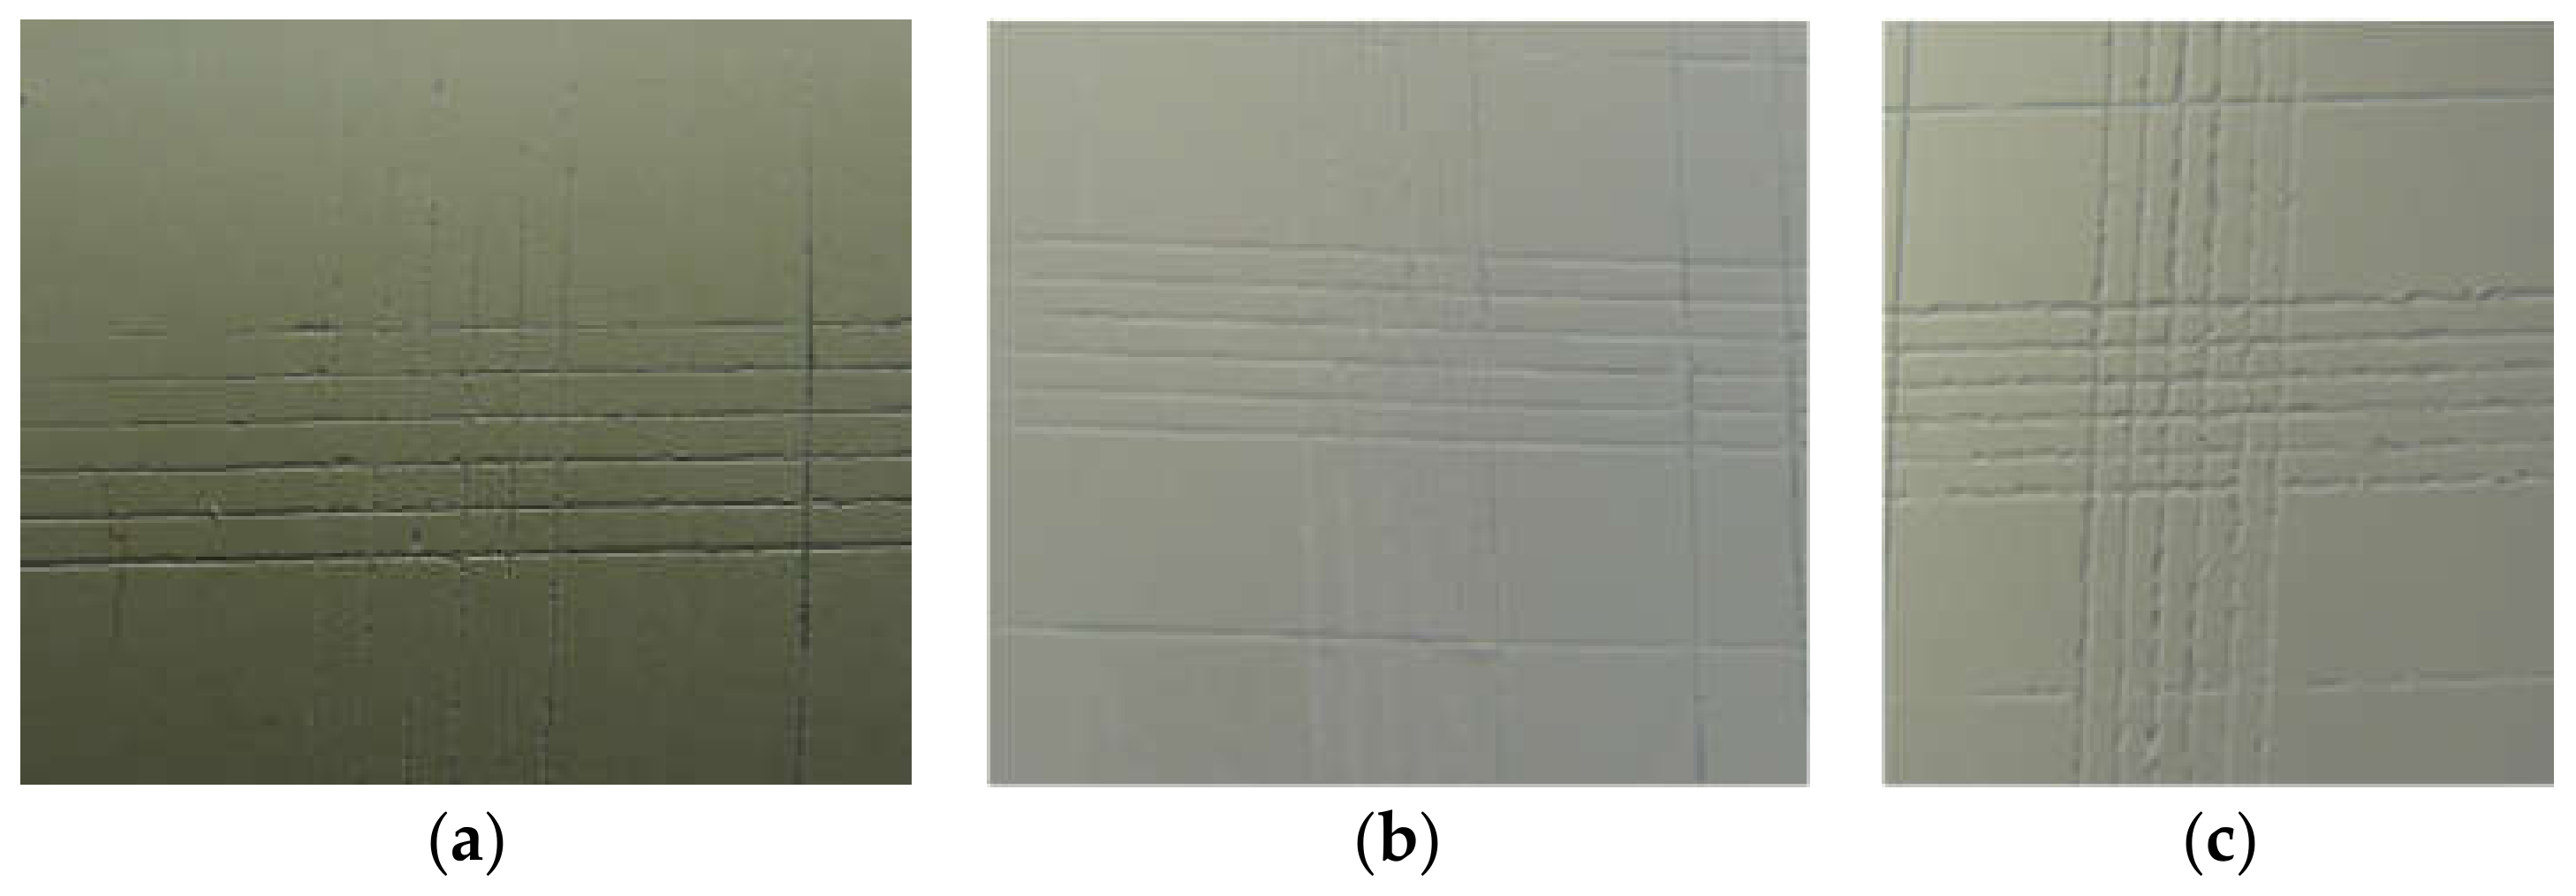
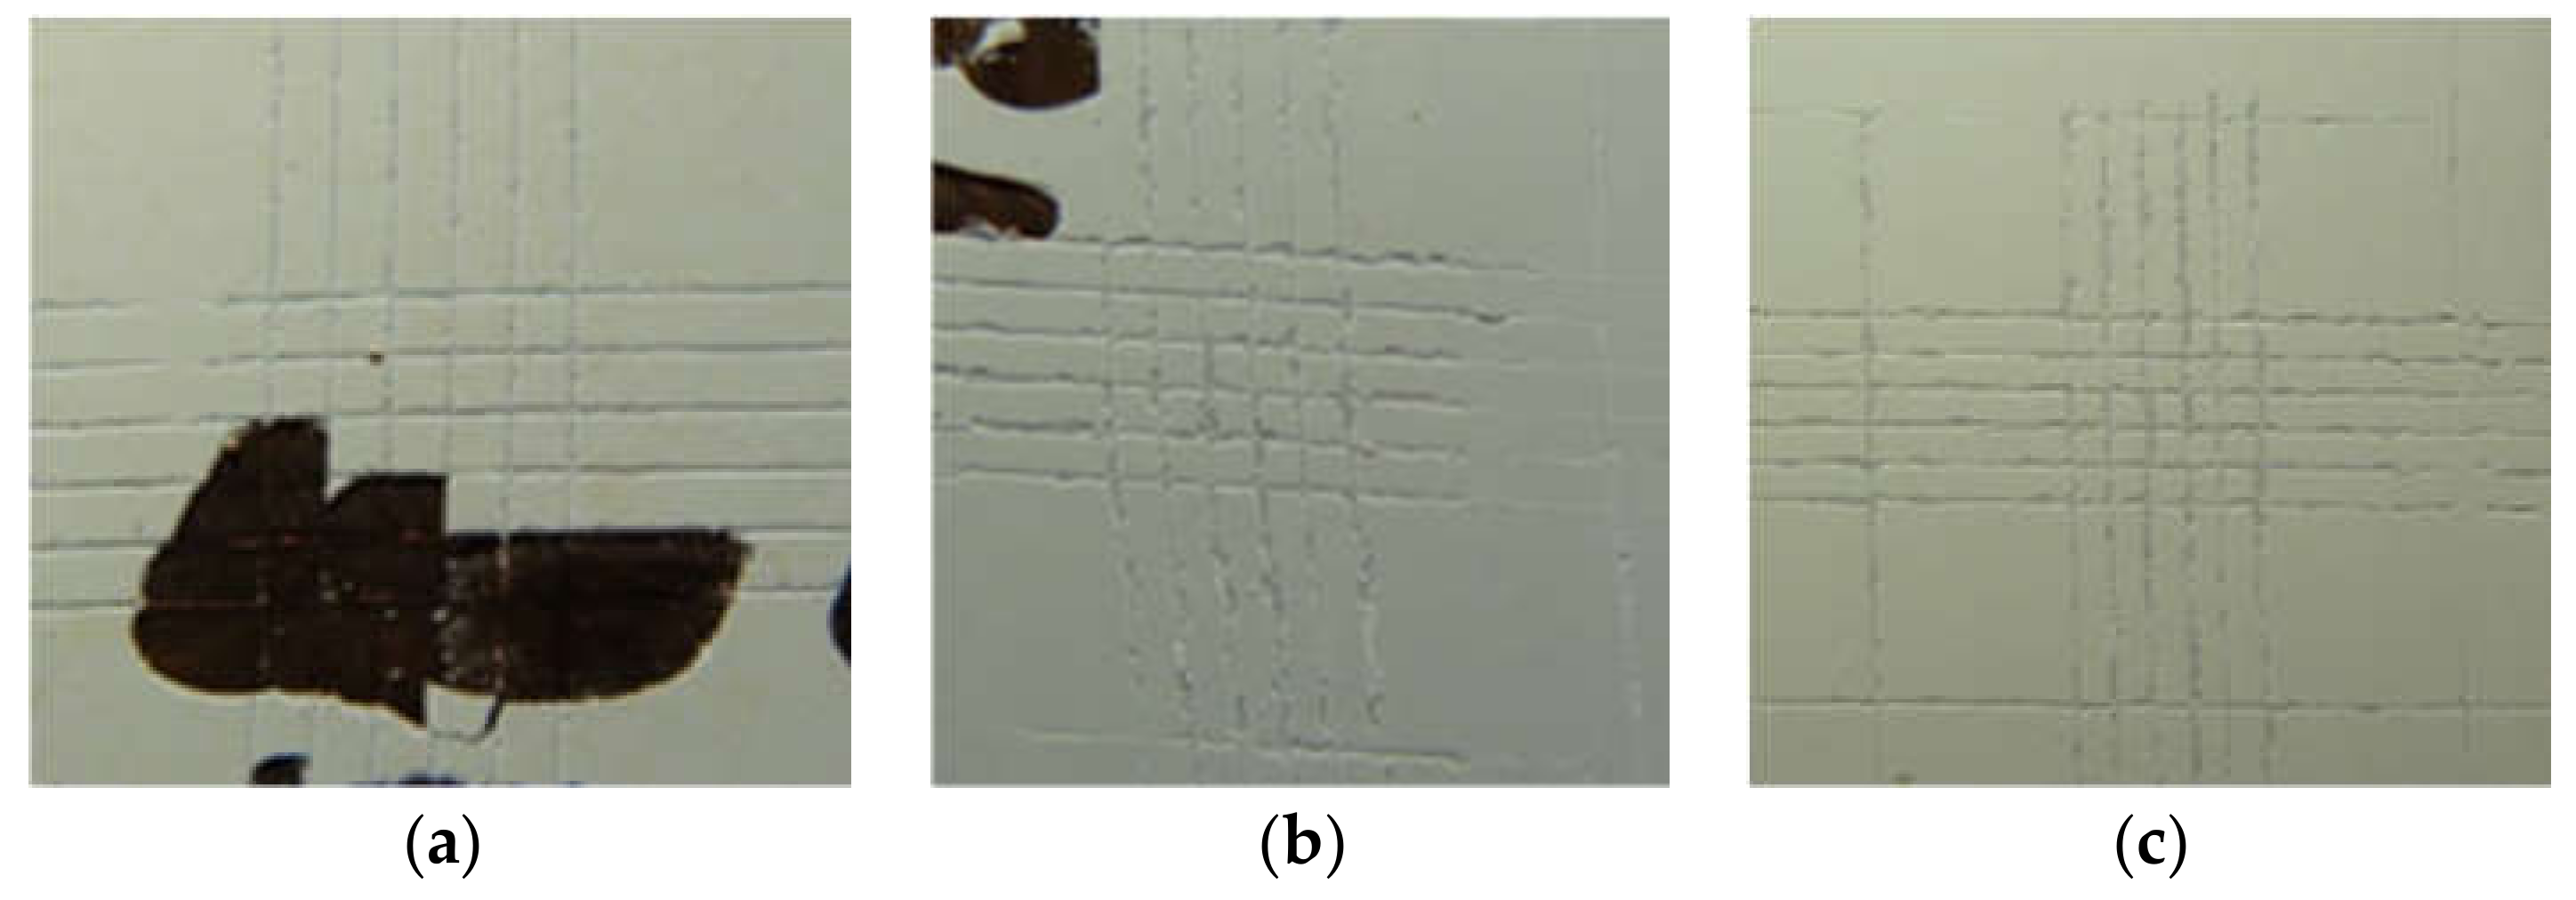
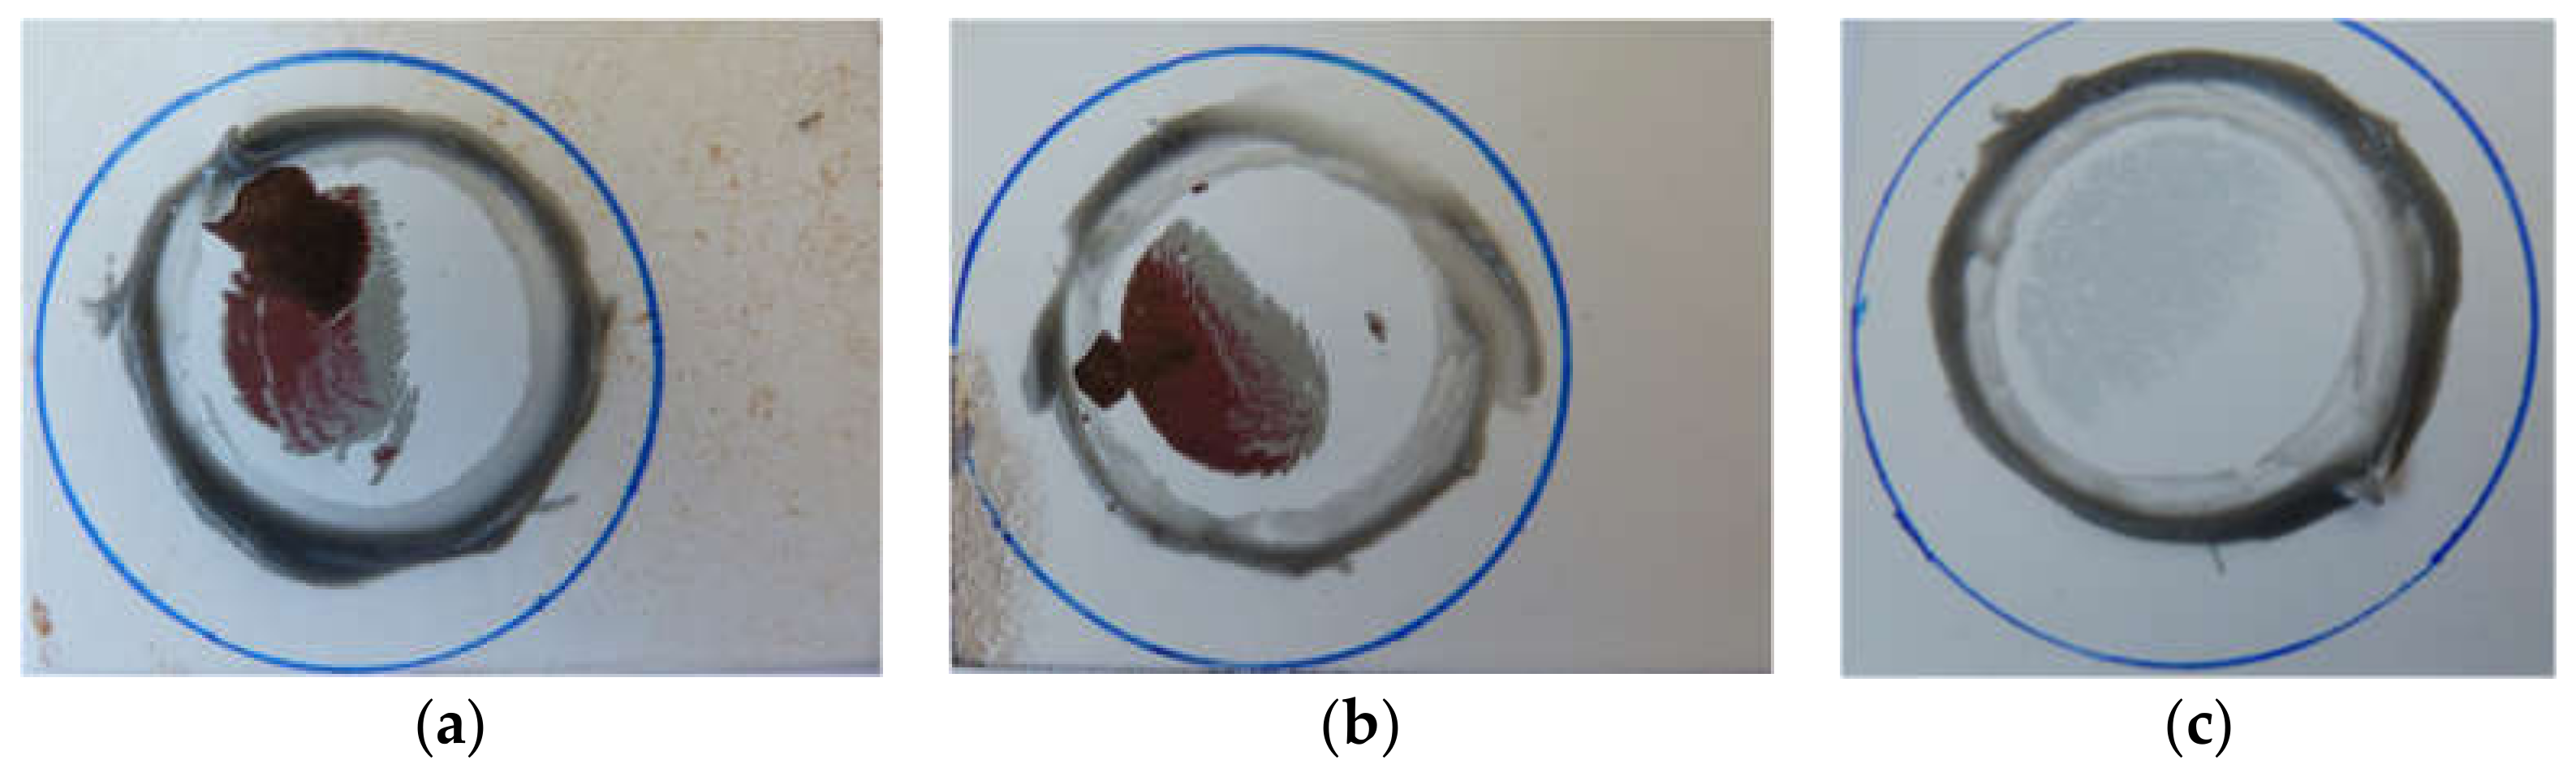
3.3.2. Adhesion Test
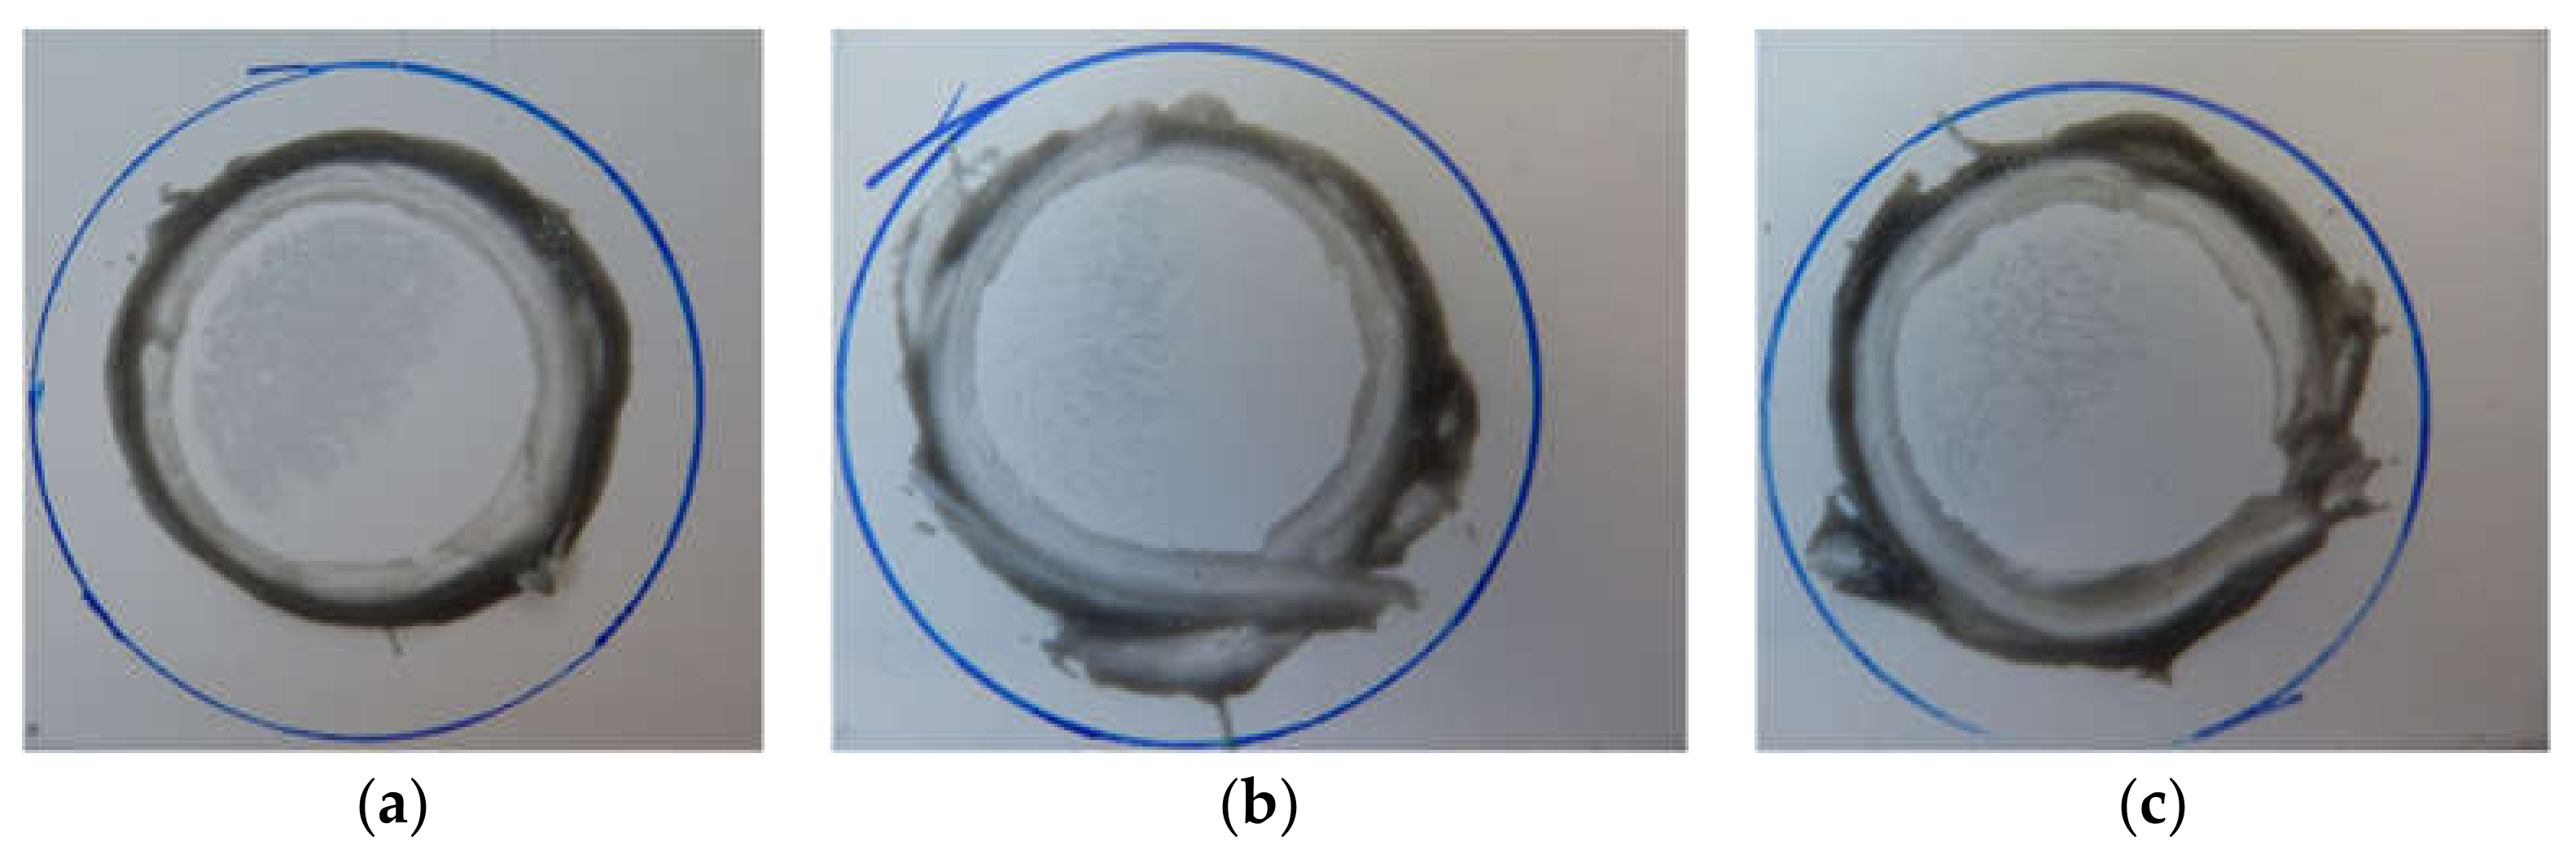
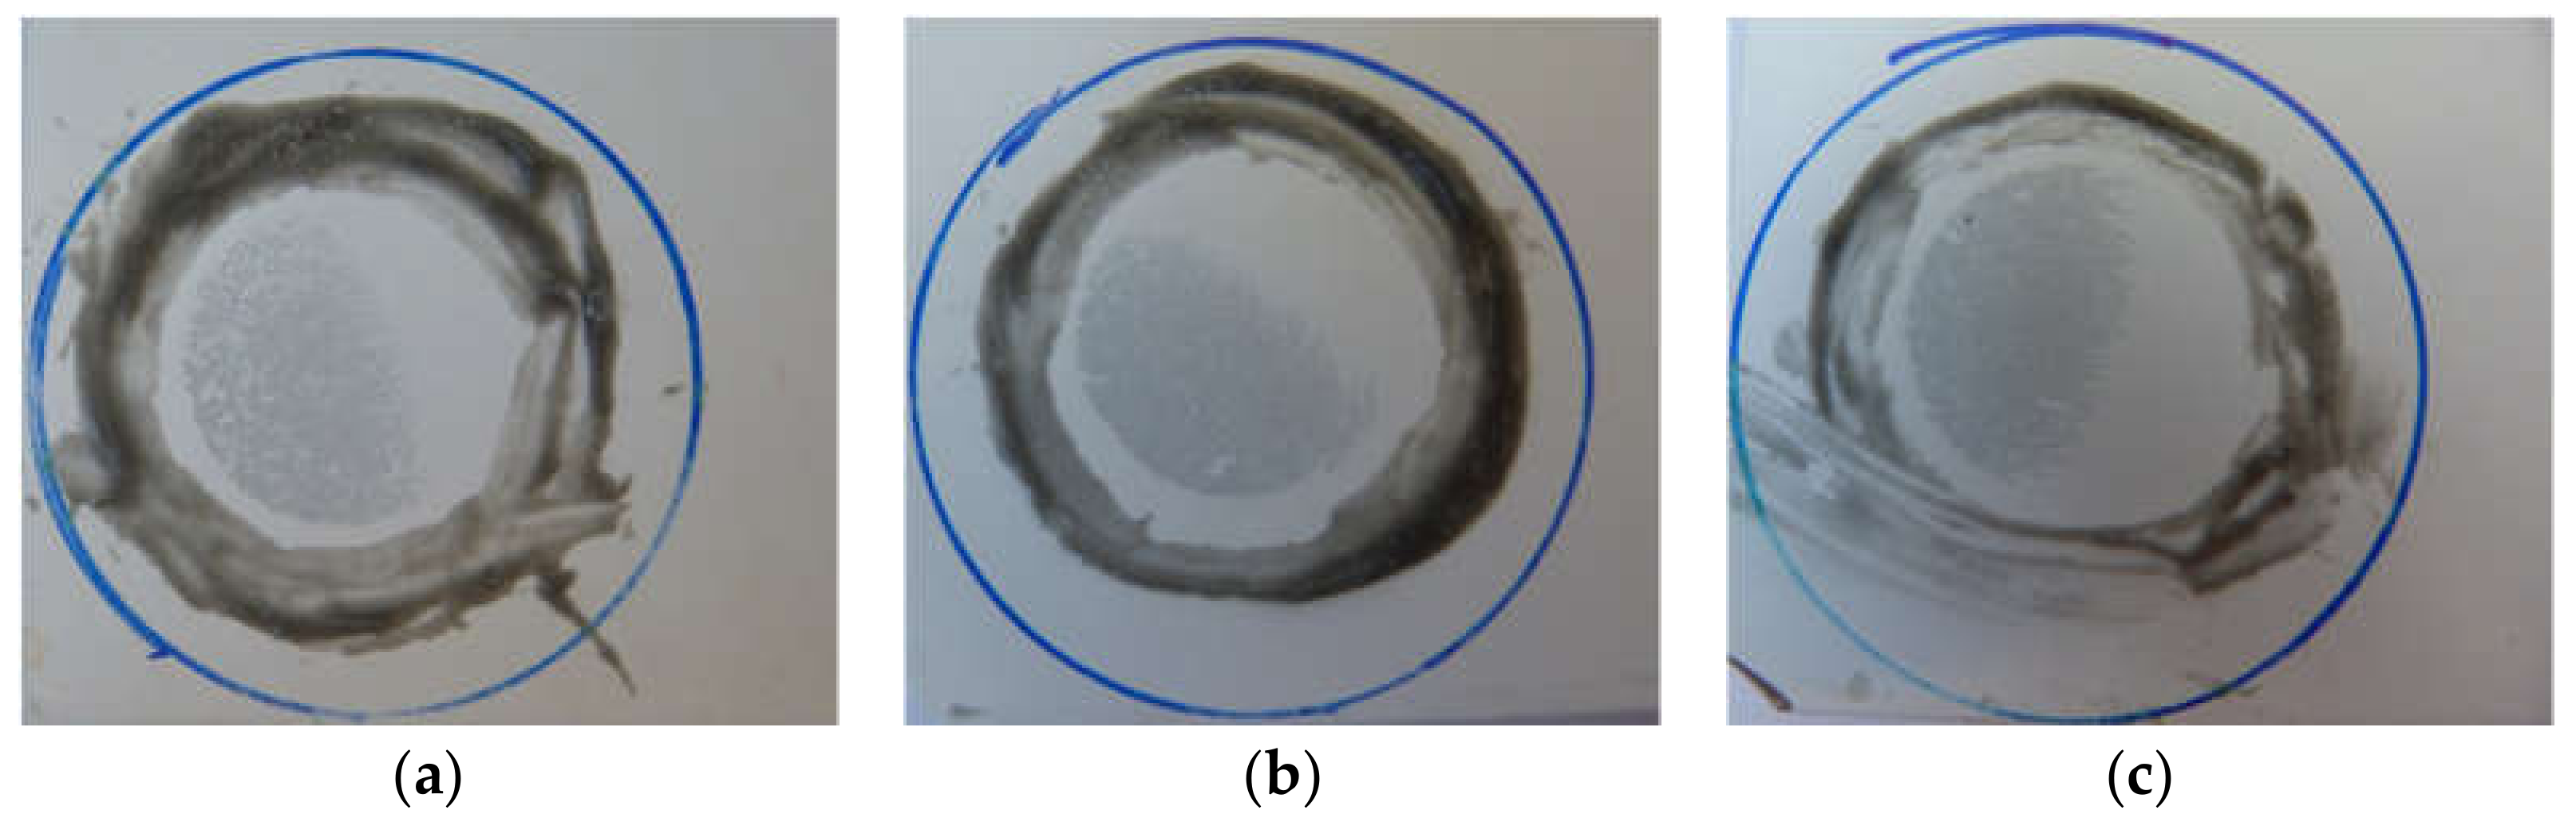
Figure 13, Figure 14, Figure 15 and Figure 16 present the results based on the visual inspection of the affected area after the adhesion test according to ISO 4624 [69]. Regarding these results, the UV and humidity test (with a larger area removed by the sand from Dubai) and the damp heat test (with a similar paint layer area affected by both sand types) were the most destructive tests. These results are in accordance with the conclusions already stated about the paint layer reflectance losses in the preliminary and extended weathering tests. Both the temperature cycling and the radiation with temperature and humidity tests did not damage the paint layer for any sample. Once again, the samples tested in the weathering experiments without sand were not affected at all by the adhesion test. This means that the deterioration produced in the backside paint layers in some of the samples after the adhesion test was evidently due to the interaction between the deposited sand and the paint layers during the accelerated aging experiments.

3.4. CASS Test

This section includes the results of the third set of samples, which were introduced to the CASS test after being submitted to the preliminary weathering tests. As can be seen in Table 5, no significant reflectance loss was perceived in any of the samples. This means that, although degradation of the paint layer of some samples was noted in other tests, this test is not useful to highlight a reflectance loss of the silver layer of the reflectors and it is not recommended for further studies focused on the backside paints.

4. Conclusions

A novel research study was accomplished to assess the degradation of the backside paints of solar reflectors for CSP plants due to the interaction of the deposited sand and soil particles under the influence of ambient conditions. According to the results obtained, no reflectance decay of the silver layer was observed in any of the tests performed (including preliminary weathering tests, extended weathering tests, and the CASS test). This is the expected behavior because the sand was deposited on the backside of the reflector samples and the possible degradation will appear in the back coating but not reach the silver layer. However, it is still very important to evaluate the degradation of the paint layers because they are responsible for the protection of the reflective silver layer from further attack under ambient conditions. Regarding to the paint layer degradation due to the interaction with soil deposition, the following conclusions can be made:
  • The representative ambient conditions, simulated by radiation with temperature and humidity tests, did not show any degradation of the paint layers.
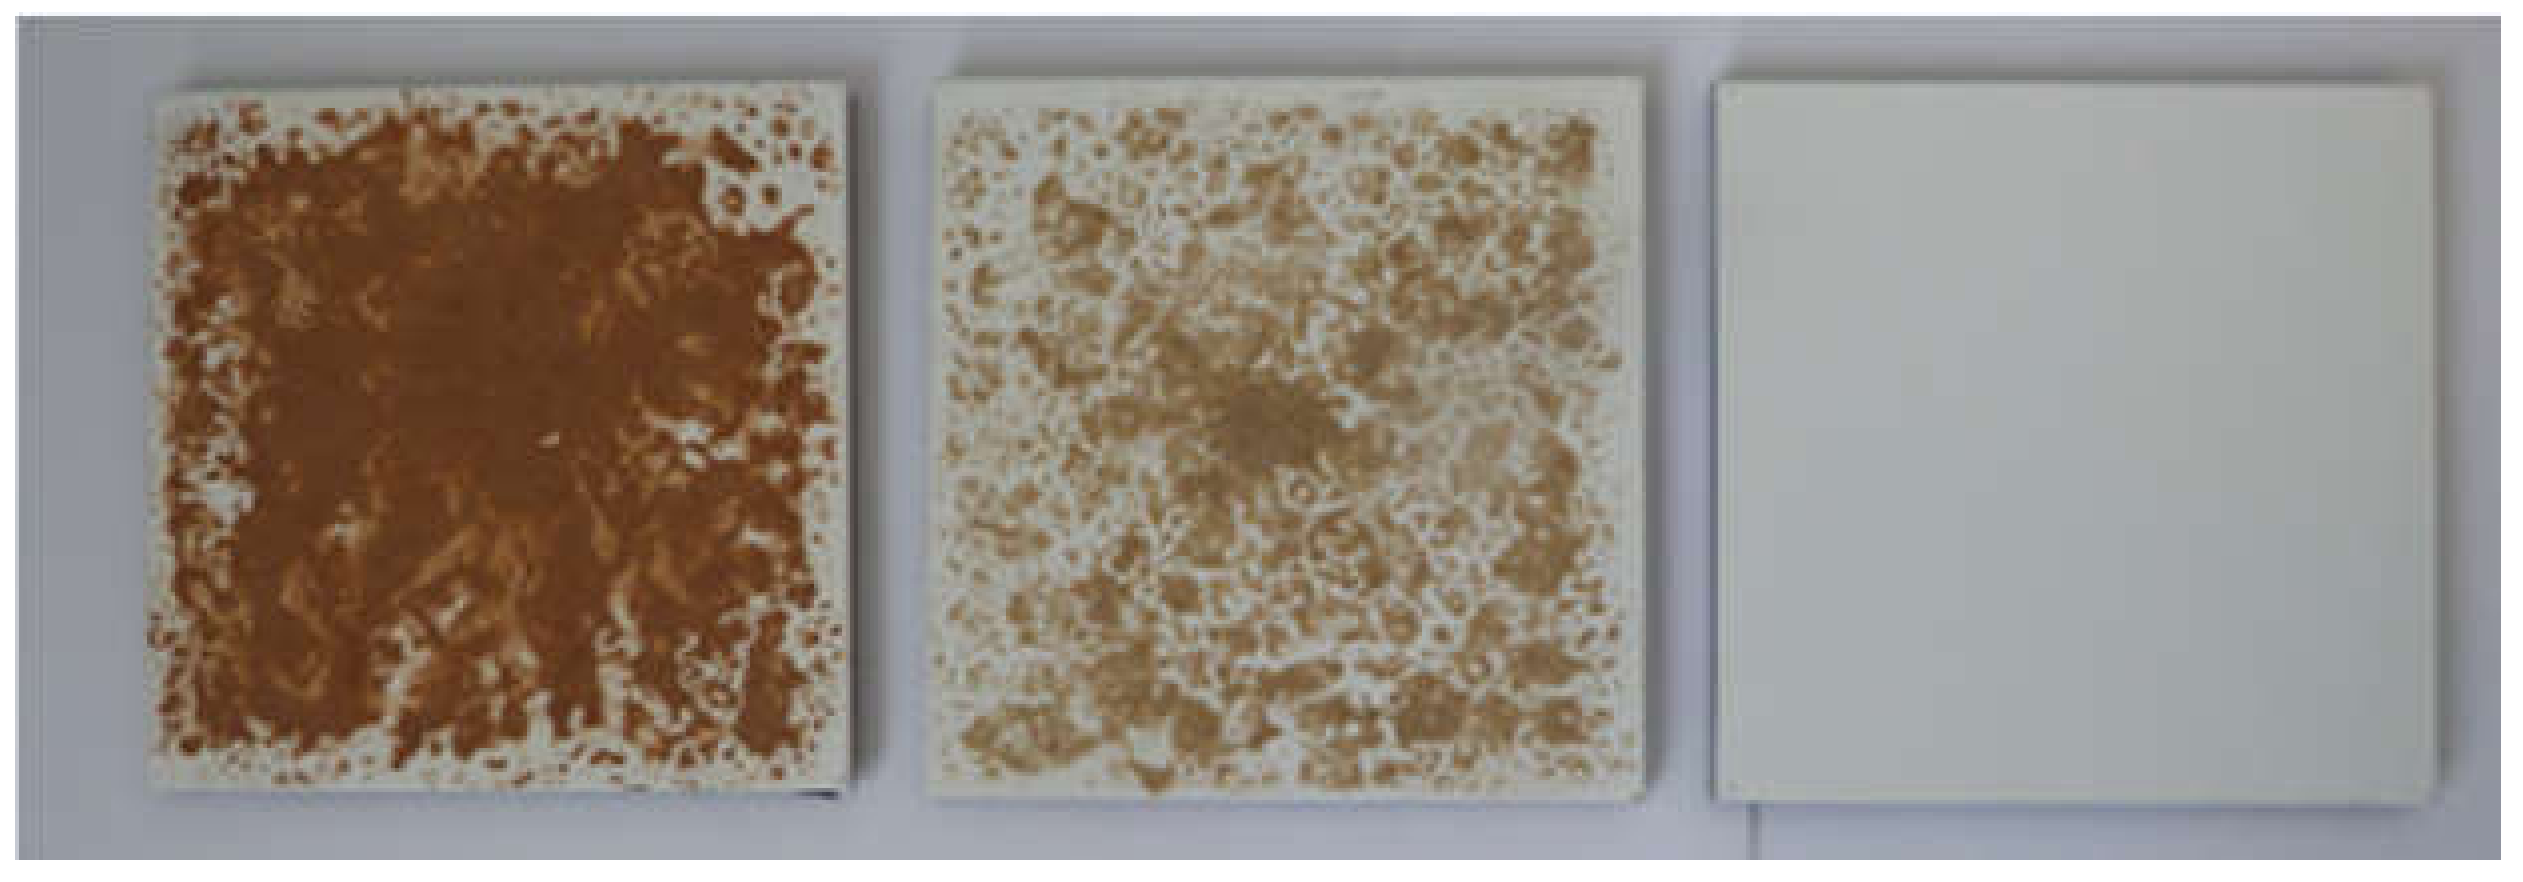
  • The samples tested in the weathering experiments without sand were not affected at all by the cross-cut and adhesion tests. This means that the deterioration produced in the back-paint layers after the mechanical tests was clearly caused by the interaction between the deposited sand and the paint layers during the accelerated aging experiments.
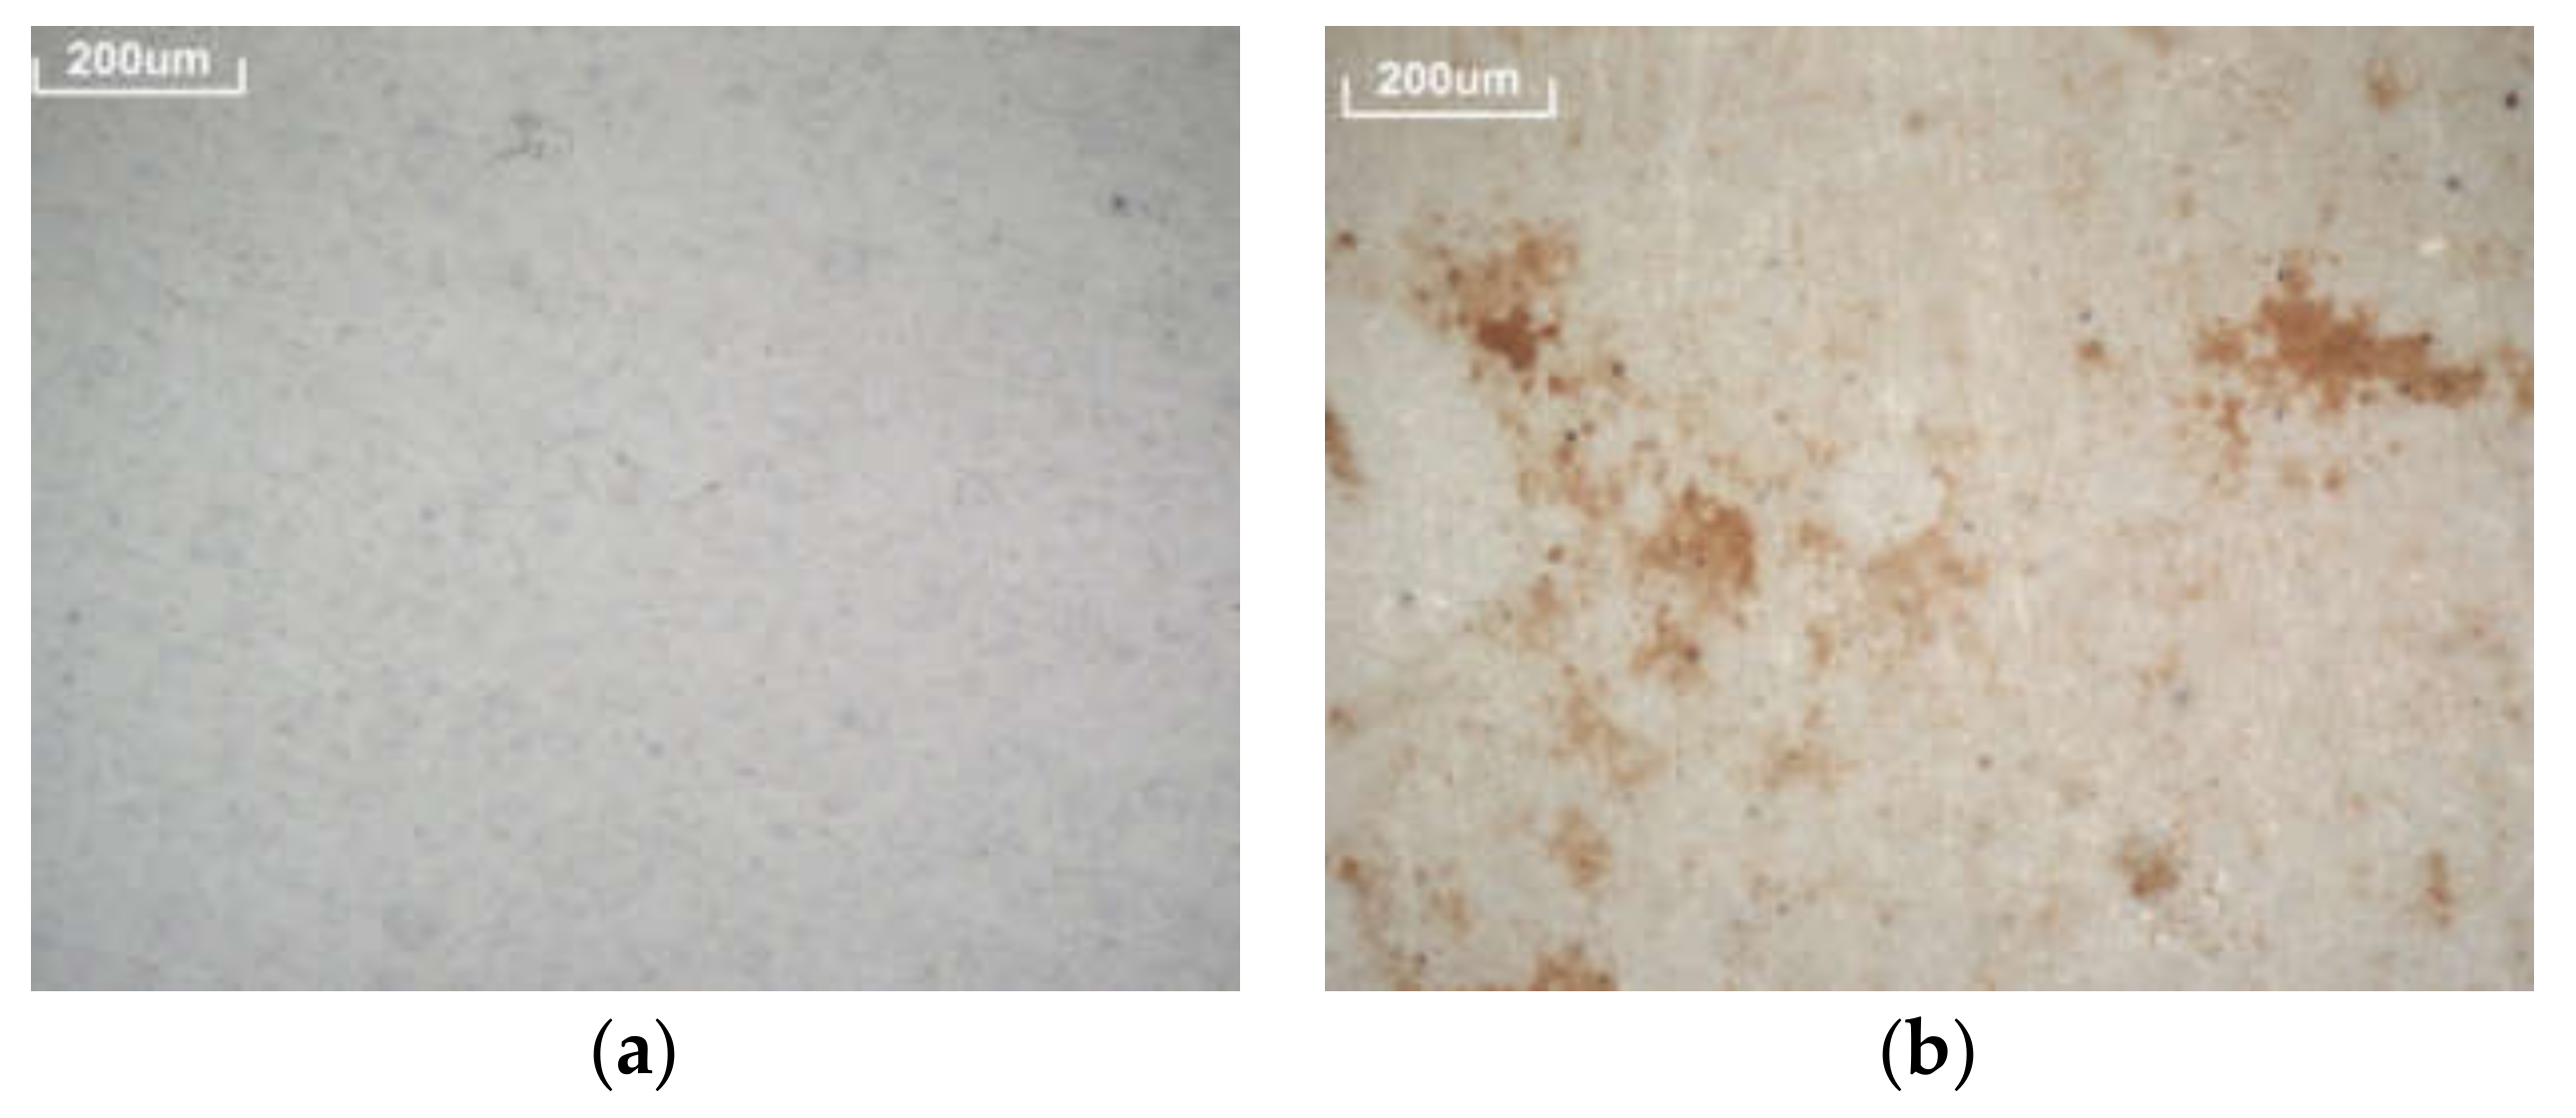
  • The accelerated conditions that produced the highest deterioration of the backside layers were those simulated by the damp heat test (high temperature in combination with high humidity), followed by the temperature cycling test with humidity (sharp temperature variations). In these cases, the sand from Ouarzazate was more aggressive than the sand from Dubai. This phenomenon was detected both in the preliminary and extended weathering tests, as well as in the mechanical tests (cross-cut and adhesion tests).
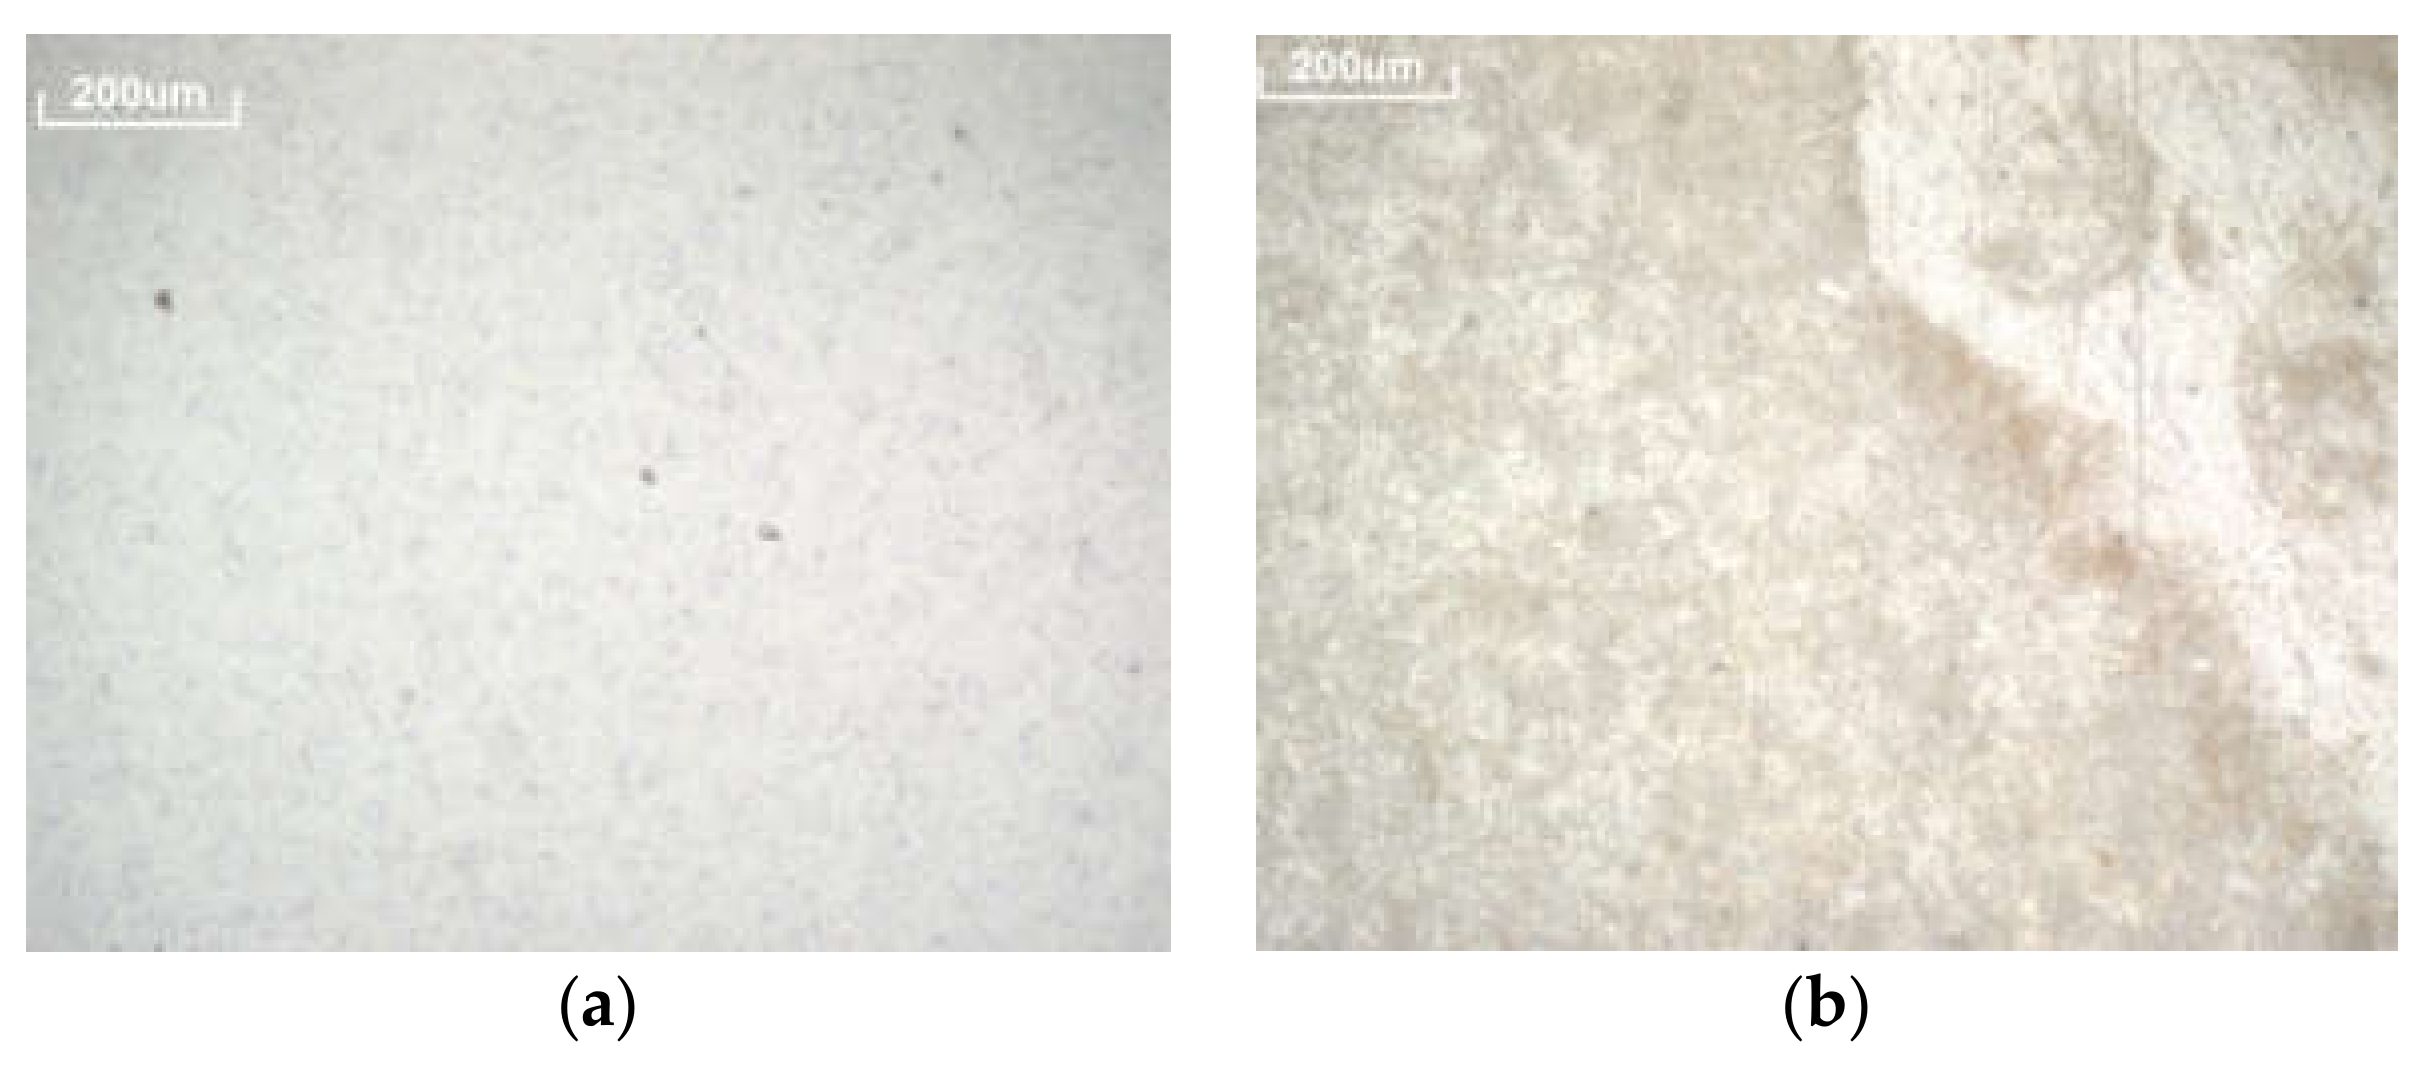
  • The ambient conditions simulated by the UV and humidity test in combination with sand from Dubai also was shown to be destructive. This effect was noticed both in the extended weathering tests and the adhesion test.
  • With respect to the testing protocol proposed in this work, all of the experiments performed generated significant conclusions, except the CASS test, which is not recommended for further studies focused on the backside paints. Therefore, for further similar studies it is advisable to apply the same testing protocol, avoiding the CASS test.
Finally, from the results of this work it can be concluded that a specific cleaning study of the backside paints of the reflectors would be recommended to extend the useful lifetime of the mirrors if climate conditions with high temperature and humidity and extreme temperature changes occur, in locations with sand exhibiting chemical compositions similar to the Ouarzazate sand, and when climate conditions with UV radiation and humidity occur in areas with sand exhibiting chemical compositions similar to the Dubai sand. As most CSP plant locations are not found in such climate conditions, no major issue in this sense is expected.

Acknowledgments

This project received funding from the European Union’s Horizon 2020 research and innovation program under grant agreement No 654479, project WASCOP.

Author Contributions

Aránzazu Fernández-García and Florian Sutter conceived and designed the experiments; Adel Juaidi and Lucía Martínez-Arcos performed the experiments; Adel Juaidi and Francisco Manzano Agugliaro analyzed the data; Aránzazu Fernández-García, Adel Juaidi, and Lucía Martínez-Arcos wrote the paper.

Conflicts of Interest

The authors declare no conflict of interest.

Nomenclature

Symbols
DUDubai
Gbdirect solar irradiance (W/m2)
hhemispherical (−)
OUOuarzazate
RHrelative humidity (%)
sspecular (−)
Ttemperature (°C)
θiincidence angle (°)
λwavelength (nm)
ρreflectance (−)
ϕacceptance angle (mrad)
Acronyms
CASScopper-accelerated acetic acid salt spray (CASS)
CIEMATCentro de Investigaciones Energéticas Medioambientales y Tecnológicas (Energy, Environment and Technology Research Center, Spain)
CSPconcentrating solar power
DLRDeutsches Zentrum für Luft- und Raumfahrt (German Aerospace Center, Germany)
DNIdirect normal irradiance
ESTELAEuropean Solar Thermal Electricity Association
IEAInternational Energy Agency
MASENMENAMoroccan Agency for Solar EnergyMiddle East and North Africa
O&Moperation and maintenance
OPACOptical Aging Characterization
PSAPlataforma Solar de Almería (Spain)
PVphotovoltaics
SEMscanning electron microscope
STCsolar thermal collector
STEsolar thermal electricity
UAEUnited Arab Emirates

References

  1. Baños, R.; Manzano-Agugliaro, F.; Montoya, F.G.; Gil, C.; Alcayde, A.; Gómez, J. Optimization methods applied to renewable and sustainable energy: A review. Renew. Sustain. Energy Rev. 2011, 15, 1753–1766. [Google Scholar] [CrossRef]
  2. El-Katiri, L. A Roadmap for Renewable Energy in the Middle East and North Africa; Oxford Institute for Energy Studies, University of Oxford: Oxford, UK, 2014; pp. 1–52. [Google Scholar]
  3. Jäger-Waldau, A. Photovoltaics and renewable energies in Europe. Renew. Sustain. Energy Rev. 2007, 11, 1414–1437. [Google Scholar] [CrossRef]
  4. Montoya, F.G.; Aguilera, M.J.; Manzano-Agugliaro, F. Renewable energy production in Spain: A review. Renew. Sustain. Energy Rev. 2014, 33, 509–531. [Google Scholar] [CrossRef]
  5. Kousksou, T.; Allouhi, A.; Belattar, M.; Jamil, A.; El Rhafiki, T.; Arid, A.; Zeraouli, Y. Renewable energy potential and national policy directions for sustainable development in Morocco, 2015. Renew. Sustain. Energy Rev. 2015, 47, 46–57. [Google Scholar] [CrossRef]
  6. Solangi, K.H.; Islam, M.R.; Saidur, R.; Rahim, N.A.; Fayaz, H. A review on global solar energy policy. Renew. Sustain. Energy Rev. 2011, 15, 2149–2163. [Google Scholar] [CrossRef]
  7. Ab Kadir, M.Z.A.; Rafeeu, Y.; Adam, N.M. Prospective scenarios for the full solar energy development in Malaysia. Renew. Sustain. Energy Rev. 2010, 14, 3023–3031. [Google Scholar] [CrossRef]
  8. Hernández-Escobedo, Q.; Rodríguez-García, E.; Saldaña-Flores, R.; Fernández-García, A.; Manzano-Agugliaro, R. Solar energy resource assessment in Mexican states along the Gulf of Mexico. Renew. Sustain. Energy Rev. 2015, 43, 216–238. [Google Scholar] [CrossRef]
  9. Porras-Prieto, C.J.; Benedicto-Schönemann, S.; Mazarrón, F.R.; Benavente, R.M. Profitability Variations of a Solar System with an Evacuated Tube Collector According to Schedules and Frequency of Hot Water Demand. Energies 2016, 9, 1053. [Google Scholar] [CrossRef]
  10. Manzano-Agugliaro, F.; Alcayde, A.; Montoya, F.G.; Zapata-Sierra, A.; Gil, C. Scientific production of renewable energies worldwide: An overview. Renew. Sustain. Energy Rev. 2013, 18, 134–143. [Google Scholar] [CrossRef]
  11. Kommalapati, R.; Kadiyala, A.; Shahriar, T.; Huque, Z. Review of the Life Cycle Greenhouse Gas Emissions from Different Photovoltaic and Concentrating Solar Power Electricity Generation Systems. Energies 2017, 10, 350. [Google Scholar] [CrossRef]
  12. Mills, D. Advances in solar thermal electricity technology. Sol. Energy 2004, 76, 19–31. [Google Scholar] [CrossRef]
  13. Pavlović, T.M.; Radonjić, I.S.; Milosavljević, D.D.; Pantić, L.S. A review of concentrating solar power plants in the world and their potential use in Serbia. Renew. Sustain. Energy Rev. 2012, 16, 3891–3902. [Google Scholar] [CrossRef]
  14. Py, X.; Azoumah, Y.; Olives, R. Concentrated solar power: Current technologies, major innovative issues and applicability to West African countries. Renew. Sustain. Energy Rev. 2013, 18, 306–315. [Google Scholar] [CrossRef]
  15. Technology Roadmap: Solar Thermal Electricity; Technology Report; OECD/IEA: Paris, France, 2014.
  16. Asim, N.; Sopian, K.; Ahmadi, S.; Saeedfar, K.; Alghoul, M.A.; Saadatian, O.; Zaidi, S.H. A review on the role of materials science in solar cells. Renew. Sustain. Energy Rev. 2012, 16, 5834–5847. [Google Scholar] [CrossRef]
  17. Vasconcelos Sampaio, P.G.; Aguirre González, M.O. Photovoltaic solar energy: Conceptual framework. Renew. Sustain. Energy Rev. 2017, 74, 590–601. [Google Scholar] [CrossRef]
  18. Zhao, J.; Ji, Y.; Yuan, Y.; Zhang, Z.; Lu, J. Energy-Saving Analysis of Solar Heating System with PCM Storage Tank. Energies 2018, 11, 237. [Google Scholar] [CrossRef]
  19. Kennedy, C.E.; Terwilliger, K. Optical Durability of Candidate Solar Reflectors. J. Sol. Energy Eng. 2005, 127, 262–269. [Google Scholar] [CrossRef]
  20. López Martín, R.; Cantos-Soto, M.E.; Fernández-García, A.; Alguacil-Algarrada, M.; Sutter, F. Competitive examination of solar reflectors durability under accelerated aging. In Proceedings of the SolarPACES, Marrakech, Morocco, 11–14 September 2012. [Google Scholar]
  21. Concentrating Solar Power, Renewable Energy Technologies: Cost Analysis Series, Volume 1: Power Sector; IRENA Working Paper; Issue 2/5; IRENA: Masdar City, UAE, June 2012.
  22. Fernández-García, A.; Zarza, E.; Valenzuela, L.; Pérez, M. Parabolic-trough solar collectors and their applications. Renew. Sustain. Energy Rev. 2010, 14, 1695–1721. [Google Scholar] [CrossRef]
  23. Sutter, F.; Meyen, S.; Fernández-García, A.; Heller, P. Spectral characterization of specular reflectance of solar mirrors. Sol. Energy Mater. Sol. Cells 2016, 145, 248–254. [Google Scholar] [CrossRef]
  24. Materials Roadmap Enabling Low-Carbon Energy Technologies; Technology Report 1609; European Commission: Brussels, Belgium, 2011.
  25. Kennedy, C.E. Advances in Concentrating Solar Power Collectors: Mirrors and Solar-Selective Coatings; Technology Report NREL/PR-550–43695; NREL: Golden, CO, USA, 2007.
  26. Kennedy, C.E.; Smilgys, R.V.; Kirkpatrick, D.A.; Ross, J.S. Optical performance and durability of solar reflectors protected by an alumina coating. Thin Solid Films 1997, 304, 303–309. [Google Scholar] [CrossRef]
  27. Kennedy, C.E.; Terwilliger, K.; Milbourne, M. Development and Testing of Solar Reflectors Technical Report; Technology Report NREL/CP-520-36582; NREL: Golden, CO, USA, 2004.
  28. Pitchumani, R. Concentrating Solar Power Program; Sunshot Grand Challenge and Peer Review; DOE: Anaheim, CA, USA, 2014. [Google Scholar]
  29. García-Segura, A.; Fernández-García, A.; Ariza, M.J.; Sutter, F.; Valenzuela, L. Durability studies of solar reflectors: A review. Renew. Sustain. Energy Rev. 2016, 62, 453–467. [Google Scholar] [CrossRef]
  30. Solar Thermal Electricity: Strategic Research Agenda 2020–2025; ESTELA: Brussels, Belgium, 2012.
  31. Costa, S.C.; Diniz, A.S.A.; Kazmerski, L.L. Dust and soiling issues and impacts relating to solar energy systems: Literature review update for 2012–2015. Renew. Sustain. Energy Rev. 2016, 63, 33–61. [Google Scholar] [CrossRef]
  32. Conceição, T.; Silva, H.G.; Mirão, J.; Collares-Pereira, M. Organic Soiling: The Role of Pollen in PV Module Performance Degradation. Energies 2018, 11, 294. [Google Scholar] [CrossRef]
  33. Wolfertstetter, F.; Pottler, K.; Geuder, N.; Affolter, R.; Merrouni, A.A.; Mezrhab, A.; Pitz-Paal, R. Monitoring of Mirror and Sensor Soiling with TraCS for Improved Quality of Ground based Irradiance Measurements. Energy Procedia 2014, 49, 2422–2432. [Google Scholar] [CrossRef] [Green Version]
  34. Bouaddi, S.; Ihlal, A.; Fernández-García, A. Soiled CSP solar reflectors modeling using dynamic linear models. Sol. Energy 2015, 122, 847–863. [Google Scholar] [CrossRef]
  35. Sarver, T.; Al-Qaraghuli, A.; Kazmerski, L.L. A comprehensive review of the impact of dust on the use of solar energy: History, investigations, results, literature, and mitigation approaches. Renew. Sustain. Energy Rev. 2013, 22, 698–733. [Google Scholar] [CrossRef]
  36. Vivar, M.; Herrero, R.; Antón, I.; Martínez-Moreno, F.; Moretón, R.; Sala, G.; Blakers, A.W.; Smeltink, J. Effect of soiling in CPV systems. Sol. Energy 2010, 84, 1327–1335. [Google Scholar] [CrossRef] [Green Version]
  37. Cohen, G.E.; Kearney, D.W.; Kolb, G.J. Final Report on the Operation and Maintenance Improvement Program for Concentrating Solar Power Plants; Technology Report SAND99-1290; Sandia National Laboratories: Albuquerque, NM, USA, 1999. [Google Scholar]
  38. Fernández-García, A.; Álvarez-Rodrigo, L.; Martínez-Arcos, L.; Aguiar, R.; Márquez-Payés, J.M. Study of Different Cleaning Methods for Solar Reflectors Used in CSP Plants. Energy Procedia 2014, 49, 80–89. [Google Scholar] [CrossRef]
  39. Berg, R.S. Heliostat Dust Buildup and Cleaning Studies; Technology Report SAND-78-0510; Sandia National Laboratories: Albuquerque, NM, USA, 1978. [Google Scholar]
  40. Roth, E.P.; Pettit, R.B. The Effect of Soiling on Solar Mirrors and Techniques Used to Maintain High Reflectivity. In Solar Materials Science, 1st ed.; Academic Press: New York, NY, USA, 1980; Chapter 6; pp. 199–227. ISBN 978-0-12-511160-7. [Google Scholar]
  41. Morris, V.L. Cleaning agents and techniques for concentrating solar collectors. Sol. Energy Mater. 1980, 3, 35–55. [Google Scholar] [CrossRef]
  42. Biryukov, S.; Faiman, D.; Goldfeld, A. An Optical System for the Quantitative Study of Particulate Contamination on Solar Collector Surfaces. Sol. Energy 1999, 66, 371–378. [Google Scholar] [CrossRef]
  43. Pettit, R.B.; Freese, J.M.; Roth, E.P. Studies of Dust Accumulation on Solar-Mirror Materials; Technology Report SAND-81-0075C; Sandia National Laboratories: Albuquerque, NM, USA, 1981. [Google Scholar]
  44. Fernández-García, A. Estudio de la Reflectancia Especular en Plantas de Captadores Solares Cilindroparabólicos, 1st ed.; CIEMAT: Madrid, Spain, 2012; ISBN 9788478346721. [Google Scholar]
  45. Bethea, R.M.; Barriger, M.T.; Williams, P.F.; Chin, S. Environmental effects on solar concentrator mirrors. Sol. Energy 1981, 27, 497–511. [Google Scholar] [CrossRef]
  46. Heimsath, A.; Heck, M.; Morin, G.; Kiewitt, W.; Platzer, W. Soiling of aluminum and glass mirrors under different climatic conditions and techno-economic optimization of cleaning intervals. In Proceedings of the SolarPACES, Perpignan, France, 21–24 September 2010. [Google Scholar]
  47. Tahboub, Z.; Dahleh, B.; Goebel, O. Solar Mirrors Soiling Campaign Abu Dhabi. In Proceedings of the SolarPACES, Marrakech, Morocco, 11–14 September 2012. [Google Scholar]
  48. Deffenbaugh, D.M.; Green, S.T.; Svedeman, S.J. The effect of dust accumulation on line-focus parabolic trough solar collector performance. Sol. Energy 1986, 36, 139–146. [Google Scholar] [CrossRef]
  49. Bouaddi, S.; Ihlal, A.; Fernández-García, A. Comparative analysis of soiling of CSP mirror materials in arid zones. Renew. Energy 2017, 101, 437–449. [Google Scholar] [CrossRef]
  50. Roth, E.P.; Anaya, A.J. The Effect of Natural Soiling and Cleaning on the Size Distribution of Particles Deposited on Glass Mirrors. J. Sol. Energy Eng. 1980, 102, 248–256. [Google Scholar] [CrossRef]
  51. Bouaouadja, N.; Bouzid, S.; Hamidouche, M.; Bousbaa, C.; Madjoubi, M. Effects of sandblasting on the efficiencies of solar panels. Appl. Energy 2000, 65, 99–105. [Google Scholar] [CrossRef]
  52. Nelson, A. Understanding soil adhesion in Concentrating Solar Power Plants: A novel analysis of soil Characteristics. In Proceedings of the SolarPACES, Granada, Spain, 20–23 September 2011. [Google Scholar]
  53. Karim, M.; Naamane, S.; El Amrani EL Hassani, I.; Delord, C.; Belcadi, S.; Tochon, P.; Bennouna, A. Towards the prediction of CSP mirrors wear: Methodology of analysis of influencing parameters on the mirrors surface degradation: Application in two different sites in Morocco. Sol. Energy 2014, 108, 41–50. [Google Scholar] [CrossRef]
  54. Karim, M.; Naamane, S.; Delord, C.; Bennouna, A. Study of the Surface Damage of Glass Reflectors Used in Concentrated Solar Power Plants. Energy Procedia 2015, 69, 106–115. [Google Scholar] [CrossRef]
  55. Wiesinger, F.; Sutter, F.; Fernández-García, A.; Reinhold, J.; Pitz-Paal, R. Sand erosion on solar reflectors: Accelerated simulation and comparison with field data. Sol. Energy Mater. Sol. Cells 2016, 145, 303–313. [Google Scholar] [CrossRef]
  56. Wette, J.; Sutter, F.; Fernández-García, A.; Ziegler, S.; Dasbach, R. Comparison of Degradation on Aluminum Reflectors for Solar Collectors due to Outdoor Exposure and Accelerated Aging. Energies 2016, 9, 916. [Google Scholar] [CrossRef]
  57. Wiesinger, F.; Sutter, F.; Wolfertstetter, F.; Hanrieder, N.; Fernández-García, A.; Pitz-Paal, R.; Schmücker, M. Assessment of the erosion risk of sandstorms on solar energy technology at two sites in Morocco. Sol. Energy 2018, 162, 217–228. [Google Scholar] [CrossRef]
  58. Wiesinger, F.; San Vicente, G.; Fernández-García, A.; Sutter, F.; Morales, A.; Pitz-Paal, R. Sandstorm erosion testing of anti-reflective glass coatings for solar energy applications. Sol. Energy Mater. Sol. Cells 2018, 179, 10–16. [Google Scholar] [CrossRef]
  59. Bouzid, S.; Bouaouadja, N. Effect of impact angle on glass surfaces eroded by sand blasting. J. Eur. Ceram. Soc. 2000, 20, 481–488. [Google Scholar] [CrossRef]
  60. Holze, C.; Brucks, A. Sand abrasion testing: Characterization of abrasive resistance of optical surfaces in arid operational areas using standard and adapted methods. In Proceedings of the SolarPACES, Granada, Spain, 20–23 September 2011. [Google Scholar]
  61. Sansom, C.; Comley, P.; Bhattacharyya, D.; Macerol, N. A comparison of Polymer film and Glass Collectors for concentrating solar power. In Proceedings of the SolarPACES, Las Vegas, NV, USA, 17–20 September 2011. [Google Scholar]
  62. Sansom, C.; Comley, P.; King, P.; Almond, H.; Atkinson, C.; Endaya, E. Predicting the Effects of Sand Erosion on Collector Surfaces in CSP Plants. Energy Procedia 2015, 69, 198–207. [Google Scholar] [CrossRef]
  63. Sansom, C.; Fernández-García, A.; Sutter, F.; Almond, H.; King, P.; Martínez-Arcos, L. Soiling and Cleaning of Polymer Film Solar Reflectors. Energies 2016, 9, 1006. [Google Scholar] [CrossRef]
  64. Sutter, F.; Fernandez-García, A.; Wette, J.; Heller, P. Comparison and evaluation of accelerated aging tests for reflectors. Energy Procedia 2014, 49, 1718–1727. [Google Scholar] [CrossRef]
  65. Paints and Varnishes—Methods of Exposure to Laboratory Light Sources—Part 3: Fluorescent UV Lamps; ISO 16474-3; ISO: Geneva, Switzerland, 2013.
  66. Concentrator Photovoltaic (cpv) Modules and Assemblies—Designed Modification and Type Approval; IEC 62108; International Electrochemical Commission (IEC): Geneva, Switzerland, 2007.
  67. Reflector Panels for Concentrating Solar Technologies; UNE 206016; AENOR: Madrid, Spain, 2018.
  68. Paints and Varnishes—Cross-Cut Test; ISO 2409; ISO: Geneva, Switzerland, 2007.
  69. Paints and Varnishes—Pull-off Test for Adhesion; ISO 4624; ISO: Geneva, Switzerland, 2016.
  70. Corrosion Tests in Artificial Atmospheres—Salt Spray Tests; ISO 9227; ISO: Geneva, Switzerland, 2006.
  71. Sutter, F.; Fernández-García, A.; Heller, P.; Anderson, K.; Wilson, G.; Schmückerd, M.; Marvig, P. Durability testing of silvered-glass mirrors. Energy Procedia 2015, 69, 1568–1577. [Google Scholar] [CrossRef] [Green Version]
  72. SolarPACES Reflectance Guideline. Parameters and Method to Evaluate the Reflectance Properties of Reflector Materials for Concentrating Solar Power Technology. Version 3.0. March 2018. Available online: http://www.solarpaces.org/wp-content/uploads/20180320_SolarPACES-Reflectance-Guidelines-V3.pdf (accessed on 30 March 2018).
  73. Fernández-García, A.; Sutter, F.; Martínez-Arcos, L.; Sansom, C.; Wolfertstetter, F.; Delord, C. Equipment and methods for measuring reflectance of concentrating solar reflector materials. Sol. Energy Mater. Sol. Cells 2017, 167, 28–52. [Google Scholar] [CrossRef]
  74. Solar Thermal Electric Plants. Terminology; UNE 206009; AENOR: Madrid, Spain, 2013. [Google Scholar]
  75. Standard Test Method for Solar Absorptance, Reflectance, and Transmittance of Materials Using Integrating Spheres; ASTM E903-82; ASTM: West Conshohocken, PA, USA, 2012.
  76. Standard Tables for Reference Solar Spectral Irradiances: Direct Normal and Hemispherical on 37° Tilted Surface; ASTM G173-03; ASTM: West Conshohocken, PA, USA, 2003.
Figure 1. Mirror sample of second-surface silvered-glass reflectors before any test.
Energies 11 00808 g001
Figure 2. Picture of the two sands employed in the study, from Morocco (left) and the United Arab Emirates (UEA) (right).
Energies 11 00808 g002
Figure 3. The Dubai sand particles at 50× magnification (a) and 200× magnification (b).
Energies 11 00808 g003
Figure 4. The Ouarzazate sand particles at 50× magnification (a) and 200× magnification (b).
Energies 11 00808 g004
Figure 5. Picture of the set of samples after the sand deposition, with sand from Ouarzazate (left), with sand from Dubai (center), and without sand (right).
Energies 11 00808 g005
Figure 6. Scheme of the test campaign.
Energies 11 00808 g006
Figure 7. Paint layer of sample before (a) and after (b) the damp heat test with Ouarzazate sand.
Energies 11 00808 g007
Figure 8. Paint layer of sample before (a) and after (b) the temperature cycling with Ouarzazate sand.
Energies 11 00808 g008
Figure 9. Appearance of the surface affected by the cross-cut area performed after the UV and humidity test, for (a) the sample with sand from Ouarzazate, (b) the sample with sand from Dubai, and (c) the sample without sand.
Energies 11 00808 g009
Figure 10. Appearance of the surface affected by the cross-cut area performed after the damp heat test, for (a) the sample with sand from Ouarzazate, (b) the sample with sand from Dubai, and (c) the sample without sand.
Energies 11 00808 g010
Figure 11. Appearance of the surface affected by the cross-cut area performed after the radiation with temperature and humidity test, for (a) the sample with sand from Ouarzazate, (b) the sample with sand from Dubai, and (c) the sample without sand.
Energies 11 00808 g011
Figure 12. Appearance of the surface affected by the cross-cut area performed after the temperature cycling test, for (a) the sample with sand from Ouarzazate, (b) the sample with sand from Dubai, and (c) the sample without sand.
Energies 11 00808 g012
Figure 13. Appearance of the surface affected by the adhesion test area performed after the UV and humidity test, for (a) the sample with sand from Ouarzazate, (b) the sample with sand from Dubai, and (c) the sample without sand.
Energies 11 00808 g013
Figure 14. Appearance of the surface affected by the adhesion test area performed after the damp heat test, for (a) the sample with sand from Ouarzazate, (b) the sample with sand from Dubai, and (c) the sample without sand.
Energies 11 00808 g014
Figure 15. Appearance of the surface affected by the adhesion test area performed after the radiation with temperature and humidity test, for (a) the sample with sand from Ouarzazate, (b) the sample with sand from Dubai, and (c) the sample without sand.
Energies 11 00808 g015
Figure 16. Appearance of the surface affected by the adhesion test area performed after the temperature cycling test, for (a) the sample with sand from Ouarzazate, (b) the sample with sand from Dubai, and (c) the sample without sand.
Energies 11 00808 g016
Table 1. Analysis of Dubai and Ouarzazate sands.
CompoundDubai Sand Weight (%)Ouarzazate Sand Weight (%)
CaO62.0517.76
SiO226.7951.11
MgO3.302.80
Al2O33.0814.70
Fe2O32.038.02
K2O0.663.39
SO30.580.16
Na2O0.380.19
P2O50.380.52
SrO0.350.05
TiO20.150.97
Cl0.150.03
Others0.090.29
Total100.00100.00
Table 2. Results of reflectance differences from all samples, after the preliminary weathering tests. OU: Ouarzazate; DU: Dubai.
Test NameUV and Humidity CyclingDamp HeatRadiation with Temperature and HumidityTemperature Cycling
Sand typeOUDUOUDUOUDUOUDU
ρs,h ([280,2500] nm, 8°, h) (silver layer)−0.001−0.0020.0000.000−0.0020.0000.0000.000
ρλ,h (660 nm, 8°, h) (silver layer)−0.002−0.0020.0000.000−0.0020.0000.0000.000
ρλ,ϕ (660 nm, 15°, 12.5 mrad) (silver layer)−0.002−0.0020.0000.000−0.0020.0000.0000.000
ρs,h ([280,2500] nm, 8°, h) (backside paint layer)−0.011−0.009−0.0330.000−0.011−0.010−0.025−0.005
Table 3. Results of reflectance differences from the first set of samples, after the extended weathering tests. OU: Ouarzazate; DU: Dubai.
Test NameUV and Humidity CyclingDamp HeatRadiation with Temperature and HumidityTemperature Cycling
Sand typeOUDUOUDUOUDUOUDU
ρs,h ([280,2500] nm, 8°, h) (silver layer)−0.0010.0000.000−0.001−0.001−0.0010.000−0.001
ρλ,h (660 nm, 8°, h) (silver layer)−0.002−0.0010.000−0.0020.0000.0000.000−0.001
ρλ,ϕ (660 nm, 15°, 12.5 mrad) (silver layer)−0.0010.0000.000−0.003−0.001−0.0010.0000.000
ρs,h ([280,2500] nm, 8°, h) (backside paint layer)0.000−0.009−0.0090.0000.0000.0000.0000.000
Table 4. Results of the cross-cut experiment applied to the second set of samples after the preliminary weathering tests, according to ISO 2409.
Preliminary Weathering TestSand TypeClassificationInterpretation
UV and humidity cyclingOuarzazate0No detachment—none of the squares of the grid was detached
Dubai0
Without sand0
Damp heatOuarzazate2An area >5%, but <15% was affected
Dubai3Some squares detached partly or totally and an area <15%, but <35% was affected
Without sand0No detachment—none of the squares of the grid was detached
Radiation with temperature and humidityOuarzazate0No detachment—none of the squares of the grid was detached
Dubai0
Without sand0
Temperature cyclingOuarzazate3Some squares detached partly or totally and an area <15%, but <35% was affected
Dubai1A cross-cut area <5% was affected
Without sand0No detachment—none of the squares of the grid was detached
No testWithout sand [1]0No detachment—none of the squares of the grid was detached
Table 5. Results of reflectance differences from the third set of samples, after the copper-accelerated acetic acid salt spray (CASS) test. OU: Ouarzazate; DU: Dubai.
Test NameUV and Humidity CyclingDamp HeatRadiation with Temperature and HumidityTemperature Cycling
Sand typeOUDUOUDUOUDUOUDU
ρs,h ([280,2500] nm, 8°, h) (silver layer)0.0000.0000.0000.0000.0000.0000.0000.000
ρλ,h (660 nm, 8°, h) (silver layer)−0.0010.0000.000.0000.0000.0000.0000.000
ρλ,ϕ (660 nm, 15°, 12.5 mrad) (silver layer)0.0000.0000.000−0.0020.0000.0000.0000.000

