Reliability Field Test of the Air–Surface Temperature Ratio Method for In Situ Measurement of U-Values


Abstract
:1. Introduction
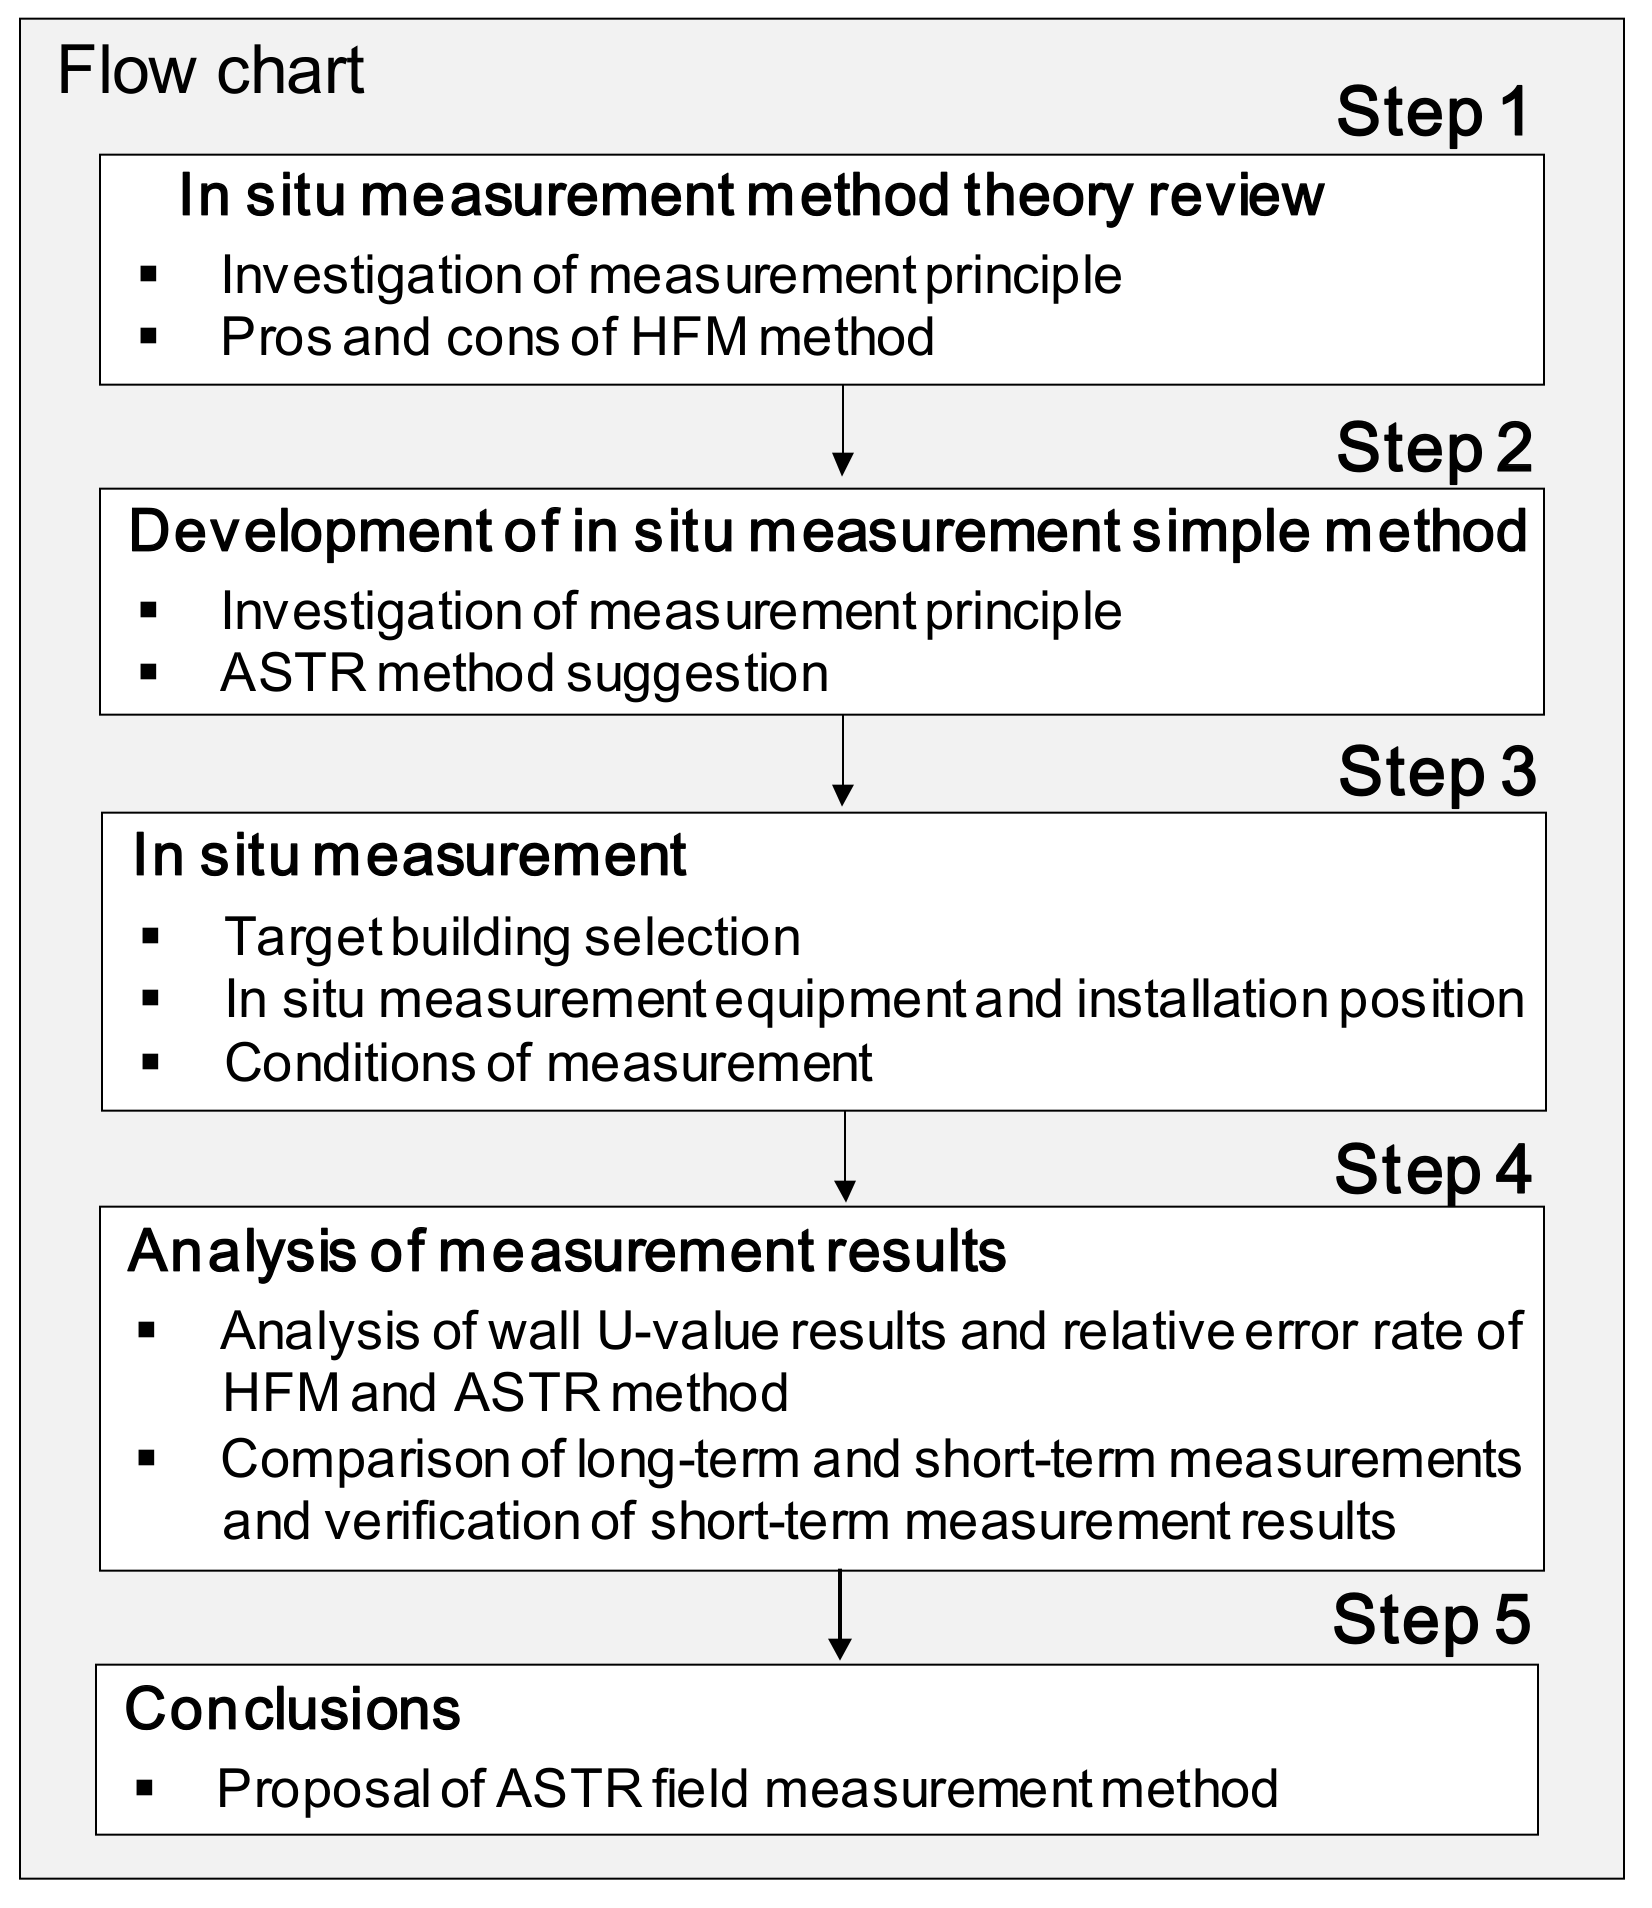
2. Methodology
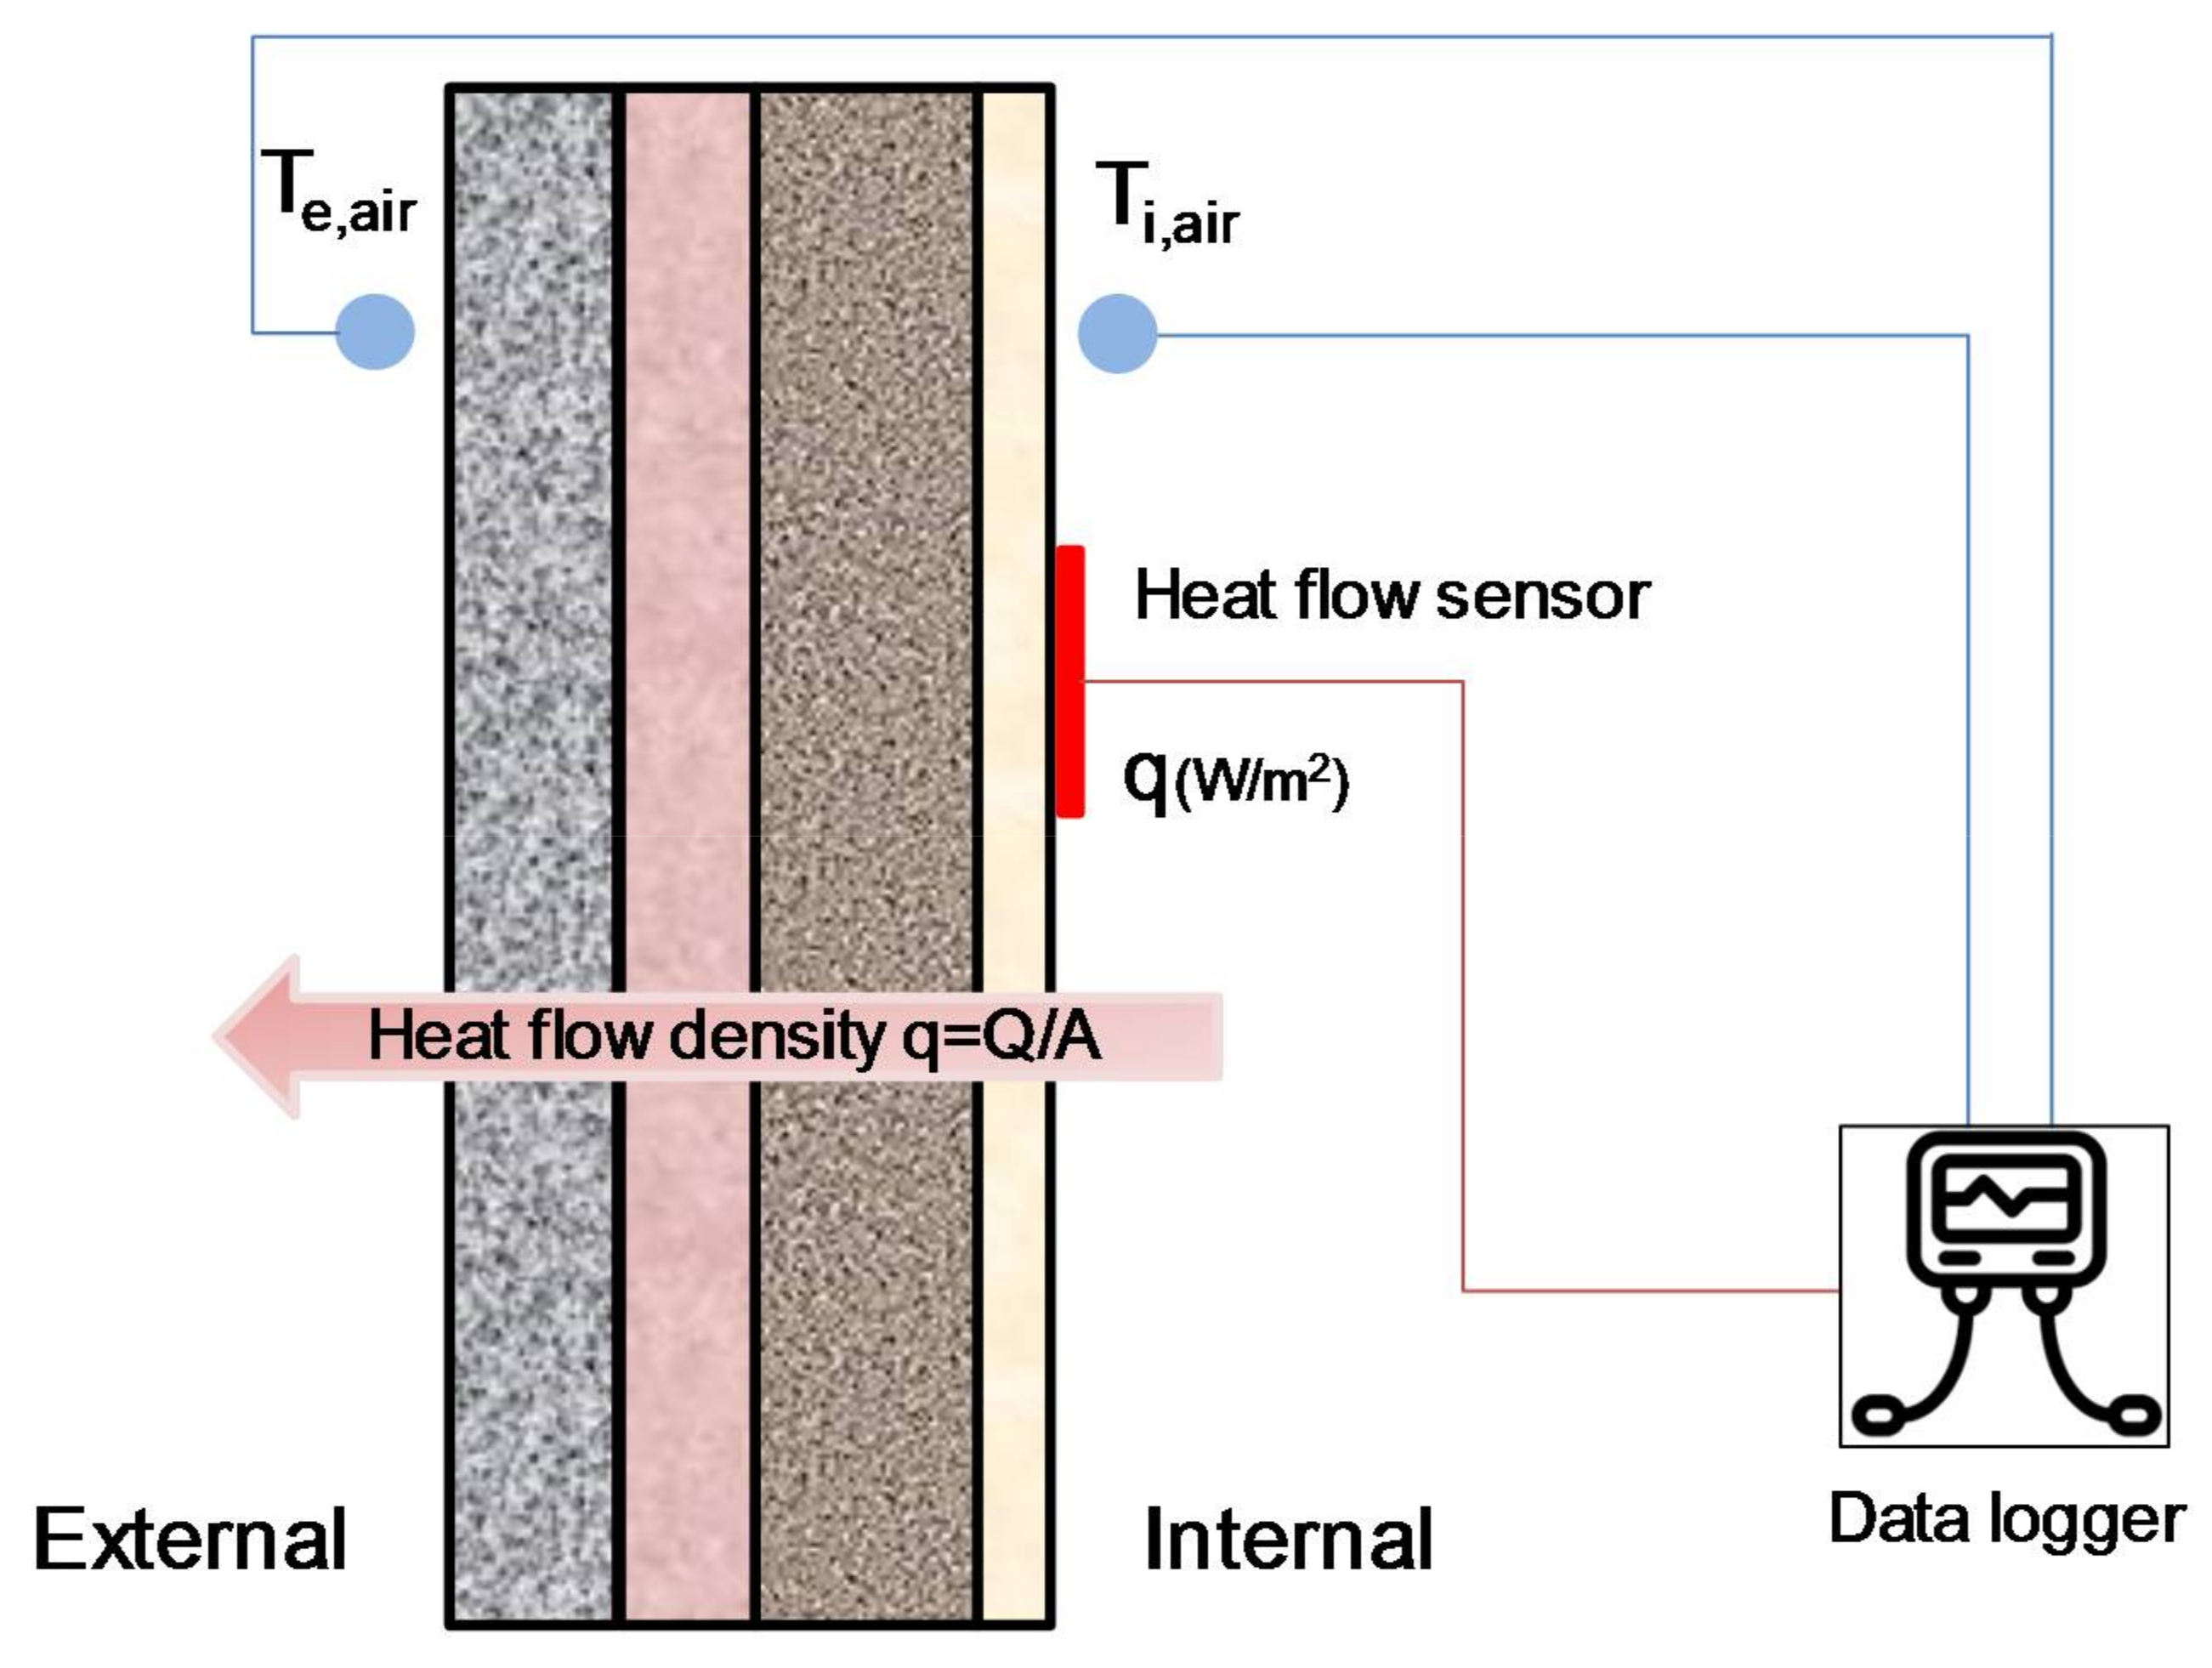
2.1. HFM Method
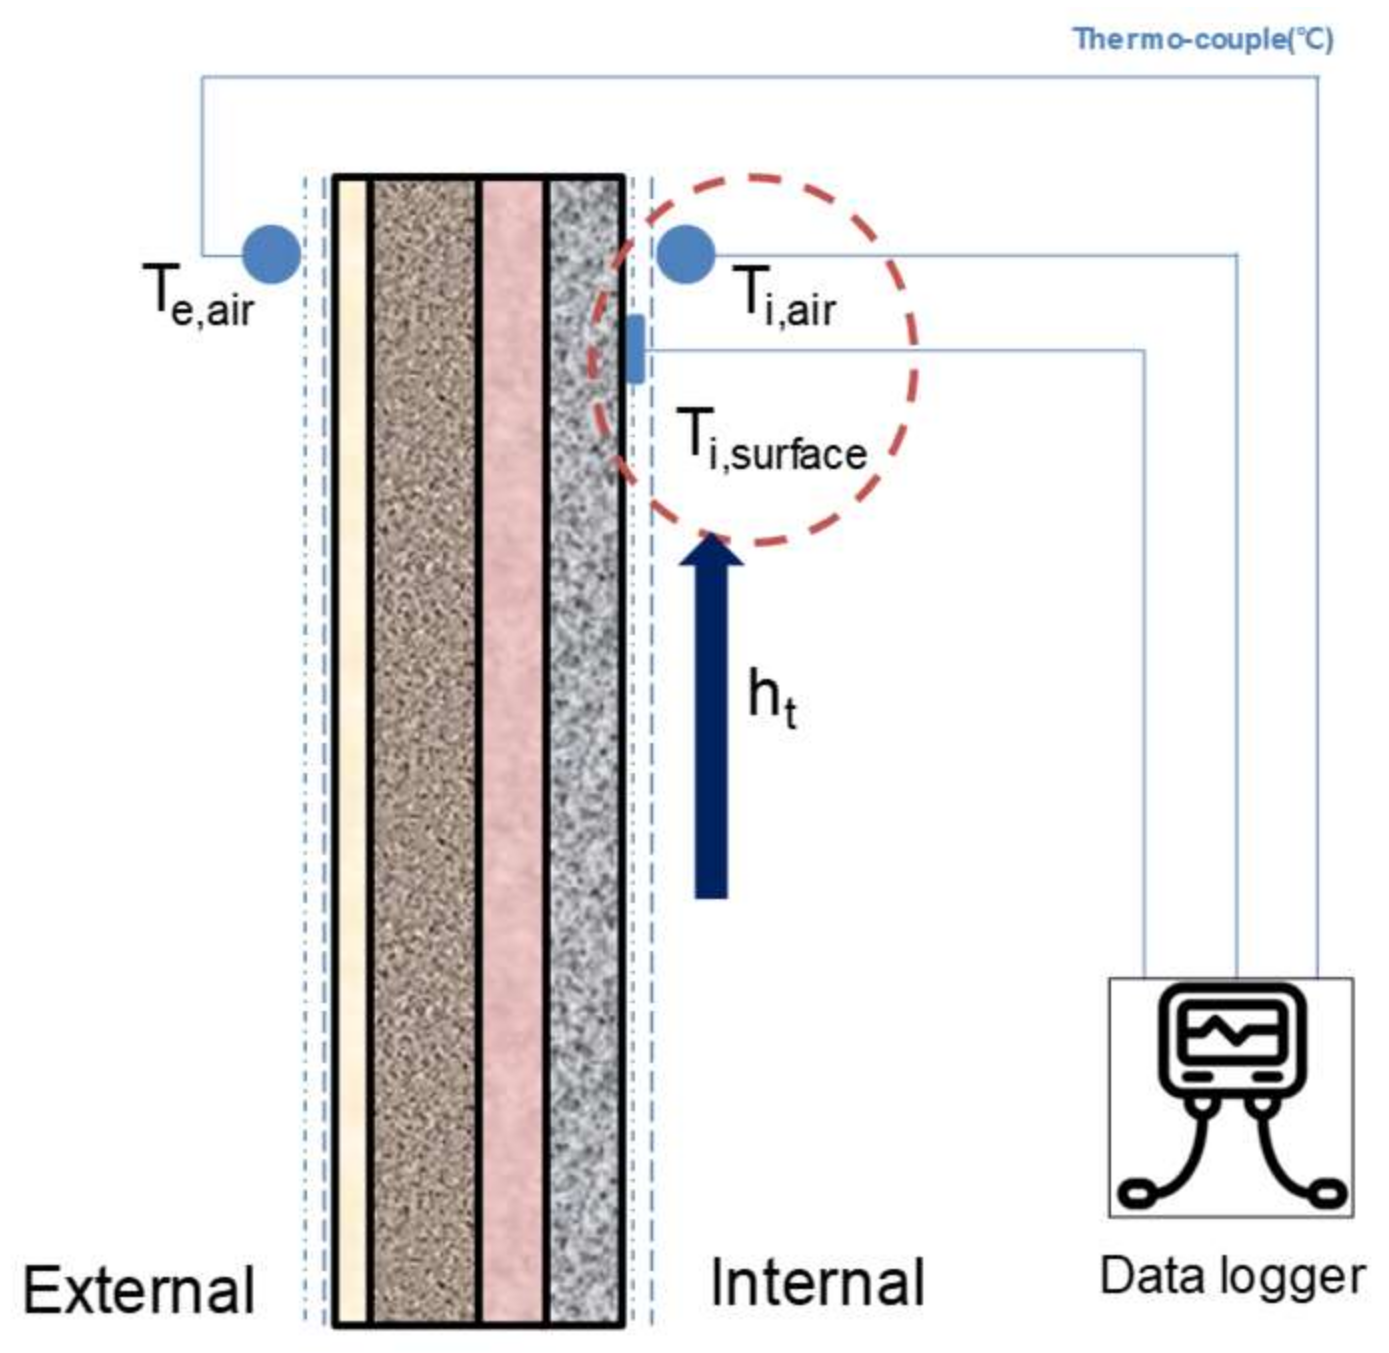
2.2. ASTR Method
3. In Situ Measurement of Existing Houses
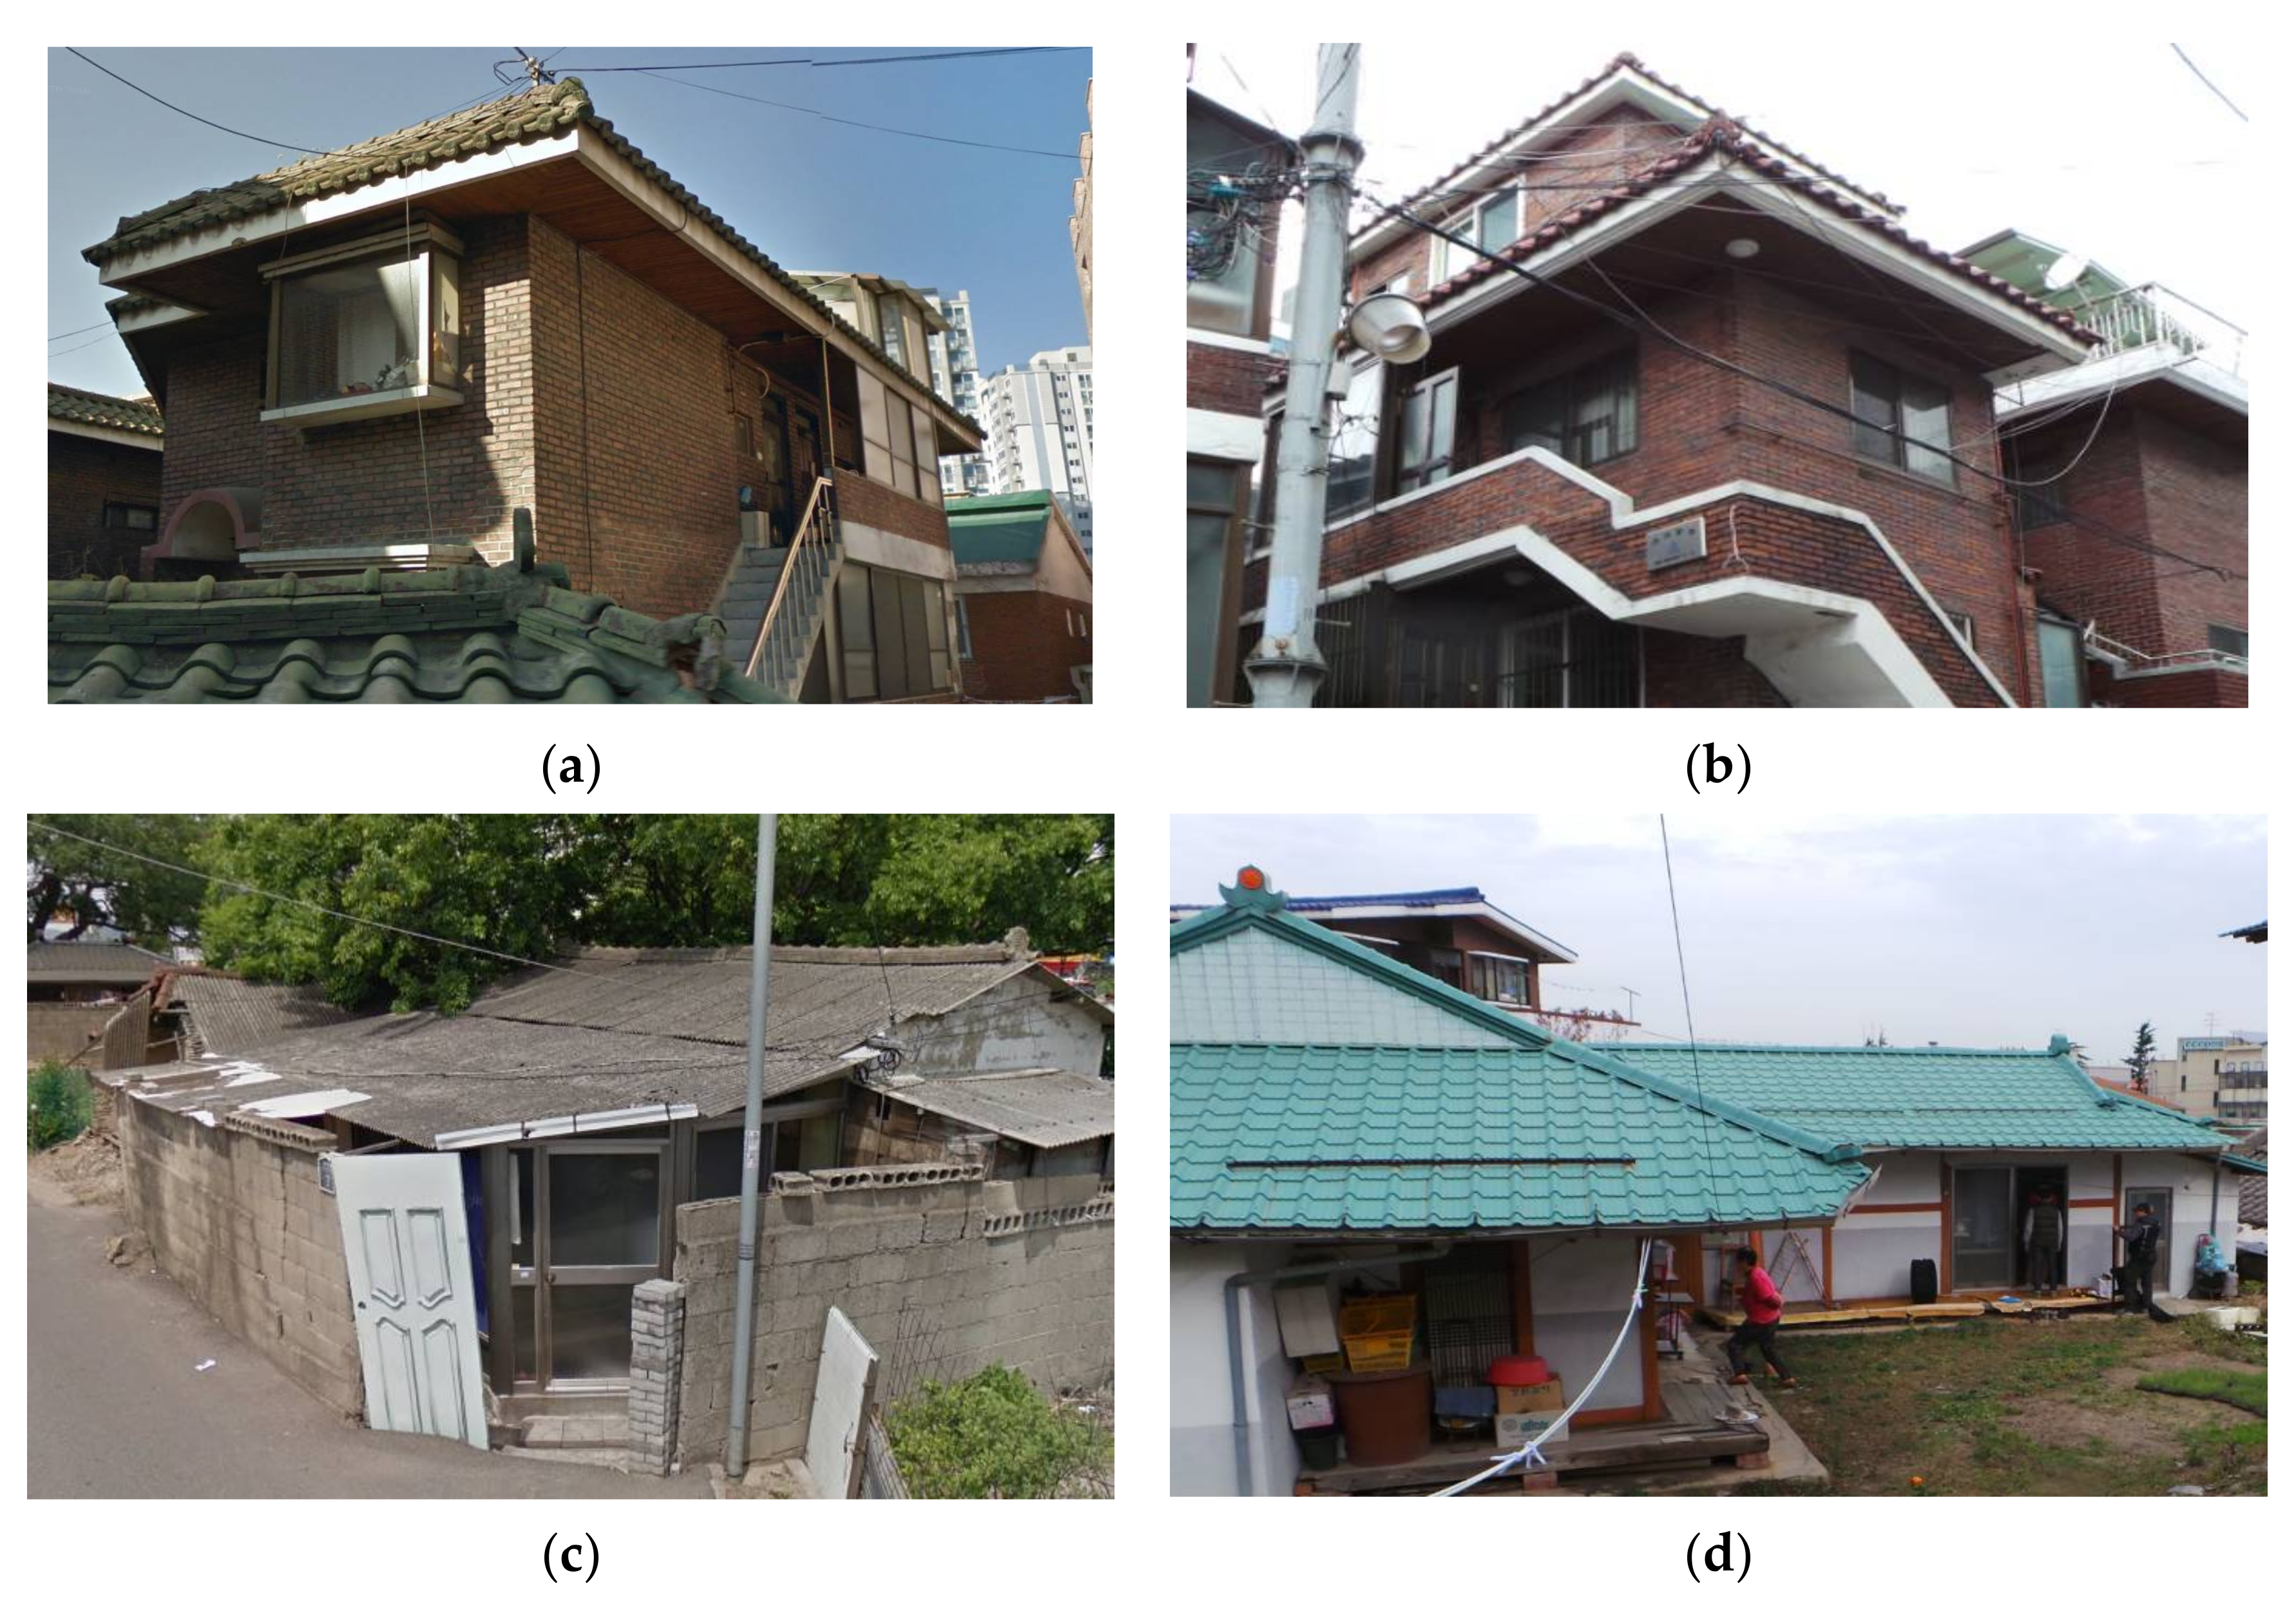
3.1. Target Buildings
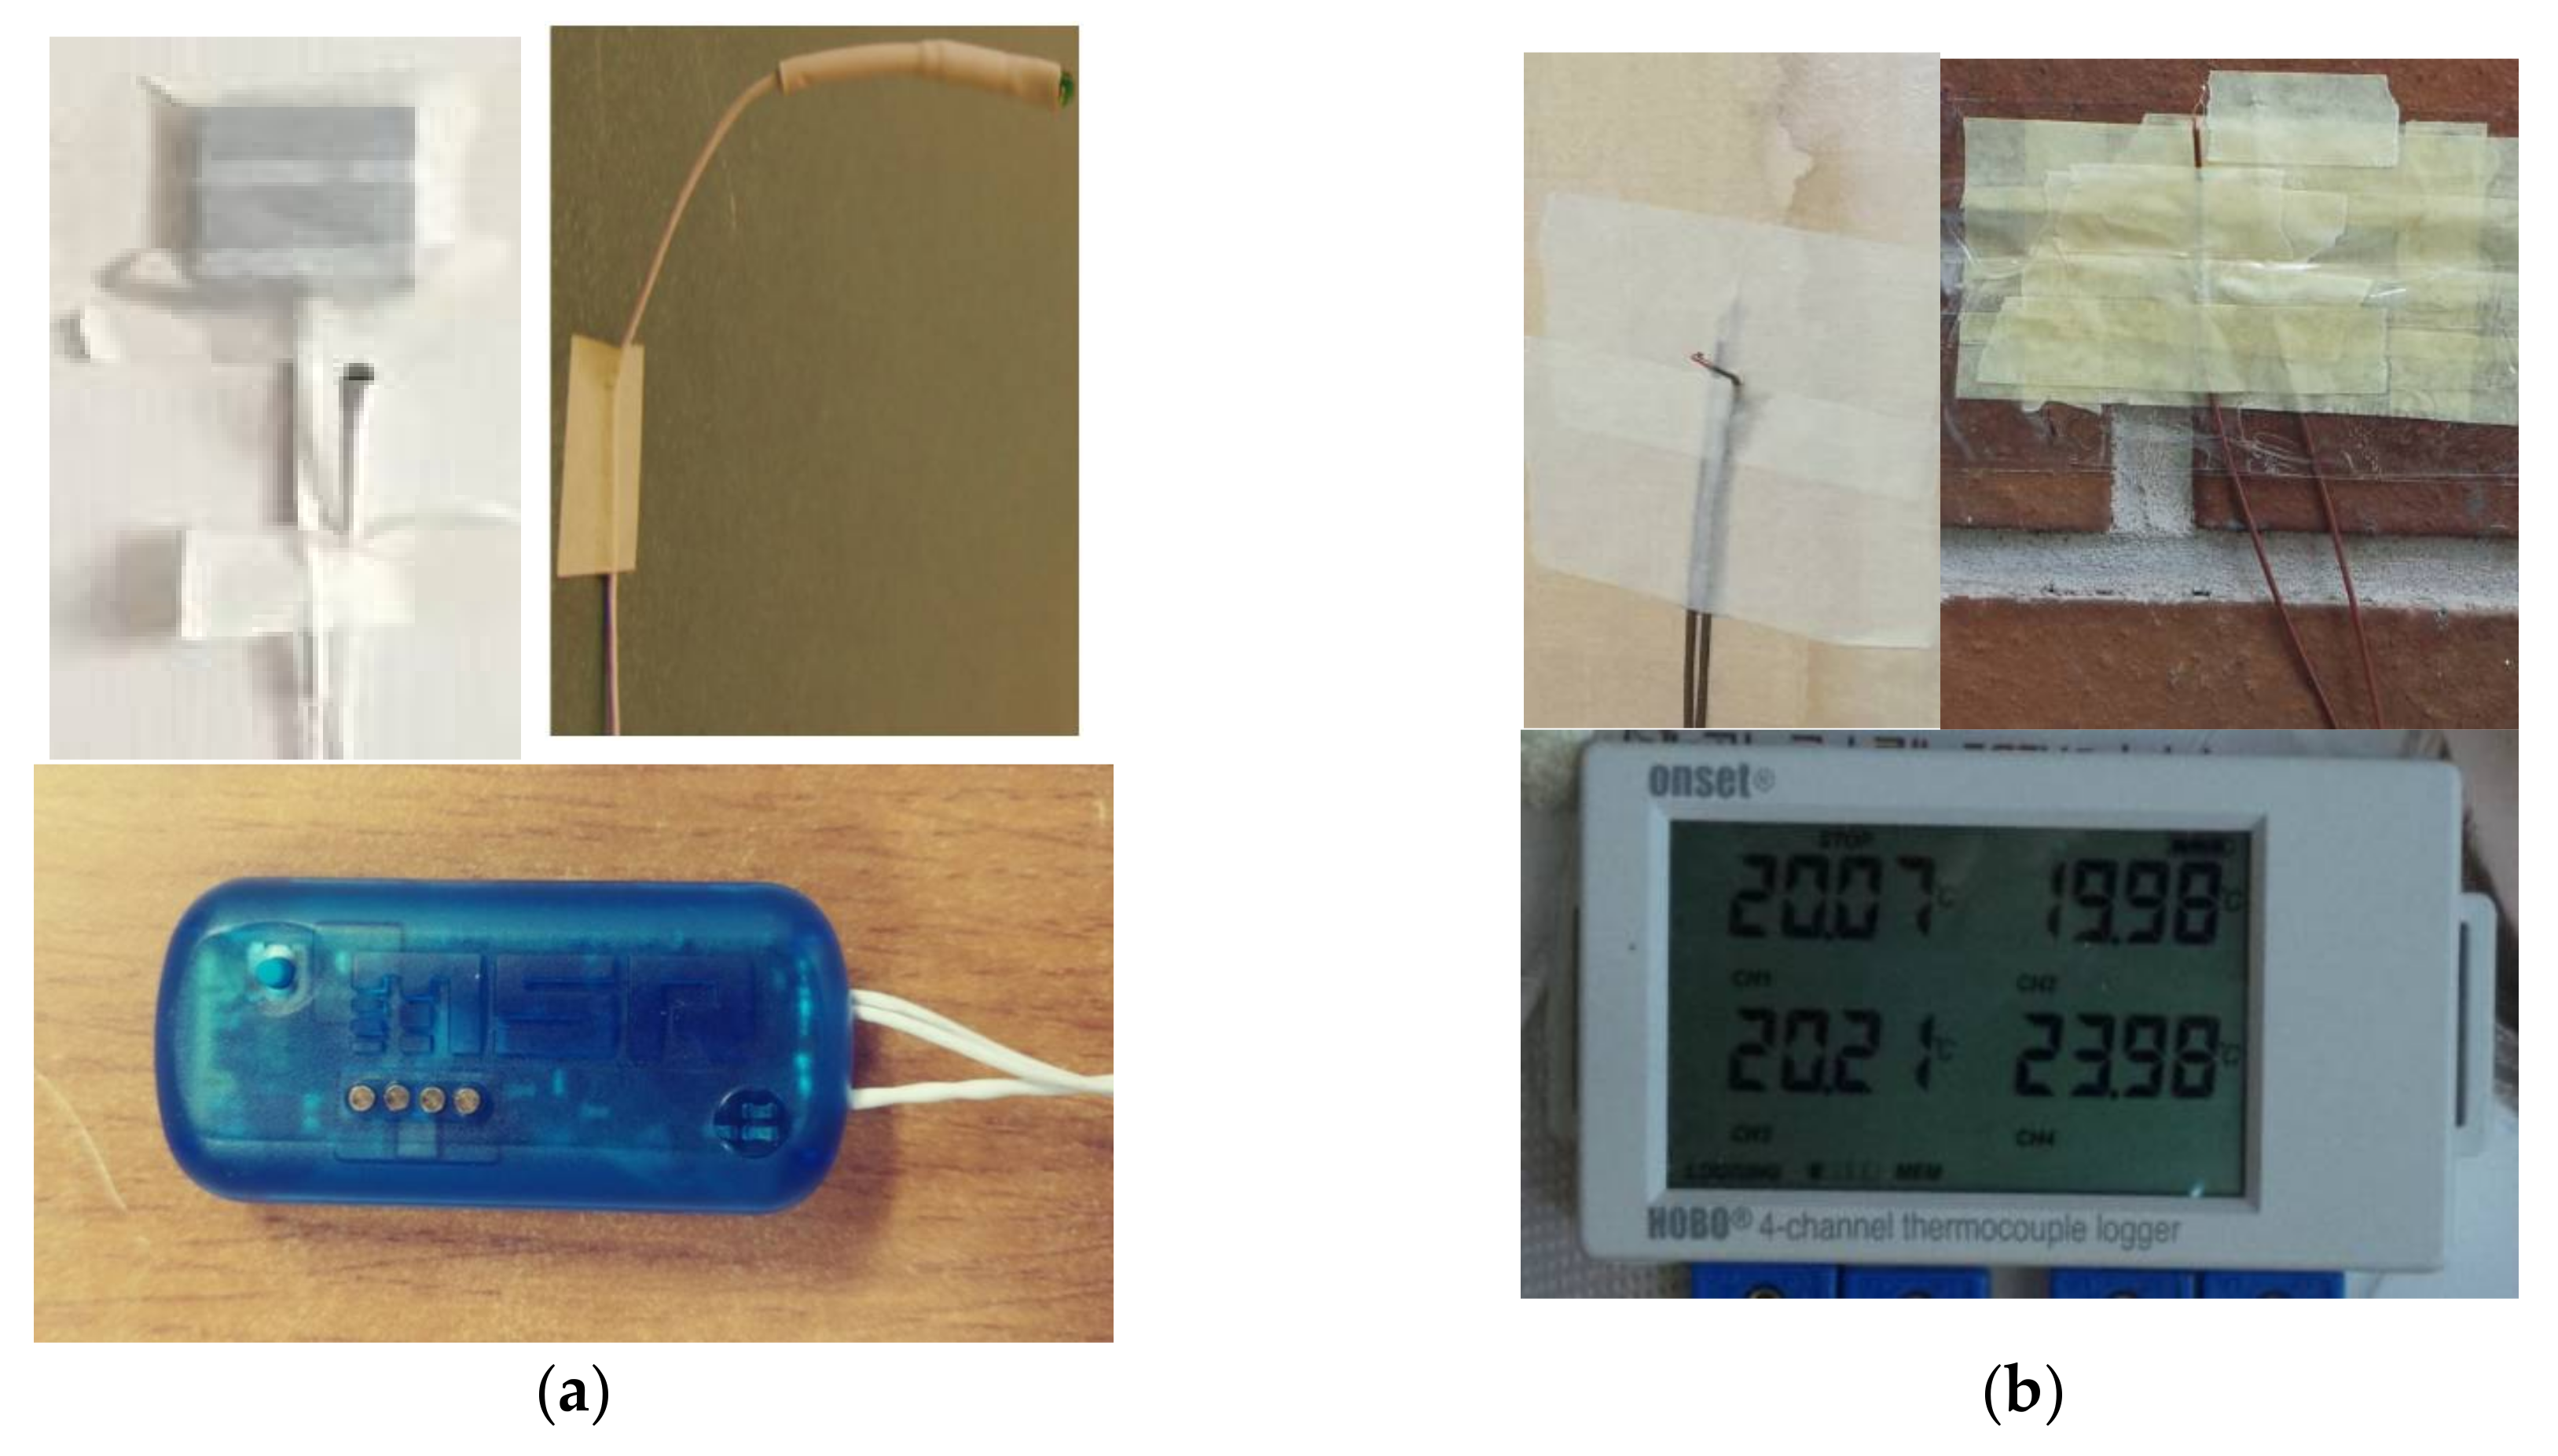
3.2. In Situ Measurement Equipment
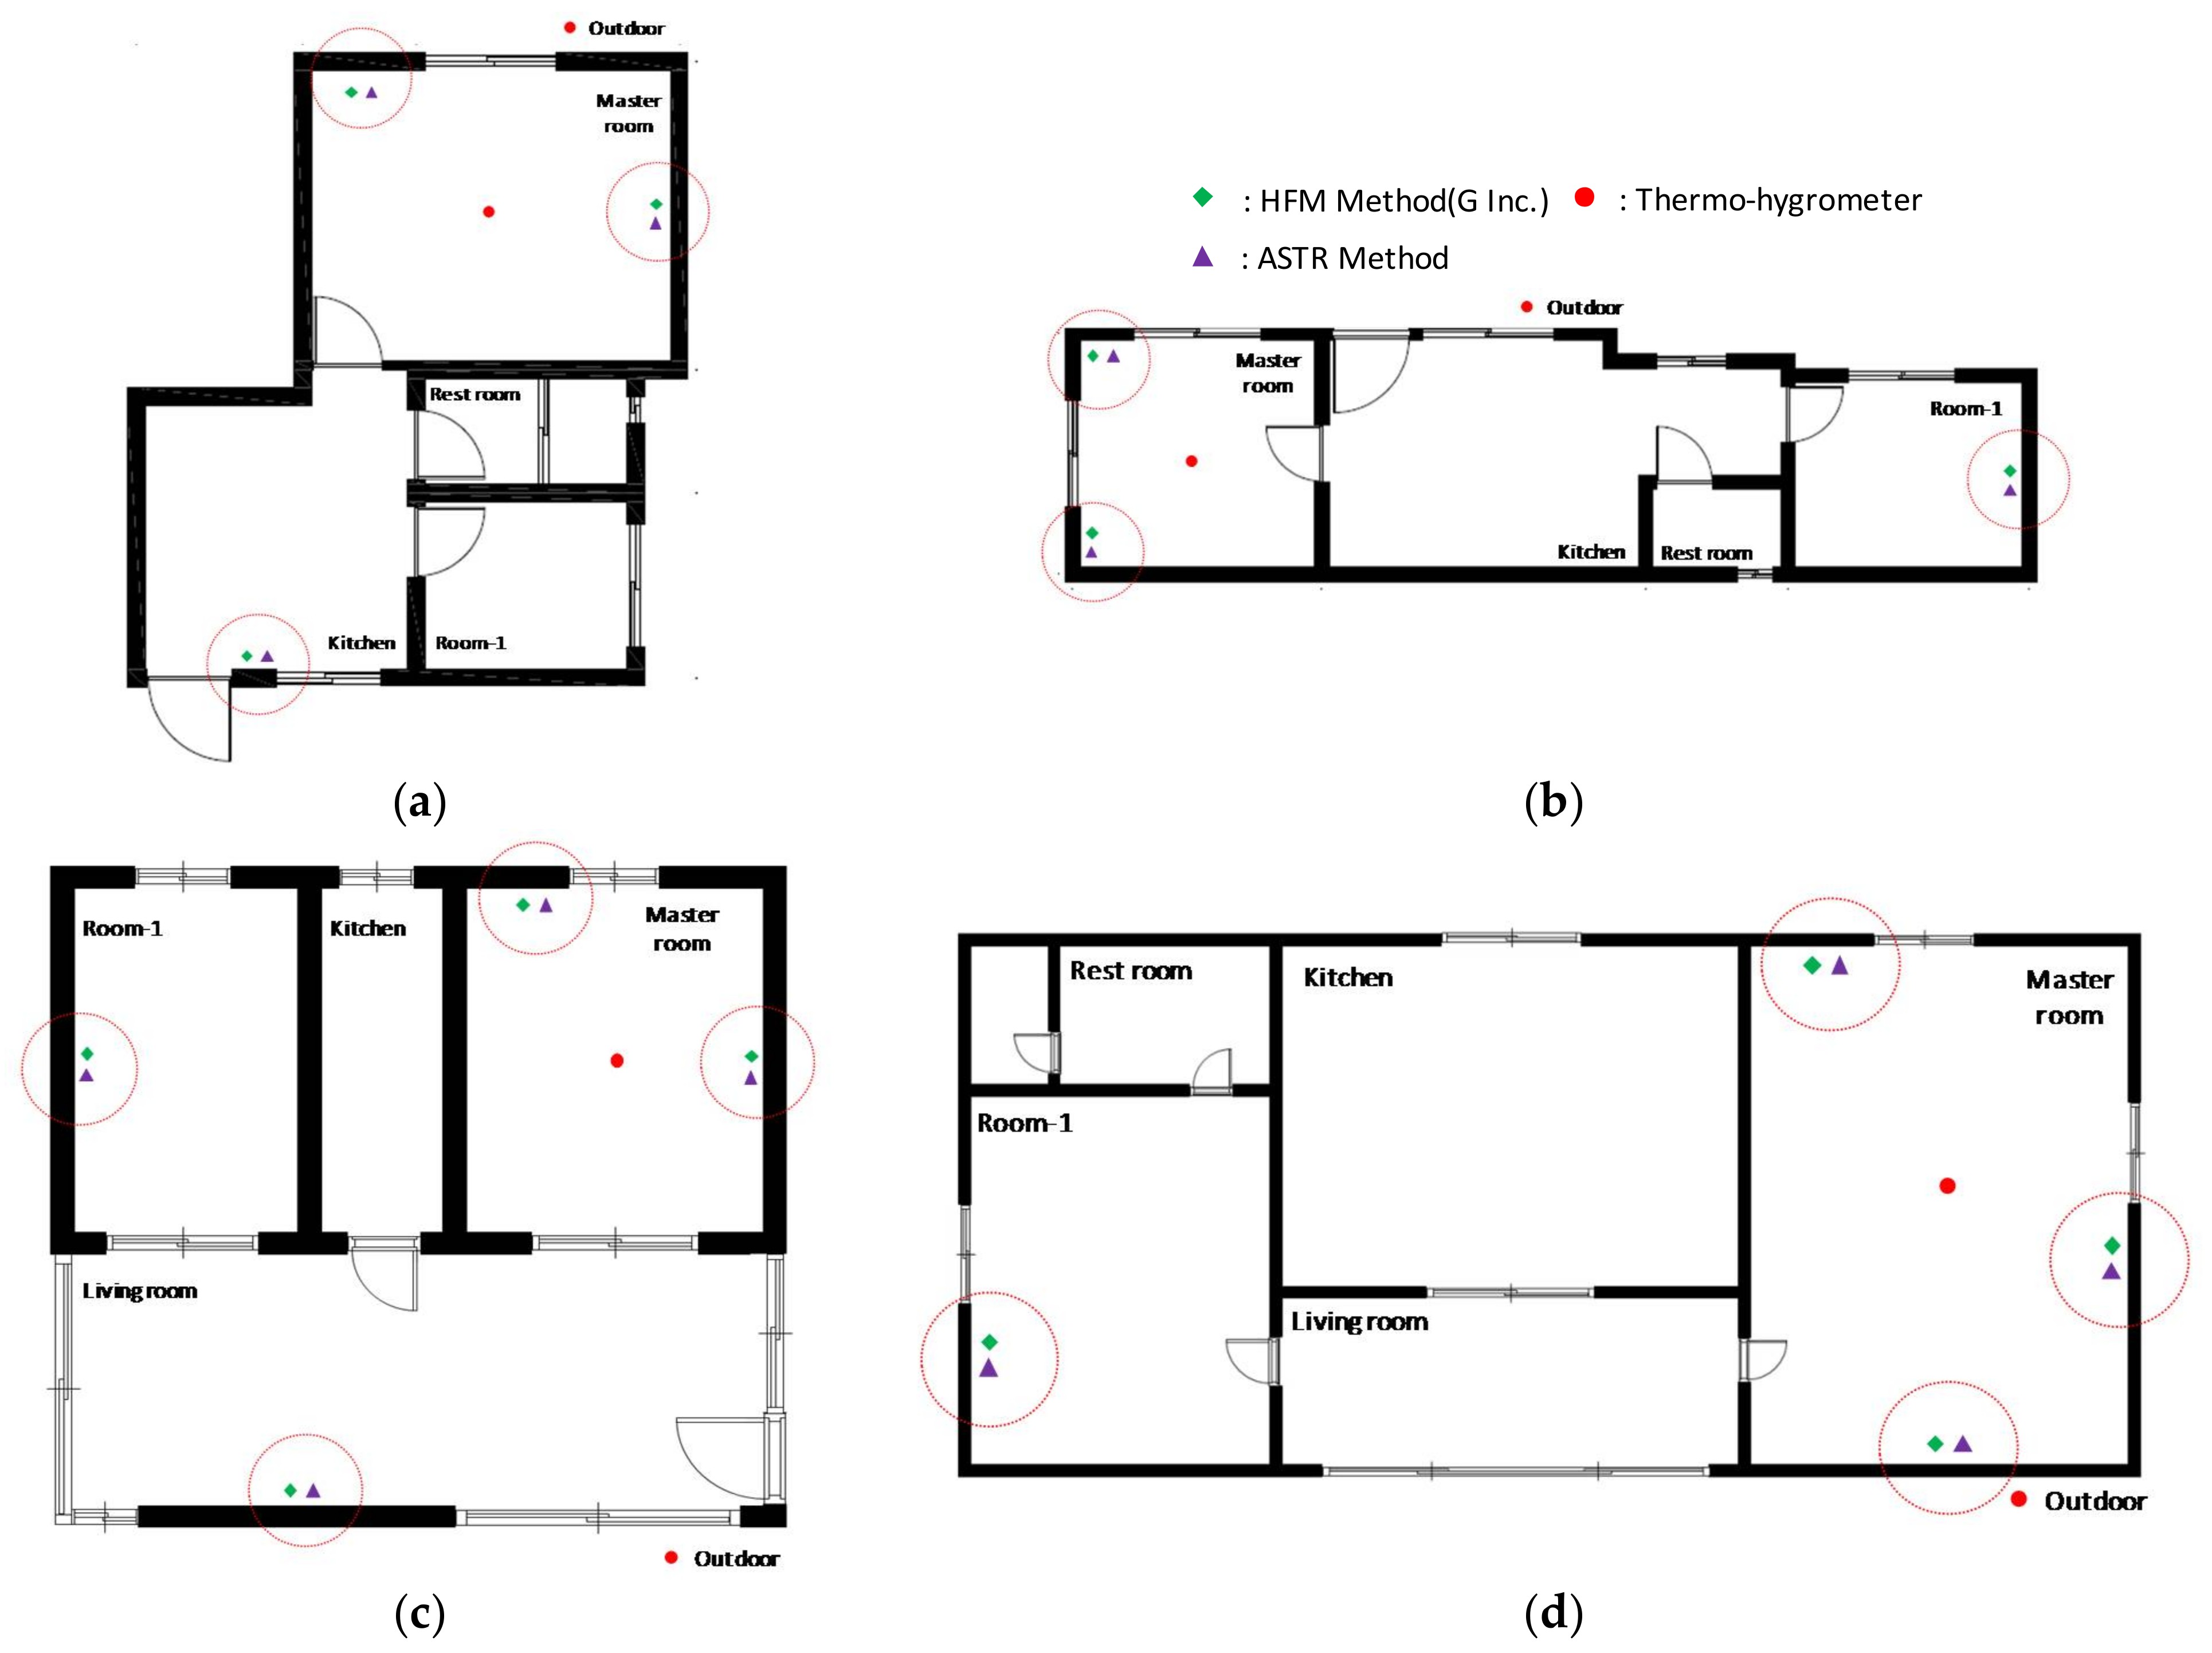
3.3. Positioning of In Situ Measurement Equipment
3.4. Measurement Conditions
4. Results and Discussion
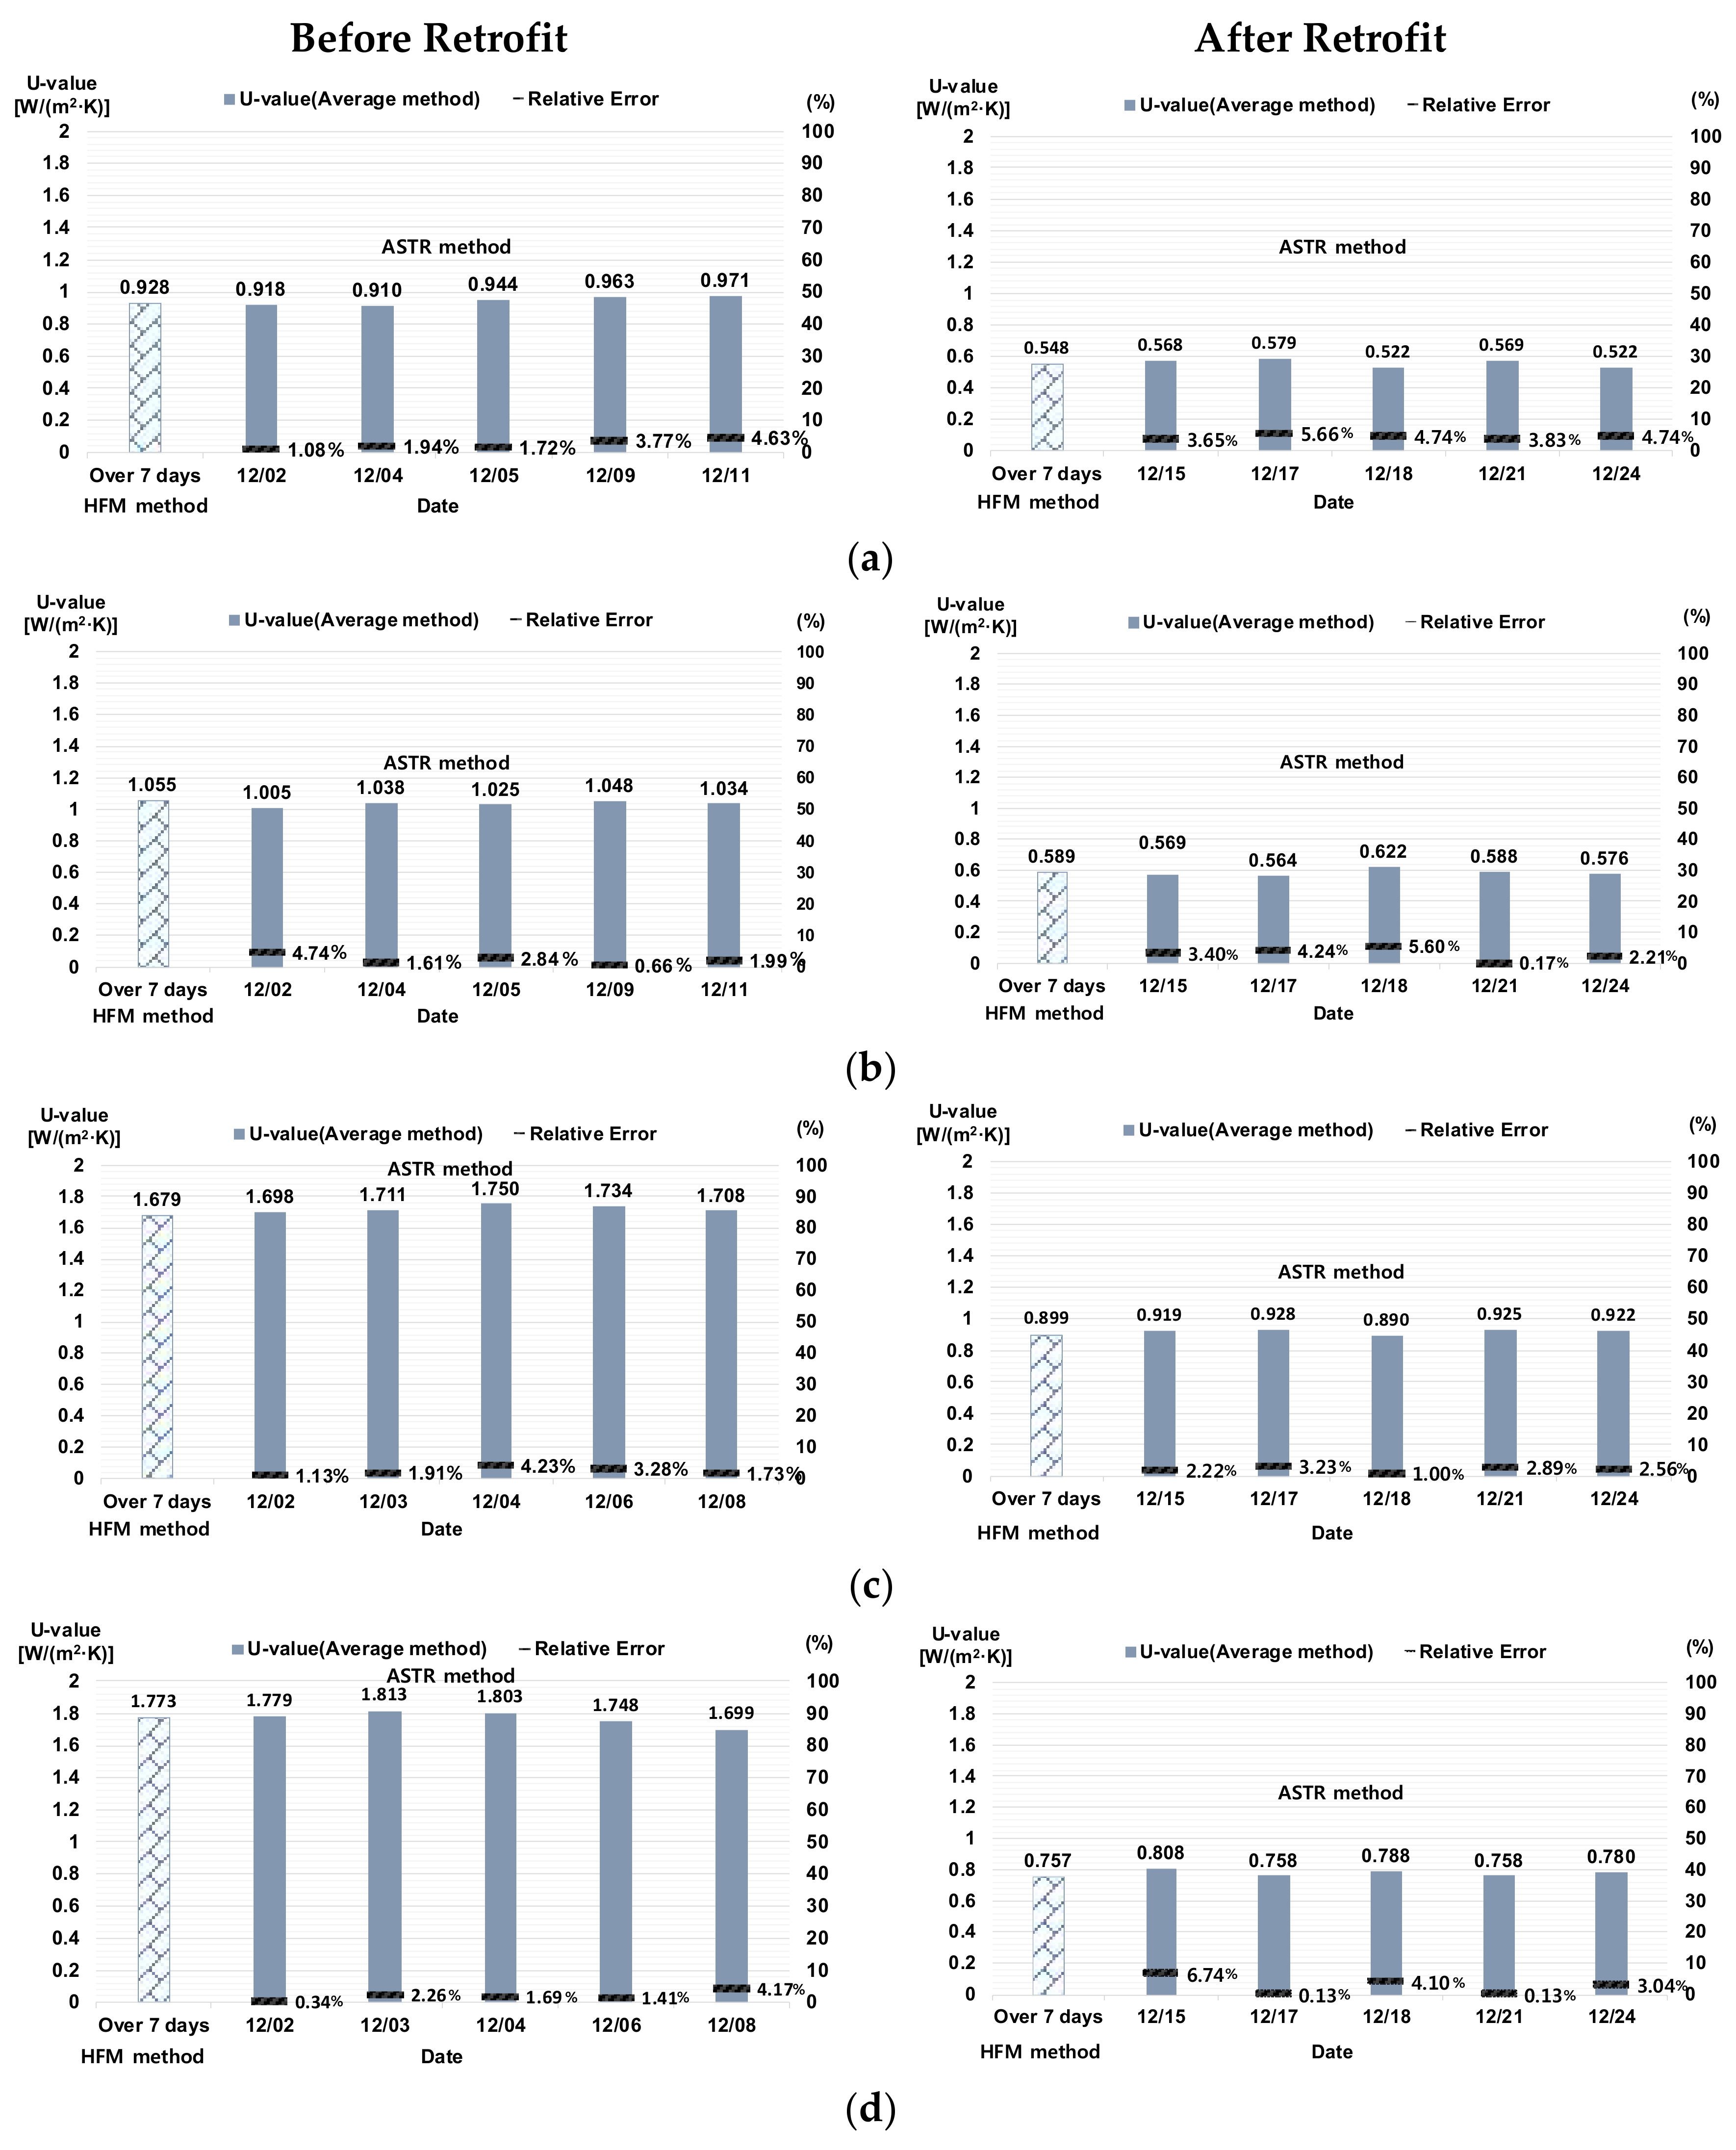
4.1. Analysis of Wall U-Values and Relative Error Rates of the HFM and ASTR Methods
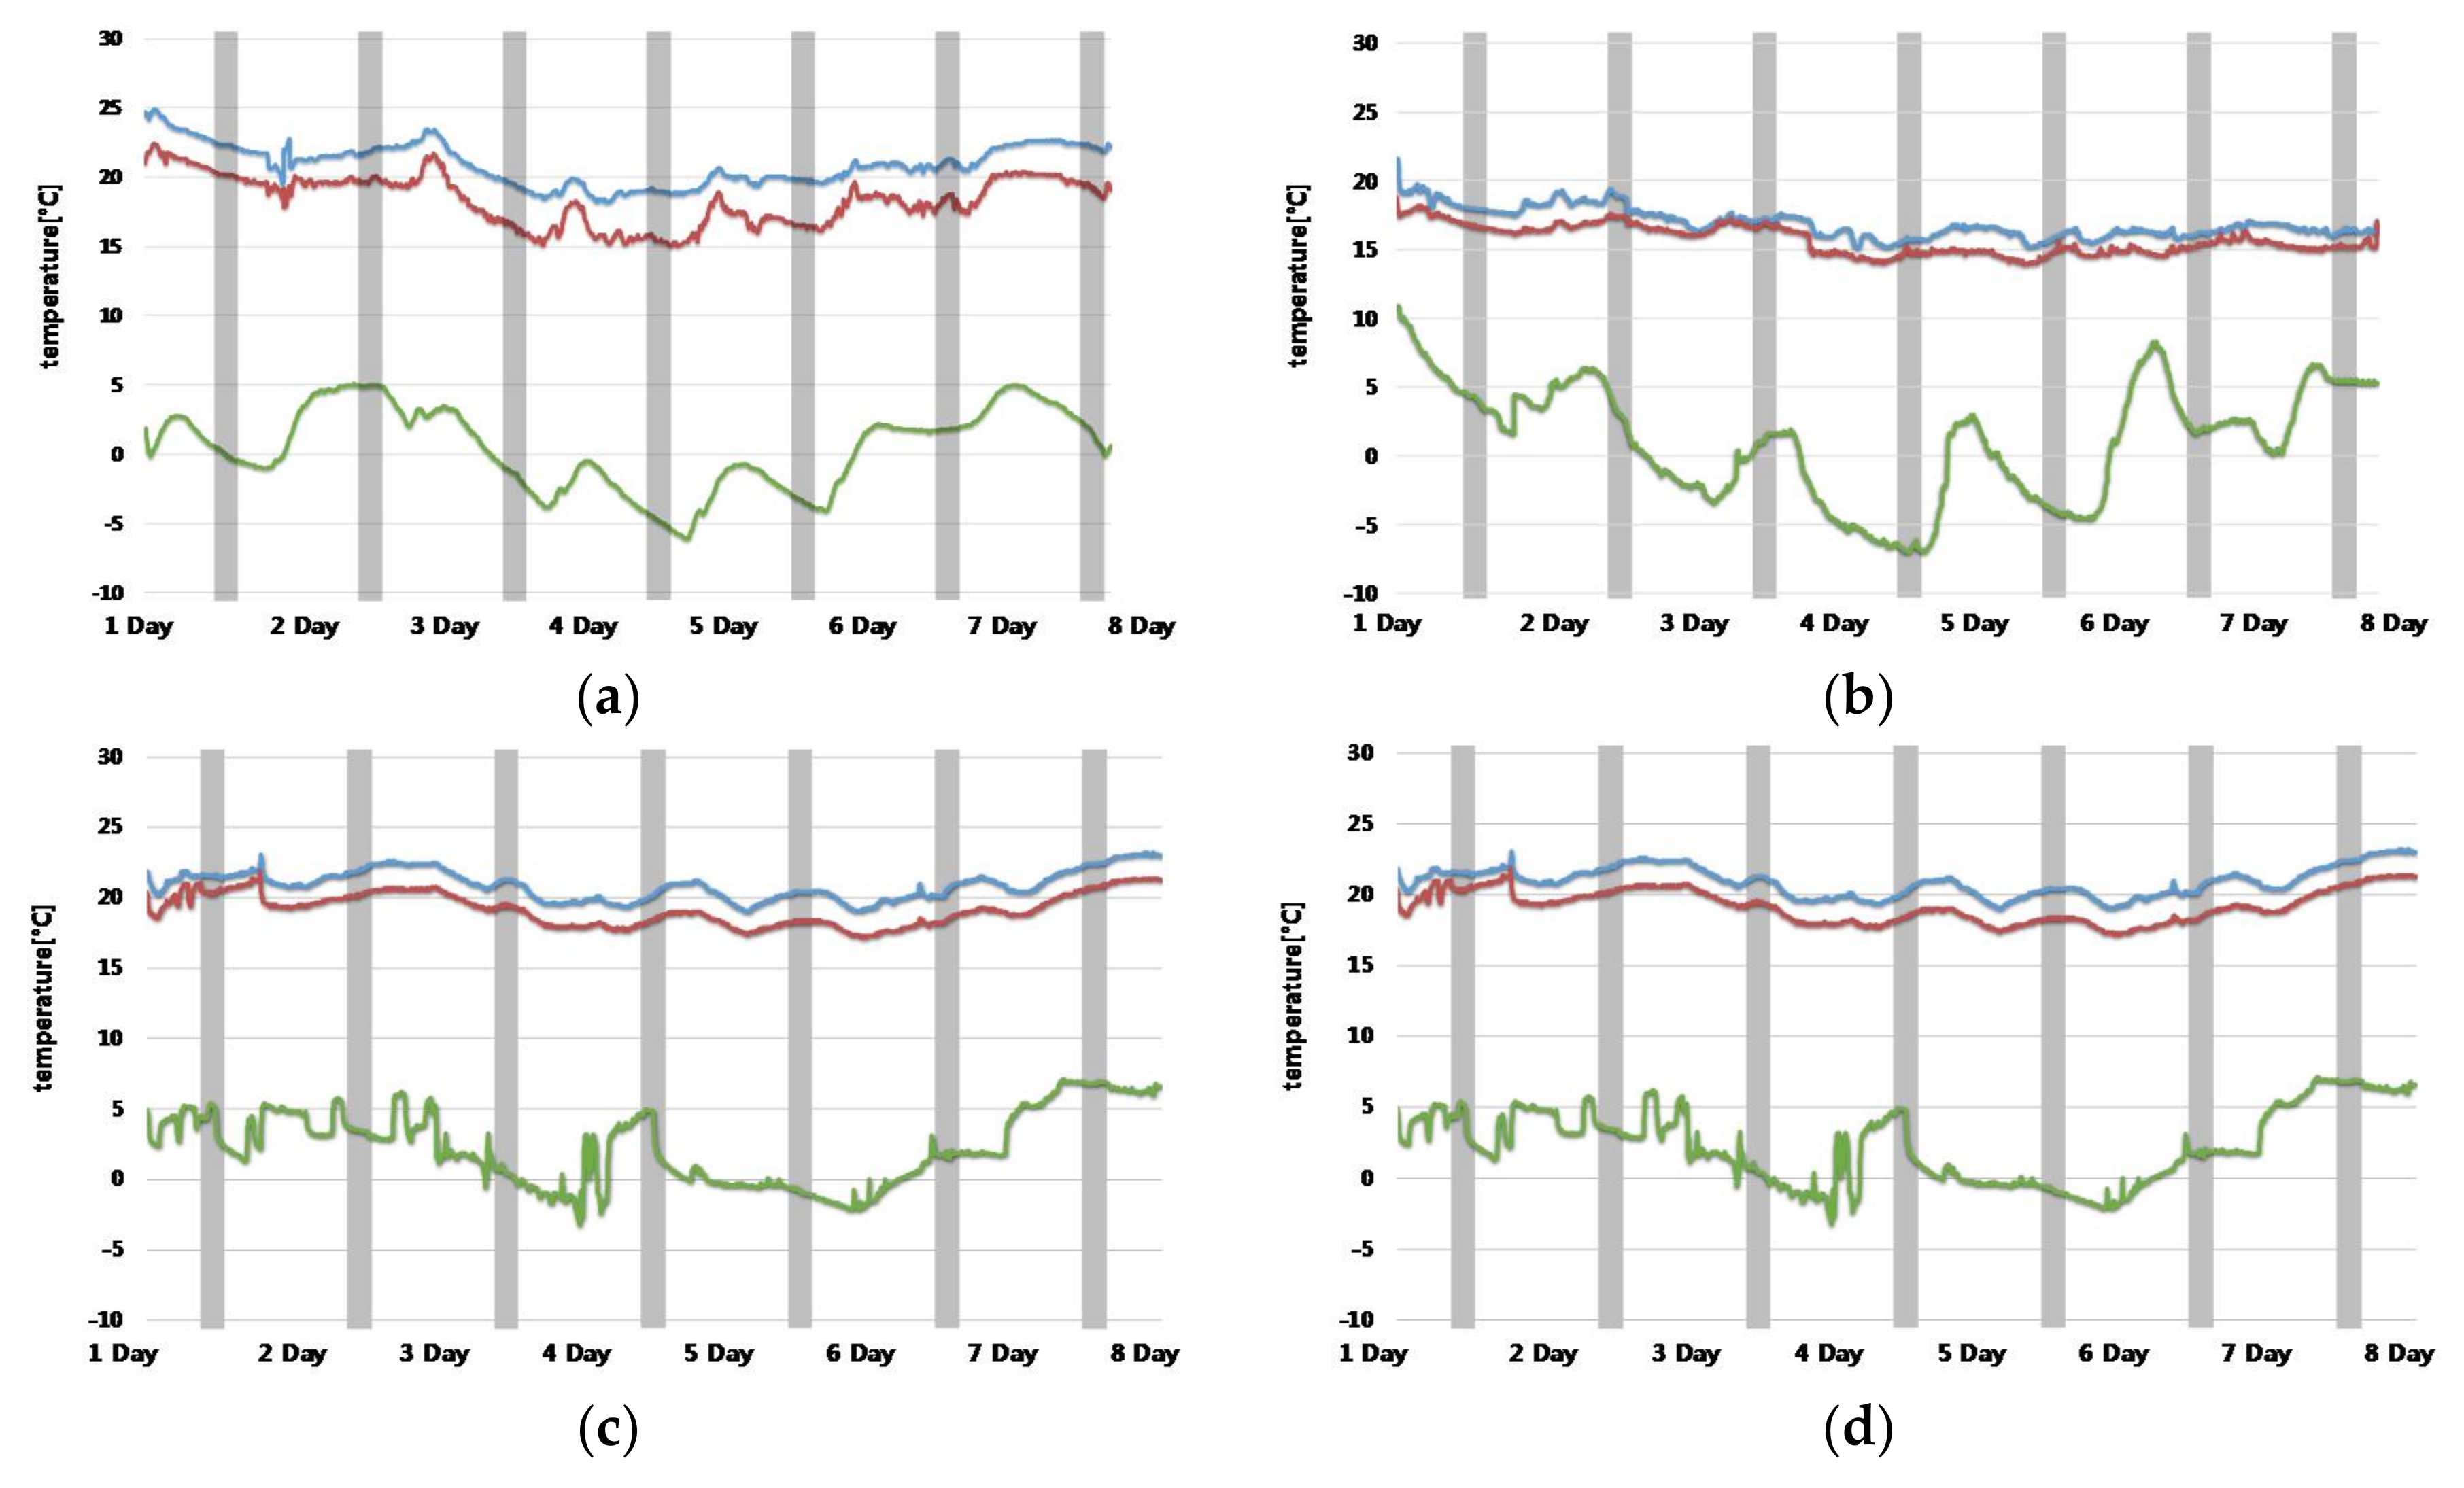
4.2. Comparison and Validation of Long-Term and Short-Term Measurements
5. Conclusions
Acknowledgments
Author Contributions
Conflicts of Interest
References
- Korea Energy Management Corporation (KEMCO). KEA South Korea Energy Handbook 2015, Appendix Part 1 Energy Stats; KEMCO: Seoul, Korea, 2015. [Google Scholar]
- Korea Environment Corporation (KEC). Supporting Green House Gas Reduction Policies; Korea Environment Corporation: Korea, Seoul, 2017. [Google Scholar]
- Korea Housing Institute (KHI). Improvement Plan for Activation of Low-Energy Housing Supply; Korea Housing Institute: Seoul, Korea, 2015. [Google Scholar]
- International Organization for Standardization. Thermal Insulation—Building Elements—In-Situ Measurement of Thermal Resistance and Thermal Transmittance—Part 1: Heat Flow Meter Method; ISO Standard 9869-1; International Organization for Standardization: Geneva, Switzerland, 2014. [Google Scholar]
- Cesaratto, P.; Carli, M.; Marinetti, S. Effect of different parameters on the in situ thermal conductance evaluation. Energy Build. 2011, 43, 1792–1801. [Google Scholar] [CrossRef]
- Ghazi, K.; Binder, B.; Vonbank, R. A simple method to determine the specific heat capacity of thermal insulations used in building construction. Energy Build. 2003, 35, 413–415. [Google Scholar] [CrossRef]
- Cucumo, M.; Rosa, A.; Ferraro, V.; Kaliakatsos, D.; Marinelli, V. A method for the experimental evaluation in situ of the wall conductance. Energy Build. 2006, 38, 238–244. [Google Scholar] [CrossRef]
- International Organization for Standardization. Building Components and Building Elements—Thermal Resistance and Thermal Transmittance—Calculation Method; ISO Standard 6946; International Organization for Standardization: Geneva, Switzerland, 2007. [Google Scholar]
- Ficco, G.; Iannetta, F.; Ianniello, E.; Alfano, F.R.D.A.; Dell’Isola, M. U-value in situ measurement for energy diagnosis of existing buildings. Energy Build. 2015, 104, 108–121. [Google Scholar] [CrossRef]
- Cesaratto, P.; Carli, M. A measuring campaign of thermal conductance in situ and possible impacts on net energy demand in buildings. Energy Build. 2013, 59, 29–36. [Google Scholar] [CrossRef]
- Pisello, A.; Cotana, F.; Nicolini, A.; Buratti, C. Effect of dynamic characteristics of building envelope on thermal-energy performance in winter conditions: In field experiment. Energy Build. 2014, 80, 218–230. [Google Scholar] [CrossRef]
- Cheng, X.; Kato, S.; Hiyama, K.; Sihwan, L. The Technological Investigation of Wall Thermal Performance Diagnosis. Seisan Kenkyu 2013, 65, 5–7. [Google Scholar]
- Sihwan, L.; Hagihara, S.; Kuroki, K. Sensitivity evaluation of measurement sensors on in situ measurement method using the infrared camera. J. Environ. Eng. AIJ 2013, 78, 269–275. [Google Scholar]
- Bienvenido-Huertas, D.; Rodriguez-Alvaro, R.; Jose Moyano, J.; Rico, F.; Marin, D. Determining the U-value of Facades Using the Thermometric Method: Potentials and Limitations. Energies 2018, 11, 360. [Google Scholar] [CrossRef]
- Ballarini, I.; Corgnati, S.P.; Corrado, V. Use of reference buildings to assess the energy saving potentials of the residential building stock: The experience of TABULA project. Energy Policy 2014, 68, 273–284. [Google Scholar] [CrossRef]
- Albatici, R.; Tonelli, A.; Chiogna, M. A comprehensive experimental approach for the validation of quantitative infrared thermography in the evaluation of building. Appl. Energy 2015, 141, 218–228. [Google Scholar] [CrossRef]
- Deconinck, A.H.; Roels, S. Comparison of characterisation methods determining the thermal resistance of building components from onsite measurements. Energy Build. 2016, 130, 309–320. [Google Scholar] [CrossRef]
- Lucchi, E. Thermal transmittance of historical brick masonries: A comparison among standard data, analytical calculation procedures, and in situ heat flow meter measurements. Energy Build. 2017, 134, 171–184. [Google Scholar] [CrossRef]
- Gaspar, K.; Casals, M.; Gangolells, M. A comparison of standardized calculation methods for in situ measurements of façades U-value. Energy Build. 2016, 130, 592–599. [Google Scholar] [CrossRef]
- Misu, S.; Kyunam, R.; Jiyong, Y.; Gunjoo, J. Determination of equivalent thermal conductivity of window spacers in consideration of condensation prevention and energy saving performance. Energies 2017, 10, 717. [Google Scholar]
- Jihyun, O.; Hyunjung, Y.; Sunsook, K. Evaluation of strategies to improve the thermal performance of steel frames in curtain wall systems. Energies 2016, 9, 1055. [Google Scholar]
- Peng, C.; Wu, Z. In situ measuring and evaluating the thermal resistance of building construction. Energy Build. 2008, 40, 2076–2082. [Google Scholar] [CrossRef]
- Wang, F.; Wang, D.; Wang, X.; Yao, J. A data analysis method for detecting wall thermal resistance considering wind velocity in situ. Energy Build. 2010, 42, 1647–1653. [Google Scholar] [CrossRef]
- Obyn, S.; Moeseke, G. Variability and impact of internal surfaces convective heat transfer coefficients in the thermal evaluation of office buildings. Appl. Therm. Eng. 2015, 87, 258–272. [Google Scholar] [CrossRef]
- Desogus, G.; Mura, S.; Ricciu, R. Comparing different approaches to in situ measurement of building components thermal resistance. Energy Build. 2011, 43, 2613–2620. [Google Scholar] [CrossRef]
- Jeonggook, K.; Jonghun, K.; Hakgeon, J.; Cheolyong, J.; Junghun, L.; Doosam, S. An analysis of apartment reference model for low-income households support methods. Korean Soc. Energy 2016, 24, 39–45. [Google Scholar]
- Korean Rural Community Corporation (KR). A Study on Rural House Remodeling for Improvement of Energy Performance; Korean Rural Community Corporation: Seoul, Korea, 2013. [Google Scholar]
- International Organization for Standardization. Thermal Insulation—Qualitative Detection of Thermal Irregularities in Building Envelopes—Infrared Method; ISO Standard 6781:1983; International Organization for Standardization: Geneva, Switzerland, 1983. [Google Scholar]
- International Organization for Standardization. Thermal Insulation—Building Elements—In-Situ Measurement of Thermal Resistance and Thermal Transmittance—Part 2: Infrared Method for Frame Structure Dwelling; ISO 9869-2; International Organization for Standardization: Geneva, Switzerland, 2017. [Google Scholar]
- Feuermann, D. Measurement of envelope thermal transmittances in multifamily buildings. Energy Build. 1989, 13, 139–148. [Google Scholar] [CrossRef]
- Trethowen, H. Measurement errors with surface-mounted heat flux sensors. Energy Build. 1986, 21, 41–56. [Google Scholar] [CrossRef]


| Categories | Case A | Case B | Case C | Case D |
|---|---|---|---|---|
| Location | Seoul | Seoul | Pohang | Gangreung |
| Completion Date | 1989 | 1991 | 1978 | 1979 |
| Floor Area | 34.97 m2 | 45.73 m2 | 41.34 m2 | 33.52 m2 |
| Ceiling Height | 2.3 m | 2.25 m | 2.3 m | 2.4 m |
| Orientation | South | West | South | South |
| Category | # | Component | d (mm) | λ [W/(m·K)] | R [m2·K/W] | |
| Initial Design U-value | CASE A, B | 1 | Indoor surface heat transfer resistance | - | - | 0.13 |
| 2 | Cement mortar | 20 | 1.4 | 0.0143 | ||
| 3 | Brick, cement | 90 | 0.6 | 0.015 | ||
| 4 | Expanded polystyrene No 1. 4 | 50 | 0.043 | 1.1628 | ||
| 5 | Brick, red | 90 | 0.78 | 0.01154 | ||
| 6 | Outdoor surface heat transfer resistance | - | - | 0.04 | ||
| # | Component | d (mm) | λ [W/(m·K)] | R [m2·K/W] | ||
| CASE C, D | 1 | Indoor surface heat transfer resistance | - | - | 0.13 | |
| 2 | Cement mortar | 20 | 1.4 | 0.0143 | ||
| 3 | Brick, cement | 90 | 0.6 | 0.015 | ||
| 4 | Air gap | 10 | 0.086 | |||
| 5 | Brick, cement | 90 | 0.6 | 0.15 | ||
| 6 | Cement mortar | 20 | 1.4 | 0.0143 | ||
| 7 | Polyurethane (PUR) | 10 | 0.028 | 0.3571 | ||
| 8 | Outdoor surface heat transfer resistance | - | - | 0.04 | ||
| Category | Classification | Accuracy | ||
|---|---|---|---|---|
| HFM method | Model | G. Inc._Heat Flux Kit | Heat Flux (W/m2) < 0.22 | Temperature (°C) ±0.5 |
| Quantity | 16 EA | |||
| ASTR method | Model | H. Inc._4-ch Data Logger + T-type Thermocouples | - | Temperature (°C) ±0.5 |
| Quantity | 16 EA | |||
| Air temperature & humidity (reference) | Model | T. Inc._TR-72wf | Humidity (%) ±5 RH | Temperature (°C) ±0.5 |
| Quantity | 4 EA | |||
| (n = 480) | W1 (East) [W/(m2∙K)] | W1 (West) [W/(m2∙K)] | W1 (South) [W/(m2∙K)] | W1 (North) [W/(m2∙K)] | |
|---|---|---|---|---|---|
| Case A | UDESIGN | 0.636 | 0.636 | 0.636 | 0.636 |
| UHFM | 0.928 ± 0.0318 * | 0.901 ± 0.0401 | - | 0.879 ± 0.0383 | |
| UASTR | 0.941 ± 0.0440 | 0.868 ± 0.0435 | - | 0.918 ± 0.0482 | |
| UHFM~UASTR Relative Error (%) | 1.42 | 3.66 | - | 4.44 | |
| Case B | UDESIGN | 0.636 | 0.636 | 0.636 | 0.636 |
| UHFM | 0.938 ± 0.0319 | 0.858 ± 0.0283 | 1.055 ± 0.0428 | 1.001 ± 0.0395 | |
| UASTR | 0.894 ± 0.0259 | 0.893 ± 0.0382 | 1.030 ± 0.0188 | 1.030 ± 0.0432 | |
| UHFM~UASTR Relative Error (%) | 4.69 | 4.08 | 2.37 | 2.89 | |
| Case C | UDESIGN | 1.062 | 1.062 | 1.062 | 1.062 |
| UHFM | 1.618 ± 0.0583 | 1.577 ± 0.0731 | 1.679 ± 0.0618 | 1.618 ± 0.0718 | |
| UASTR | 1.689 ± 0.0647 | 1.525 ± 0.0651 | 1.720 ± 0.0794 | 1.693 ± 0.0872 | |
| UHFM~UASTR Relative Error (%) | 4.39 | 3.30 | 2.44 | 4.64 | |
| Case D | UDESIGN | 1.062 | 1.062 | 1.062 | 1.062 |
| UHFM | 1.773 ± 0.0481 | 1.624 ± 0.0414 | 2.011 ± 0.0832 | - | |
| UASTR | 1.768 ± 0.0524 | 1.698 ± 0.0389 | 2.089 ± 0.0799 | - | |
| UHFM~UASTR Relative Error (%) | 0.28 | 4.56 | 3.88 | - | |
| (n = 480) | W1 (East) [W/(m2∙K)] | W1 (West) [W/(m2∙K)] | W1 (South) [W/(m2∙K)] | W1 (North) [W/(m2∙K)] | |
|---|---|---|---|---|---|
| Case A | UHFM | 0.548 ± 0.0225 * | - | - | 0.490 ± 0.0203 |
| UASTR | 0.552 ± 0.0291 | - | - | 0.511 ± 0.0237 | |
| UHFM~UASTR Relative Error (%) | 0.73 | - | - | 4.29 | |
| Case B | UHFM | - | - | 0.589 ± 0.0388 | 0.579 ± 0.0498 |
| UASTR | - | - | 0.584 ± 0.0401 | 0.603 ± 0.0511 | |
| UHFM~UASTR Relative Error (%) | - | - | 0.85 | 4.15 | |
| Case C | UHFM | - | - | 0.899 ± 0.0803 | 0.922 ± 0.0838 |
| UASTR | - | - | 0.917 ± 0.0907 | 0.965 ± 0.0888 | |
| UHFM~UASTR Relative Error (%) | - | - | 2.00 | 4.66 | |
| Case D | UHFM | 0.757 ± 0.0811 | - | 0.776 ± 0.0799 | - |
| UASTR | 0.778 ± 0.0864 | - | 0.817 ± 0.0819 | - | |
| UHFM~UASTR Relative Error (%) | 2.77 | - | 5.28 | - | |
© 2018 by the authors. Licensee MDPI, Basel, Switzerland. This article is an open access article distributed under the terms and conditions of the Creative Commons Attribution (CC BY) license (http://creativecommons.org/licenses/by/4.0/).
Share and Cite
Kim, S.-H.; Kim, J.-H.; Jeong, H.-G.; Song, K.-D. Reliability Field Test of the Air–Surface Temperature Ratio Method for In Situ Measurement of U-Values. Energies 2018, 11, 803. https://doi.org/10.3390/en11040803
Kim S-H, Kim J-H, Jeong H-G, Song K-D. Reliability Field Test of the Air–Surface Temperature Ratio Method for In Situ Measurement of U-Values. Energies. 2018; 11(4):803. https://doi.org/10.3390/en11040803
Chicago/Turabian StyleKim, Seo-Hoon, Jong-Hun Kim, Hak-Geun Jeong, and Kyoo-Dong Song. 2018. "Reliability Field Test of the Air–Surface Temperature Ratio Method for In Situ Measurement of U-Values" Energies 11, no. 4: 803. https://doi.org/10.3390/en11040803
APA StyleKim, S.-H., Kim, J.-H., Jeong, H.-G., & Song, K.-D. (2018). Reliability Field Test of the Air–Surface Temperature Ratio Method for In Situ Measurement of U-Values. Energies, 11(4), 803. https://doi.org/10.3390/en11040803