Article

Combining an Electrothermal and Impedance Aging Model to Investigate Thermal Degradation Caused by Fast Charging

by
Joris De Hoog
1,*,†,‡,
Joris Jaguemont
1,†,
Mohamed Abdel-Monem
1,2,
Peter Van Den Bossche
1,
Joeri Van Mierlo
1 and
Noshin Omar
1
1
ETEC Department & MOBI Research Group, Vrije Universiteit Brussel (VUB), Ixelles 1050, Belgium
2
Faculty of Engineering, Helwan University, Cairo 11795, Egypt
*
Author to whom correspondence should be addressed.
These authors contributed equally to this work.
Current Address: Vrije Universiteit Brussel—Pleinlaan 2, 1040 Elsene, Belgium.
Energies 2018, 11(4), 804; https://doi.org/10.3390/en11040804
Submission received: 14 February 2018 / Revised: 20 March 2018 / Accepted: 22 March 2018 / Published: 30 March 2018
(This article belongs to the Section D: Energy Storage and Application)

Abstract

:
Fast charging is an exciting topic in the field of electric and hybrid electric vehicles (EVs/HEVs). In order to achieve faster charging times, fast-charging applications involve high-current profiles which can lead to high cell temperature increase, and in some cases thermal runaways. There has been some research on the impact caused by fast-charging profiles. This research is mostly focused on the electrical, thermal and aging aspects of the cell individually, but these factors are never treated together. In this paper, the thermal progression of the lithium-ion battery under specific fast-charging profiles is investigated and modeled. The cell is a Lithium Nickel Manganese Cobalt Oxide/graphite-based cell (NMC) rated at 20 Ah, and thermal images during fast-charging have been taken at four degradation states: 100%, 90%, 85%, and 80% State-of-Health (SoH). A semi-empirical resistance aging model is developed using gathered data from extensive cycling and calendar aging tests, which is coupled to an electrothermal model. This novel combined model achieves good agreement with the measurements, with simulation results always within 2 °C of the measured values. This study presents a modeling methodology that is usable to predict the potential temperature distribution for lithium-ion batteries (LiBs) during fast-charging profiles at different aging states, which would be of benefit for Battery Management Systems (BMS) in future thermal strategies.

1. Introduction

Global warming and the depletion of natural resources have led to increased worldwide automotive research on electric and emission-free propulsion solutions. In this context, battery technology and in particular, lithium-ion batteries (LiBs), are of interest to the electric and hybrid electric vehicle (EV/HEV) industry because of their favorable properties, including high efficiency, high power density, and low self-discharge rate [1]. They are indeed a promising reversible power source for current and future electric-powered vehicles.
Nonetheless, some significant obstacles exist with respect to the transition from the use of conventional vehicles to EVs, for example charging infrastructure [2], recycling issues [3,4], total cost [5,6], and safety issues [7]. Another issue is the charging time. The large on-board capacity of the battery system currently results in a charging time of several hours when connected to a conventional household plug. Thus, a high priority for automotive manufacturers in terms of the marketability of EVs is to offer shorter charging times for the battery system. One can attempt to provide increased total battery capacity in order to reduce the charging frequency of the vehicle. Unfortunately, the development of a higher-capacity battery necessitates research and the integration of new cell materials, or the addition of more cells and therefore more weight, with a corresponding price increase [8].
Battery charging controllers with fast-charging operation have also been reported in the literature [9,10]. Notwithstanding a decreased charging time, when using LiBs with high-current rate profiles for fast-charging applications, the battery system may undergo a global temperature rise, which if not controlled can lead to possible ruptures, ignition, or even explosion of LiBs [11,12,13,14]. Therefore, understanding the thermal properties and performances of LiBs under fast-charging profiles becomes critical.
Researchers have been studying the fast-charging impact caused by increasing the current rate of the charging profile [15,16,17,18]. For example, Abdel-Monem et al. [19,20] showed the changes in the voltage response of a battery triggered by two charging profiles: the constant current–constant voltage (CC–CV), and constant current with negative pulse–constant voltage (CCNP–CV) profiles. Nonetheless, the impact on thermal distribution has yet to be reported. Combined electro-thermal models have also been developed in [21,22,23], usable for thermal property determination resulting from specific input current profiles. An electro-thermal model with aging dynamics was presented in [24], with a focus on finding a compromise between charge time, aging, and balanced charge scenarios using static charge currents.
Moreover, in addition to a fast rise in the battery system temperature, the high current-rate condition of the fast-charging profile further deteriorates the LiB performance [25,26,27]. This presents serious difficulties for operating the battery under high current rates. Indeed, aging of LiBs, defined as the irreversible loss of their energy storage capability and power [28], is one such challenge. It is thus important to be aware of the battery degradation behavior with respect to the functionality of the LiBs. An investigation of charging optimization strategies with respect to LiB aging was also presented in [29].
However, in the above studies, information about battery aging behavior, especially with fast-charging profiles, is still limited. Therefore, based on the notes above, a comprehensive study on both thermal and aging aspects in high current applications is lacking. Hence, the objective of this paper is to analyze the effect of a fast-charging profile on the thermal behavior, including aging aspects. The lithium nickel manganese cobalt oxide (NMC) chemistry is investigated as it is considered to be one of the major battery cathode materials for EV applications due to its comparatively excellent energy density, long cycle life, and high safety performance [30,31,32,33,34].
Furthermore, the second objective of this paper is to develop an electro-thermal and lifetime model, and validate using the fast-charging experimental data collected in this study. The model uses a semi-empirical approach in order to predict the thermal behavior at different aging states under high current solicitations. Such predictability will be a key issue in the development of smart thermal control strategies, as it limits the thermal runaway used in battery thermal management systems (BTMSs).
The paper is organized as follows. 
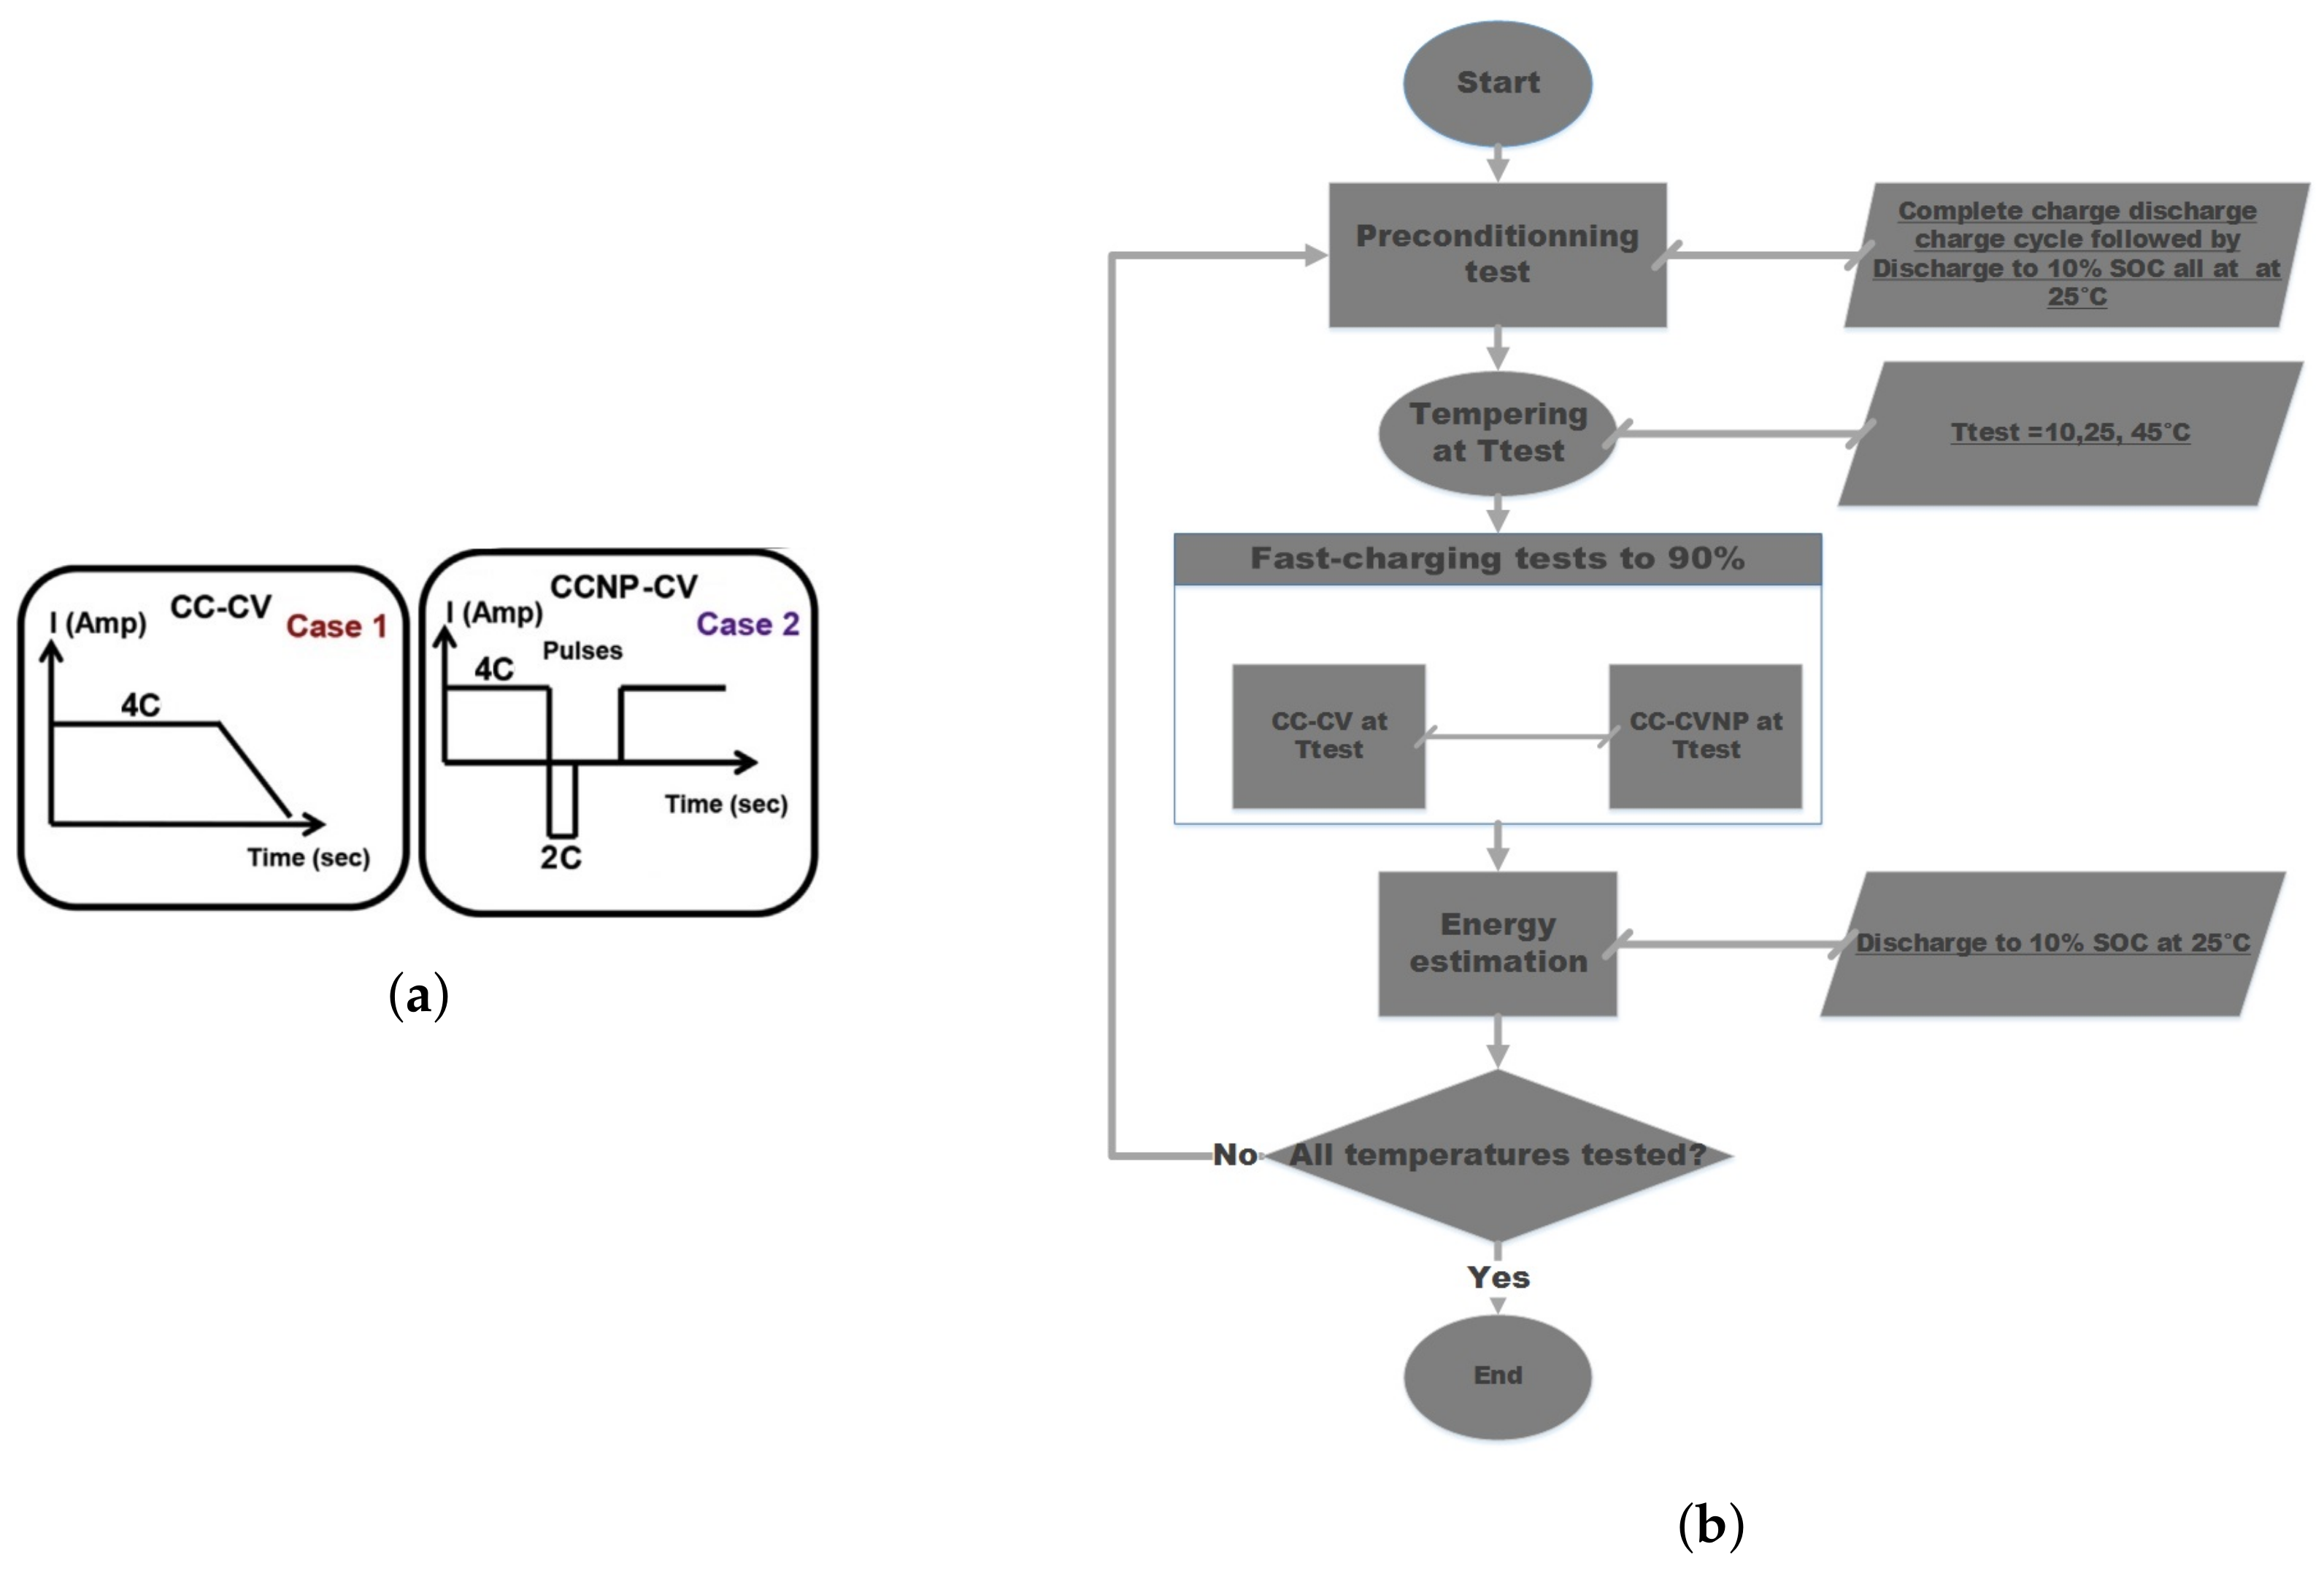
Section 2 explains the experimental design for parameter gathering. Section 3 describes the electro-thermal and lifetime model development. Section 4 deals with the model results and validation, and lastly conclusions are provided in Section 5.

2. Experimental Overview

2.1. Cell Features

In this study, the NMC-based cell was investigated. The main application of this cell is in high-energy density battery systems, and it is rated at 20 Ah. The cell is composed of an LiNi0.33Mn0.33CoO2 positive electrode and LiC6 (graphite) negative electrode. An overview of the main characteristic properties of the used cell is provided in Table 1, and a picture of the NMC cell lying on a sheet of A4 paper is shown in Figure 1. The thermal characterization and validation experiments were conducted in accordance with the test conditions presented in Table 2.

2.2. Experimental Test Bench

The cell has been tested with a battery cycler—the ACT 0550 (80-channel) battery tester from PEC®. Moreover, a negative temperature coefficient (NTC) 5K thermocouple connected to the tester was placed on the cell surface, next to the positive tab in order to record the maximal thermal evolution [35,36]. To control the ambient environment, called Ttest, the cell was placed hermetically in an climatic chamber. Lastly, during the fast-charging tests, infrared radiation (IR) thermal pictures were recorded with a Ti25 FLIR® thermal camera to observe the temperature evolution at different aging states. All the cycling data was recorded by a remote computer and used for the development of the electro-thermal and lifetime model.

2.3. Thermal Characterization of the NMC Cells

The following tests were used to characterize the cell’s thermal and electrical properties:
  • Discharge capacity test;
  • Hybrid pulse power capability (HPPC), based on the IEC6266-1 standard [37,38];
  • Open-circuit voltage (OCV) [39,40].
The above tests were carried out at three temperatures to push the boundaries of the model: 10 °C, 25 °C, and 45 °C. A fully detailed description of these tests was provided in a previous study [41].

2.4. Cycling Aging Test Protocol

The resistance fade data came courtesy of cycling tests that were carried out in-house. A large test matrix including various combinations of cycling temperatures, depth of discharge (DoD) levels, and charge and discharge current rates was developed, and each test condition was carried out on at least two cells. An overview of this test matrix is given in Table 2, where the numbers indicate the amount of cells subjected to each cycling condition.
The cells were cycled for 100 full equivalent cycles (FECs, one FEC is reached when the total discharged capacity reaches the nominal capacity value). After each cycling phase, a series of standard tests was performed at 25 °C to assess the aging state of cell with the value of the capacity and the evolution of the internal resistance.
During each cycling phase the cell underwent a load profile as described in Table 2 to reach different aging states: 95%, 90%, and 80% state of health (SoH). The cycling profiles were designed as continuously charging and discharging, using the measured discharge capacities as the basis for the applied current rates.

2.5. Calendar Aging Test Protocol

Over the course of the aging testing phase, calendar aging tests were also performed, in accordance with the conditions specified by the calendar aging test matrix presented in Table 3. Every 30 days, the characterization tests described above were applied, recording the degradation results. The applied storage state of charge (storage-SoC) was applied prior to storage, and was not maintained during this period.

2.6. Charging Protocol

A normal fast-charge profile usually consists of a constant high applied charge current rate (CC phase), which is cut off when the cell voltage reaches the manufacturer-defined safety limit (for the NMC/C cells, this voltage is 4.15 V). After this voltage is reached, a constant voltage is applied, and the tapering current is monitored. Once this current drops below a predefined value (0.05 C usually), the cell is considered to be fully charged. In this work, an adapted fast-charging profile was used, based on the work presented in [19]. This profile is a constant current negative pulse–constant voltage (CCNP–CV) profile. This profile consists of charge current of 4 C (80 A for the 20 Ah NMC cells), during which –2C pulses are applied, followed each time by a 2-s rest time. The width of the negative (discharge) pulses has been chosen so that each negative pulse discharges the cell for 0.1 Ah of the nominal cell capacity, which prevents cell degradation during the application of the fast-charge current [19]. After the cell voltage reaches the maximum voltage, a CV-charging phase is applied, identical to the CV phase described for normal fast-charging profiles. A schematic representation of this profile is shown in Figure 2a. A flowchart describing the decision-making process is shown in Figure 2b.

3. Model Development

In this study, a combined electro-thermal lifetime model is proposed. The electrical and thermal models are based on the electrical equivalent circuit (EEC) approach. They were presented in [43] and thus will not be detailed here.

3.1. Pouch-Cell Geometry

The geometry of the NMC pouch cell is represented in Figure 3. In this model, the core is assumed to be an equivalent flat element seen as a stack of layers with the anisotropicity of the thermal conductivities [41,44]. This implies a higher value of the conductivity in the x- and y-axes than in the z-direction. To simulate the thermal behavior, COMSOL computational fluid dynamics (CFD) software was used with heat transfer in solid physics to compute the thermal equations. Also, an extremely coarse meshing grid was created, consisting of 6059 domains, 3639 boundary elements, and 773 edge elements.

3.2. Description of the Model

In this paper, the development of a battery model through the integration and validation of the dedicated models in a single modeling unit is proposed. This modeling unit is a combination of the optimized dedicated models capable of addressing and providing information on a wide range of NMC-based cell phenomena, including the electrical, thermal, and lifetime characteristics of cells. The model was developed in a Matlab Simulink™ environment, combined with the COMSOL Livelink™ interface. The electrical and lifetime part were computed by Matlab™, while the thermal distribution was estimated through COMSOL equations.

3.3. Electrical Modeling

To determine the voltage behavior of the cell, an equivalent circuit model (ECM)-based Thévenin-based model was used, involving a solution of voltage sources, resistors, and capacitors. The ECM model was composed of two parallel RC branches and one ohmic resistor. This second-order electric model is able to represent the ohmic resistance R o , concentration polarization resistance R C 1 , and the activation polarization resistance R C 2 . The model is thus able to accurately simulate the cell voltage behavior during transient states of charging and discharging. The general equation is defined as [45]:
V b a t t = O C V R 0 I b a t t R 1 I 1 R 2 I 2
where:
O C V = Open-Circuit Voltage (V);
I b a t t = Battery current (A);
I 1 = Current in first RC-element (R1 // C1) (A);
I 2 = Current in second RC-element (R2 // C2) (A).
An equivalent circuit model of the second-order Thévenin model is shown in Figure 4.
All the parameters in Equation (1) were obtained with the thermal characterization tests explained in Section 2.3 and were temperature- and SoC-dependent.

3.4. Thermal Modeling

The thermal model used in this paper was described in a previous study [41]. The model solves a heat-diffusion problem, describing the thermal reactions between the cell domains and heat convection with respect to the ambient environment. The equation was derived from the modified enthalpy of the electrochemical reaction, based on the energy balance study described in [46,47]:
q g = q o h m i c = R 0 · I 2 + R 1 I 1 2 + R 2 I 2 2
where:
q g = Heat Flux (W);
q o h m i c = Heat generation due to the ohmic and polarization resistance (‘irreversible’ heat) (W).
In short, the zero-dimensional (0D) model calculates the time-dependent heat generation (2), incorporating the internal resistances and the OCV, as shown in the Equations (1) and (2). Moreover, as the study investigated high-current profiles, the “reversible” or entropic heat was not considered in this study [43].
Regarding the boundary limits of the model, the heat convection to the environment was determined by solving the convection equation [47]:
q c o n v = h S ( T a m b T )
where:
S= Cross-sectional area (m 2 );
h= Convection transfer coefficient (W/m2·K);
T a m b = Ambient temperature (25 °C);
T= Cell temperature (°C).
In this study, the cell is cooled by natural convection. Thus, h equals 5 W (m2·K) 1 , as was described in [47]. More details about the thermal model assumptions may be found in [41].

3.5. Aging Modeling

The internal resistance (R i n t ) aging model was developed using an empirical approach. As mentioned before, the resistance values were periodically recorded, which enabled the possibility of extrapolation of these results. Firstly however, the “pure’ cycling aging was calculated. The assumption was that cells, while cycling, were still influenced by calendaring aging phenomena. Therefore, the calendar aging data was used to subtract the calendaring influence from the cycling aging test results before the cycling aging model was developed. This method was also used in our previous work on capacity fade modeling [28], and a similar approach was used in [48].
The resulting “pure” aging data was then extrapolated using simple polynomial equations, for which the equation order is dependent on the specific cycling condition. The used equation is generalized in Equation (4).
R D D ( x ) = i = 0 n a i x i
where:
x= Cycle Number/storage time;
a i = Constants for x;
n= Order of the x-factor of the polynomial.
An example of this extrapolation can be seen in Figure 5. This was done for all tested conditions, both cycling and calendaring test results. From these results it is clear that the DoD level applied during cycling has a significant influence on the internal resistance degradation rate. It is also important to note that the measured internal resistance values across all cells can show a high degree of variability, and evolve with less consistency compared to the capacity fade evolution.
The impact of any complex load profile on the evolution of the internal resistance degradation could be analyzed using this methodology. The current profile itself was deconstructed into a set of simple cycling conditions using the rainflow counting method [49]. Linear interpolation was then used for the found cycling conditions, which are not present in the cycling test matrix (see Table 2). All results of the model were expressed in percentual values, describing the deviation from the original internal resistance measured before aging. In addition, the models do not take the history of the cell into consideration, but only consider the current operating conditions in order to calculate the internal resistance increase. The model is developed using the same methodologies as in [28], where more details can be found.

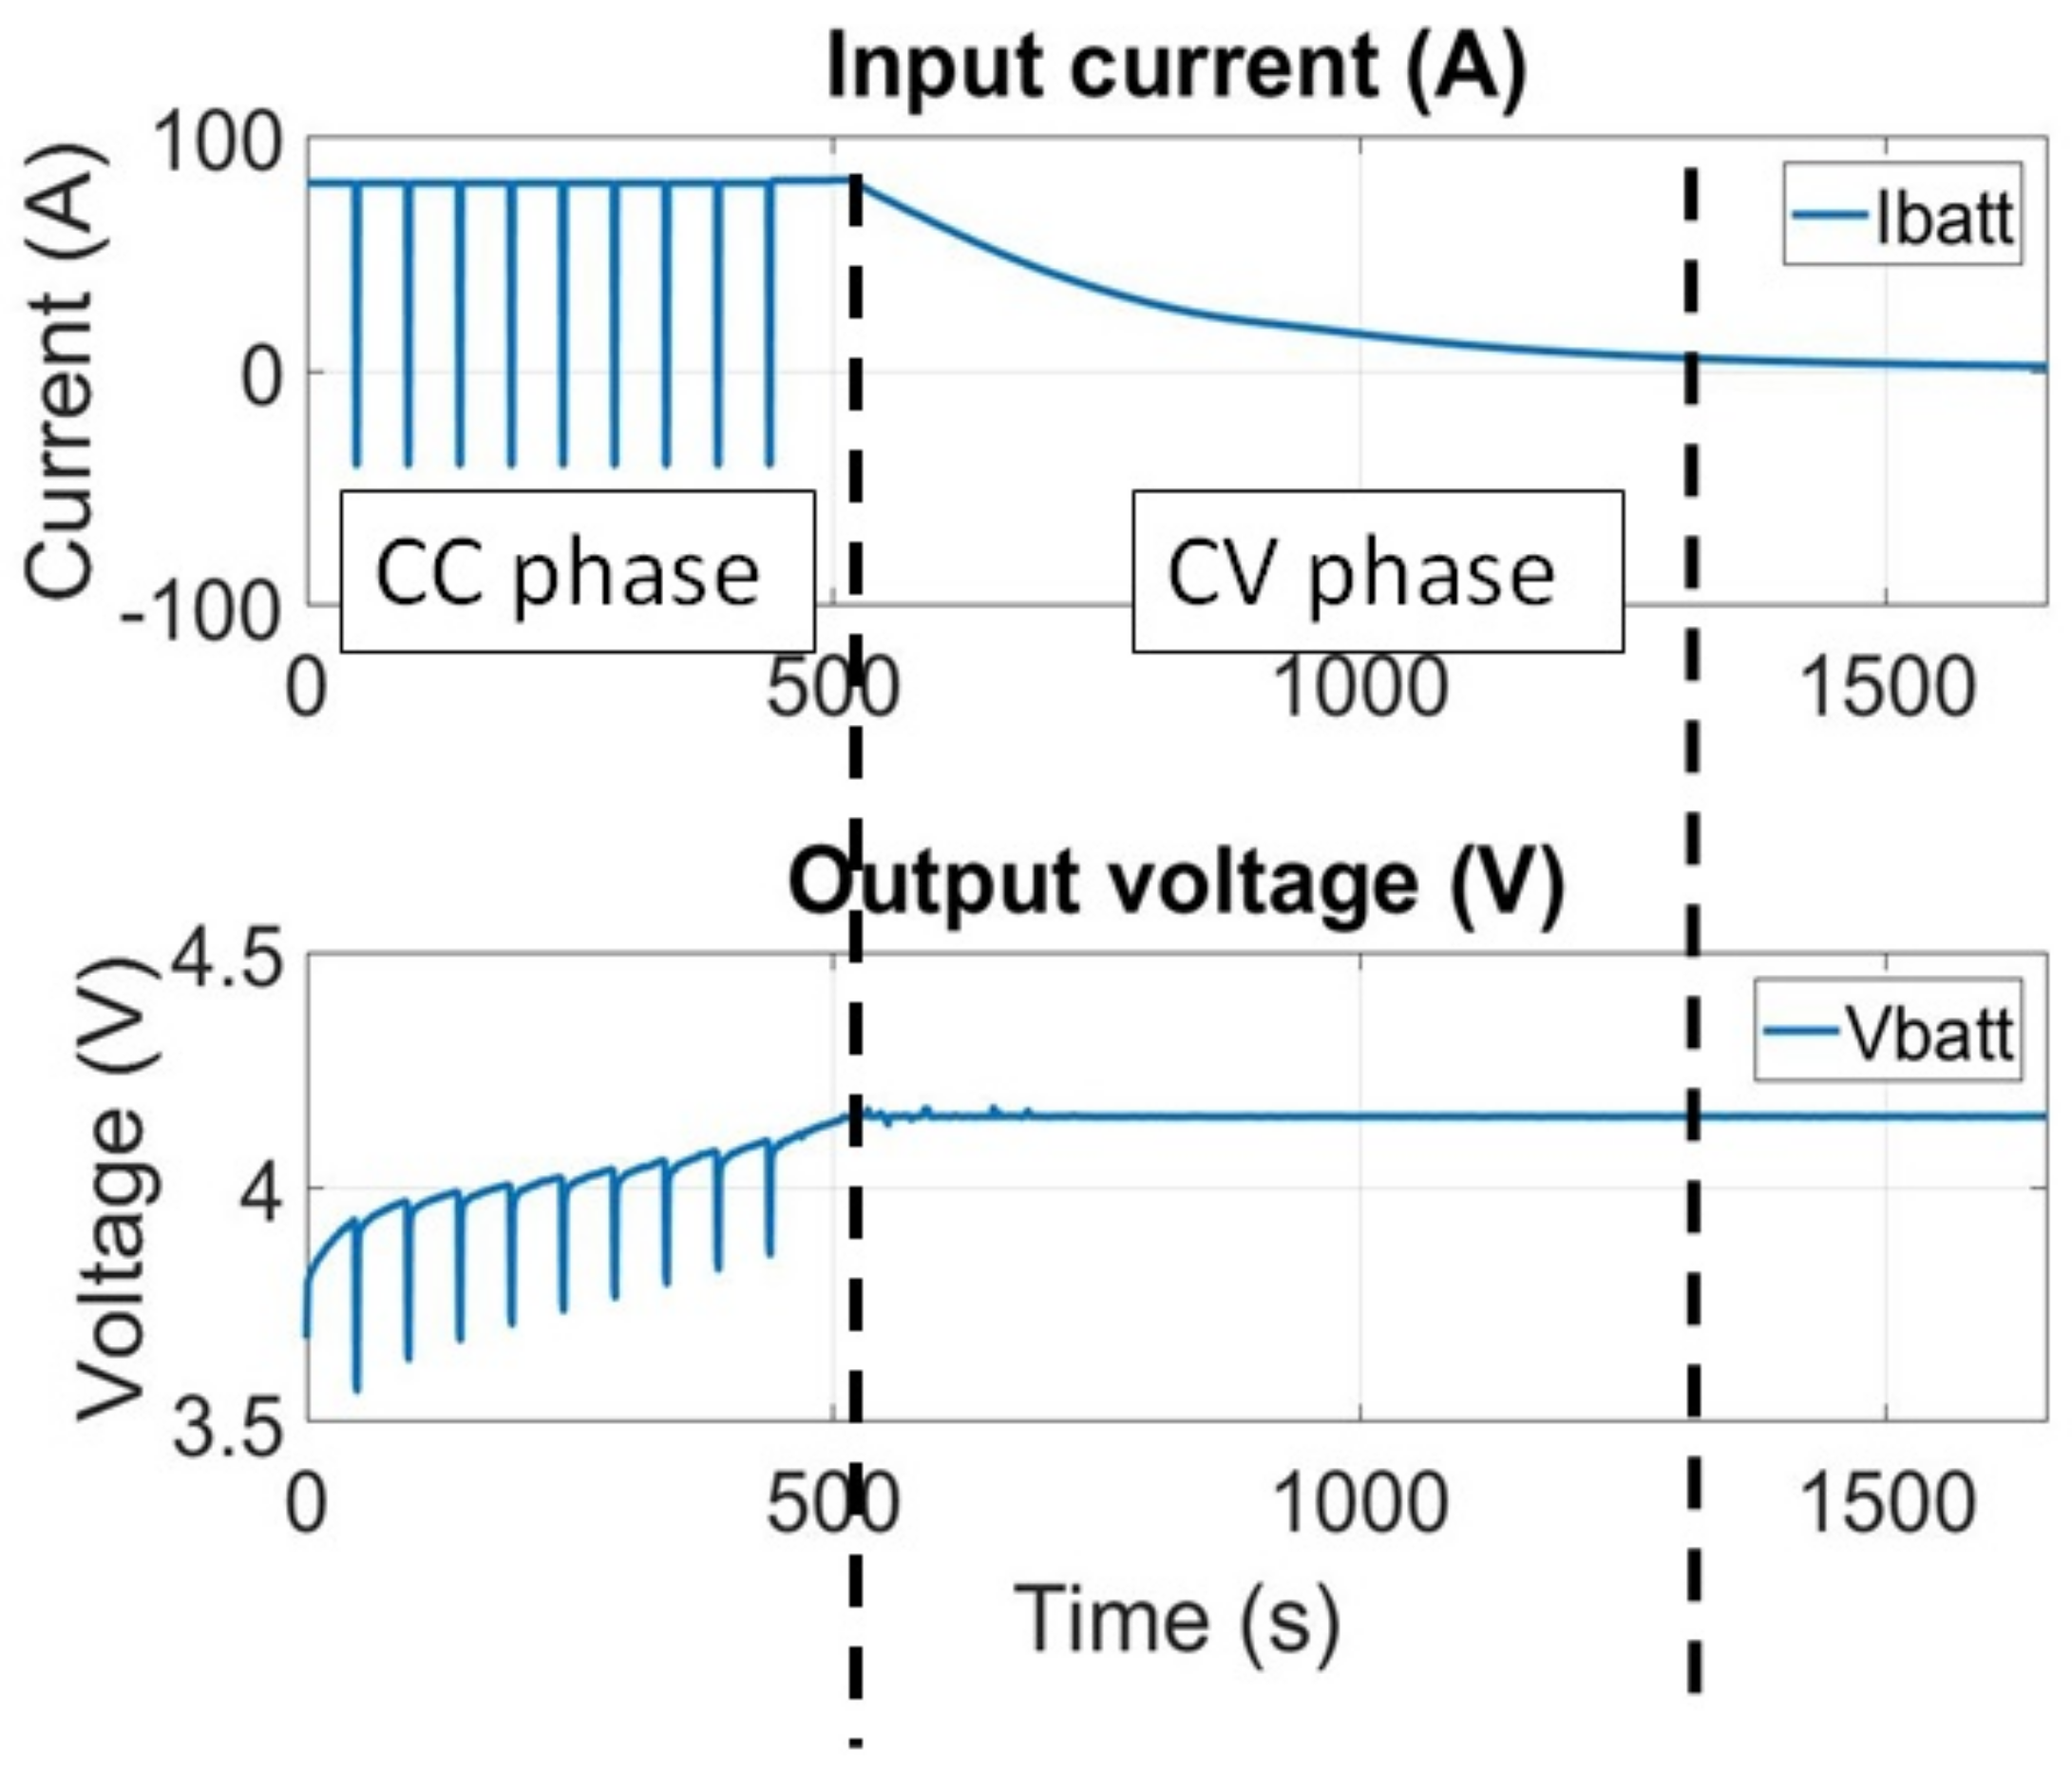
4. Results and Discussion

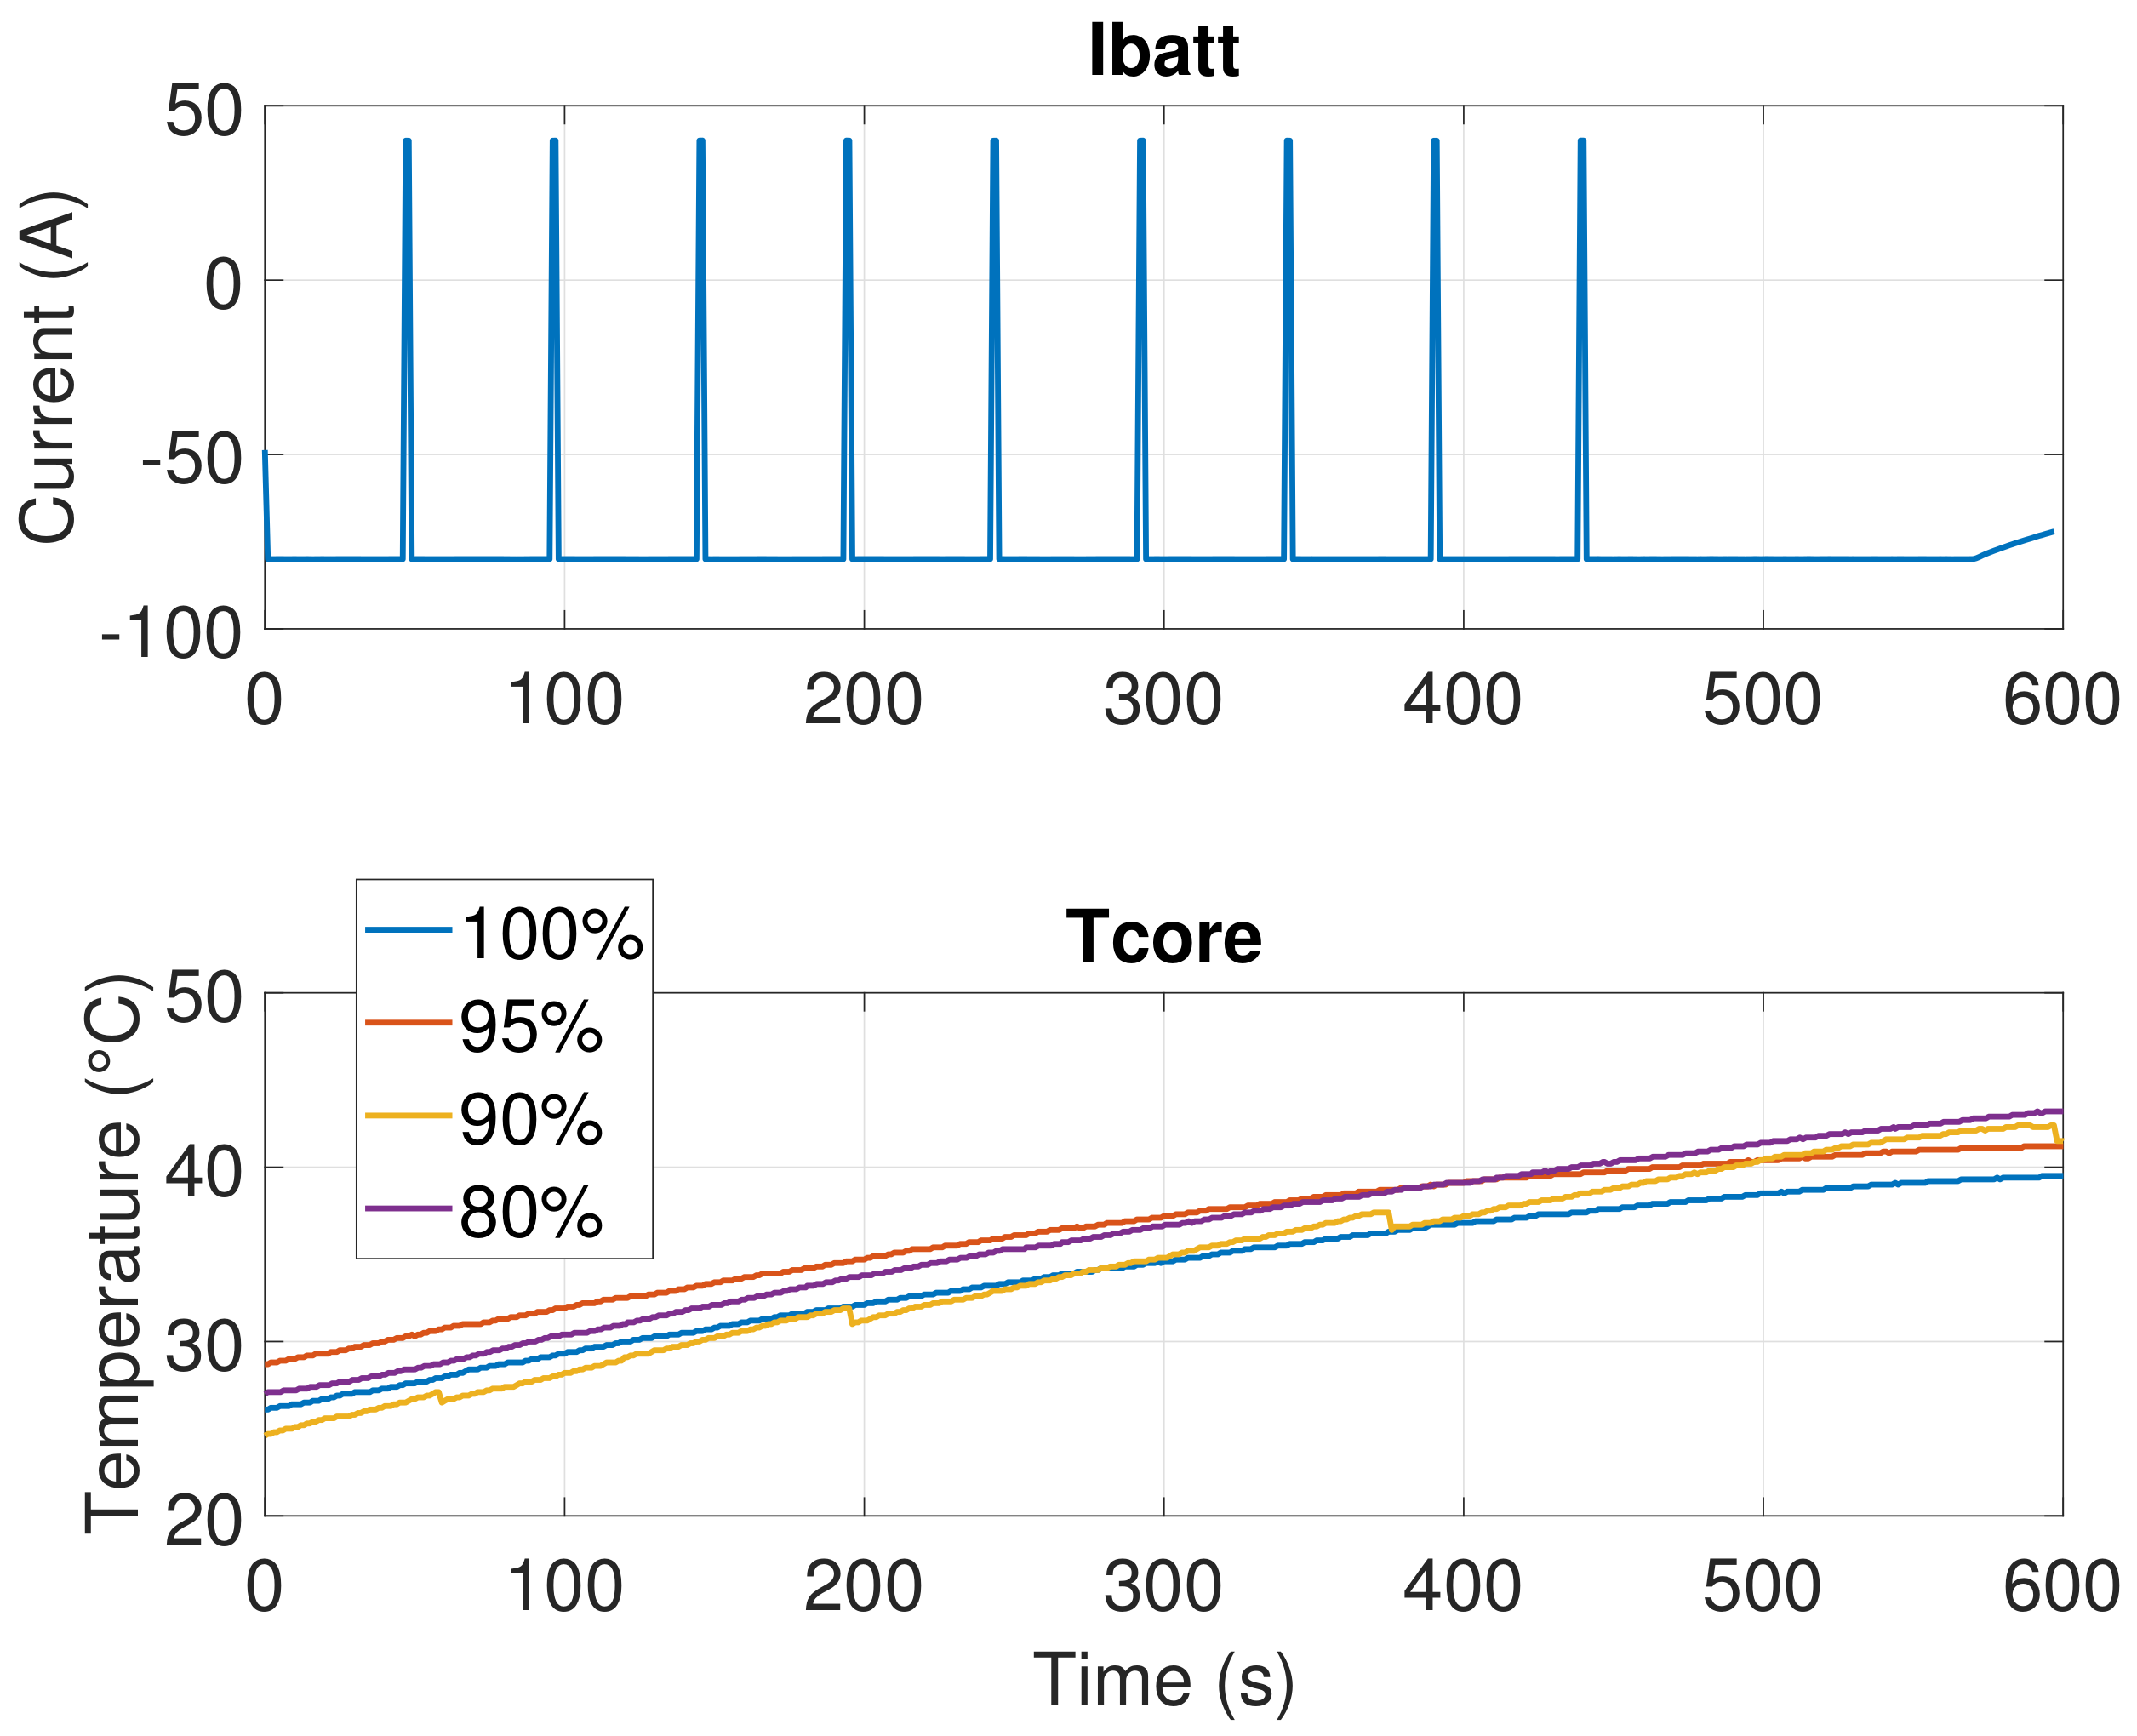
The results of the fast-charging study at ambient temperature are described in this section, sorted by aging state: 100%, 95%, 90%, and 80% SoH. The applied fast-charge current profile, with the voltage response measured from the NMC/C cells, is shown in Figure 6. In this regard, it has to be noted that the thermal pictures presented in the following sub-sections show the highest temperature point during the fast-charging profile. Moreover, for validation purposes, the one-dimensional (1D) temperature graph for which the evolution of the temperature with time is compared to the simulation is also shown for all the tests. The error values shown accompanying the 1D thermal validation figures are the root-mean-square error (RMSE) values, calculated as follows (Equation (5)):
R M S E = i = 1 n ( y ^ i y i ) 2 n
where:
y ^ i = Predicted values;
y i = Measured values;
n= Number of prediction points.
Lastly, the electrical aspect of the model was already validated in [43], and thus will not be shown in this study.

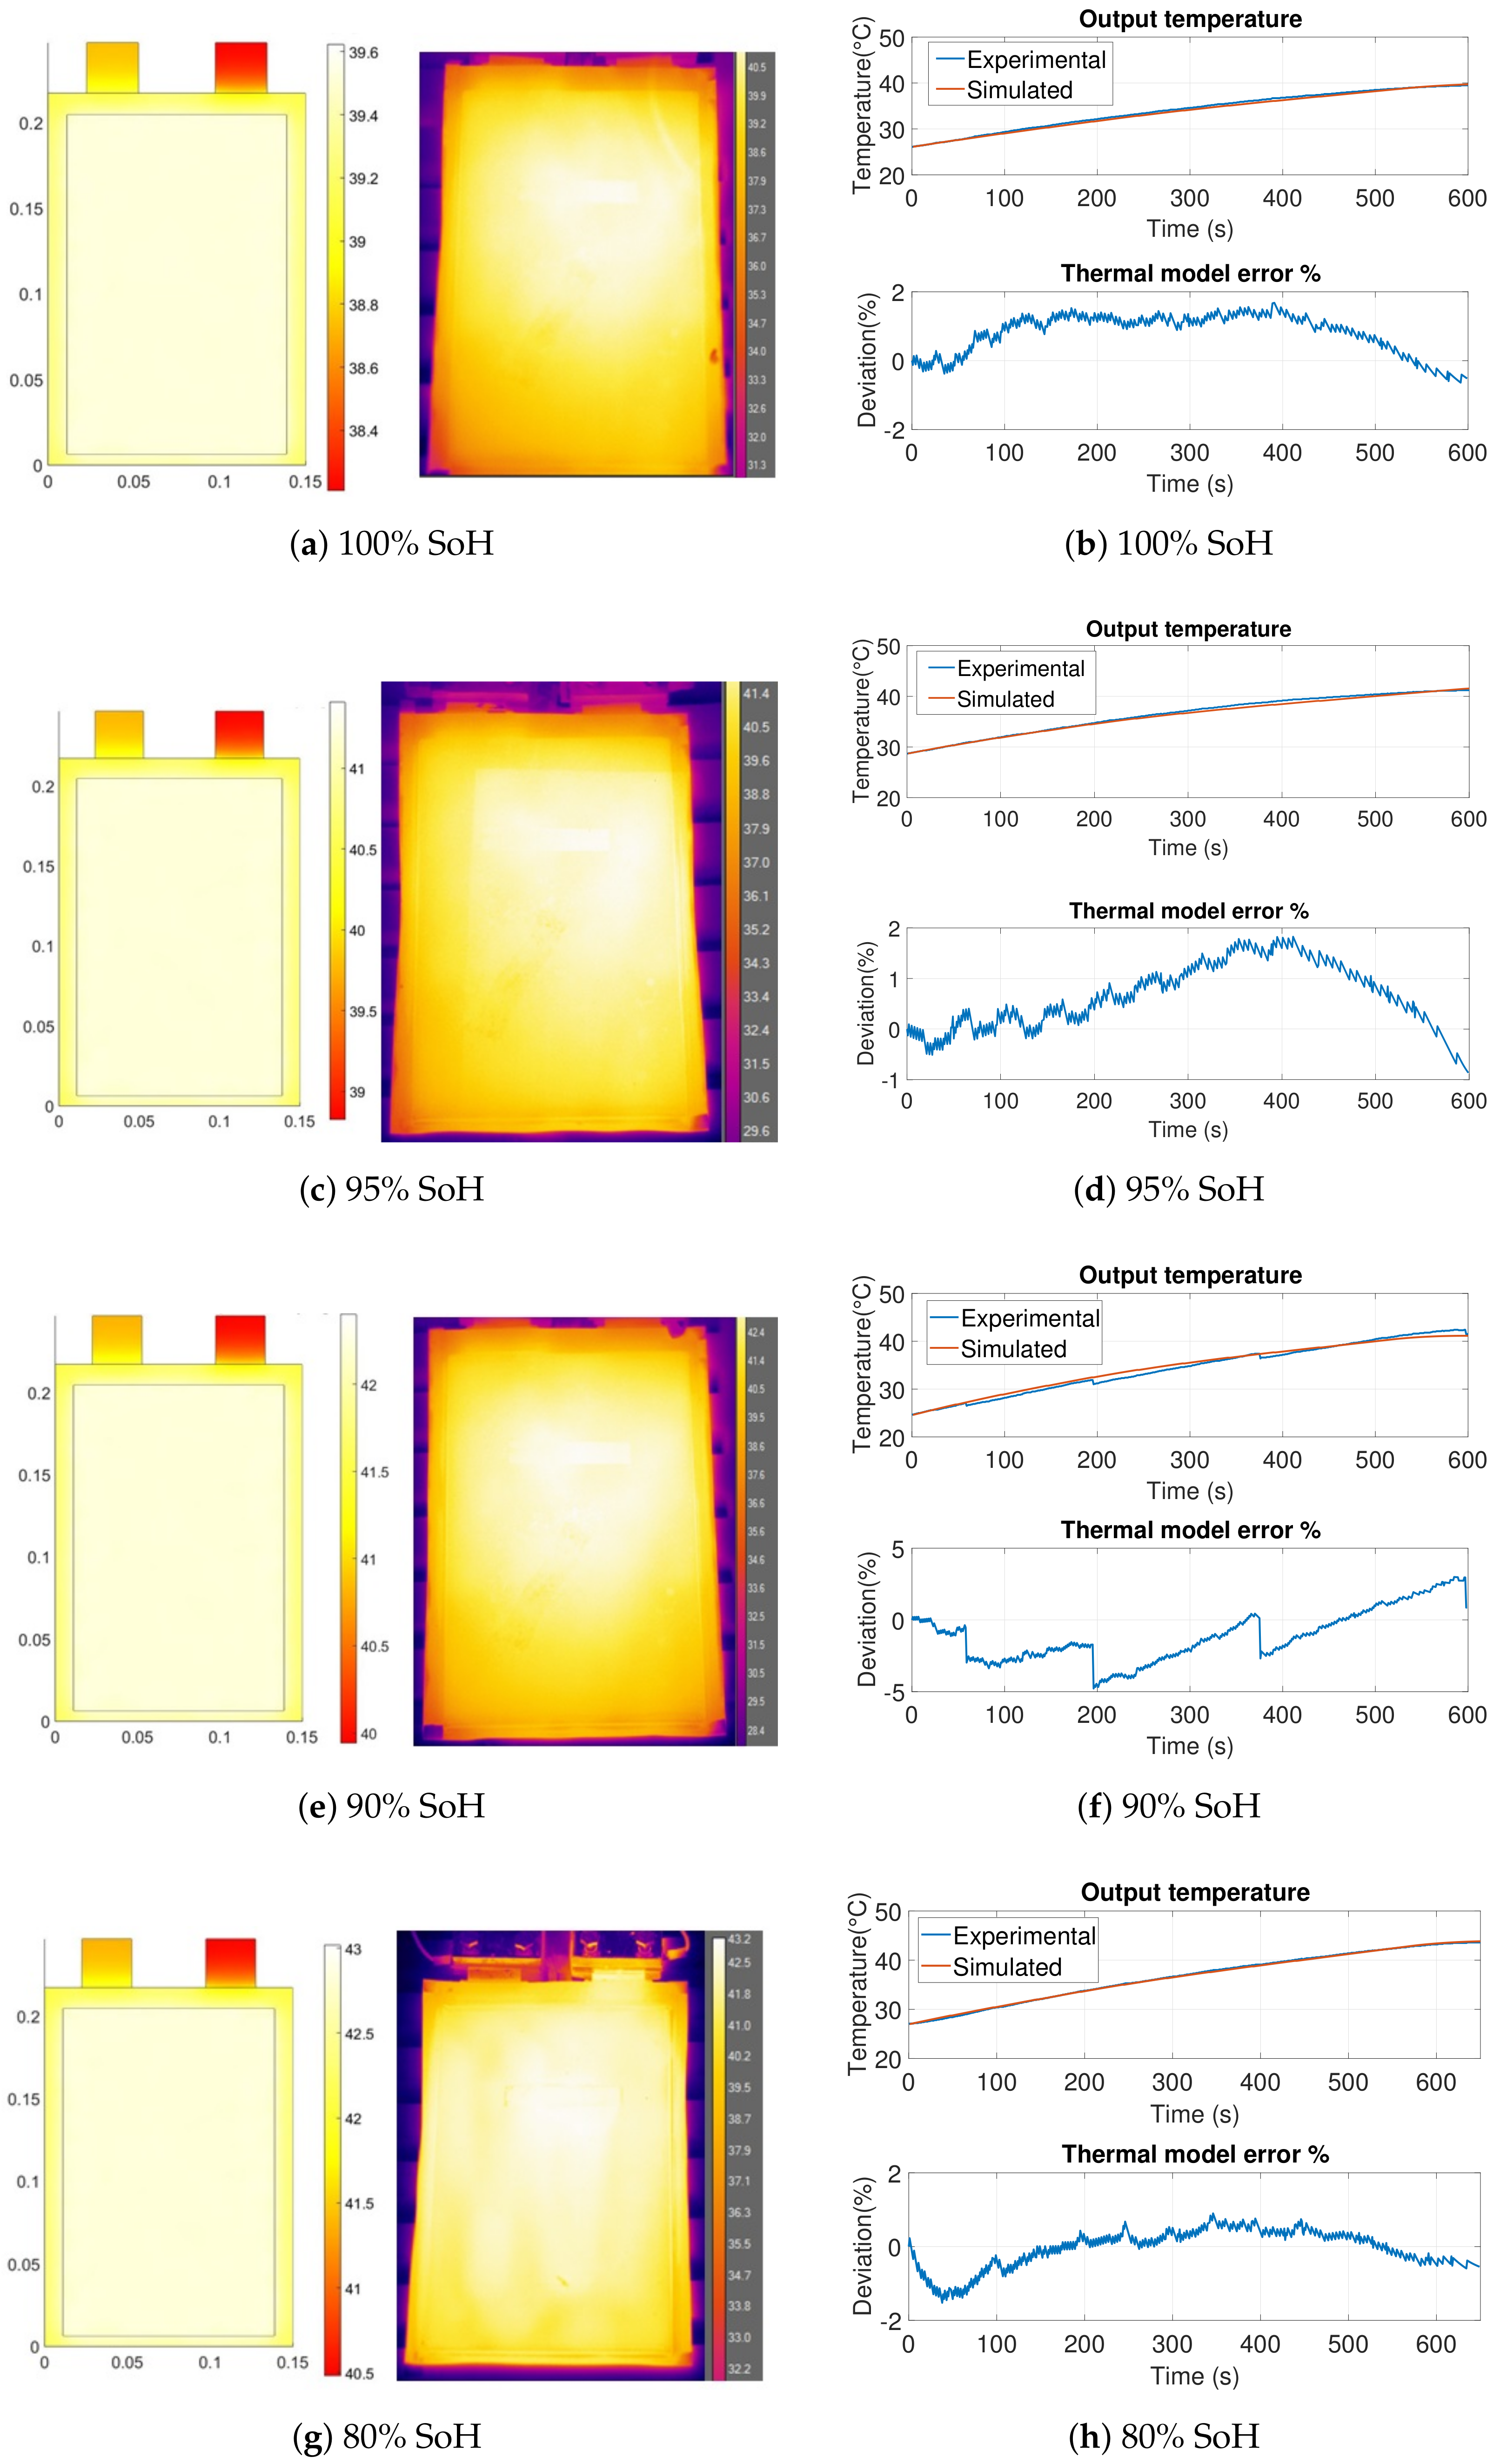
4.1. Fast-Charging Results for a Fresh Cell

Figure 7b displays the thermal evolution at ambient temperature (25 °C) for the CCNP–CV test of a fresh NMC cell (100% SoH). The spatial distribution under the fast-charging profile shows a hot region observed in the center of the cell, which is confirmed in other studies [35,50]. Moreover, as shown in Figure 7a, the three-dimensional (3D)-thermal model evenly reproduces the spatial distribution at the same simulation point, corroborating the good behavior of the model. The results shown in Figure 7b showed the same temperature evolution between the model and experimental results when the CCNP–CV was applied. On that note, the temperature graph actually displays a gradient of almost 20 °C. The reason for this extreme heat-up is that the NMC material comprising the cell tends to generate high thermal instability when applying a current. This implies that fast charging with NMC cells could be problematic if not properly controlled by a thermal management system.

4.2. Fast-Charging Results for an Aged Cell

Figure 7c–h present the fast-charging test results for aged cells: 95%, 90%, and 80% SoH. Again, the NMC chemistry displays a high final temperature value of around 40 °C which is actually rising as the cell ages. Since the resistance of the cell is increasing due to electrochemical phenomena such as reduced electrolyte conductivity or a plated anode [26,32], the corresponding heat generation is greater, hence resulting in a higher maximal temperature, as shown in Figure 8. The experimental values shown in Figure 7f appear to be sequenced, increasing the RMSE values for this specific validation test. The reason for this behavior is that the thermal camera self-calibrated during the recording of the experiment.
Moreover, by comparing the thermal pictures at different aging states, one can see that the thermal distribution has changed. Indeed, at 100% SoH, the high temperature point is located in the center but as the cell ages, the temperature distribution is more uniform, as shown in in Figure 7g. The reason for this fact could be explained by the evolution of the thermal parameters such as the thermal conductivity with degradation. As the cell ages, the conduction of the NMC cell along the y-axis could rise, which would provoke a finer uniformity of the cell. In [51], the authors have shown that the impact of degradation could cause changes in parameters such as the in-plane conductivity in a lithium-ion cell. This could confirm the assumption shown in Figure 7g. Nonetheless, this phenomenon has not yet been researched in literature for NMC cells, and specific tests would be required to confirm this assumption.
Additionally, notwithstanding the good agreements between the 3D-thermal images and the model output temperature, the exact thermal distribution could not be reproduced by the model due to the fact that the aging influence on the thermal parameters behavior was not considered. Dedicated equipment and testing would be needed to obtain such behavior.
Nonetheless, Figure 7d,f,h show the 2D-temperature plot for the three aged states of the cell. The model displays with good estimation the temperature evolution at different aging states, for which less than 1 °C difference is found when comparing experimental and simulation results. As a consequence, the overall good model agreement with experimental results validates the model developed in this work.
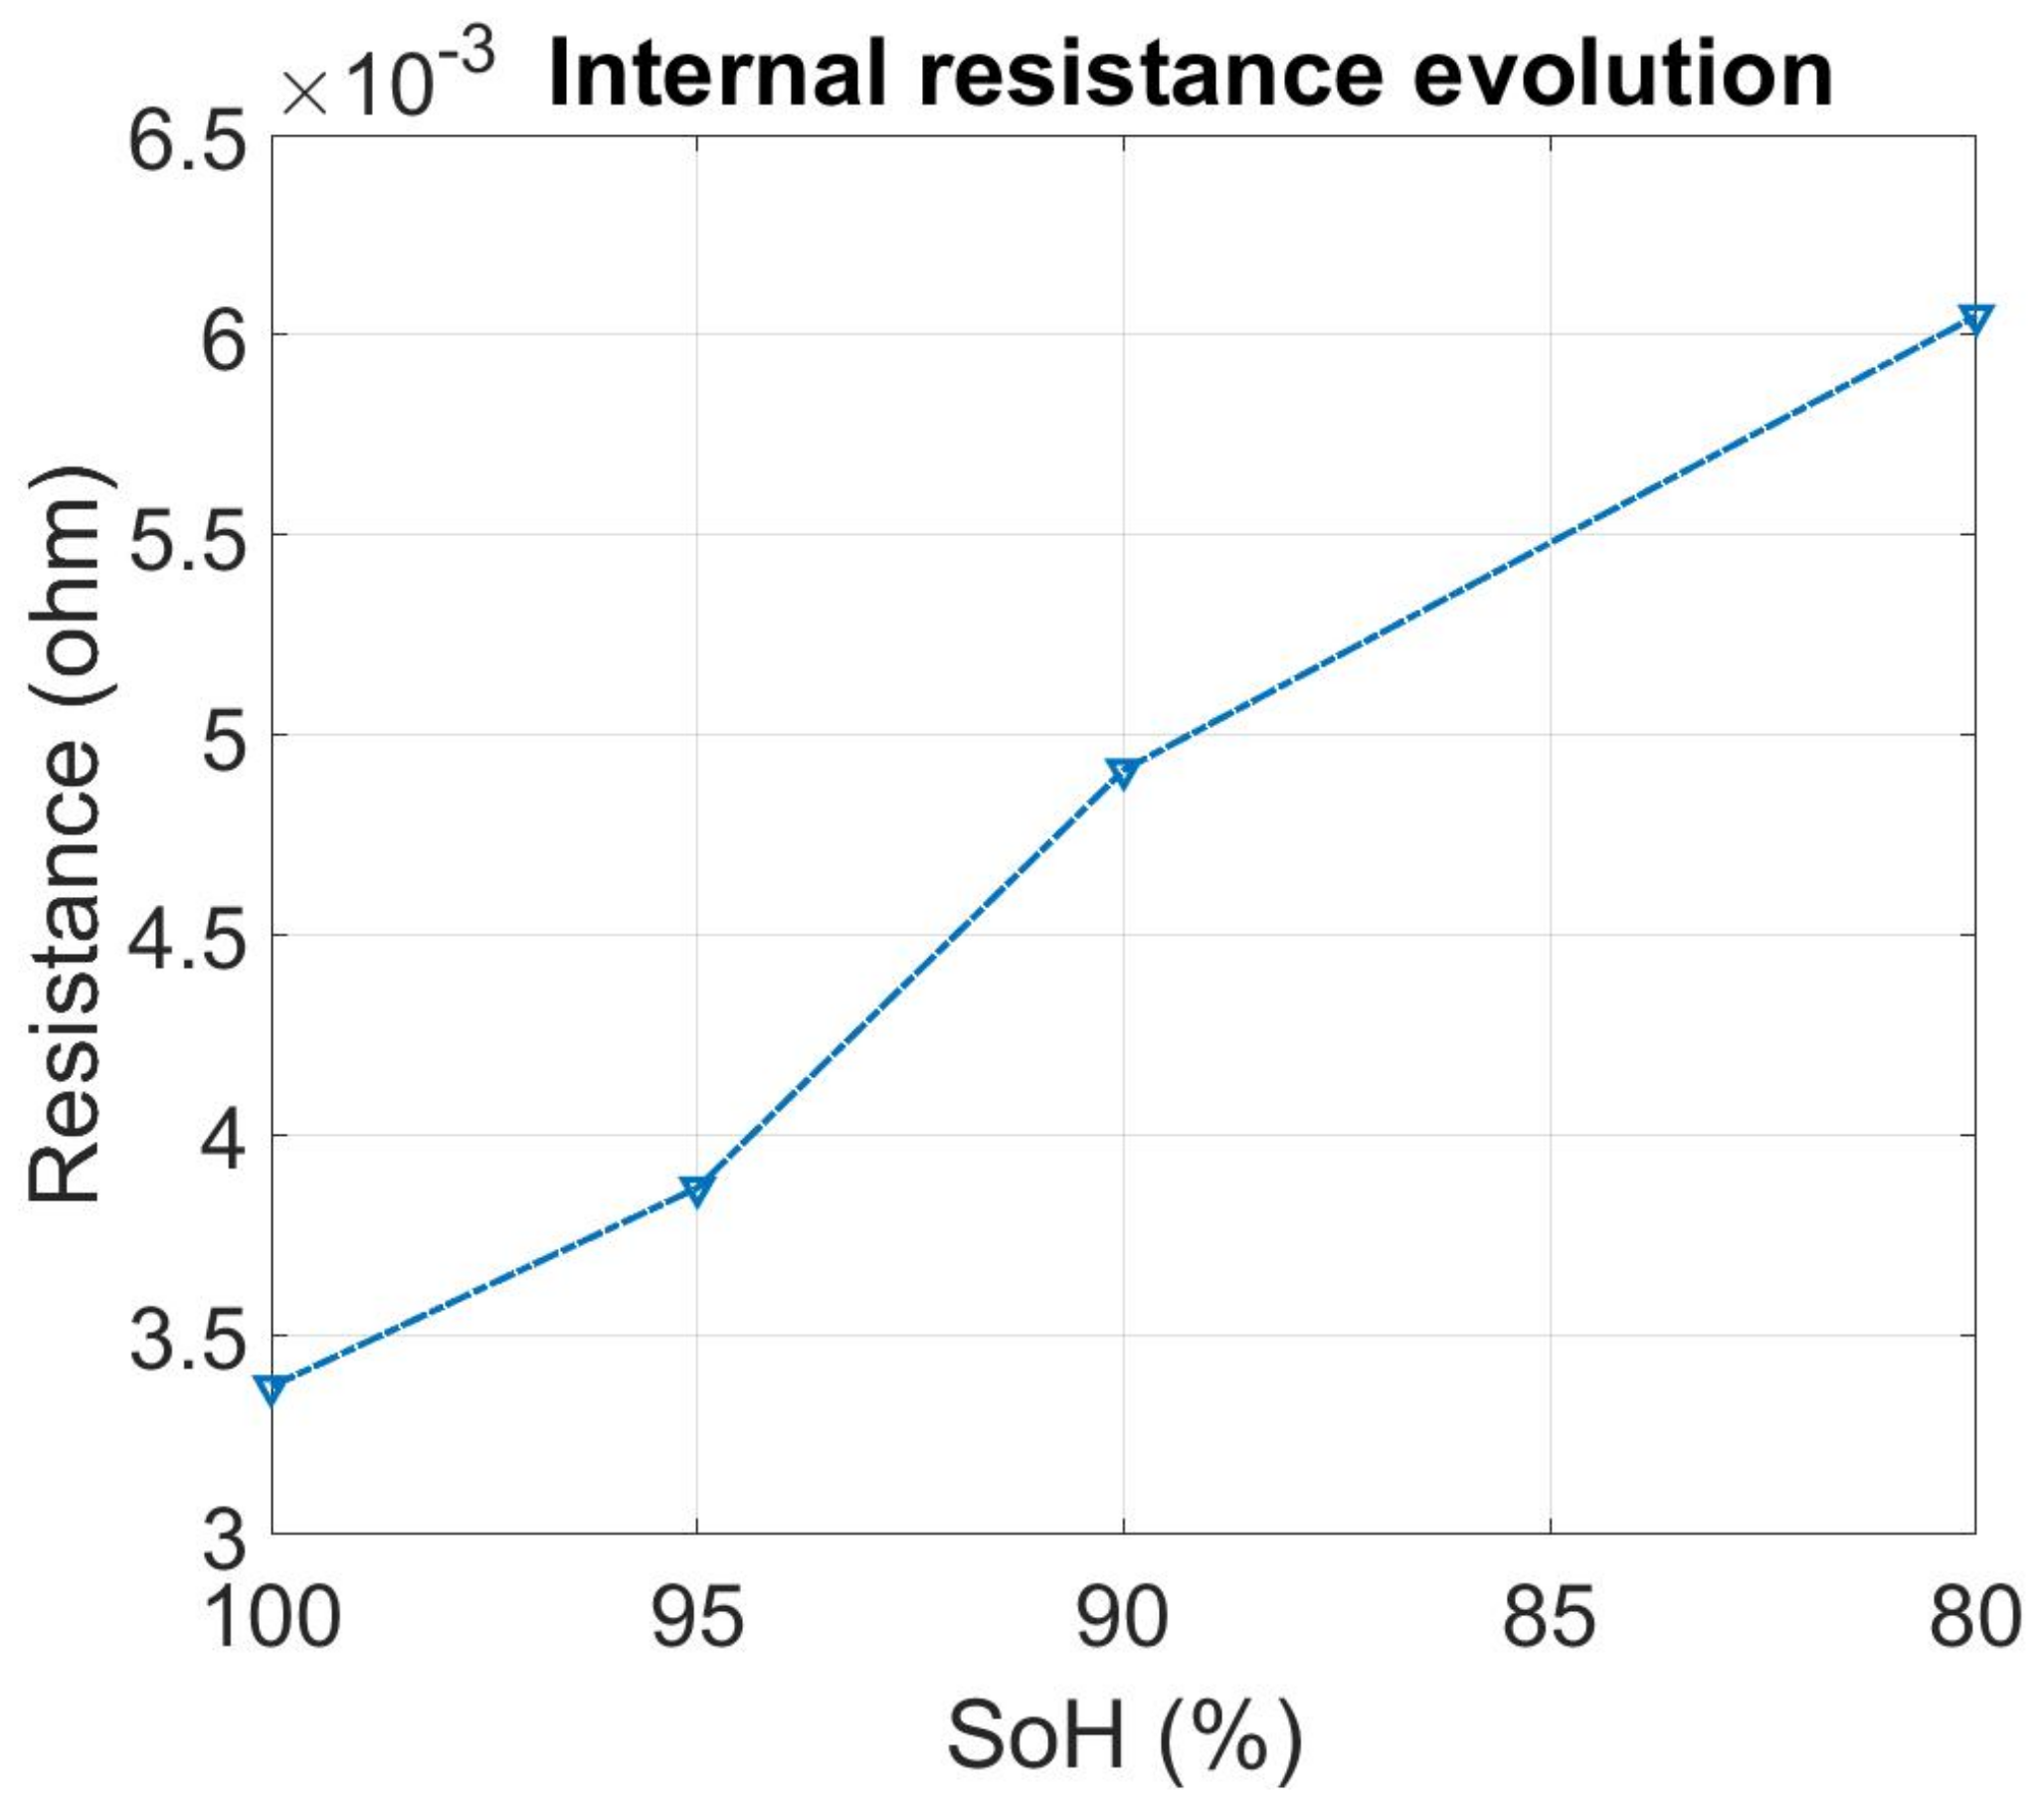
Figure 9 shows the evolution of the internal resistance due to the fast-charging current profile applied to the cells. As can be noted, the internal resistance has increased to nearly double the initial value, from 3.5 mΩ to around 6 mΩ. Interestingly, as the cyclable capacity reaches 80% (which is the end-of-life condition), the internal resistance increased by nearly 100%, which is also considered as an end-of-life condition.

5. Conclusions

In this paper, a novel combination of electric, thermal, and aging models is proposed. The interactions between these models are able to provide a unique insight in the thermal and electrical properties as they change due to aging. The good correspondence between the measured thermal results and the simulations, both for fresh and aged cells, is a testament to the validity of the proposed combined model. In all aging states, the output of this model correctly estimates the temperature evolution within an accuracy window of ±2 °C maximum error. The model and its results can be implemented in battery management systems, firstly to monitor and secondly to control the battery system’s thermal behavior, in order to optimize the total lifetime of the cells and guarantee the thermal stability and therefore the safety of the battery system. As a consequence, as future work, the pouch cell’s degradation and battery thermal management strategy will be considered in the scope of fast-charging applications but with more of a focus on optimization of thermal management strategies such as active or passive cooling, or other new cooling concepts.

Acknowledgments

This research has been made possible thanks to the research project ’BATTLE’ and was funded by the Flemish Agency for Innovation and Entrepreneurship (IWT130019). Further, we acknowledge Flanders Make for support to our research team.

Author Contributions

Joris de Hoog and Joris Jaguemont wrote the publication; and the thermal measurements were performed by Joris Jaguemont, who also developed the electro-thermal model together with Mohamed Abdel-Monem. The impedance model was designed and developed by Joris de Hoog. Guidance and supervision were provided by Peter Van Den Bossche, Joeri Van Mierlo, and Noshin Omar.

Conflicts of Interest

The authors declare no conflict of interest.

Abbreviations

The following abbreviations are used in this manuscript:
CCConstant current
CFDComputational fluid dynamics
CVConstant voltage
DoDDepth of discharge
ECMEquivalent circuit model
EECElectrical equivalent circuit
EVElectric vehicle
FECFull equivalent cycle
HEVHybrid electric vehicle
HPPCHybrid pulse power characterization
LiBLithium-ion battery
NPNegative pulse
NMCNickel manganese cobalt
OCVOpen circuit voltage
RRDRelative resistance degradation
SoCState of charge
SoHState of health

References

  1. Scrosati, B.; Garche, J. Lithium batteries: Status, prospects and future. J. Power Sources 2010, 195, 2419–2430. [Google Scholar] [CrossRef]
  2. Micari, S.; Polimeni, A.; Napoli, G.; Andaloro, L.; Antonucci, V. Electric vehicle charging infrastructure planning in a road network. Renew. Sustain. Energy Rev. 2017, 80, 98–108. [Google Scholar] [CrossRef]
  3. Sonoc, A.; Jeswiet, J.; Soo, V.K. Opportunities to Improve Recycling of Automotive Lithium Ion Batteries. Procedia CIRP 2015, 29, 752–757. [Google Scholar] [CrossRef]
  4. Ordoñez, J.; Gago, E.J.; Girard, A. Processes and technologies for the recycling and recovery of spent lithium-ion batteries. Renew. Sustain. Energy Rev. 2016, 60, 195–205. [Google Scholar] [CrossRef]
  5. Bubeck, S.; Tomaschek, J.; Fahl, U. Perspectives of electric mobility: Total cost of ownership of electric vehicles in Germany. Transp. Policy 2016, 50, 63–77. [Google Scholar] [CrossRef]
  6. Mitropoulos, L.K.; Prevedouros, P.D.; Kopelias, P. Total cost of ownership and externalities of conventional, hybrid and electric vehicle. Transp. Res. Procedia 2017, 24, 267–274. [Google Scholar] [CrossRef]
  7. Hendricks, C.; Williard, N.; Mathew, S.; Pecht, M. A failure modes, mechanisms, and effects analysis (FMMEA) of lithium-ion batteries. J. Power Sources 2015, 297, 113–120. [Google Scholar] [CrossRef]
  8. Dincer, I.; Hamut, H.S.; Nader, J. Thermal Management of Electric Vehicle Battery Systems; John Wiley & Sons: Hoboken, NJ, USA, 2017; p. 480. [Google Scholar]
  9. Zhang, C.; Jiang, J.; Gao, Y.; Zhang, W.; Liu, Q.; Hu, X. Charging optimization in lithium-ion batteries based on temperature rise and charge time. Appl. Energy 2017, 194, 569–577. [Google Scholar] [CrossRef]
  10. Zaghib, K.; Dontigny, M.; Guerfi, A.; Charest, P.; Rodrigues, I.; Mauger, A.; Julien, C.M. Safe and fast-charging Li-ion battery with long shelf life for power applications. J. Power Sources 2011, 196, 3949–3954. [Google Scholar] [CrossRef]
  11. Abada, S.; Marlair, G.; Lecocq, A.; Petit, M.; Sauvant-Moynot, V.; Huet, F. Safety focused modeling of lithium-ion batteries: A review. J. Power Sources 2016, 306, 178–192. [Google Scholar] [CrossRef]
  12. Feng, X.; Fang, M.; He, X.; Ouyang, M.; Lu, L.; Wang, H.; Zhang, M. Thermal runaway features of large format prismatic lithium ion battery using extended volume accelerating rate calorimetry. J. Power Sources 2014, 255, 294–301. [Google Scholar] [CrossRef]
  13. Feng, X.; He, X.; Ouyang, M.; Lu, L.; Wu, P.; Kulp, C.; Prasser, S. Thermal runaway propagation model for designing a safer battery pack with 25Ah LiNixCoyMnzO2 large format lithium ion battery. Appl. Energy 2015, 154, 74–91. [Google Scholar] [CrossRef]
  14. Macneil, D.D.; Lam, C.; Lougheed, G.; Kroeker, R.; Charbonneau, G.; Lalime, G. EVS29 Symposium Fire Testing of Electric Vehicle Battery Packs and Vehicles as Compared to ICE Vehicles. In Proceedings of the 2016 Electric Vehicle Symposium & Exhibition 29 (EVS29), Montréal, QC, Canada, 19–22 June 2016; pp. 1–7. [Google Scholar]
  15. Anseán, D.; González, M.; Viera, J.; García, V.; Blanco, C.; Valledor, M. Fast charging technique for high power lithium iron phosphate batteries: A cycle life analysis. J. Power Sources 2013, 239, 9–15. [Google Scholar] [CrossRef]
  16. Kim, U.S.; Yi, J.; Shin, C.B.; Han, T.; Park, S. Modelling the thermal behaviour of a lithium-ion battery during charge. J. Power Sources 2011, 196, 5115–5121. [Google Scholar] [CrossRef]
  17. Noh, M.; Thivel, P.; Lefrou, C.; Bultel, Y. Fast-charging of lithium iron phosphate battery with ohmic-drop compensation method. J. Energy Storage 2016, 8, 160–167. [Google Scholar] [CrossRef]
  18. Zhu, X.; Luo, B.; Butburee, T.; Zhu, J.; Han, S.; Wang, L. Hierarchical macro/mesoporous NiO as stable and fast-charging anode materials for lithium-ion batteries. Microporous Mesoporous Mater. 2017, 238, 78–83. [Google Scholar] [CrossRef]
  19. Abdel-Monem, M.; Trad, K.; Omar, N.; Hegazy, O.; Van den Bossche, P.; Van Mierlo, J. Influence analysis of static and dynamic fast-charging current profiles on ageing performance of commercial lithium-ion batteries. Energy 2016, 120, 179–191. [Google Scholar] [CrossRef]
  20. Abdel Monem, M.; Trad, K.; Omar, N.; Hegazy, O.; Mantels, B.; Mulder, G.; Van den Bossche, P.; Van Mierlo, J. Lithium-ion batteries: Evaluation study of different charging methodologies based on aging process. Appl. Energy 2015, 152, 143–155. [Google Scholar] [CrossRef]
  21. Motapon, S.N.; Lupien-Bedard, A.; Dessaint, L.A.; Fortin-Blanchette, H.; Al-Haddad, K. A Generic Electrothermal Li-ion Battery Model for Rapid Evaluation of Cell Temperature Temporal Evolution. IEEE Trans. Ind. Electron. 2017, 64, 998–1008. [Google Scholar] [CrossRef]
  22. Ruan, H.; Jiang, J.; Ju, Q.; Sun, B.; Cheng, G. A Reduced Wide-temperature-range Electro-thermal Model and Thermal Parameters Determination for Lithium-ion Batteries. Energy Procedia 2017, 105, 805–810. [Google Scholar] [CrossRef]
  23. Samad, N.A.; Siegel, J.B.; Stefanopoulou, A.G. Parameterization and Validation of a Distributed Coupled Electro-Thermal Model for Prismatic Cells. In Proceedings of the ASME 2014 Dynamic Systems and Control Conference, San Antonio, TX, USA, 22–24 October 2014; pp. 1–9. [Google Scholar]
  24. Perez, H.E.; Hu, X.; Dey, S.; Moura, S.J. Optimal Charging of Li-Ion Batteries with Coupled Electro-Thermal-Aging Dynamics. IEEE Trans. Veh. Technol. 2017, 66, 7761–7770. [Google Scholar] [CrossRef]
  25. Gao, Y.; Jiang, J.; Zhang, C.; Zhang, W.; Ma, Z.; Jiang, Y. Lithium-ion battery aging mechanisms and life model under different charging stresses. J. Power Sources 2017, 356, 103–114. [Google Scholar] [CrossRef]
  26. Yang, X.G.; Leng, Y.; Zhang, G.; Ge, S.; Wang, C.Y. Modeling of lithium plating induced aging of lithium-ion batteries: Transition from linear to nonlinear aging. J. Power Sources 2017, 360, 28–40. [Google Scholar] [CrossRef]
  27. Purewal, J.; Wang, J.; Graetz, J.; Soukiazian, S.; Tataria, H.; Verbrugge, M.W. Degradation of lithium ion batteries employing graphite negatives and nickel-cobalt-manganese oxide + spinel manganese oxide positives: Part 2, chemical-mechanical degradation model. J. Power Sources 2014, 272, 1154–1161. [Google Scholar] [CrossRef]
  28. De Hoog, J.; Timmermans, J.M.; Ioan-Stroe, D.; Swierczynski, M.; Jaguemont, J.; Goutam, S.; Omar, N.; Van Mierlo, J.; Van Den Bossche, P. Combined cycling and calendar capacity fade modeling of a Nickel-Manganese-Cobalt Oxide Cell with real-life profile validation. Appl. Energy 2017, 200, 47–61. [Google Scholar] [CrossRef]
  29. Hoke, A.; Brissette, A.; Smith, K.; Pratt, A.; Maksimovic, D. Accounting for lithium-ion battery degradation in electric vehicle charging optimization. IEEE J. Emerg. Sel. Top. Power Electron. 2014, 2, 691–700. [Google Scholar] [CrossRef]
  30. Liu, S.; Xiong, L.; He, C. Long cycle life lithium ion battery with lithium nickel cobalt manganese oxide (NCM) cathode. J. Power Sources 2014, 261, 285–291. [Google Scholar] [CrossRef]
  31. Eddahech, A.; Briat, O.; Vinassa, J.M. Performance comparison of four lithium-ion battery technologies under calendar aging. Energy 2015, 84, 542–550. [Google Scholar] [CrossRef]
  32. Jalkanen, K.; Karppinen, J.; Skogström, L.; Laurila, T.; Nisula, M.; Vuorilehto, K. Cycle aging of commercial NMC/graphite pouch cells at different temperatures. Appl. Energy 2015, 154, 160–172. [Google Scholar] [CrossRef]
  33. Schuster, E.; Ziebert, C.; Melcher, A.; Rohde, M.; Seifert, H.J. Thermal behavior and electrochemical heat generation in a commercial 40 Ah lithium ion pouch cell. J. Power Sources 2015, 286, 580–589. [Google Scholar] [CrossRef]
  34. Waag, W.; Käbitz, S.; Sauer, D.U. Experimental investigation of the lithium-ion battery impedance characteristic at various conditions and aging states and its influence on the application. Appl. Energy 2013, 102, 885–897. [Google Scholar] [CrossRef]
  35. Goutam, S.; Timmermans, J.M.; Omar, N.; Bossche, P.V.D.; Mierlo, J.V.; Rodriguez, L.; Nieto, N.; Swierczynski, M. Surface temperature evolution and the location of maximum and average surface temperature of a lithium-ion pouch cell under variable load profiles. In Proceedings of the EEVC European Electric Vehicle Congress EEVC-2014, Brussels, Belgium, 3–5 December 2014; pp. 1–7. [Google Scholar]
  36. Guo, M.; White, R.E. A distributed thermal model for a Li-ion electrode plate pair. J. Power Sources 2013, 221, 334–344. [Google Scholar] [CrossRef]
  37. Daowd, M.; Omar, N.; Verbrugge, B.; Bossche, P.V.D.; Mierlo, J.V. Battery Models Parameter Estimation based on Matlab/Simulink®. In Proceedings of the 25th Electric Vehicle Symposium (EVS-25), Shenzhen, China, 5–9 November 2010; Volume 2. [Google Scholar]
  38. The International Electrotechnical Commission (IEC). IEC 62660-1: Secondary Lithium-Ion Cells for the Propulsion of Electric Road Vehicles–Part 1: Performance Testing; IEC: Geneva, Switzerland, 2010; pp. 1–37. [Google Scholar]
  39. Huria, T.; Ceraolo, M.; Gazzarri, J.; Jackey, R. High Fidelity Electrical Model with Thermal Dependence for Characterization and Simulation of High Power Lithium Battery Cells. In Proceedings of the 2012 IEEE International Electric Vehicle Conference (IEVC), Greenville, SC, USA, 4–8 March 2012; pp. 1–8. [Google Scholar]
  40. Petzl, M.; Danzer, M.A. Advancements in OCV Measurement and Analysis for Lithium-Ion Batteries. IEEE Trans. Energy Convers. 2013, 28, 675–681. [Google Scholar] [CrossRef]
  41. Jaguemont, J.; Nikolian, A.; Omar, N.; Bossche, P.V.D.; Mierlo, J.V. Development of a 2D-thermal model of three battery chemistries considering entropy. IEEE Trans. Energy Convers. 2017, 8969, 1–9. [Google Scholar]
  42. Jaguemont, J.; Omar, N.; Abdel-Monem, M.; Van den Bossche, P.; Van Mierlo, J. Fast-charging investigation on high-power and high-energy density pouch cells with 3D-thermal model development. Appl. Therm. Eng. 2018, 128, 1282–1296. [Google Scholar] [CrossRef]
  43. Nikolian, A.; Omar, N.; Bossche, P.V.D.; Mierlo, J.V. Lithium Ion Batteries—Development of Advanced Electrical Equivalent Circuit Models for Nickel Manganese Cobalt Lithium-Ion. Energies 2016, 9, 360. [Google Scholar] [CrossRef]
  44. Samba, A.; Omar, N.; Gualous, H.; Van den Bossche, P.; Van Mierlo, J.; Boubekeur, T.I. Development of 2D thermal battery model for Lithium-ion pouch cells. World Electr. Veh. J. 2013, 6, 629–637. [Google Scholar]
  45. Nikolian, A.; Hoog, J.D.; Fleurbay, K.; Timmermans, J.M.; Bossche, P.V.D.; Mierlo, J.V. Classification of Electric modelling and Characterization methods of Lithium-ion Batteries for Vehicle Applications. In Proceedings of the European Electric Vehicle Congress, Brussels, Belgium, 3–5 December 2014; pp. 1–15. [Google Scholar]
  46. Bernardi, D. A General Energy Balance for Battery Systems. J. Electrochem. Soc. 1985, 132, 5. [Google Scholar] [CrossRef]
  47. Bergmann, T.L.; Lavine, A.S.; Incropera, F.P.; Dewitt, P.D. Fundamentals of Heat and Mass Transfer; John Wiley & Sons: Hoboken, NJ, USA, 2007; p. 997. [Google Scholar]
  48. Schmalstieg, J.; Käbitz, S.; Ecker, M.; Sauer, D.U. A holistic aging model for Li(NiMnCo)O2 based 18650 lithium-ion batteries. J. Power Sources 2014, 257, 325–334. [Google Scholar] [CrossRef]
  49. Rychilik, I. A new definition of the rain-flow counting. Int. J. Fatigue 1987, 9, 119–121. [Google Scholar] [CrossRef]
  50. Goutam, S.; Timmermans, J.M.; Omar, N.; Van den Bossche, P.; Van Mierlo, J. Comparative study of surface temperature behavior of commercial li-ion pouch cells of different chemistries and capacities by infrared thermography. Energies 2015, 8, 8175–8192. [Google Scholar] [CrossRef]
  51. Maleki, H.; Wang, H.; Porter, W.; Hallmark, J. Li-Ion polymer cells thermal property changes as a function of cycle-life. J. Power Sources 2014, 263, 223–230. [Google Scholar] [CrossRef]
Figure 1. Picture of the nickel manganese cobalt oxide (NMC) cell, lying on a sheet of A4 paper.
Energies 11 00804 g001
Figure 2. (a) Fast-charging profiles, where Case 1 shows a constant current–constant voltage (CC–CV) profile, and Case 2 shows a constant current with negative pulse–constant voltage (CCNP–CV) profile; (b) Charging protocol flowchart [42].
Energies 11 00804 g002
Figure 3. Simple representation of the NMC cell with dimensions in m.
Energies 11 00804 g003
Figure 4. Schematic of the second-order Thévenin model [45].
Energies 11 00804 g004
Figure 5. The 45 °C extrapolation result.
Energies 11 00804 g005
Figure 6. Applied CCNP profiles and voltage response of the NMC/C cells.
Energies 11 00804 g006
Figure 7. (left) Three-dimensional thermal image validation with 3D simulations; (right) one-dimensional validation measurements vs. simulations.
Energies 11 00804 g007
Figure 8. Graph of the temperature evolutions for all aging states as well as the CCNP–CV profile used in the study.
Energies 11 00804 g008
Figure 9. Evolution of the internal resistance with aging.
Energies 11 00804 g009
Table 1. Characteristic properties of the NMC cell. DoD: depth of discharge.
PropertiesNMC
Mechanical
Length of the cell (mm)217
Width of the cell (mm)130
Thickness of the cell (mm)7.1
Weight of the cell (g)428
Length of the tabs (mm)40
Width of the tabs (mm)30
Electrical
Nominal voltage (V)3.65
Nominal capacity (Ah)20
End-of-charge voltage (V)4.2
End-of-discharge voltage (V)3
AC impedance (1 KHz) (mOhm)3
Specific energy (Wh kg 1 )174
Energy density (Wh L 1 )370
Specific power (DoD 50%, 10 s) (W kg 1 )2300
Power density (DoD 50%, 10 S) (W L 1 )4600
Recommended charge current (A)10
Maximum discharge current (A)100
Table 2. General overview of the cycling test matrix. SoC: state of charge, T: Temperature.
T/°CC-RateDoD –>1005020
DischargeChargeMid SoC –>505050
100.50.5 222
10.5 422
20.5 222
30.5 222
13 2
250.50.5 222
10.5 522
20.5 222
30.5 222
4510.5 422
Table 3. Calendar aging test matrix with number of cells.
T (°C)Storage SoC (%)
1008065503520
25 3 3
35333333
45 3 3

