Article

Evaluation of Excess Heat Utilization in District Heating Systems by Implementing Levelized Cost of Excess Heat

Faculty of Mechanical Engineering and Naval Architecture, Department of Energy, Power and Environmental Engineering, University of Zagreb, Ivana Lučića 5, 10002 Zagreb, Croatia
*
Author to whom correspondence should be addressed.
Energies 2018, 11(3), 575; https://doi.org/10.3390/en11030575
Submission received: 16 February 2018 / Revised: 1 March 2018 / Accepted: 5 March 2018 / Published: 7 March 2018

Abstract

:
District heating plays a key role in achieving high primary energy savings and the reduction of the overall environmental impact of the energy sector. This was recently recognized by the European Commission, which emphasizes the importance of these systems, especially when integrated with renewable energy sources, like solar, biomass, geothermal, etc. On the other hand, high amounts of heat are currently being wasted in the industry sector, which causes low energy efficiency of these processes. This excess heat can be utilized and transported to the final customer by a distribution network. The main goal of this research was to calculate the potential for excess heat utilization in district heating systems by implementing the levelized cost of excess heat method. Additionally, this paper proves the economic and environmental benefits of switching from individual heating solutions to a district heating system. This was done by using the QGIS software. The variation of different relevant parameters was taken into account in the sensitivity analysis. Therefore, the final result was the determination of the maximum potential distance of the excess heat source from the demand, for different available heat supplies, costs of pipes, and excess heat prices.

1. Introduction

Security of energy supply and CO2 emissions reduction have been recognized by the EU as the key topics that will define the development of its energy systems. For that reason, the utilization of highly efficient cogeneration with district heating systems should increase significantly, since these systems can greatly increase energy efficiency and reduce the CO2 emissions of the energy sector. Currently, only 13% of the European heat supply is covered by district heating systems, which makes the potential for increasing this share significant, especially in urban areas which are characterised by high heat demand densities [1]. However, some northern countries, e.g., Sweden, already cover more than 50% of the residential and service sector heat demand with district heating [2], showing the way for the rest of the Europe. An analysis was conducted in Denmark as a case study, which examined the role of district heating systems in future renewable energy systems [3]. The primary conclusion was that the expansion of district heating to up to 70% of Danish net heat demand would be optimal. However, this could be limited by the uneven framework as shown in [4]. The expansion would result in significant fuel savings, reduction of CO2 emissions, reduction of costs, as well as in better utilization of excess heat. Similarly, from the perspective of the consumers, the most important reasons for connecting to district heating are affordability, increased comfort, and the favourable environmental impact [5]. Prosumers, i.e., consumers who are at the same time producers of heat, will also have an important role in future district heating systems, as shown in [6] for Finland. This will facilitate the integration of renewable energy sources with these systems. The environmental benefit of district heating, combined with the implementation of renewables in other sectors, was shown in [7], providing detailed decarbonization scenarios by 2050 for Italy. These future district heating systems will be classified as fourth-generation district heating systems. They will incorporate low distribution temperatures, use of renewable energy sources and excess heat, use of large scale heat pumps and thermal storage, integration of the heat and electricity sectors, etc. [8]. Integrated with information and communication technologies, they will represent sustainable smart district heating systems as a part of the smart cities of the future [9]. The use of renewable energy sources in particular lowers both the environmental impact and the heat production costs in comparison to conventional district heating systems, as shown in [10]. Furthermore, low supply and return temperatures lower the losses in the distribution network, which are currently one of the biggest problems of the existing old systems, especially in Eastern Europe. This was presented in a study [11], which provided a comparative analysis between two district heating systems in Croatia and Denmark. It showed that because of the advanced age and high distribution temperatures in the Croatian system, heat losses are approximately three times higher than in the Danish system. However, the prerequisite for low temperature networks is the availability of adequate low temperature sources and their economic conditions, as shown for four cases in Austria [12]. Another way of reducing heat losses is the refurbishment of distribution pipes. Grid losses significantly influence the overall performance of district heating, as shown by data from several systems in Italy [13]. For that purpose, different designs of pipes can be considered, including twin pipes, asymmetrical insulation of twin pipes, double pipes, and triple pipes, which provide potential for energy savings [14]. Furthermore, an increase of insulation standards on pipes also facilitates heat savings. It was shown that the costs are still too high to implement the highest available standard, although it is expected to be feasible in the near future [15].
An interesting heat source for district heating systems is the excess heat from industrial facilities. A significant amount of energy used in industry is currently being wasted, as shown in the case of China, where these losses amount to at least 50% [16]. Moreover, research has shown that there is enough excess heat in the EU to cover the heat demands of all buildings from the service sector and households [17]. Furthermore, an analysis of these sources has been made for the EU-27 [18]. The main conclusion of this research is that the potential for implementation of excess heat in district heating systems is significant, but it is currently not being used. Similar studies have been carried out for various excess heat sources concerning different frameworks, for example analyses of excess heat utilization from thermal power plants in the EU-28 [19], industrial excess heat utilization in China [20], excess heat utilization from the petrochemical industry on the west coast of Sweden [21], and excess heat utilization in Japan [22]. Based on the methods from [18], authors in [23] made an analysis of various excess heat sources in Denmark. The focus was on their utilization in district heating systems, using heat pumps in order to increase the temperature level. Their results showed that these sources are often located far from potential consumers, i.e., heat demands, and therefore further research is required in this area. A similar conclusion was drawn in [24], where authors analyzed the potential for excess heat utilization in district heating systems in Great Britain. It is concluded that in the case of remote locations of these sources, it is not economically viable to utilize them in a district heating network. Some researchers are trying to tackle this problem. For example, the use of mobile heat storage units is proposed in [25]. These units are charged at the site of excess heat sources, transported by a train or a truck to the location of heat demand, and then discharged. Another concept that is being researched is the novel heat allocator concept, which is a combination of a heat engine, a heat exchanger, and a heat pump [26].
A number of studies regarding the economics of excess heat utilization in district heating have already been performed, showing its benefits. This was the focus of [27], where authors provided a system analysis of this source for a case in Sweden. The study implemented a model for minimizing system costs, and it was shown that excess heat is a feasible solution in all the investigated energy market scenarios. Similarly, other research [28] highlighted the economic and environmental advantages of utilizing excess heat in district heating, which also significantly increased the production of jointly operated cogeneration units. Moreover, the optimal contribution of excess heat from industrial facilities has been studied in [29], where the authors developed a method for determining the investment costs of its utilization from a cluster of industrial facilities. The impact of excess heat utilization in a district heating system on CO2 emissions and the energy system as a whole has been studied for a region in Sweden [30]. The research showed that introducing excess heat into the energy system would reduce the use of fossil fuels and therefore the environmental impact of the energy system, although this is highly case-dependent.
A good criterion for the economic evaluation of energy production technologies is the levelized cost of energy, which takes into account all the cashflows during the lifetime of a plant. Numerous research studies have already been carried out by implementing the levelized cost of electricity calculations. Recently, it has been used in [31] and supplemented by including uncertainty and endogeneities in input parameters for analyzing the economic feasibility of gas and nuclear power plants, showing much higher feasibility for gas power plants. Furthermore, in [32] it has been used to analyze the feasibility of a solar chimney power plant, proving its competitiveness against other renewable power production technologies. However, a significantly smaller amount of research has been carried out in the heat sector by implementing the levelized cost of heat method, with most papers focusing on the calculation of the total costs, as shown for a building in [33]. The levelized cost of heat has been used for example in [34] for determining the feasible level of heat savings and heat production on the European level, in [35] for the Fresnel solar system, and in [36] for co-firing solid, liquid, and gaseous fuel in a heat-only boiler, but none of these papers include excess heat in the analyses. One of the main parameters in the calculation of the levelized cost of excess heat will be the procurement cost of excess heat, which has been analyzed in [37] for excess heat from data centers, while taking into account a scenario with the possibility of a heat market. The potential for heat market implementation, i.e., third-party access, has also been discussed in [38], giving some basic comments on its benefits for excess heat utilization in district heating systems.
This paper presents the continuation of the research conducted in [39], which provided the analysis of excess heat utilization in a district heating system in a small rural city. The concept proved to be feasible; however, the analysis considered only the potentially available excess heat supply, and no other parameters were taken into account. Therefore, this research has been expanded as described in the next few lines. In this paper, heat demand mapping has been utilized in order to provide the analysis of the feasibility of a natural gas district heating implementation for a small city. This way, both the environmental and economic advantages of this system over individual heating solutions are demonstrated. The analysis further includes potential excess heat utilization, taking into account its distance from the heat demand. The novelty of this study is the utilization of the levelized cost of excess heat method. The method is validated by performing a case study for the city of Ozalj, a small city in Croatia.

2. Materials and Methods

The method consists of two main steps: heat demand mapping and feasibility analysis by implementing the novel levelized cost of excess heat method. In the next sections, a more detailed description of the aforementioned steps will be provided.

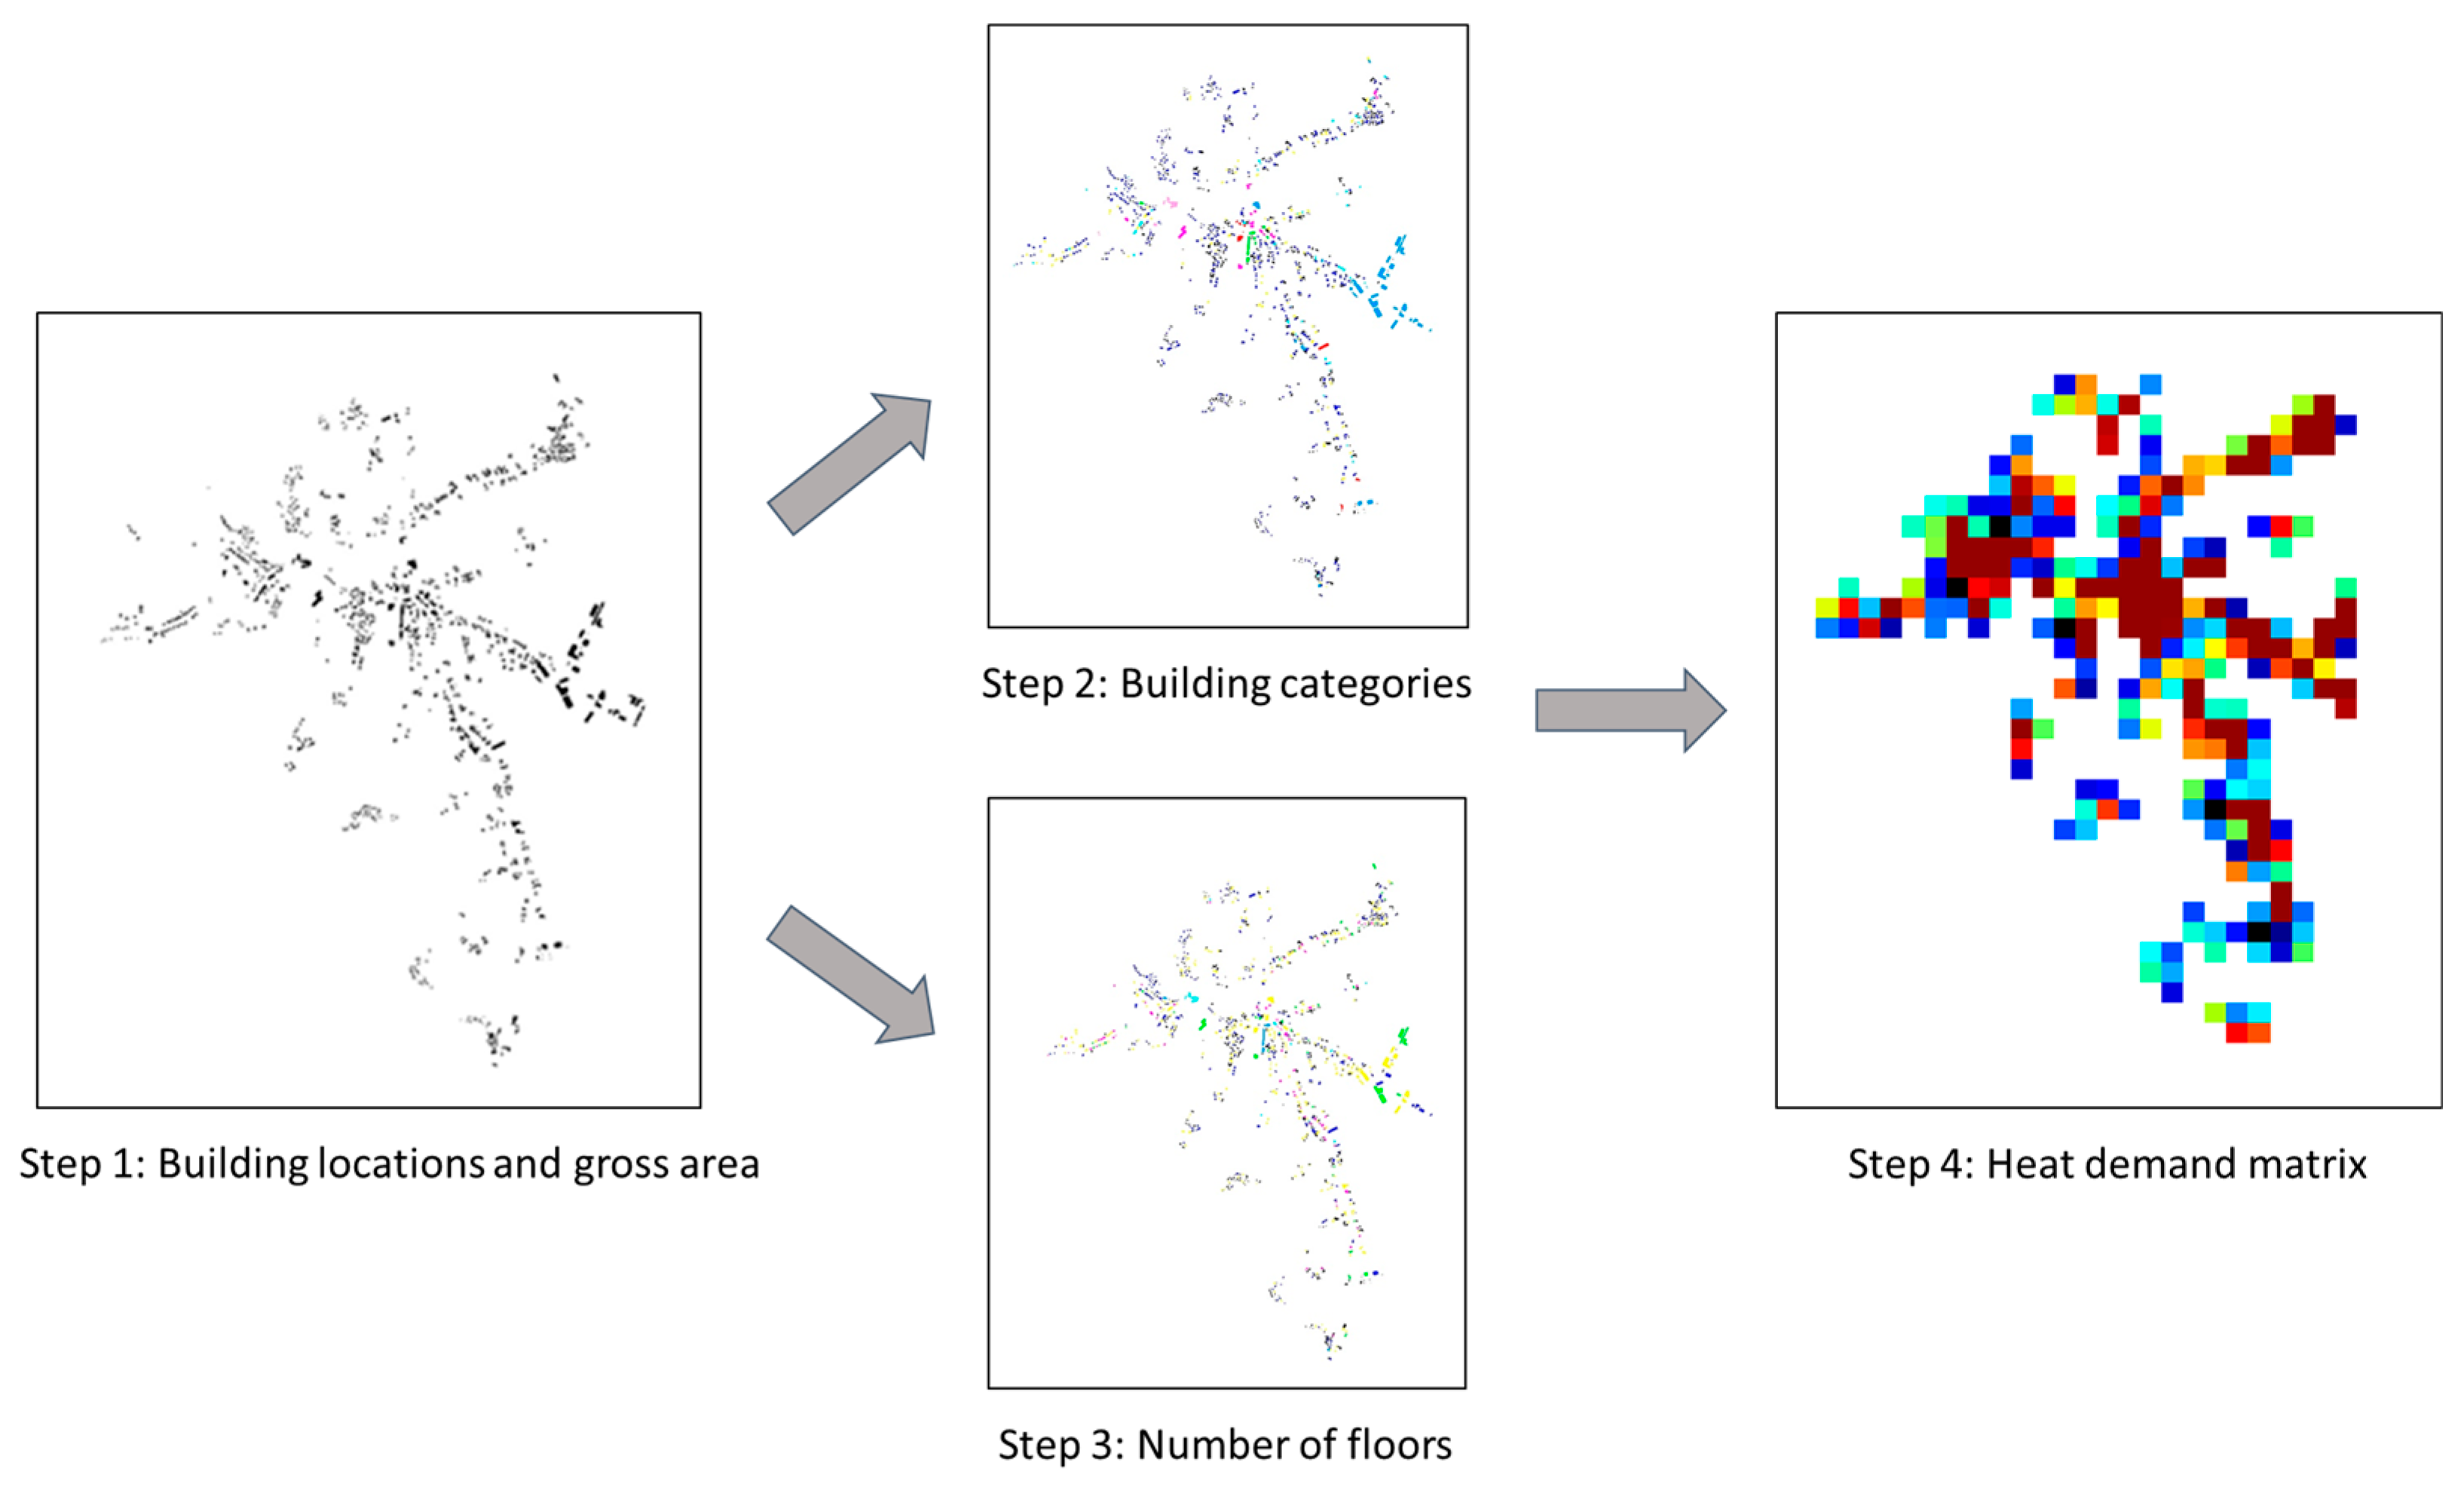
2.1. Heat Demand Mapping

In order to assess the heat demand of the city of Ozalj and therefore provide the input for the scenario analysis, heat demand mapping was performed. A similar geographic information system analysis has already been done in [40], providing the potential for district heating expansion. However, mapping is not the focus of this paper but only provides the required input for further analysis. For that purpose, Matlab [41] and QGIS [42] software were used. The data used in the process of mapping were mostly public in order to facilitate the replication of the method. The method was also complemented with the results from a survey carried out in Ozalj [43]. The questionnaire was developed as a part of the CoolHeating project [44], and the questions were specifically designed to collect good quality data from the citizens, in order to assess their heating needs and gather ideas, suggestions, and doubts for connecting to a district heating system. In order to get more precise energy consumption patterns, information was gathered both on the building stock (i.e., age of buildings, type of windows, insulation, net heating area, heating system, etc.) and on the annual fuel consumption. On the basis of this information, the heat demand of each surveyed household was calculated.
In order to better utilize these data for further analysis, the buildings were divided into eight categories with associated specific heat demands. The categories were determined by visually inspecting surveyed buildings and aggregating data from similar buildings into a specific category. This method is suited for smaller municipalities and can provide very detailed and more accurate heat demand maps, both on the building and on the aggregated level. However, when analyzing heat demands of larger areas, this method would not be appropriate since it would require too much time to carry out the survey. Specific heat demands for eight categories of buildings in the city of Ozalj are shown in Table 1. It has to be pointed out that the values for office building, public building, industry, and historic building have been taken from the city’s Sustainable Energy Action Plan [45] because of the insufficient data for these categories. Specific heat demands of some categories deviate significantly from the mean values, as shown in Table 1. This is specifically the case for a house without insulation, since this category includes all the houses without any insulation on the outer walls. Therefore, the heat losses are the highest in this category. The survey was carried out in 391 households, which represents a share of 17% of the overall number of households in Ozalj. The results from Table 1 clearly show the status of energy consumption of building stock in the continental part of Croatia. These can also be applied to the whole region of southeastern Europe, because of the similar characteristics in this sector. Such high heat demands are the result of the relatively old age of buildings and low rates of refurbishment, with more than 50% of the surveyed households having no outer wall and roof insulation at all.
The heat demand mapping conducted for this research consisted of four main steps. These can be divided as follows:
  • The first step was to create a matrix in Matlab that contained information on the total gross area and locations of buildings from the Croatian online building census Geoportal [46].
  • In the second stage, the buildings were classified into eight categories according to their purpose and condition, in order to allocate their specific heat demands.
  • At the same time, data on the number of floors were collected by visually inspecting all the households in the analyzed area. This could be done by using free online tools like Google Earth, etc. Both the categories and the number of floors were added to the initial matrix by color coding.
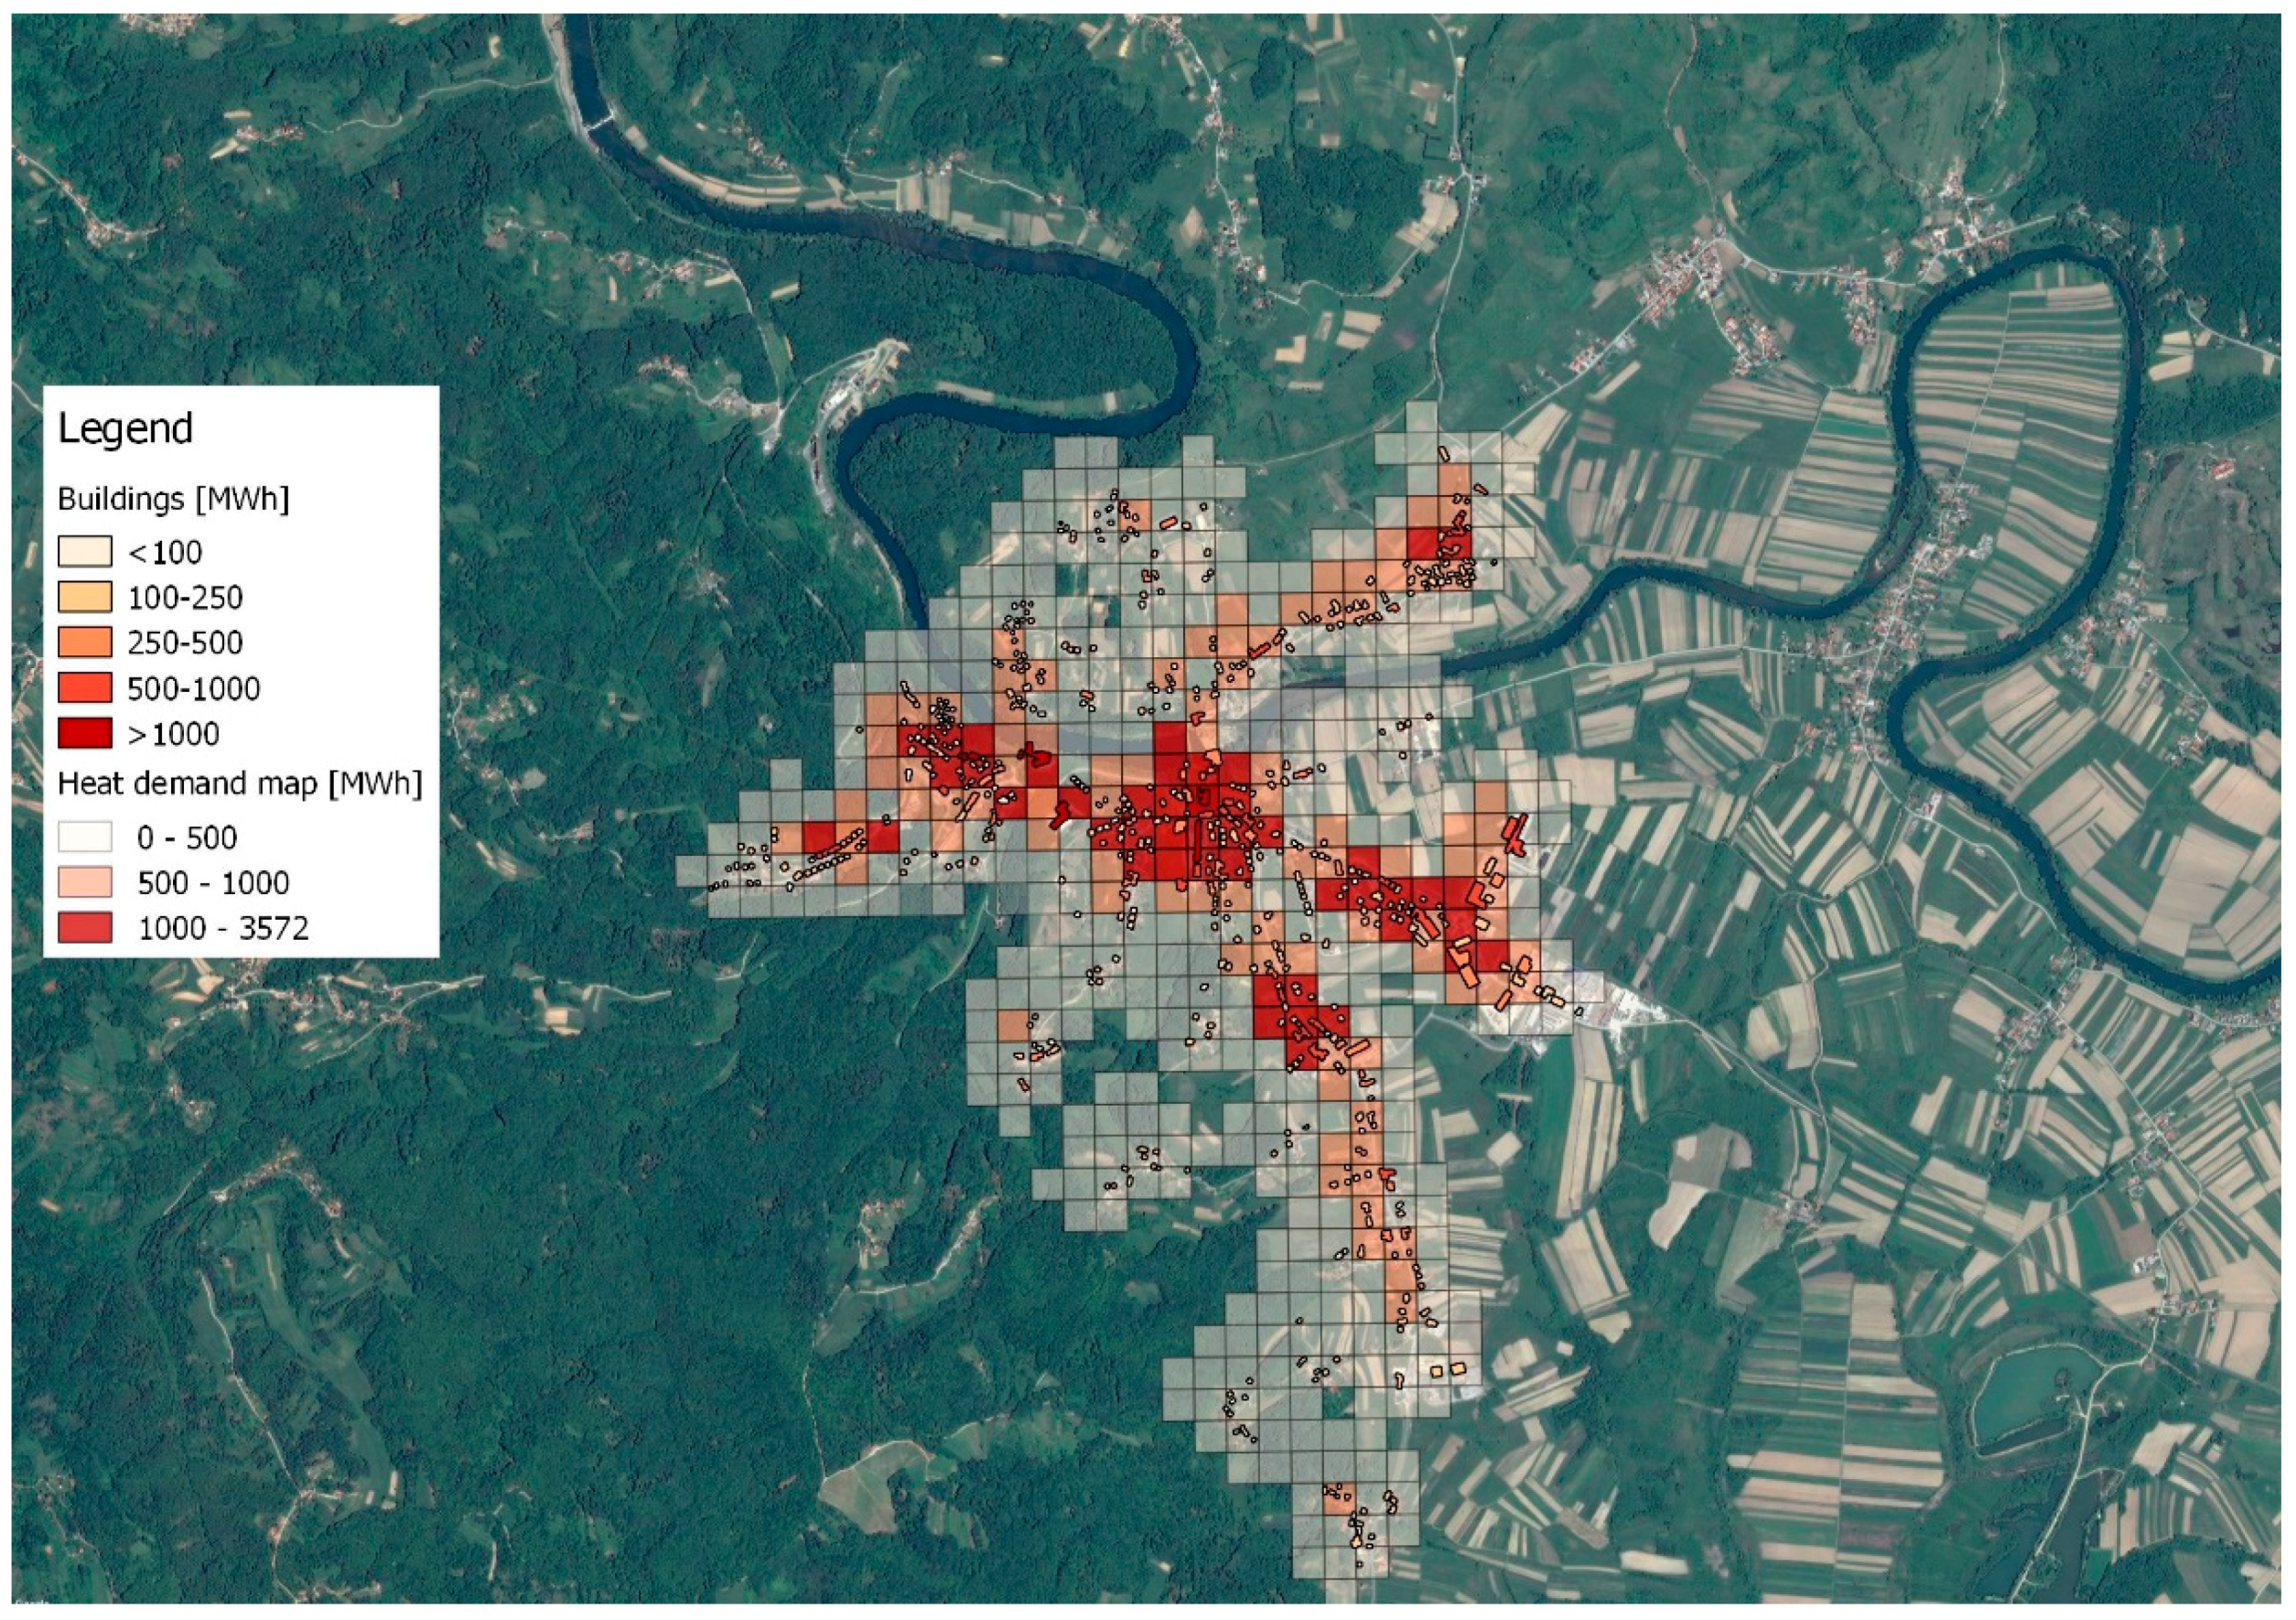
  • Afterwards, the final heat demand matrix was created by multiplying the total gross areas of the buildings with the associated specific heat demands. This final matrix was then transferred into a geographic information system interface using the QGIS tool.
The main steps are presented graphically in Figure 1, which gives an overview of the building locations map, category map, number of floors map, and, finally, the heat demand map on the 100 × 100 m level for the selected location. The final step, i.e., the GIS map is presented in the results section.

2.2. Scenario Analysis

In order to determine the feasibility and the environmental impact of district heating system implementation in a small rural city, different scenarios were developed. Microsoft Excel and QGIS software were used for the calculations. First, the implementation of a natural gas district heating system was analyzed in order to point out the advantages of such a system over individual heating solutions. The effect of excess heat utilization on the system costs was also researched by implementing the levelized cost of excess heat method, as described in more detail in the following paragraphs. Finally, a sensitivity analysis was implemented, taking into account various relevant parameters.

2.2.1. Implementation of a Natural Gas District Heating System

Feasibility calculations of the proposed scenarios were done on the level of aggregated 100 × 100 m heat demand areas. Furthermore, by using the cost data from [47], the levelized cost of heat was calculated for a potential natural gas district heating system, as shown in (1):
LCOH = I c · C R F · ( 1 T D p v ) 8760 · i · ( 1 T ) + O t o t a l 8760 · i + c f u e l    [ / kWh ]
where I c is the capital cost of the production facility [€/kW], C R F is the capital recovery factor which discounts the investment, T is the tax rate, D p v is the present value of depreciation taken from [48], i is the capacity factor of the production facility, O t o t a l are the total operation and maintenance costs [€/kW], and c f u e l is the cost of the fuel being used [€/kWh].
Besides the heat production facility, the distribution network has also to be taken into account when calculating the feasibility of district heating implementation. The average specific network length could be calculated by dividing the total length of roads by the number of 100 × 100 m areas in the analyzed location. This could be used to calculate the cost of the district heating network installation in every 100 × 100 m area. The technical and cost data of the distribution network and the price of heat were taken from [49]. By integrating these data in the QGIS software (version 2.18.7) and using (2), the feasibility of the district heating system implementation was calculated for every 100 × 100 m heat demand area:
R = Q · c h Q · L C O H 10000 · l s · c p   [ ]
where R is the potential revenue for a district heating system in a single 100 × 100 m area [€], Q is the heat demand of a single 100 × 100 m area [kWh], c h is the price of heat [€/kWh], l s is the average specific distribution network length [m/m2], while c p is the cost of the distribution network installation [€/m].
The price of heat for the final consumers is a crucial parameter in this kind of analysis since it determines the revenues from the district heating system, thus having a major influence on the feasibility of the whole system. It is accounted for in (2). In Croatia, the heat price for the final consumer is defined by every individual district heating system operator. It is then approved by the Croatian Energy Regulatory Agency. Since the analyzed city of Ozalj currently only uses individual heating systems, the price of the heat was assumed to be the same as for the district heating system in the nearby city of Karlovac, i.e., 66.6 €/MWh. However, this price also includes the connection fee.
Areas where R > 0 are feasible for district heating implementation. The calculation in QGIS provided the map with highlighted parts of the city which can be connected to a district heating system. The outputs of this analysis included total heat demand, total area of households, and number of 100 × 100 m areas for which it would be feasible to implement a district heating system.
These data were further used to examine the environmental impact of a natural gas district heating system compared with the existing individual heating systems. The analysis is based on the CO2 emissions calculation, as well as local particulate matter (PM), CO, and NOx emissions calculations. The shares of different energy sources, which are currently used in the analyzed city, could be determined by using the data from the survey and the city’s Sustainable Energy Action Plan. In the current situation, around 40% of the final heat demand is supplied by individual logwood furnaces, and another 40% by individual fuel oil boilers. The results of the survey showed that these are mostly old and inefficient boilers, causing a high environmental impact on the local level. Taking into account the low efficiency of old boilers and the high efficiency of district heating boilers, the emissions were calculated by multiplying the demand for each fuel with the respective emission factors.

2.2.2. Integrating Excess Heat into the District Heating System

When compared to conventional individual heating solutions, district heating already has significant advantages, both from the economic and the ecological point of view. However, integrating excess heat into a district heating system can provide further benefits, since there are no fuel costs for this source, and the environmental impact is even lower because this heat would otherwise be wasted, and the emissions related to its production would be existent anyway. Therefore, in the second scenario, a part of heat production from natural gas district heating was substituted by excess heat in order to analyze its effect on the overall system. Industrial and other facilities with high amounts of excess heat are often located outside cities, far from the heat demand. Consequently, a significant part of the investment into excess heat utilization is the distribution network which needs to be built in order to transport the heat from the source to the existing demand. The other, less capital-intensive investment is the cost of heat exchangers. It is assumed in this analysis that the temperature level of the available excess heat source is high enough for direct utilization. However, these sources often have low temperatures, especially if the heat is from the service sector. In these cases, heat pumps are needed in order to increase the temperature level of the heat. Low-grade excess heat has a particularly high potential in low-temperature fourth-generation district heating systems and should not be neglected.
In this scenario, the levelized cost of heat method was modified in order to serve as a criterion for investment into the excess heat utilization equipment. As mentioned above, in many cases, these sources are located far from the heat demand, and therefore this scenario includes a calculation of the maximum feasible distance of the potential excess heat source, taking into account different quantities of the available excess heat in the area. This way, both the investment into the heat exchangers and the distribution network are included in the analysis. The modified levelized cost of excess heat was calculated by using (3):
LCOEH = I H E · C R F · ( 1 T D p v ) 8760 · i · ( 1 T ) + O H E , t o t a l 8760 · i + c e x c e s s   h e a t     [ / kWh ]
where I H E is the investment cost for the heat exchangers [€/kW], O H E , t o t a l are the operation and maintenance costs for the heat exchangers [€/kW], and c e x c e s s   h e a t is the cost of excess heat [€/kWh].
When calculating the levelized cost of excess heat, the cost for the installation of the distribution network is not included in the equation, since it is accounted for in Equation (4). This is done in order to calculate the maximum potential distance of the heat source from the demand, i.e., the extra revenue which can be used to finance the construction of the distribution network. Therefore, the investment and operation and maintenance costs in (3) only cover the heat exchangers, which are used to extract the excess heat from the source. The cost of excess heat includes the procurement costs, which are defined by the operator of the excess heat facility and agreed with the operator of a district heating system. Different values of excess heat price were analysed in the sensitivity analysis, as shown in Table 3.
Furthermore, the extra revenue was calculated for different values of available excess heat, by using (4). Then, this extra revenue was divided by the discounted cost of pipes in order to determine the maximum distance of the excess heat source from the heat demand:
R E H = E t o t a l · r h e a t ( E E H · L C O E H + E D H · L C O H ) l · n · c p i p e s       [ ]
where R E H is extra revenue, E t o t a l is the total heat demand of the area for which it would be feasible to establish a connection to a natural gas district heating system [kWh], r h e a t is the revenue from heat, i.e., the price of heat [€/kWh], E E H is the available excess heat [kWh], L C O E H is the levelized cost of excess heat [€/kWh], E D H is the remaining heat demand being covered by the natural gas-based production facility of the district heating system [kWh], L C O H is the levelized cost of heat for the natural gas district heating system [€/kWh], l is the average length of the distribution network in a 100 × 100 m area [m], n is the number of 100 × 100 m areas, and c p i p e s is the discounted cost of pipes [€/m].
Since numerous parameters affect the feasibility of excess heat utilization, a sensitivity analysis was made by changing the values of available excess heat, costs of pipes, and cost of excess heat.

3. Results

In this section, the main results of this paper, including heat demand mapping, feasibility analysis of switching from individual systems to natural gas district heating, and feasibility analysis of excess heat utilization in district heating systems, are presented and discussed.
The results of the first step, i.e., the heat demand mapping, can be seen in Figure 2. It shows that the areas with the highest heat demand densities are located around the city centre and the industrial zone, which is expected since most of the public and apartment buildings are situated in that part of the city. The final heat demand of the city amounts to 90.92 GWh. Apart from 100 × 100 m areas, the heat demand was mapped on the building level as well, therefore providing a more detailed insight into the current building stock of the city. This also showed the locations of the biggest heat consumers with the highest potential for connecting to a district heating system, thus providing important information in the planning process.
By using the heat demand data from the aggregated 100 × 100 m areas, the share of demand which could be feasibly covered by a district heating system was calculated. Then, all the remote areas were excluded from further analysis, as shown in Figure 3. This was done because the real pipe length in these cases would be much higher, since the average specific distribution network length used in the calculations did not include the distance between the feasible 100 × 100 m areas. However, the average specific distribution network length could be applied in the final selected area from Figure 3, since most of the 100 × 100 m areas are connected or very near each other. The main results of this analysis can be seen in Table 2. They show that it would be feasible to cover 83.3% of the existing heat demand in the city by a natural gas district heating system, providing households with an inexpensive and comfortable way of heating.
On the basis of these results, the potential for excess heat utilization in the analysed system was calculated, as described in the Methods section. The main outcome of this analysis was the maximum distance of the excess heat source from the demand for different excess heat prices and costs of pipes. The latter is an important parameter since it presents the highest investment for a system utilizing a remote excess heat source. This cost also includes digging and the laying of pipes. The different costs of pipes and the prices of excess heat used in the analysis are shown in Table 3. All the variations of these parameters were analysed in the sensitivity analysis and presented in a form of a graph.
The results of the analysis can be seen in Figure 4. This figure shows that the maximum feasible distance of the excess heat source from the heat demand rose with the amount of available excess heat, as expected. However, when the excess heat price was increased, the maximum potential distance of the source decreased. This was also the case with the increasing costs of pipes. Nevertheless, all the variations of the important parameters resulted in a feasible integration of excess heat in a natural gas district heating system. The results showed that the levelized cost of excess heat method can be used as an efficient way of analyzing the feasibility of excess heat utilization in district heating systems, therefore serving as a criterion for the investment into excess heat utilization equipment.
This shows the great potential of this source, but also its limitations regarding the location of the source and its distance to the heat demand. The maximum potential distance varies significantly with different values of the relevant parameters. Therefore, it changed from 23.11 km in the case of 40 GWh available excess heat supply, at the price of 1 €/MWh and pipe cost of 200 €/m, to 2.7 km in the case of 10 GWh available excess heat supply, at the price of 4 €/MWh and pipe cost of 800 €/m. This showed that in the cases in which there is a high availability of excess heat, this excess heat could be utilized from various locations outside the analyzed city and even from larger cities in its vicinity.
Finally, the district heating systems also provide significant environmental benefits due to the high efficiency of boilers and to the strict regulations regarding their pollutant emissions. The results of the CO2 emissions analysis support this hypothesis by providing the CO2 emissions savings achieved by switching from individual heating solutions to a natural gas district heating system, as shown in Figure 5. Even though the analysed district heating system uses natural gas as a fuel, its emissions were still lower than in the current situation, because of the aforementioned reasons. However, more significant benefits were achieved by reducing the PM, NOx, and CO emissions, which are currently substantial because of a high share of old and inefficient logwood boilers without a filtration system. These have a much higher local impact on the environment. Their values were calculated and are presented in Table 4. The highest reductions were achieved for PM emissions, which were almost completely eliminated by introducing a natural gas district heating system. Furthermore, NOx, and CO emissions were also substantially reduced, by 87% and 97%, respectively.
Additionally, when excess heat is integrated into the system, significantly higher CO2 emission savings can be achieved. Figure 5 shows that in the case of 40 GWh of excess heat supply, the CO2 emissions were around 50% of the emissions in the current situation. This is due to the fact that the emissions from the excess heat production facilities are already existent and are calculated in the industrial or service sectors, depending on the origin of excess heat. Therefore, the analysis included only the emissions from the part of the district heating system supplied by the natural gas boiler, significantly lowering the overall environmental impact of the system and the heating sector in general. This was also proven by analysing PM, NOx, and CO emissions for the case of natural gas district heating plus 40 GWh excess heat, where all the emissions were reduced by more than 93% in comparison to the current situation.

4. Discussion and Concluding Remarks

The idea for this paper was twofold. On the one hand, its purpose was to show the economic and environmental benefits of a district heating system implementation in a city which is currently using only individual heating solutions. On the other hand, the novel approach towards analyzing the feasibility of excess heat integration into a district heating system was proposed. The case study was the city of Ozalj, a small city with no existing district heating systems. The prerequisite step in the energy planning of district heating systems is the heat demand mapping of the focus area. This way, parts of the city in which it is feasible to implement a district heating system were determined. In this case, the final heat demand of an area which could be feasibly covered by a natural gas district heating system was 75,383 MWh. These results were then used for further analyses, taking into account the excess heat utilization in a natural gas district heating system.
First, the levelized cost of excess heat was calculated for this source, being significantly lower than for other heat production technologies because of its low investment costs and the lack of fuel costs. It has to be noted that the temperature level of the source was assumed to be high enough, and therefore no heat pumps were needed. Consequently, the only investment cost was for the heat exchangers. However, these sources are rarely located in the vicinity of the potential heat demand, and an investment into additional distribution pipes is necessary. In that case, these are the highest costs related to excess heat utilization. Therefore, by implementing the levelized cost of excess heat method, the maximum distance of the source from the heat demand was calculated, that way taking into account both the investment into heat exchangers and the distribution network. Three different parameters were varied in order to perform the sensitivity analysis: available excess heat supply, costs of pipes, and excess heat price. The maximum feasible distance of the excess heat source from the demand was 23.11 km in the case of 40 GWh available excess heat supply, at the price of 1 €/MWh and pipe cost of 200 €/m. On the other hand, the minimum feasible distance of the heat source from the demand was 2.7 km in the case of 10 GWh available excess heat supply, at the price of 4 €/MWh and pipe cost of 800 €/m. The results showed that excess heat is a feasible solution in all cases, but this is highly dependent on the available excess heat supply and on its distance from the heat demand. Furthermore, it can be concluded that the levelized cost of excess heat method can be used as a criterion for the investment into excess heat utilization equipment.
The final aspect analyzed in this paper was the environmental impact of a district heating system, in relation to individual heating systems. The analysis was conducted both for the CO2 emissions and the NOx, PM, and CO emissions, which have a higher influence on the local level. The analysis showed that a natural gas district heating system already has lower CO2 emissions than individual solutions. Further benefits are achieved as the result of significantly lower local NOx, PM, and CO emissions from highly efficient district heating boilers, while many individual biomass furnaces are old and do not have the necessary filtration system. Thus, reductions of more than 87% were achieved for all local emissions by switching to a natural gas district heating system. CO2 emissions were drastically reduced if excess heat was additionally introduced into the system. This heat is already being wasted, and the emissions from its production can be allocated to the industrial or service sectors, depending on its origin. Therefore, when being utilized in a district heating system, this heat does not contribute to the emissions of a heating sector. If 40 GWh of excess heat supply is available, the CO2 emissions of a district heating system are 50% lower than for individual heating solutions.

Acknowledgments

Financial support from the RESFLEX project funded by the Programme of the Government of Republic of Croatia for encouraging research and development activities in the area of Climate Change from 2015 to 2016, as well as support from the European Union’s Horizon2020 project CoolHeating (grant agreement 691679) are gratefully acknowledged.

Author Contributions

Borna Doračić performed data collection and all the analysis regarding the district heating implementation and excess heat integration. He also performed the analysis of the CO2 emissions for all the considered configurations. Tomislav Novosel performed the heat demand mapping in QGIS software. Tomislav Pukšec and Neven Duić supported and supervised these activities. All the authors contributed, read, and checked the paper.

Conflicts of Interest

The authors declare no conflict of interest.

References

  1. Connolly, D.; Lund, H.; Mathiesen, B.V.; Werner, S.; Möller, B.; Persson, U.; Boermans, T.; Trier, D.; Østergaard, P.A.; Nielsen, S. Heat roadmap Europe: Combining district heating with heat savings to decarbonise the EU energy system. Energy Policy 2014, 65, 475–489. [Google Scholar] [CrossRef]
  2. Werner, S. District heating and cooling in Sweden. Energy 2017, 126, 419–429. [Google Scholar] [CrossRef]
  3. Lund, H.; Möller, B.; Mathiesen, B.V.; Dyrelund, A. The role of district heating in future renewable energy systems. Energy 2010, 35, 1381–1390. [Google Scholar] [CrossRef]
  4. Grundahl, L.; Nielsen, S.; Lund, H.; Möller, B. Comparison of district heating expansion potential based on consumer-economy or socio-economy. Energy 2016, 115, 1771–1778. [Google Scholar] [CrossRef]
  5. Ahvenniemi, H.; Klobut, K. Future Services for District Heating Solutions in Residential Districts. J. Sustain. Dev. Energy Water Environ. Syst. 2014, 2, 127–138. [Google Scholar] [CrossRef]
  6. Paiho, S.; Reda, F. Towards next generation district heating in Finland. Renew. Sustain. Energy Rev. 2016, 65, 915–924. [Google Scholar] [CrossRef]
  7. Calise, F.; D’Accadia, M.D.; Barletta, C.; Battaglia, V.; Pfeifer, A.; Duic, N. Detailed Modelling of the Deep Decarbonisation Scenarios with Demand Response Technologies in the Heating and Cooling Sector: A Case Study for Italy. Energies 2017, 10, 1535. [Google Scholar] [CrossRef]
  8. Lund, H.; Werner, S.; Wiltshire, R.; Svendsen, S.; Thorsen, J.; Hvelplund, F.; Mathiesen, B.V. 4th Generation District Heating (4GDH). Energy 2014, 68, 1–11. [Google Scholar] [CrossRef]
  9. Sayegh, M.A.; Danielewicz, J.; Nannou, T.; Miniewicz, M.; Jadwiszczak, P.; Piekarska, K.; Jouhara, H. Trends of European research and development in district heating technologies. Renew. Sustain. Energy Rev. 2016, 68, 1183–1192. [Google Scholar] [CrossRef]
  10. Mikulandrić, R.; Krajačič, G.; Duić, N.; Khavin, G.; Lund, H.; Mathiesen, B.V. Performance Analysis of a Hybrid District Heating System: A Case Study of a Small Town in Croatia. J. Sustain. Dev. Energy Water Environ. Syst. 2015, 3, 282–302. [Google Scholar] [CrossRef]
  11. Čulig-Tokić, D.; Krajačić, G.; Doračić, B.; Mathiesen, B.V.; Krklec, R.; Larsen, J.M. Comparative analysis of the district heating systems of two towns in Croatia and Denmark. Energy 2015, 92, 435–443. [Google Scholar] [CrossRef]
  12. Basciotti, D.; Schmidt, R.R.; Meissner, E.; Doczekal, C.; Giovannini, A. Low temperature district heating in Austria: Energetic, ecologic and economic comparison of four case studies. Energy 2016, 110, 95–104. [Google Scholar]
  13. Noussan, M. Performance indicators of District Heating Systems in Italy—Insights from a data analysis. Appl. Therm. Eng. 2018, 134, 194–202. [Google Scholar] [CrossRef]
  14. Rosa, A.D.; Boulter, R.; Church, K.; Svendsen, S. District heating (DH) network design and operation toward a system-wide methodology for optimizing renewable energy solutions (SMORES) in Canada: A case study. Energy 2012, 45, 960–974. [Google Scholar] [CrossRef]
  15. Lund, R.; Mohammadi, S. Choice of insulation standard for pipe networks in 4th generation district heating systems. Appl. Therm. Eng. 2016, 98, 256–264. [Google Scholar] [CrossRef]
  16. Lian, H.K.; Li, Y.; Shu, G.Y.Z.; Gu, C.W. An overview of domestic technologies for waste heat utilization. Energy Conserv. Technol. 2011, 29, 123–128. [Google Scholar]
  17. Werner, S. Ecoheatcool: The European Heat Market. 2006. Available online: https://www.euroheat.org/wp-content/uploads/2016/02/Ecoheatcool_WP1_Web.pdf (accessed on 7 March 2018).
  18. Persson, U.; Möller, B.; Werner, S. Heat Roadmap Europe: Identifying strategic heat synergy regions. Energy Policy 2014, 74, 663–681. [Google Scholar] [CrossRef]
  19. Colmenar-santos, A.; Rosales-asensio, E.; Borge-diez, D.; Blanes-peiró, J. District heating and cogeneration in the EU-28: Current situation, potential and proposed energy strategy for its generalisation. Renew. Sustain. Energy Rev. 2016, 62, 621–639. [Google Scholar] [CrossRef]
  20. Fang, H.; Xia, J.; Zhu, K.; Su, Y.; Jiang, Y. Industrial waste heat utilization for low temperature district heating. Energy Policy 2013, 62, 236–246. [Google Scholar] [CrossRef]
  21. Morandin, M.; Hackl, R.; Harvey, S. Economic feasibility of district heating delivery from industrial excess heat: A case study of a Swedish petrochemical cluster. Energy 2014, 65, 209–220. [Google Scholar] [CrossRef]
  22. Dou, Y.; Togawa, T.; Dong, L.; Fujii, M.; Ohnishi, S.; Tanikawa, H.; Fujita, T. Innovative planning and evaluation system for district heating using waste heat considering spatial configuration: A case in Fukushima, Japan. Resour. Conserv. Recycl. 2018, 128, 406–416. [Google Scholar] [CrossRef]
  23. Lund, R.; Persson, U. Mapping of potential heat sources for heat pumps for district heating in Denmark. Energy 2016, 110, 129–138. [Google Scholar] [CrossRef]
  24. Cooper, S.J.G.; Hammond, G.; Norman, J. Potential for use of heat rejected from industry in district heating networks, GB perspective. J. Energy Inst. 2016, 1, 57–69. [Google Scholar] [CrossRef]
  25. Chiu, J.N.W.; Flores, J.C.; Martin, V.; Lacarriere, B. Industrial surplus heat transportation for use in district heating. Energy 2016, 110, 139–147. [Google Scholar] [CrossRef]
  26. Zhang, Y.; Zhang, Y.; Shi, W.; Wang, X. Application of concept of heat adaptor: Determining an ideal central heating system using industrial waste heat. Appl. Therm. Eng. 2016. [Google Scholar] [CrossRef]
  27. Viklund, S.B.; Karlsson, M. Industrial excess heat use: Systems analysis and CO2 emissions reduction. Appl. Energy 2015, 152, 189–197. [Google Scholar] [CrossRef]
  28. Weinberger, G.; Amiri, S.; Moshfegh, B. On the benefit of integration of a district heating system with industrial excess heat: An economic and environmental analysis. Appl. Energy 2017, 191, 454–468. [Google Scholar] [CrossRef]
  29. Eriksson, L.; Morandin, M.; Harvey, S. Targeting capital cost of excess heat collection systems in complex industrial sites for district heating applications. Energy 2015, 91, 465–478. [Google Scholar] [CrossRef]
  30. Ekvall, T.; Ahlgren, E.O.; Fakhri, A.; Martin, B. Modelling environmental and energy system impacts of large-scale excess heat utilisation e A regional case study. Energy 2015, 79, 68–79. [Google Scholar]
  31. Geissmann, T. A probabilistic approach to the computation of the levelized cost of electricity. Energy 2017, 124, 372–381. [Google Scholar] [CrossRef]
  32. Guo, P.; Zhai, Y.; Xu, X.; Li, Y. Assessment of levelized cost of electricity for a 10-MW solar chimney power plant in Yinchuan China. Energy Convers. Manag. 2017, 152, 176–185. [Google Scholar] [CrossRef]
  33. Picard, D.; Helsen, L. Economic Optimal HVAC Design for Hybrid GEOTABS Buildings and CO2 Emissions Analysis. Energies 2018, 11, 314. [Google Scholar] [CrossRef]
  34. Hansen, K.; Connolly, D.; Lund, H.; Drysdale, D.; Thellufsen, J.Z. Heat Roadmap Europe: Identifying the balance between saving heat and supplying heat. Energy 2016, 115, 1663–1671. [Google Scholar] [CrossRef]
  35. Gabbrielli, R.; Castrataro, P.; del Medico, F.; di Palo, M.; Lenyo, P. Levelized Cost of Heat for Linear Fresnel Concentrated Solar Systems. Energy Procedia 2014, 49, 1340–1349. [Google Scholar] [CrossRef]
  36. Fawzy, M.; Kazulis, V.; Veidenbergs, I.; Blumberga, D. Levelized cost of energy analysis of co-firing solid, liquid and gaseous fuel. Energy Procedia 2017, 128, 202–207. [Google Scholar] [CrossRef]
  37. Wahlroos, M.; Matti, P.; Manner, J.; Syri, S. Utilizing data center waste heat in district heating—Impacts on energy efficiency and prospects for low-temperature district heating networks. Energy 2017, 140, 1228–1238. [Google Scholar] [CrossRef]
  38. Broberg, S.; Backlund, S.; Karlsson, M.; Thollander, P. Industrial excess heat deliveries to Swedish district heating networks: Drop it like it’s hot. Energy Policy 2012, 51, 332–339. [Google Scholar] [CrossRef]
  39. Doračić, B.; Novosel, T.; Pukšec, T. Novel approach for the evaluation of excess heat utilization in small district heating systems. In Proceedings of the 12th Conference on Sustainable Development of Energy, Water and Environment Systems (SDEWES), Dubrovnik, Croatia, 4–8 October 2017. [Google Scholar]
  40. Wyrwa, A.; Chen, Y. Mapping Urban Heat Demand with the Use of GIS-Based Tools. Energies 2017, 10, 5. [Google Scholar]
  41. The MathWorks Inc. MATLAB; The MathWorks Inc.: Natick, MA, USA, 2016. [Google Scholar]
  42. QGIS. A Free and Open Source Geographic Information System. 2018. Available online: https://www.qgis.org/en/site/ (accessed on 7 March 2018).
  43. Pukšec, T.; Duić, N.; Sunko, R.; Mataradžija, M.; Fejzović, E.; Babić, A.; Gjorgievski, V.; Dimov, L.J.; Bozhikaliev, V.; Markovska, M.; et al. Survey on the Energy Consumption and Attitudes towards Renewable Heating and Cooling in the CoolHeating Target Communities. 2016. Available online: http://www.coolheating.eu/images/downloads/CoolHeating_Survey_3.4.pdf (accessed on 7 March 2018).
  44. Rutz, D.; Rutz, D.; Janssen, R.; Ugalde, J.M.; Hofmeister, M.; Sorensen, P.A.; Jensen, L.L.; Doczekal, C.; Zweiler, R.; Pukšec, T.; et al. Small, modular and renewable district heating & cooling grids for communities in South-Eastern Europe. Eur. Biomass Conf. Exhib. Proc. 2016, 2016, 1654–1659. [Google Scholar]
  45. Domac, J.; Kolega, V.; Djukić, S.; Horvat, I.; Lončar, I.; Maras, H.; Pržulj, I.; Šegon, V.; Cvijak, V. Akcijski Plan Energetski Održivog Razvitka Grada Ozlja. 2009. Available online: http://www.eko.zagreb.hr/UserDocsImages/dokumenti/seap-i%20hr%20gradova/SEAP_OZALJ_radna%20verzija_fin.pdf (accessed on 7 March 2018).
  46. Geoportal—Državna Geodetska Uprava. 2018. Available online: https://geoportal.dgu.hr/ (accessed on 7 March 2018).
  47. Technology Data for Energy Plants. 2012. Available online: https://energiatalgud.ee/img_auth.php/4/42/Energinet.dk._Technology_Data_for_Energy_Plants._2012.pdf (accessed on 7 March 2018).
  48. Levelized Cost Calculations. Available online: http://en.openei.org/apps/TCDB/levelized_cost_calculations.html (accessed on 5 March 2018).
  49. Doračić, B.; Pušić, T.; Novosel, T.; Pavičević, M.; Pukšec, T.; Duić, N. Techno-Economic Analysis of the Implementation of a Small Renewable District Heating System: Case Study for the City of Ozalj. In Proceedings of the 5th International Congress Mechanical Engineers Day, Amman, Jordan, 13–16 May 2017; pp. 27–32. [Google Scholar]
Figure 1. Graphical representation of the four main steps in the heat demand mapping method.
Energies 11 00575 g001
Figure 2. Heat demand map of the city of Ozalj, including the heat demands of each building.
Energies 11 00575 g002
Figure 3. Parts of the city for which it is feasible to establish a connection to a district heating system (orange) and final area selection used in further analyses (red).
Energies 11 00575 g003
Figure 4. Maximum distance of the excess heat source from the heat demand for different values of available excess supply, excess heat price, and costs of pipes.
Energies 11 00575 g004
Figure 5. Results of CO2 emission analysis for different cases.
Energies 11 00575 g005
Table 1. Building categories and associated specific heat demands.
CategoryNumber of Buildings Analyzed in the SurveySpecific Heat Demand (kWh/m2)Standard Deviation from the Mean Specific Heat Demand (159.2 kWh/m2)
Old house241177.7518.56
New house12112.5−46.69
House without insulation28262.5103.31
Apartment building21 apartments161.252.06
Office building-135−24.19
Public building-270110.81
Historic building-78.75−80.44
Industry-110−49.19
Table 2. Main results of the district heating implementation feasibility analysis.
Heat Demand (MWh)75,383.00
Gross household area (m2)357,674.00
Number of 100 × 100 m areas92
Table 3. Different excess heat prices, costs of pipes, and available excess heat supply used in the analysis of excess heat utilization.
Excess Heat Price [€/MWh]Cost of Distribution Pipes [€/m]Available Excess Heat Supply (GWh)
120010
240020
360030
480040
Table 4. NOx, PM, and CO emissions for different cases.
Current SituationNatural Gas District HeatingNatural Gas District Heating + 40 GWh Excess Heat
NOx emissions (kg/a)25,783.243292.071707.62
PM emissions (kg/a)1,331,938.6229.9315.52
CO emissions (kg/a)2,153,771.6570,013.0236,316.36

