LoRaWAN-Based Energy-Efficient Surveillance by Drones for Intelligent Transportation Systems
by
 , , , ,
Vishal Sharma
1 ,
,
Ilsun You
1,*,
Giovanni Pau
2 ,
,
Mario Collotta
2,
Jae Deok Lim
3 and
Jeong Nyeo Kim
3 1
Department of Information Security Engineering, Soonchunhyang University, Asan-si 31538, Korea
2
Faculty of Engineering and Architecture, Kore University of Enna, 94100 Enna, Italy
3
Electronics and Telecommunications Research Institute, Daejeon 34129, Korea
*
Author to whom correspondence should be addressed.
Energies 2018, 11(3), 573; https://doi.org/10.3390/en11030573
Submission received: 27 January 2018
/
Revised: 28 February 2018
/
Accepted: 1 March 2018
/
Published: 6 March 2018
(This article belongs to the Special Issue Smart Green Applications: from Renewable Energy Management to Intelligent Transportation Systems)
Abstract
:Urban networks aim at facilitating users for better experience and services through smart platforms such as the Intelligent Transportation System (ITS). ITS focuses on information acquisition, sensing, contrivance control, data processing and forwarding to ground devices via user-specific application-interfaces. The utility of ITS is further improved via the Internet of Things (IoT), which supports “Connectivity to All”. One of the key applications of IoT-ITS is urban surveillance. Current surveillance in IoT-ITS is performed via fixed infrastructure-based sensing applications which consume an excessive amount of energy leading to several overheads and failures in the network. Such issues can be overcome by the utilization of on-demand nodes, such as drones, etc. However, drones-assisted surveillance requires efficient communication setup as drones are battery operated and any extemporaneous maneuver during monitoring may result in loss of drone or complete failure of the network. The novelty in terms of network layout can be procured by the utilization of drones with LoRaWAN, which is the protocol designated for Low-Power Wide Area Networks (LPWAN). However, even this architectural novelty alone cannot ascertain the formation of fail-safe, highly resilient, low-overhead, and non-redundant network, which is additionally the problem considered in this paper. To resolve such problem, this paper uses drones as LoRaWAN gateway and proposes a communication strategy based on the area stress, resilient factor, and energy consumption that avail in the efficient localization, improved coverage and energy-efficient surveillance with lower overheads, lower redundancy, and almost zero-isolations. The proposed approach is numerically simulated and the results show that the proposed approach can conserve a maximum of 39.2% and a minimum of 12.6% of the total network energy along with an improvement in the area stress between 89.7% and 53.0% for varying number of drones over a fixed area.
1. Introduction
Intelligent Transportation System (ITS) includes strategies for traffic management, navigation, user-tracking and coordinated information processing for better services to the users [1,2]. ITS includes the coalescence of different technologies for achieving involute applications associated with wireless communication, image processing, audio-video monitoring, sensor and vehicular communications in an urban environment. Existing networks can be improved for performance by associating different devices as a transmitting and receiving component in ITS. Evolution of Internet of Things (IoT) has further improved the existing applications of ITS by connecting most of the devices with data-supporting servers [3,4,5]. ITS, in combination with IoT, can support Vehicle to Vehicle (V2V) as well as Vehicle to Infrastructure (V2I) connectivity through wireless connections [6]. ITS can be utilized for enhancing the user experience and incrementing the safety of transmissions via urban networking.
Apart from traffic localization, one of the paramount applications of IoT-ITS includes urban surveillance that includes the formation of safety system for citizens of a particular region as well as support for sharing current situations. Urban surveillance additionally fortifies tactical decisions in case of city-crimes or traffic infringements [7,8,9,10]. An efficient surveillance system through ITS can lead to a keenly intellective city which has a better facility and better quality of living through all time information processing and availability for communication. This all-time availability is enhanced by fetching information from all across the cities by utilizing a colossal set of sensors and transmitting processed data in the form of subsidiary information to the intended users through connected devices. Modern-day Geographical Positioning Systems (GPS), with traffic information, V2I and V2V communications, are one of the best examples of such scenarios.
Nowadays, urban surveillance in ITS has reached altogether to an incipient height by utilizing drones as a key component [11,12]. These drones are either flown by a human operator or autonomously for information accumulating through onboard sensors and mounted devices. Another major advantage of utilizing drones is their capability for on-demand data acquisition, processing, and transmission through Network Function Virtualization (NFV) and Software-Defined Networking (SDN) [13]. Apart from these, modern day networking has withal highlighted the utility of drones for the full-time availability of connectivity. Drone networking and its issues have been a key highlight for many researchers across the globe and different strategies have been proposed for their full functional deployment in the next generation of wireless networks or data acquisition over the sensor fields [13,14,15]. It is undoubted that drones can enhance the scalability of surveillance, but there are certain challenges that are to be tackled for their utilization, which includes issues cognate to path planning, deployment, task allocation, location identification, coverage and capacity modeling, trajectory optimization, flight time improvement, secure-transmissions, cyber-physical connectivity, reliable computing and cooperative network formations [16,17,18,19,20,21,22,23,24,25,26]. Solutions to these problems are a must while deploying drones in ITS for urban surveillance.
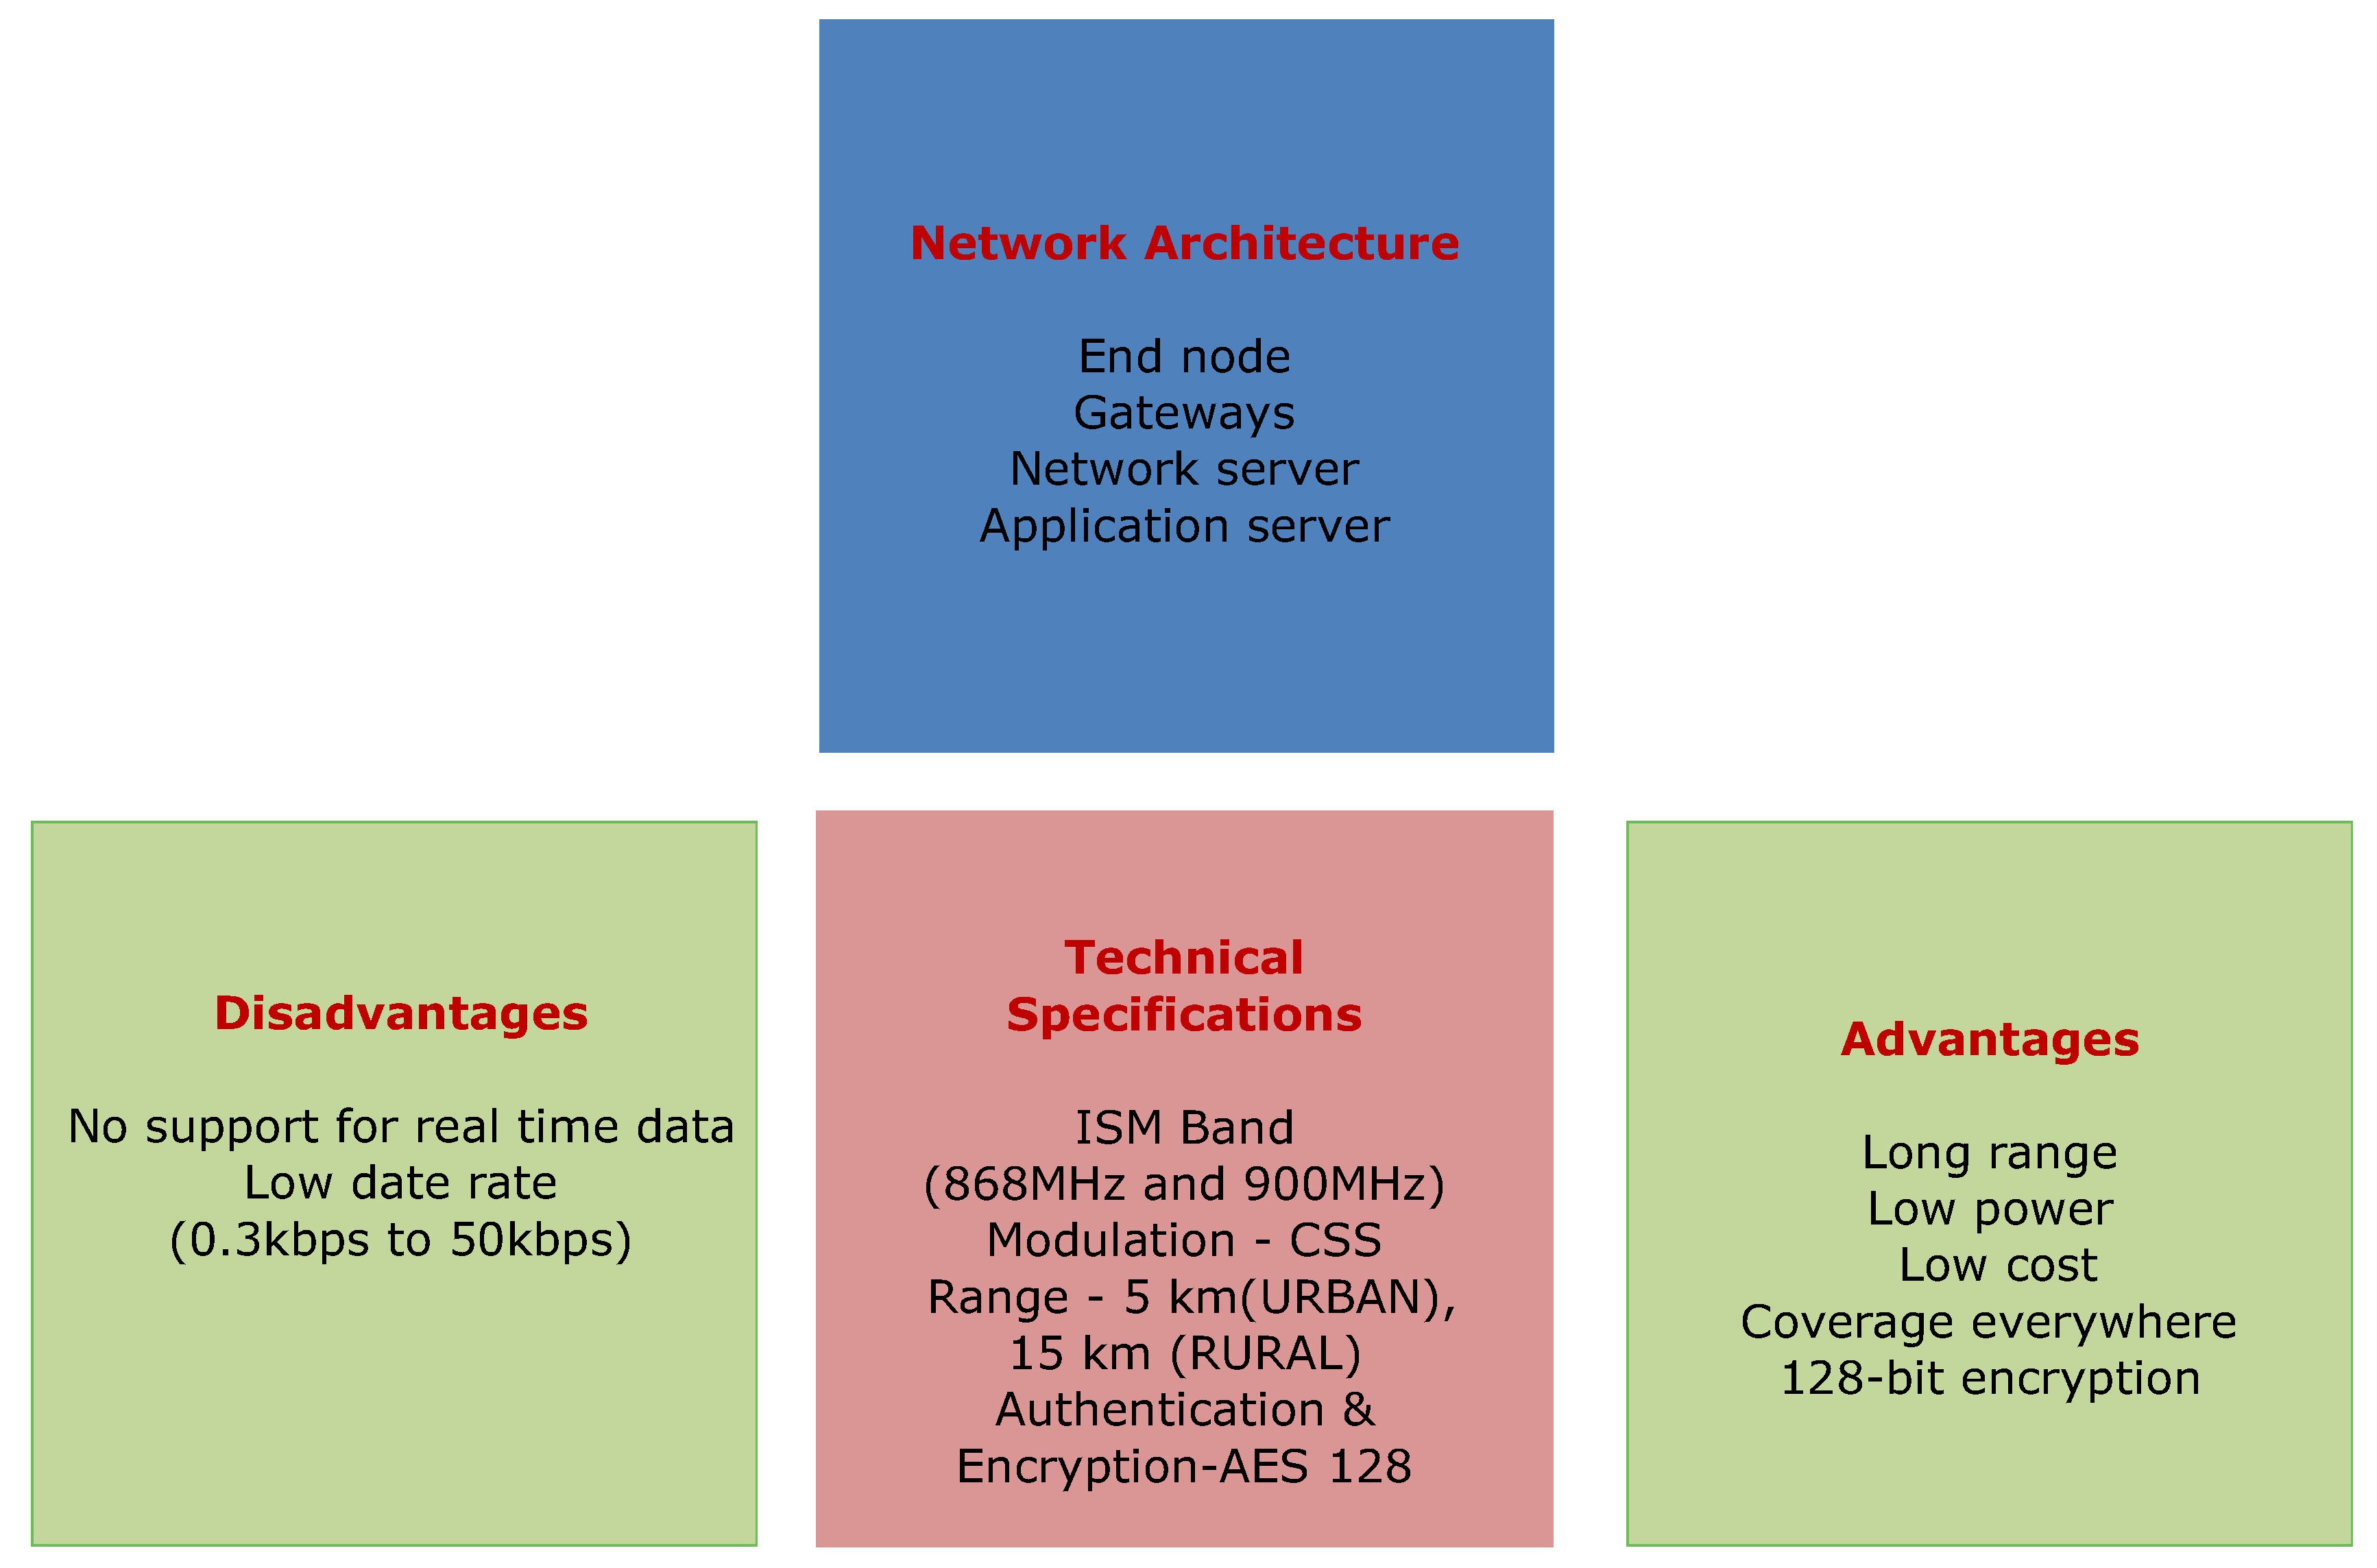
Along with the above-mentioned issues, urban-surveillance is much affected by the resources consumed by the participating entities of the network. The excess utilization of resources, such as energy, increases the operational cost of the network and decreases the lifetime of the system. Such a situation raises issues related to the failure, and lack of survivability and reliability of nodes during continuous network operations. Use of application-specific frameworks and software-oriented networks can help minimizing the wastage of resources through intelligent decision modeling [27,28,29,30]. However, these solutions can resolve issues at application level only and strategies are required for problem resolution at the system level. A solution that can consume lower energy and provide wide connectivity can resolve this issue. One such possibility can be the use of Low-Power Wide Area Networks (LPWAN) [31,32,33]. Networks operating with sensors or battery operated devices can take advantage of LPWAN module as it uses low-bit rate communication but to a large extent. This helps in transmitting information for longer duration and without much wastage of energy resources. While using IoT devices on LPWAN, LoRaWAN is developed as a protocol specifically for handling low-energy consuming transmissions [34,35]. LoRaWAN uses a novel ideology of network for bi-directional communication, mobility-management and localization services for IoT devices [36]. It provides a novel architecture for LPWAN implementation for long-range communications. It is capable of operating for a network over an ISM band (868 MHz and 900 MHz) and in the range of 5–15 km at data rates between 0.3 kbps and 50 kbps [37]. The bandwidth is specified separately for urban and rural scenarios as well as for the countries of operations. An overview of LoRaWAN specifications, its advantages, and disadvantages are presented in Figure 1 [38,39].
This paper demonstrates that LoRaWAN can be improvised for including drones as on-demand nodes to fortify energy efficient surveillance in ITS. Further, requisites such as fail-safe connectivity for battery-operated contrivances, high resilience, lower overheads, and lower resource utilization can be procured via LoRaWAN architecture. However, there are limited studies available at the moment, which have actually utilized LoRaWAN for designated application such as surveillance in urban scenarios. Thus, this paper, to the best of authors’ knowledge, is the first to exploit the features of LoRaWAN-based drones for energy efficient surveillance in urban-ITS.
1.1. Problem Statement
Currently, most of the ITS systems use V2V or V2I communication models for sharing data required to build information of the entire geographical area. This information is transmitted as ad hoc formations and uses on-demand algorithms for data-sharing between the involved entities. However, the prosperity of information depends on the number of sensors deployed in a geographical area and the regions with lesser sensors or conveyances pass little information required for surveillance. Such a situation leads to an extremely high number of isolated areas where surveillance is impractical. On the contrary, urban surveillance can be conducted by the accumulation of sensors with the monitoring drones for understanding the current state of the transportation system. The coalescence of ITS with drones can support urban computing architecture and execute on-demand dissemination of data to the intended end-users. However, the involution of drones and their communication with the ground sensors are subject to energy overheads and may result in obstructed transmissions. Such a situation may expeditiously deplete all the resources of the system and result in a failed setup. It is required that surveillance should be energy efficient, scalable, non-redundant, low on overheads and non-isolated. Further, the surveillance should be conducted at the real time with a direct connection between the end-user and the deployed sensors. In addition, the communication system should be fail-safe and highly resilient in terms of processing and power consumption. Thus, it is required to develop a communication architecture which supports on-demand urban-surveillance via drones with energy efficient setup in ITS.
1.2. Our Contribution
The proposed approach is capable of supporting energy efficient surveillance in ITS by using drones as on-demand LoraWAN gateways. The proposed approach is able to enhance the lifetime of the network with a fail-safe and resilient strategy for using drones in an energy-deficit urban environment. The highlights and the major contributions of the proposed work are:
- Incorporation of drones in ITS by using them as LoRaWAN gateways.
- Drone modeling and traffic estimation in ITS.
- Intelligent solution for location identification and coverage by drones.
- Energy efficient surveillance and LoRaWAN-based drone communication.
- Resilient factor and fail-safe conditions for drone-based transmissions.
- Numerical case study for performance analysis of the proposed approach.
The remainder of the paper is structured as follows: Section 2 presents the related works on energy efficient surveillance, use of drones in networks, LoRaWAN models and sensing applications in ITS. Section 3 gives an overview of the network model, drone model, and traffic estimation. Section 4 provides insight into the proposed work with energy efficient setup for allocation, coverage, and surveillance. Performance evaluations are conducted in Section 5 . Section 6 presents discussions of the proposed approach with the state-of-the-art solutions. Finally, Section 7 gives conclusive remarks for the paper along with future directions.
2. Related Works
Surveillance in ITS is challenging because of a sizably voluminous number of users simultaneously probing for information that causes many overheads. Applications associated with surveillance such as traffic monitoring, location-identification, device tracking, etc, are further affected by the interference caused by the sensors or the locators deployed in an urban setup. These issues of overheads and interference due to overlapping result in wastage of energy resources and a decrementation in the lifetime and resilience of the network. Over the last few years, there have been several solutions proposed by leading researchers from all over the world. Some of them has additionally accentuated on utilizing on-demand drones as a key node (gateway) in the network setup akin to the one considered in this paper, but with divergent perspective and approach. In this section, some of those solutions are discussed that have the potential of being utilized for surveillance in ITS.
Motlagh et al. [40] proposed an Unmanned Aerial Vehicle (UAV)-based IoT platform that can be used for data offloading in mobile edge computing. The authors focused on vision-based data offloading by saving the operational energy of the drones. However, at the moment, mutual tasks and energy consumption during the simultaneous applications are yet to be explored for their proposed solution. This is a limitation as surveillance is a mutually cooperated task that cannot be resolved by direct application of their proposed solution. Wu et al. [41] developed a data dissemination model for drones in urban networks. Their developed approach uses online learning techniques to adaptively balance the broadcast rate and knowledge loss rate while communicating with each other. Their approach is efficient and can be used for enhanced lifetime-based network formation. At the moment, their approach emphasizes much on the use of onboard sensors for collecting information on urban environment and issues related to survivability and energy efficiency are yet not evaluated.
Naqvi et al. [42] discussed the drone-enabled communication for public safety networks. The authors discussed various challenges and issues involved in the utilization of drones for futuristic communication. The authors concluded that the self-adaptive power control of drones depends on the interference and data rate requirements, which are used as key metrics in the proposed work of this paper. Menouar et al. [43] discussed the challenges associated with the use of drones in ITS. The authors discussed that data rate and coverage play a crucial role in surveillance by drone in ITS, which is affected by obstacles and require rigorous path planning and location-allocation strategies.
Zeng and Zhang [44] focused on the energy efficiency of a drone by trajectory optimization. The authors proposed a strategy for conserving energy for drones by using various optimization conditions. Their approach is theoretically efficient and can be used as a placement strategy for using drones in LoRaWAN-like networks. However, performance, in terms of bit rate and survivability, cannot be assured alone on their proposed solution. Sharma et al. [45] developed an energy efficient system for collecting sensor data via drones. The authors used firefly optimization algorithm for solving issues related to data dissemination while conserving energy of the network. However, allocation of drones to ITS and their utility in an urban environment is not discussed by the authors. Trotta et al. [46] emphasized the problem of maximizing the lifetime of a drone fleet while monitoring a set of points. The authors put forward an optimal routing and optimization evaluations for charging and discharging of drones while manoeuvring over the desired location.
With LoRaWAN, the sensing applications can be enhanced for improving the in-depth communication via network-densification. However, the low data-rate of LoRaWAN and much energy consumption are open issues yet to be resolved for applications involving urban computing. Recently, Mathur et al. [47] analyzed the energy efficiency of LoRaWAN for traffic sensing applications. The authors discussed the pros and the cons of using LoRaWAN technology in an urban environment. According to the authors, LoRaWAN can be extended with an intelligent solution for various guidance applications in smart city setups. Adame et al. [48] proposed a solution for using multi-hop approach without affecting the network reliability through LPWAN. The authors illustrated self-organizing capabilities of LPWAN with 15% conservation of energy resources. This approach is efficient and can be extended for urban surveillance.
Most of the issues related to the surveillance via efficient network formations are studied as optimization problems, which primarily include the designing of optimal wireless networks. An optimal network can help to improve the utilization of resources as well as improve performance via optimal configurations of certain metrics, such as energy, operational time, and link speed [49]. These optimization aspects for wireless networks can also be accounted for deploying LoRaWAN services, especially for urban surveillance. Some of these important works for network optimization include, network planning under demand uncertainty by Bauschert et al. [50], super fluid management of 5G by Chiaraviglio et al. [51] and Shojafar et al. [52], power-indexed formulations and robust network design via heuristics for wireless communications by D’Andreagiovanni et al. [53,54].
Apart from these, there are certain solutions proposed by different researchers for energy efficient surveillance and data collection in ITS, however, without considering the survivability, resilience and operational overheads. These include a policy-aware model for ITS by Garofalaki et al. [55], diver behaviour detection by Sharma et al. [56], energy efficient and reliable communication by Portelinha et al. [57], energy efficient traffic scheduling by Afzal et al. [58], media-based surveillance in urban cities by Memos et al. [59], learning-based data collections by unmanned vehicles by Zhang et al. [60], etc. Despite these articles, there is a gap in the literature that needs to be fulfilled with a strategy that can guarantee energy efficient surveillance using LoRaWAN through drones without much redundancy, failures and operational overheads.
3. Network Model
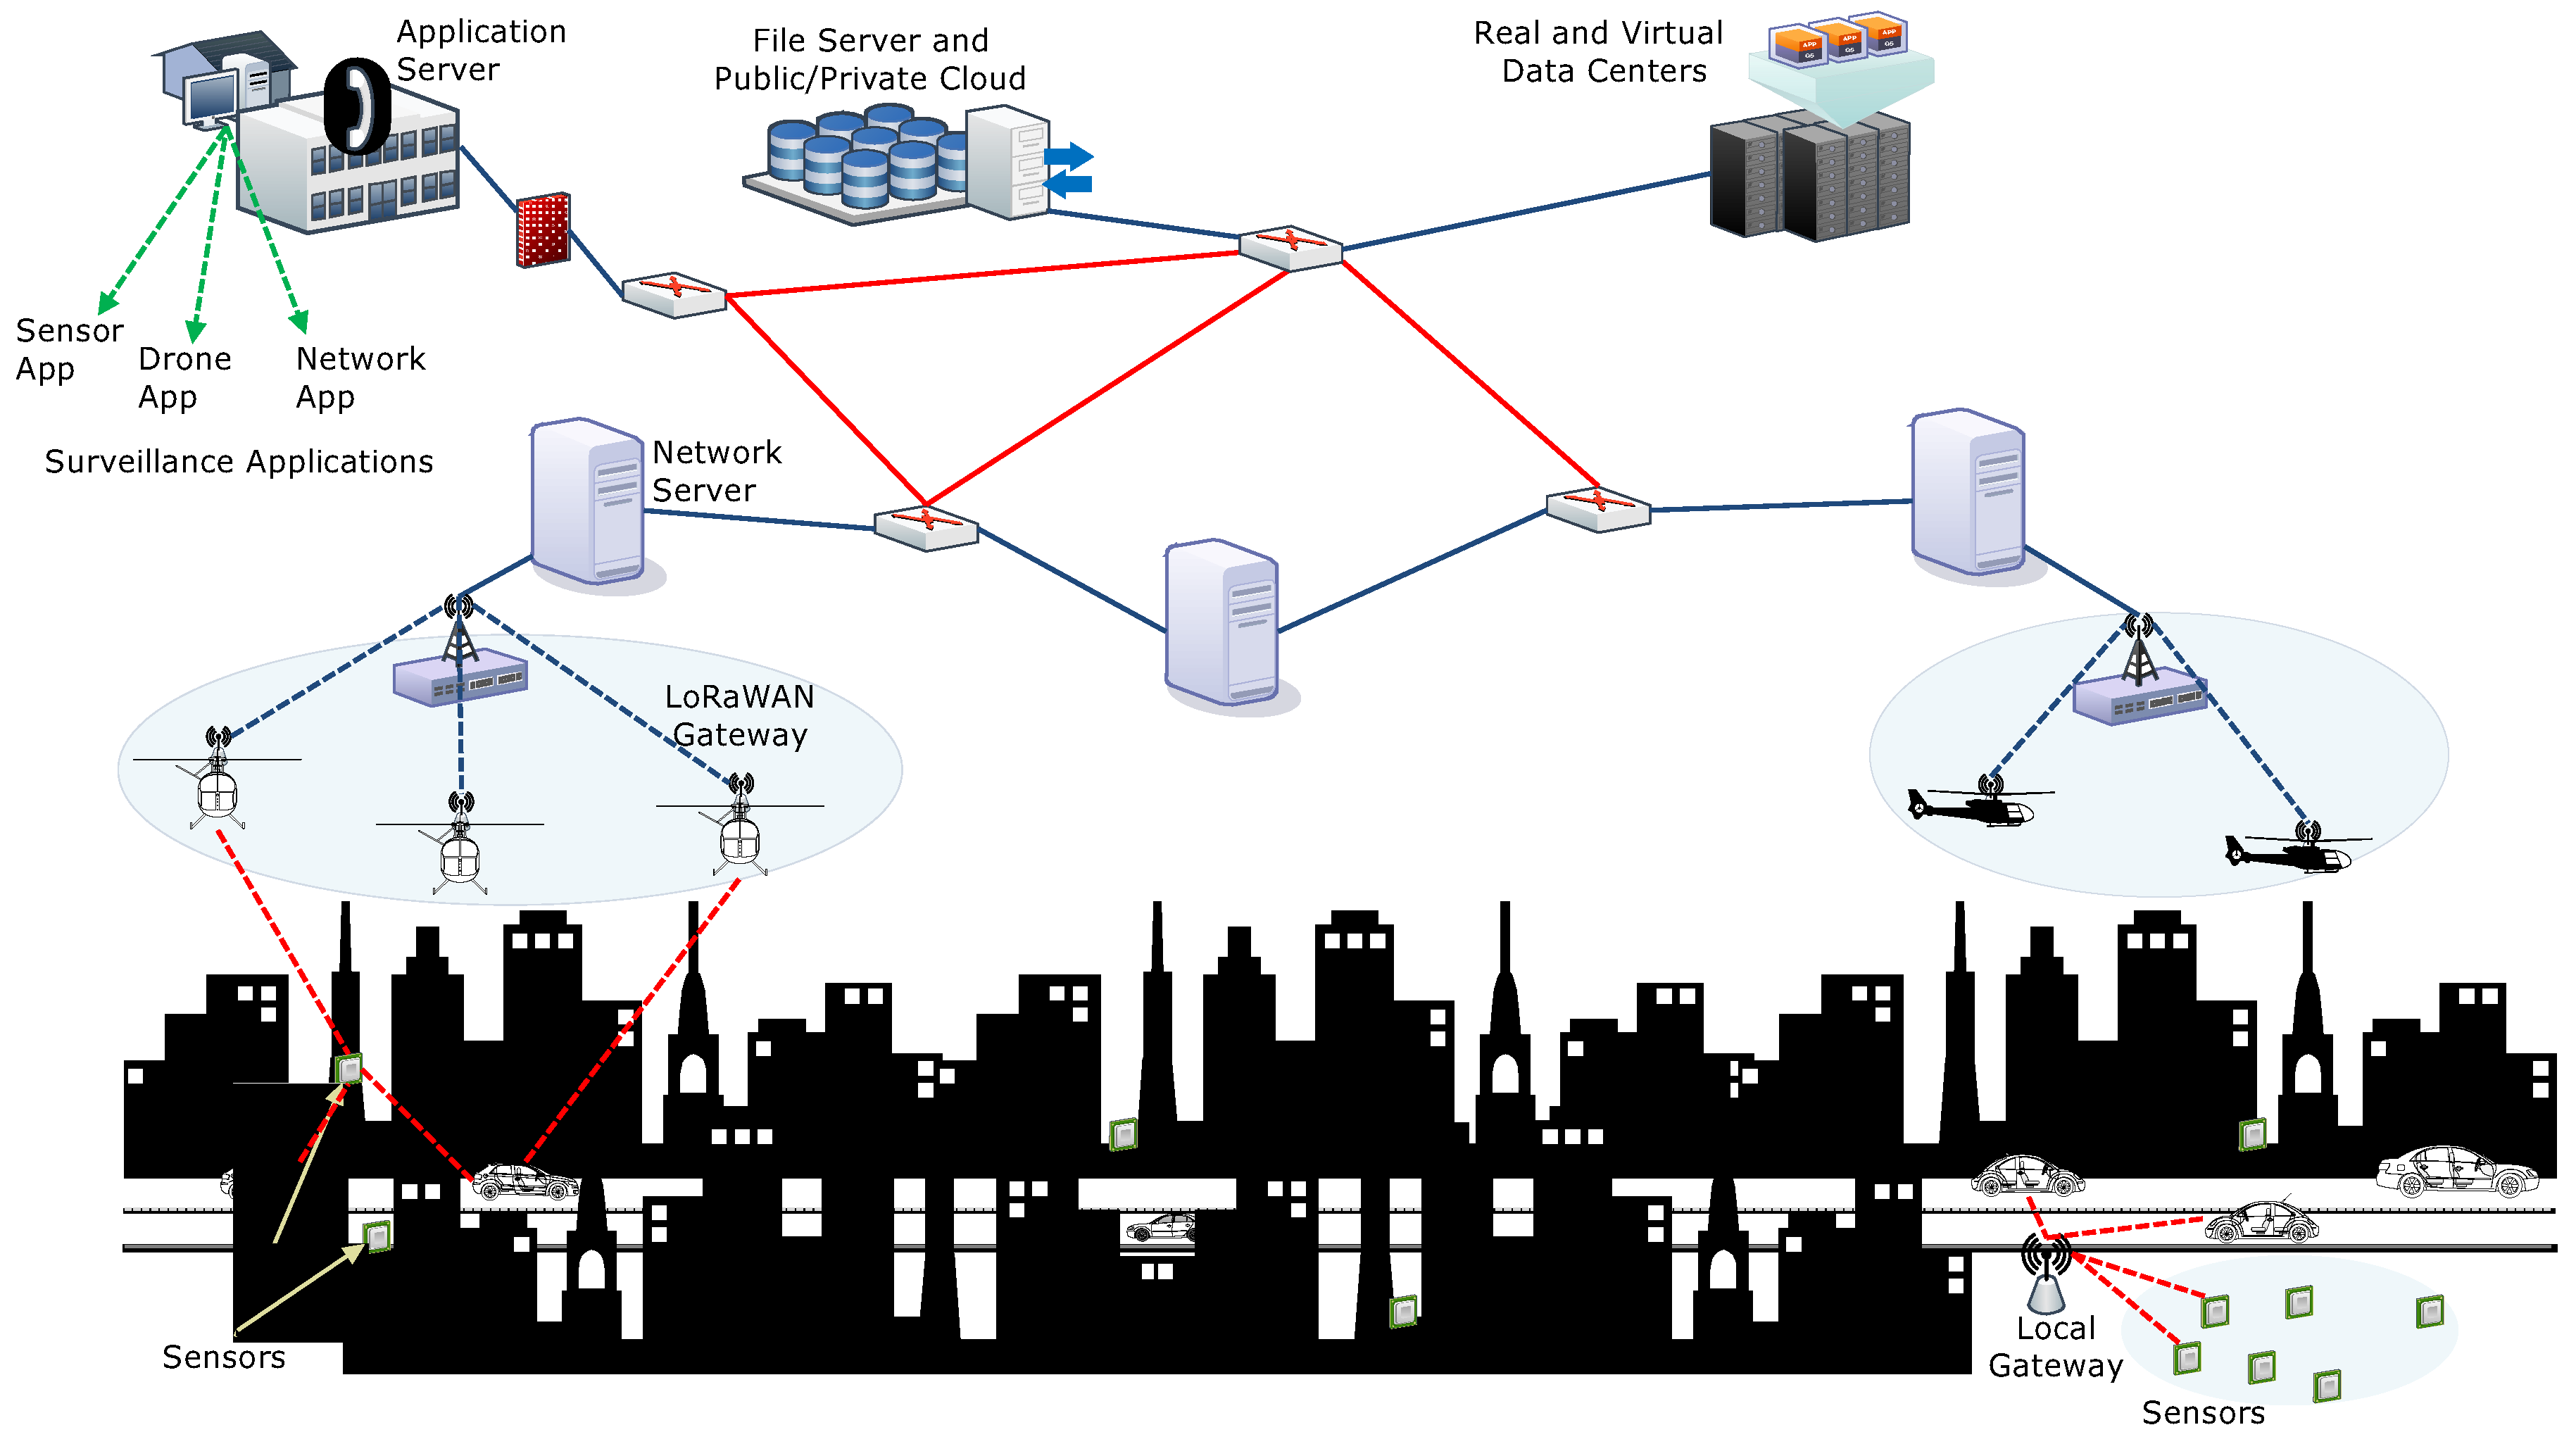
This section presents the network model used as a base for defining the proposed approach. The network comprises all the core components of the LoRaWAN, as shown in Figure 2, along with additional features as explained below:
- Application Server: The application server plays the role of central authority and regulates the data flow in the general LoRaWAN. However, in the proposed model, it is used for delivering applications related to surveillance to the end-users. It supports downloading by an interface, which is classified into sensor App, drones App or network App. Every end-user in the network is assumed to possess all the three Apps that help to communicate with each other.
- Network Server: The network server is the connecting entity between the application servers and the LoRaWAN gateways. A series of network servers helps to expand the network and manages connectivity with the public/private cloud infrastructures. It is capable of managing transmissions with the data centers via real or virtual nodes. Network servers are connected through series of routers with information flow management only at the application server. In the proposed setup, the network servers are used as assigning entity that also checks the performance of the end-user devices, sensors, and actuators.
- LoRaWAN Gateways: The LoRaWAN gateway operates just like any other gateway and provides a bridge between the network servers and the end-users, sensors or locators. Unlike the traditional LoRaWAN gateways with fixed roles, the proposed model uses on-demand drones as LoRaWAN gateways that provide direct connectivity to the end-users. At the moment, the LoRaWAN gateway is divided into two components, which include a set of drones and a switch. The switch helps to localize the drones in the network and checks for incoming connections from other drones. Generally, a network may have switches for different service providers and all the drones respond to their particular switch. Information broadcasting and sharing between the sensors and the end-users via drones is independent of the service provider and depends on the accessibility roles and conditions between them.
- Sensors or Locators: Sensors or locators are the fixed devices in ITS which helps in gathering information across its transmission range and share with the nearest requesting end-user. Sensors or locators also communicate with the drones for long-distance surveillance. This helps in gathering information from any isolated areas. In case, there is no sensor or locator information available, surveillance drones can directly be used for transmissions and accessing geographical information.
- End devices: These are the users which take services from the entire setup and use the information to know the current state of the transportation system. The usability of information by end-users depends on the type of Apps which are used for evaluation as well as the type of services being provided by the service providers. End-users have pre-installed applications that are provided by the centralized application server. It is to be noted that in the proposed approach, the centralized procedures between the end-users and the application servers are only carried during the network initialization. Once a device is registered, there is a limited role of the application server for information accessibility. This makes LoRaWAN on-demand and scalable.
Mathematically, the network can be expressed as a single application server operating with a set of network servers, which are connected to a set of data centers and a set of cloud servers. Further, the network servers are served by a number of drones represented by a set . The number of switches is denoted by a set that may vary for each application server. As explained below, a separate network server is used for each service provider. The entire ITS setup is served by the combination of sensors or locators denoted by a set , and the end-users are represented by a set . The details of symbols used in this paper are presented in Table 1. The communication between the drones and the sensors are subject to cause interference with the signals for the end-users. This interference over a particular signal, observed by i th end-user, is computed as signal to interference plus noise ratio, i.e.,
where is the transmission power, is the antenna constant for a given path loss exponent , is the transmission range and is the spectral density of the network for a given noise model. Inter-drone communication is assumed to be free from noise and a separate beamwidth is used for the drone to drone communication. It is to be noted that each drone is equipped with a LoRaWAN-antenna as specified for its ISM band. In contrast to drones in 5G setups, LoRaWAN-enabled drones operate on a narrow ISM band in the range of 902-928 MHz (US) or 863-870 MHz (Europe) [61]. Thus, minimization of interference can help in better signal strength to each user or sensor/locator. The entire setup is driven by the received power at a drone as expressed in [61,62]. The proposed approach uses a combination of transmission, which includes a drone and an entity (end-user/sensor or locator), or a sensor/locator and the end-user itself. Both these are driven by Line of Sight (LoS) and Non-LoS (NLoS)-based transmissions. Such transmissions and their signal strengths depend on the received power of the devices. Now, using [62,63], the received power for LoS and NLoS are calculated as:
and
respectively, where
Here, is the path, refers to the transmission distance, is the shadowing component, and is the path loss at the reference distance. The received power at a respective location for a particular device helps to maintain a reliability of connectivity in the network. This reliability is calculated by defining received power thresholds, which are denoted by and for LoS and NLoS modes, respectively (Thresholds in this paper are calculated as an average of the mean and the minimum value of a given metric). Both these thresholds help to find the failure factor of the connection that determines the possibility of transmission in the network. is calculated for the independently operating components of the network that shares a wireless connectivity, i.e., drones, end-users, and sensors. Each of these devices is considerably operational on multiple channels and may or may not possess redundant connectivity for each of them (In this paper, it is assumed that all the channels over a single entity are identical). Thus, reliability, in any given instance t for number of concurrent channels, is calculated as:
where refers to drones, end-users or sensors. If, each entity is operational in multiple states or tested after number of states, then,
such that , because state-wise reliability is always less than or equal to the overall reliability of the network. is the failure factor, which is calculated as [64]:
where is the frequency of received power of an entity being lower than the threshold values. It is calculated as the ratio of instance when and for LoS mode and NLoS mode, respectively. Equation (7) can also be defined for link availability , such that , where , and is the outage probability. Now, by definition, failure distribution function for a particular duration, say and , can be calculated as:
This model can be extended for probability of connectivity , which can be defined as a function of network load. This load is dependent on the arrival rate of incoming packets. For this, that can be modeled for , which is the required rate for the network, and , which is the minimum rate that can prevent congestion. From these, can be given similar to Equation (8), such that, , s.t., . Now, considering that is the actual time for which the network should be operational to support realistic data transmissions between the end users via LoRaWAN architecture, the probability of failure before this time, is calculated as [65]:
where is the available time equivalent to current time (), and is the total connected device with the entity which have a high depletion rate. Using these, the expected future lifetime is given as [65]:
3.1. Drone Modeling
Drone modeling and traffic estimation are performed on the basis of total area under evaluation . Assuming that each drone covers an area defined as zone, such that , where are zones for drones. This condition holds as each drone may overlap some of the area covered by another drone. It is to be noted that each drone should be active for a time period , such that, there exists a full-time connectivity between the drones and the end-users or the sensors, and between the drones and the LoRaWAN gateways (Backhaul for the drones and the LoRaWAN switches is not evaluated in this paper). Each zone has a particular number of sensors represented by , where i is the zone number, such that , where Z is the set of zones into which the sensors are divided. If and are the uplink and downlink time, respectively, for the involved end devices, then and . This means that the resource depletion time for each of the involved entity should be higher than for two-way communication. The resource depletion time can be given as network lifetime, i.e., , where is the mean lifetime expressed as reciprocal of the energy consumed for every uplink or downlink over a single channel (Follow Equation (20)). is the initial energy of an entity, and is the remaining energy of an entity after a time instance t. This same model can be used to calculate the expected number of drones required for a particular zone by trivial calculations for the number of supported uplinks/downlinks on a drone and the requested uplinks/downlinks from a ground-zone.
All the above-described communications are governed by the wait time of a drone over a particular location in the defined range of ground entity. This is measured as , where and are the velocity and range of drone transceiver, respectively. can be used to identify the location of a drone at any given instance as well as it can be used to predict network state after a given number of iterations, such that,
3.2. Traffic and State Estimation
This setup can be formulated into the number of steps required for predicting the state of the network after a required time. These states are marked as transitions between the zones into which the sensors are deployed. Such an overview of predicting network state via drone modeling and traffic conditions is presented in Figure 3 (This same model can be extended for any type of ground entity, be it the LoRaWAN switches, end-users or even other drones). The details of network state prediction are as follows:
- (i)
- At first, the network is accounted for the number of allocated drones. These are checked for all the zones with communicating entity. The communicating entity can be a sensor, end-user, or another drone.
- (ii)
- Next, the evaluations are conducted for required transmission time by using the above-given formulations. This helps to understand the exact duration for which each drone must be active over all the given zones.
- (iii)
- Next, the details of incoming drones are marked. This is done by understanding the directional maneuvering of each drone and its present location.
- (iv)
- The incoming drones are useful only if they possess a certain number of free channels to support extra sensors from the zones they are entering.
- (v)
- Once the evaluations are done for the number of channels supported by incoming drones, the number of left out devices can be identified on the basis of no connections. Note that failed communications and no-connectivity also refers to a state of being left out.
- (vi)
- This helps to calculate excessive drones required to maintain the connectivity to all and that too at all the instances.
- (vii)
- Now, the excessive requirements for channels can either be resolved by deploying more drones or by understanding the maneuvering cycles of already deployed drones.
- (viii)
- The maneuvering cycles of incoming drones are also identified as this identification helps to understand the state of drones which will leave the current zone during one set of communication (uplink or downlink).
- (ix)
- These cycles help to identify the network delay as well as the allocation delay, which tells about the time required by a drone to reach a particular zone for connectivity.
- (x)
- Next, the number of current transitions on each drone is logged and the current traffic is marked.
- (xi)
- Finally, the remaining traffic is calculated with a stipulated delay after a given number of states. This helps to decide the performance as well as the state of the network by considering new deployment or by improving the maneuvering cycle of each drone.
4. Proposed Approach
This section proposes a LoRaWAN-based drone transaction model which helps in fail-safe network formation with high resistance towards overheads. The proposed approach uses energy efficiency function for controlling the connectivity and maintaining a non-redundant as well as non-isolated surveillance. The proposed approach first uses location identification procedures to account for the location of each drone in the network. Then it evaluates the model via energy conditions and forms the drone transactions for efficient communication. The details are presented in the following subsections.
4.1. Location Identification and Coverage
The proposed approach uses area-stress modeling, inspired by stress-mechanics [66], for calculating the location as well as the load of the network w.r.t. deployed number of drones. For this, the area stress is calculated as:
where is the function for network stress, which is calculated as [67]:
such that
Now, the resultant value is obtained as:
where and are the number of entities operating in a given drone’s zone and the actual number of entities a drone can support, respectively. is the average transmitting range of each ground entity and
where
Here, and are the number of overlaps (The coverage area is considered as a circular ring for each drone) and the distance between the centers of overlapping zones for any drones, respectively. The entire system can be used for location identification of drones in the LoRaWAN setup and to decide whether new drones are required or surveillance can be completed by utilizing the existing infrastructure. The details of these procedures are presented as steps in Algorithm 1. The algorithm operates by taking inputs from the network components as well as the operational time of each entity. Next, it initializes all the components and checks for continuity while finding coordinated information, incidence and adjacency matrices. After these computations, a decision on reshuffling or reallocation is taken by evaluating the area stress of the network. The algorithm is operated continuously until the required communication is not halted. The complexity of the algorithm depends on the number of drones and is equivalent to the complexity involved in building incidence and adjacency matrices for communication and collision avoidance.
| Algorithm 1 Location Identification and Coverage Analysis | |
| 1: | Input: Network components, operational time |
| 2: | Output: Drone allocation |
| 3: | Initialize network and beacon messages |
| 4: | while (Transmission !=Halt) do |
| 5: | Input sensor location () and Drone altitude matrix () |
| 6: | Find drone coordinates w.r.t. sensor field through distance formula and its antenna’s angle of elevation. |
| 7: | Build incidence matrix and share it with other drones |
| 8: | Build adjacency matrix and discard others |
| 9: | Check for overlapping conflicts of coordinates for adjacent drones |
| 10: | Calculate area stress and coverage area using model in Equations (12)–(16) |
| 11: | if (() or ()) then |
| 12: | Reshuffle and re-allocate drones |
| 13: | if (Reshuffle== True && () && ()) then |
| 14: | Continue operations, mark locations, update logs |
| 15: | else |
| 16: | Involve more drones and optimize via energy modeling |
| 17: | end if |
| 18: | else |
| 19: | Exit (−1) or reset |
| 20: | end if |
| 21: | Maintain logs |
| 22: | end while |
4.2. Decision Modeling for Energy Efficient Surveillance
The proposed approach performs surveillance by mapping energy requirements and overheads associated with the zone, which comprises sensors or end-users looking for uplinks or downlinks. The proposed approach takes surveillance as a decision problem and uses energy-conservation mechanism for improved connectivity and long-term transmissions. The entire system can be modeled into energy requirements of each link formed in the network. Let be the energy consumed by each drone to remain in-flight during transmissions. Now, the energy requirements for each zone can be calculated as:
where , , represents the sets for number of drones, end-users and sensors in a particular zone, respectively. , , , denote the processing energy, transmitting energy, energy loss due to interference and energy consumed in idle phase, respectively. and are the number of channels operating on end-users and sensors, respectively. Now, the overall energy consumption can be modeled as:
where accounts for the ground entities in the overlapping zones. This computed energy can be used to identify the zone that may consume excessive energy in contrast to other zones. Such procedures help to deploy countermeasures that can regulate the usage of energy throughout the network. This model can further be strengthened by defining energy prediction equations and using optimization theory for associating drones as LoRaWAN gateways. Now, the predicted energy consumption can be calculated as:
where denotes the total active channels, and are the processing power and transmission power for one byte, respectively, and b is the total bytes to be shared between the two ground entities (The operational cost (in terms of power) for the wired connections (backend LoRaWAN devices) is not evaluated in this paper). For an optimal energy efficient surveillance and deployment in LoRaWAN,
s.t.
Further,
which can be scaled to model the error rate for the entire duration with an optimization condition of , where
The above conditions help to minimize the error in energy optimization conditions that govern the LoRaWAN-based drone surveillance. All these conditions can be modeled into series of steps for fail-safe operations as presented in Algorithm 2. Similar to Algorithm 1, Algorithm 2 takes into account the initial components of the network and their operational time while checking the conditions for halting the transmission. Once all the calculations for the defined system model are obtained, the algorithm checks the conditions for area stress, area coverage and energy requirements to analyze the surveillance by marking zones w.r.t. their required energies. Once these conditions are satisfied, surveillance procedures are initiated along with maintenance of logs.
| Algorithm 2 Energy efficient surveillance | |
| 1: | Input: Network components, operational time |
| 2: | Output: Energy efficient surveillance and drone maneuvering |
| 3: | Initialize network and beacon messages |
| 4: | while (Transmission !=Halt) do |
| 5: | Calculate from Equation (19) |
| 6: | Calyculate from Equation (20) |
| 7: | if () && () then |
| 8: | Calculate |
| 9: | if () && (== True) then |
| 10: | Continue with current deployment |
| 11: | else |
| 12: | Mark zones with high energy and |
| 13: | Re-initiate allocation procedures and continue until step 9 holds |
| 14: | if (steps 12 && 13== Success) then |
| 15: | continue and maintain updated logs with fresh incidence and adjacency matrices |
| 16: | else |
| 17: | exit(−1) or reset |
| 18: | end if |
| 19: | end if |
| 20: | else |
| 21: | Perform steps from Algorithm 1 |
| 22: | end if |
| 23: | Maintain logs |
| 24: | end while |
4.3. LoRaWAN-based Drone Model for End to End Communication
The drone communication in the proposed approach is based on the location of the dynamic gateways, i.e., drones and the resilient factor, , for links involved in communication. According to the defined system model and network governing equations in the proposed model,
such that
where , , and are the weights for energy resilience, range resilience and channels resilience, respectively, such that, , with , and . Now, by using the properties of survival functions [68], the probability that there will be no failure and a connection can exist between two entities is calculated as:
and the hazard functions will be given by and for resilience and reliability, respectively. Note that for efficient communication during any given instance, the network must fulfil the following conditions:
and
By using the above defined model, the proposed approach is able to select the nodes, which will result in highly resilient and fail-safe network over the properties of LoRaWAN. The selection of nodes can be further understood from the steps presented in Algorithm 3. The algorithm helps in creating a subset of nodes and links that have very minute likelihood of failing on the basis of present depletion rate. The algorithm is iterative and continuously monitors the network for any changes in properties and the defined system model. Further, by using its steps, every node can maintain a connectivity with the above maneuvering drone leading to zero-isolation and fail-proof connectivity over LoRaWAN properties and infrastructure.
| Algorithm 3 LoRaWAN-based Drone Communications for urban-Surveillance | |
| 1: | Input: Network components, system model |
| 2: | Output: Incidence and Adjacency matrices for communication |
| 3: | Initialize network and beacon messages |
| 4: | Evaluate initial system model |
| 5: | ADJ, INJ=Calculate initial adjacency and incidence matrices through Algorithms 1 and 2 |
| 6: | counter=count of links in INJ or ADJ |
| 7: | while (Transmission !=Halt) do |
| 8: | Fetch current time |
| 9: | while (i ≤ counter) do |
| 10: | Calculate using Equation (26) |
| 11: | Calculate using Equation (27) |
| 12: | Calculate and |
| 13: | if then |
| 14: | Mark link and the nodes connected by it |
| 15: | Proceed with new incidence and adjacency matrices |
| 16: | Check for isolation |
| 17: | if (isolation == True) then |
| 18: | exit(−1) or reset model to remove isolation |
| 19: | else |
| 20: | Continue |
| 21: | end if |
| 22: | else |
| 23: | discard node and continue until all the links are not checked |
| 24: | end if |
| 25: | |
| 26: | end while |
| 27: | Communicate and maintain links until conditions in step 13 holds |
| 28: | end while |
| 29: | Maintain logs and build connectivity graph |
| 30: | Share logs with the Application Server |
| 31: | Update database and generate files for analysis |
5. Performance Evaluation
The proposed approach is analyzed for its performance over a scenario that considered hovering drones in a smart city environment through system simulations in Matlab™. The drones are assumed to be transmitting traffic locations over LoRaWAN connections. The proposed solution is tested on an area of m with number of drones varying between 10 and 20. A total of 10 zones is considered each having number of sensors equal to 50 and the number of users less than or equal to 500. The drones are set at a cruising speed of 30 kmph and can operate continuously for whole simulations provided that the depletion rate of resources is not too high. The other parameters and their values used for analysis are provided in Table 2.
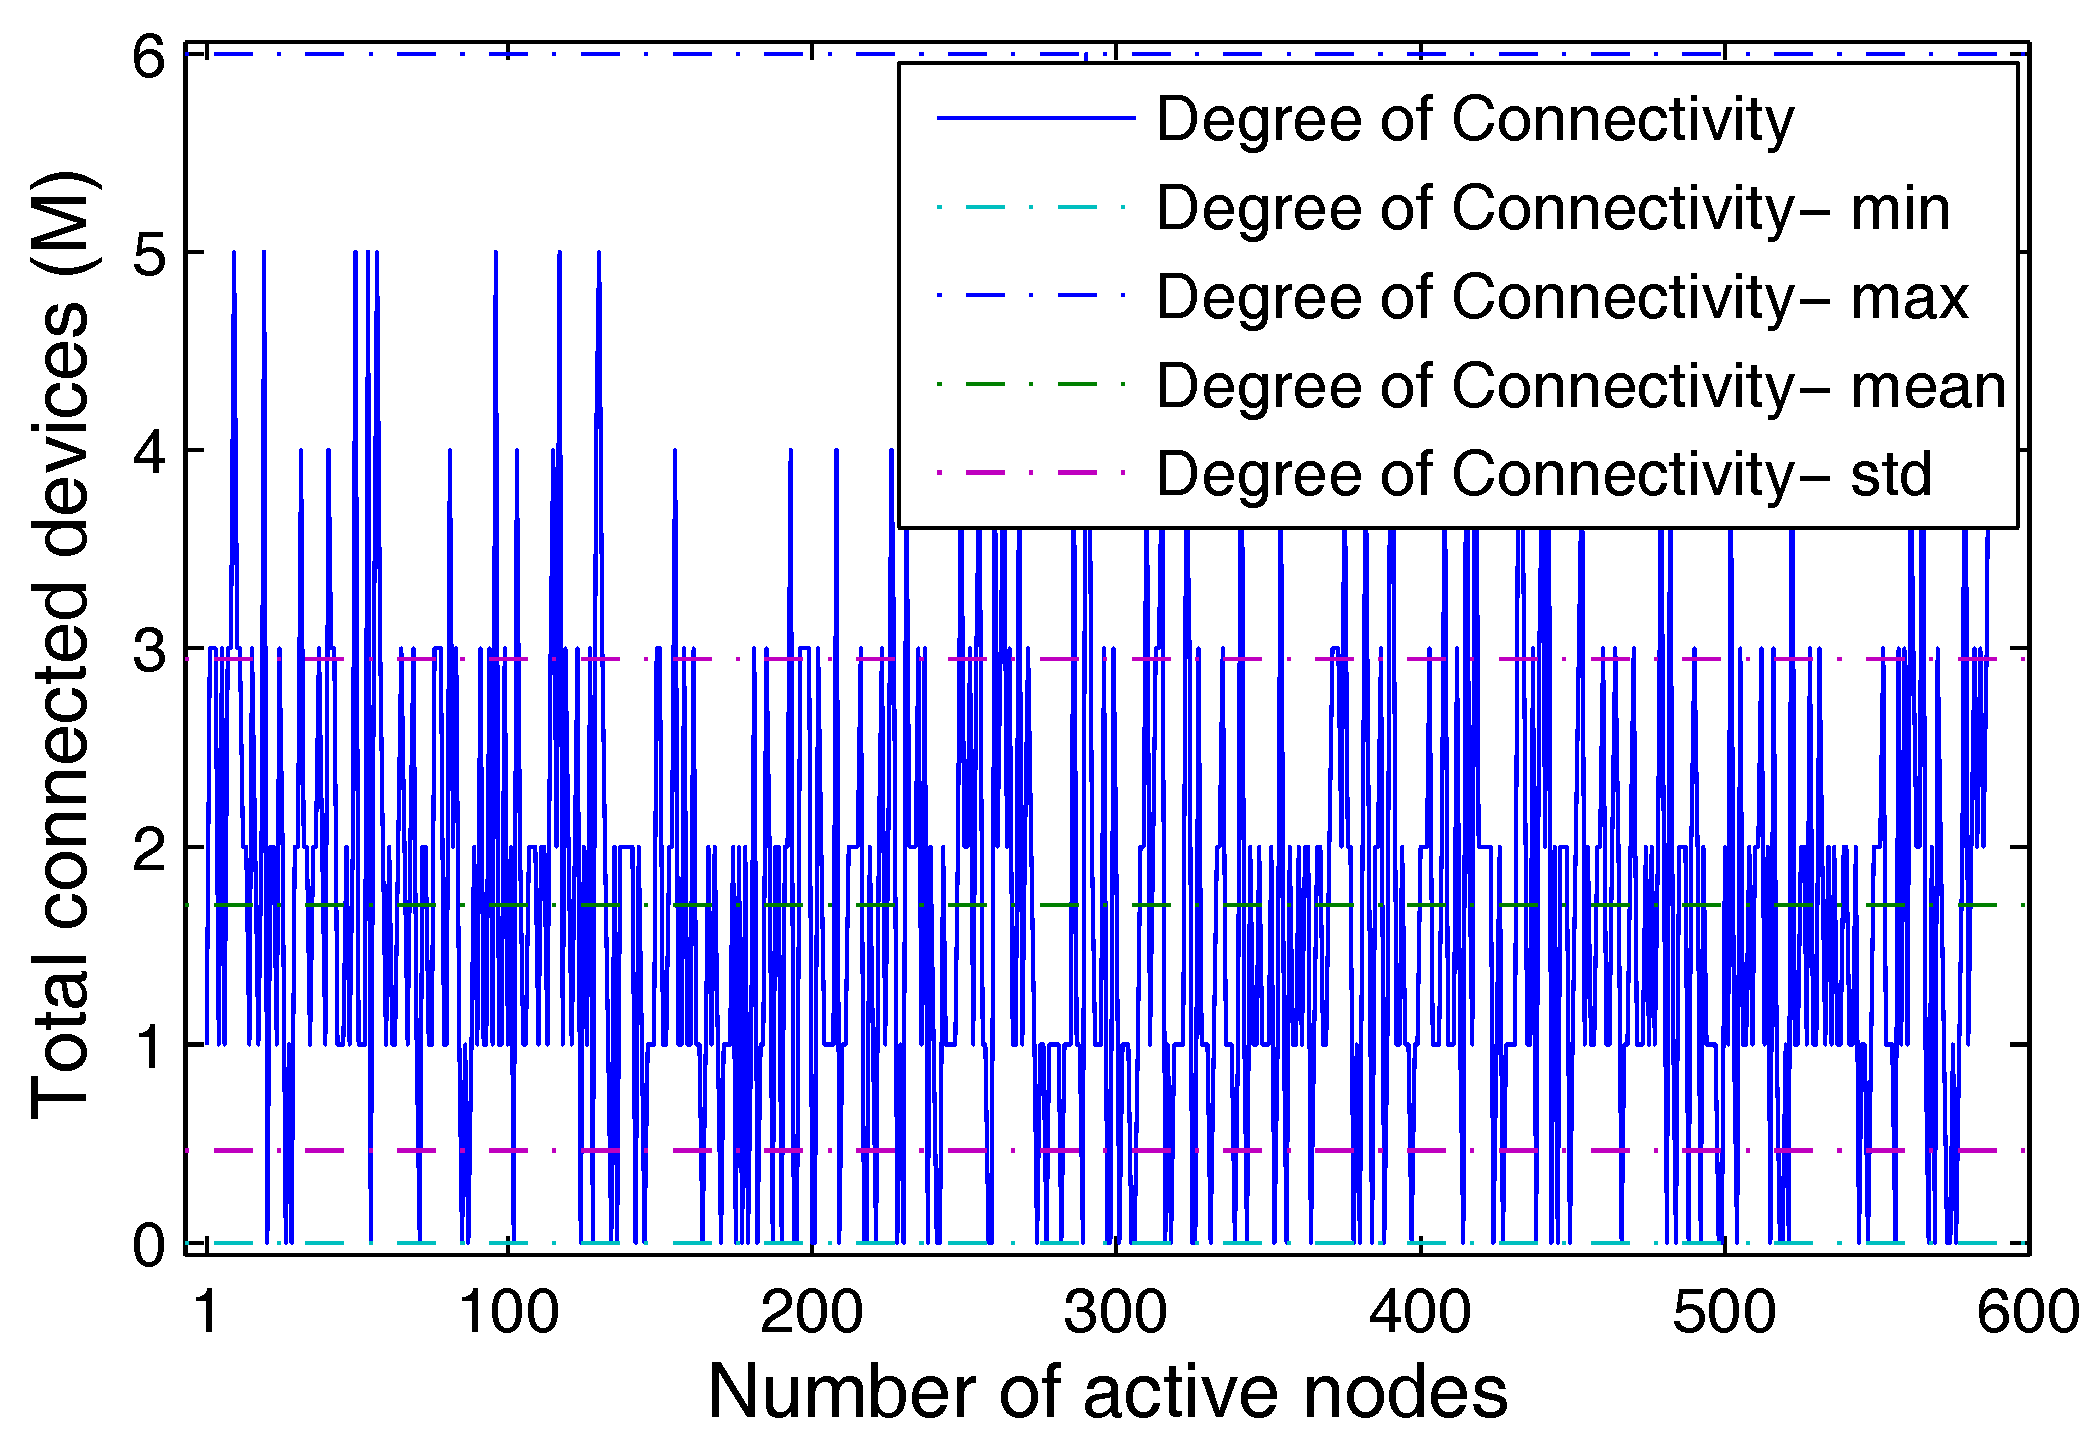
Initially, the network is set as per the configured entities and Algorithms 1 and 2 are used for allocation of drones for the given number of sensors and users. The proposed setup operates with an average degree of connectivity varying between 1 and 6 for each of the users that have at least one of their channels operational all the time. The plot for the degree of connectivity for an active number of users is presented in Figure 4. This plot helps to understand the connectivity of the network and also assists to predict the traffic which will be generated once all the users are online and transmit through the same network.
The proposed approach operates for defining a system which can withstand the low bit rate pressure of LoRaWAN as well as can ensure high reliability of connections with less redundancy and almost zero-isolation. Figure 5 presents the plot for reliability for time-based as well as state-based network with varying frequency of received power to its thresholds. The thresholds are set at a range equivalent to an average of the minimum and mean value of received power during one cycle. It is evident from the graph that with increasing limits for thresholds, the reliability of the network decreases, as with time the received power for each entity in the network decreases. This decrease is due to the depleting energy for each link operating from a zone of users and sensors. However, the reliability lowers to a minimum value only if the reaches its maximum ratio of 1, which is a harsh scenario and usually, all the networks are recharged for their resources before reaching this limit. It is observable that the proposed approach can offer high reliability in a scenario where drones are used as LoRaWAN gateways. Also, the trends in the reliability graphs justify the conditions imposed on Equation (6). Thus, verifying the defined system model.
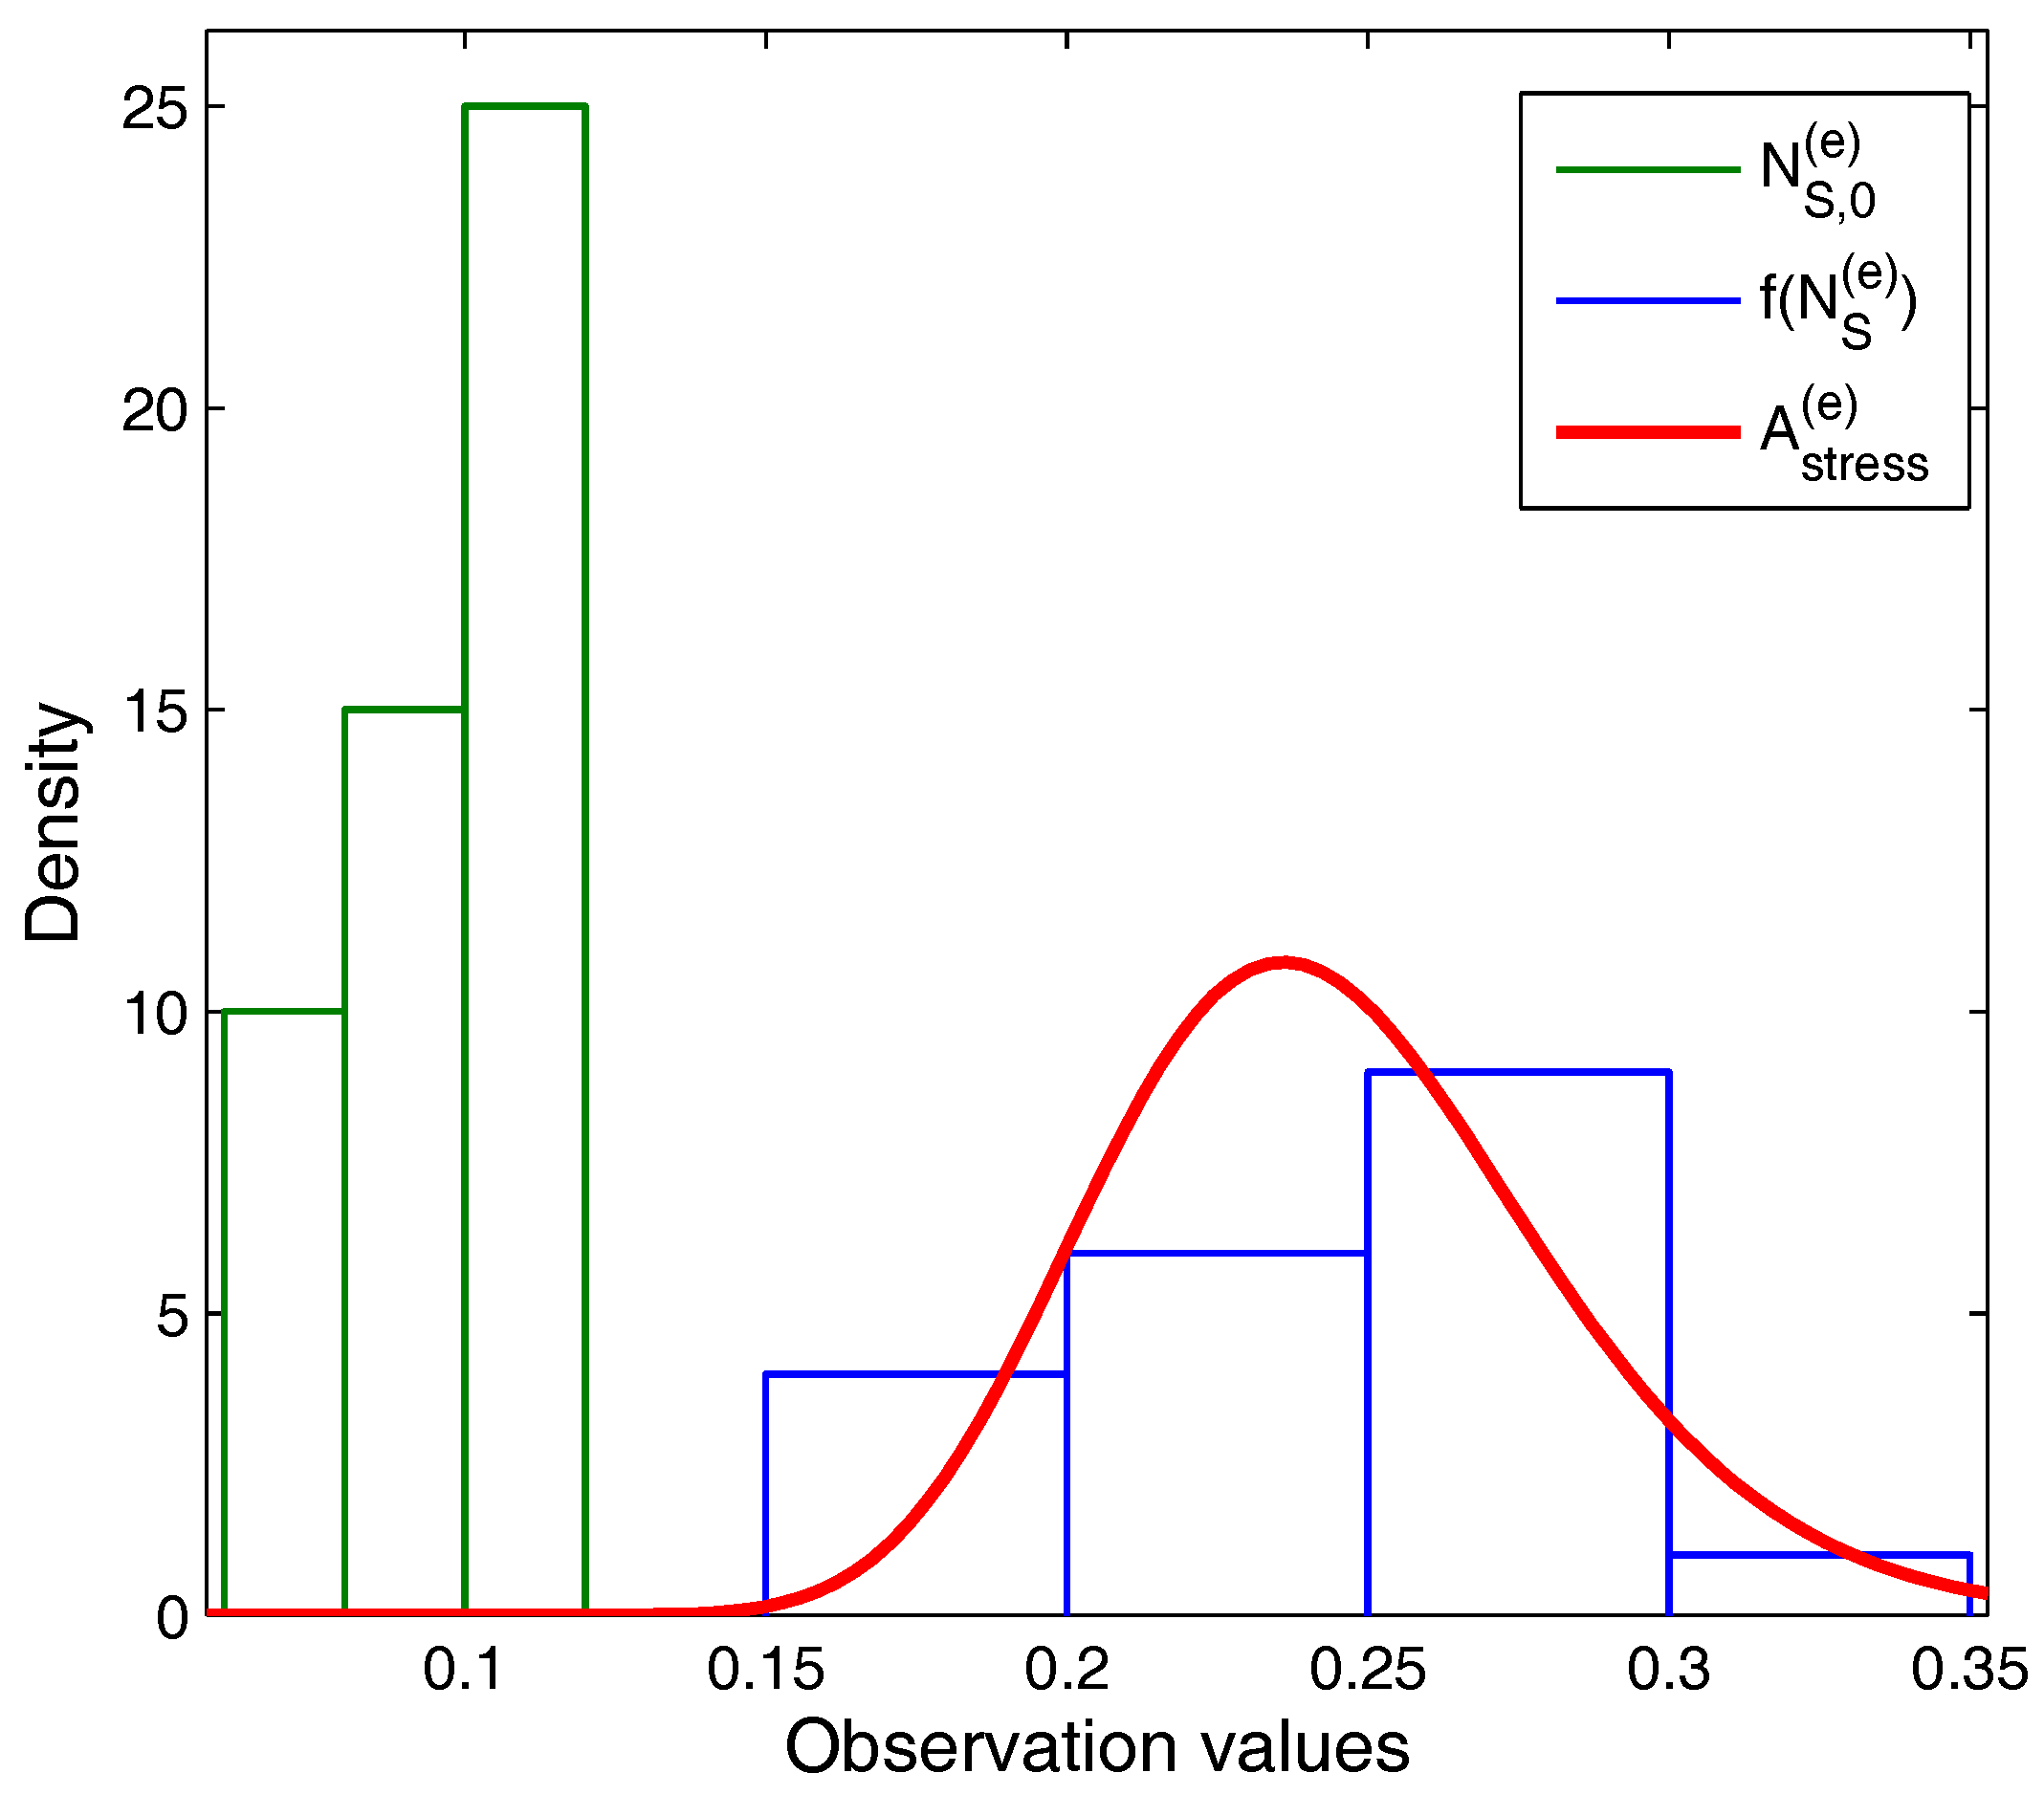
The entire model is efficient if it imposes lower stress on its resources. This is calculated in terms of area stress in Equation (12). The area stress is directly proportional to the network stress and the number of overlaps in the network (). The number of overlaps causes excessive interference in the network and wastes much of the network resources in counterfeiting the effects of signals from other simultaneously communicating entities. From the density plot in Figure 6, it is noticeable that as the area stress of the network follows a logarithmical increase, the entire network observes a high number of overlaps. Further, this graph can be reversely studied, which means that the area stress of a network will increase with the increasing number of overlapping zones that will lower the transmission rate of the network and in lieu, the reliability of the entire system will decrease. There are certain durations in the network when the network stress is unaffected by the increasing number of overlaps. Such a situation includes more drones than normal setup over a single communicating zone.
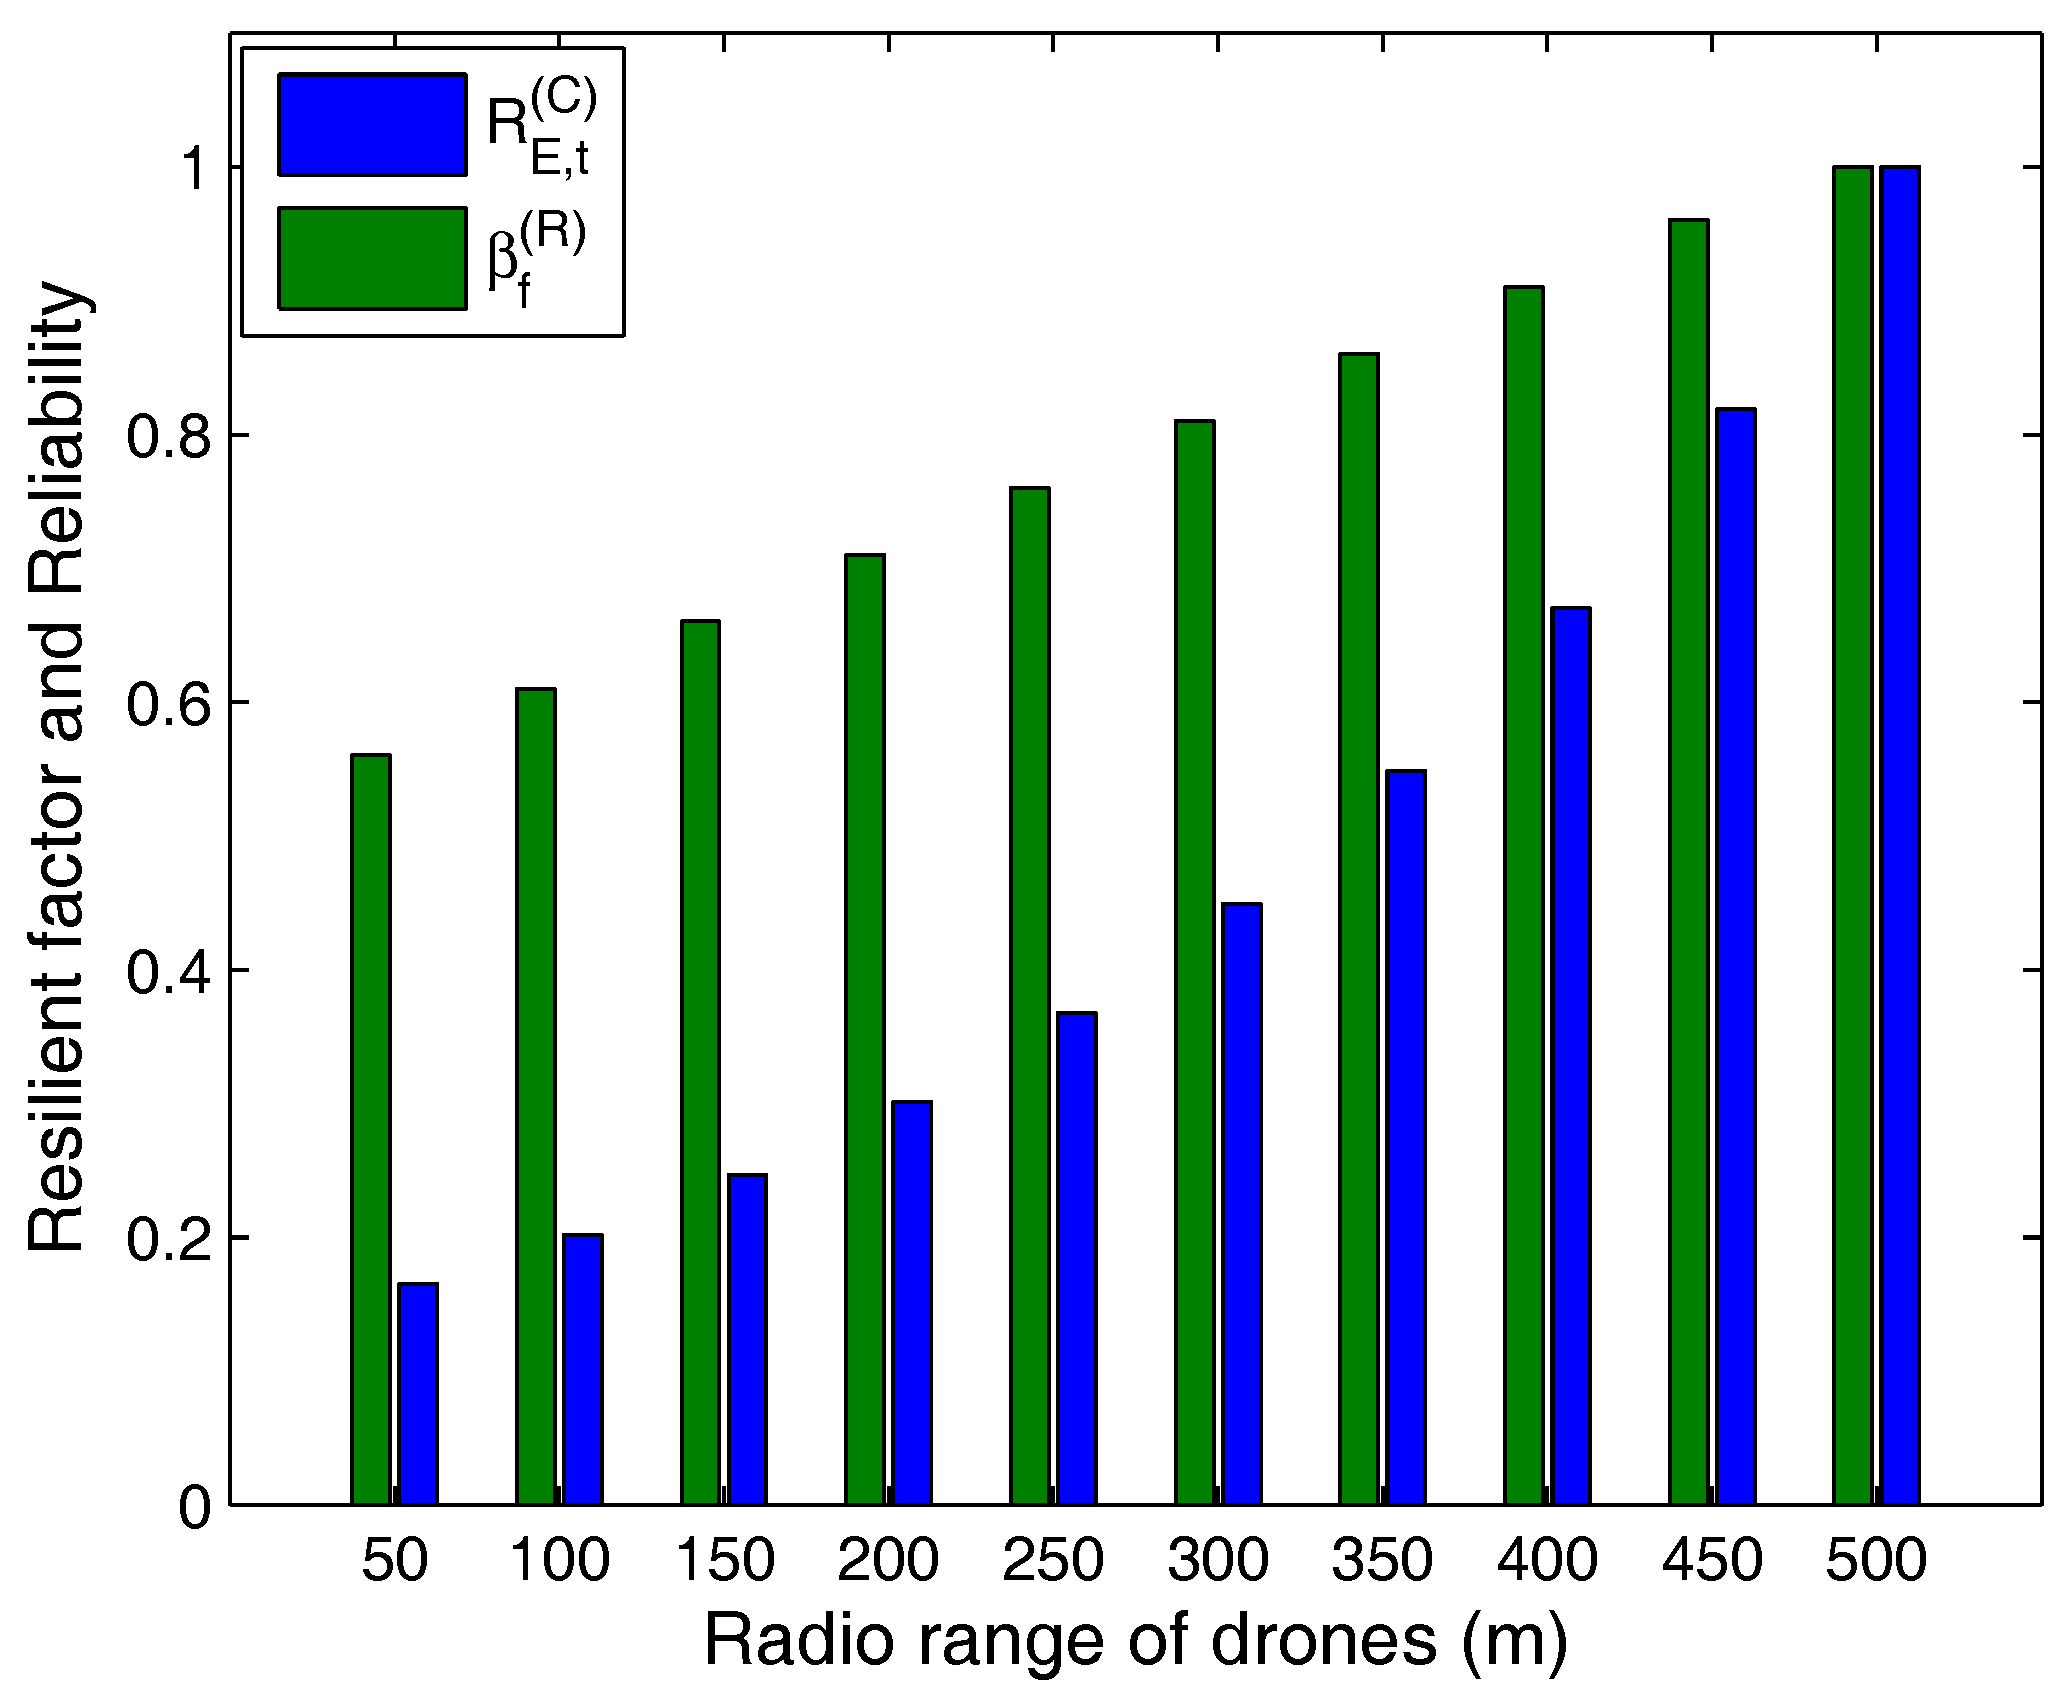
From the system modeling, it is understandable that the transmission range plays a crucial role in sustaining of the network and its survivability, which is studied in form of the resilient factor in Equation (26). A network with better connectivity, lower consumption of energy, high yield in terms of remaining energy, better capacity and coverage area, possesses high resilient factor along with the reliability. Further, these values increase with an increase in the radio range of drones as a single drone can serve multiple users from different zones provided that the incoming requests are within the limits of connections supported by it. The results for reliability and resilient factor with an increasing radio range are presented in Figure 7. The resilient factor can attain a high value depending on the factors controlling it. The values can also be presented as normalized output by controlling the range of , and . However, at the moment, the real values are included for actual evaluation of the system.
The proposed approach is analyzed for its energy consumption throughout the transmission. With an increasing number of overlaps, the energy wastage increases, which decreases the overall available energy of the network as shown in Figure 8. The results in the figure show the confidence bounds at 95% interval and illustrate that a generalized quadratic equation can be used to analyze this decrease in available energy with an increasing number of overlaps. However, this lowering can be improved by subdividing the zones or by deploying more number of drones at varying altitude. Such an approach can lead to a longer duration of the network, but at an expensive operational cost.
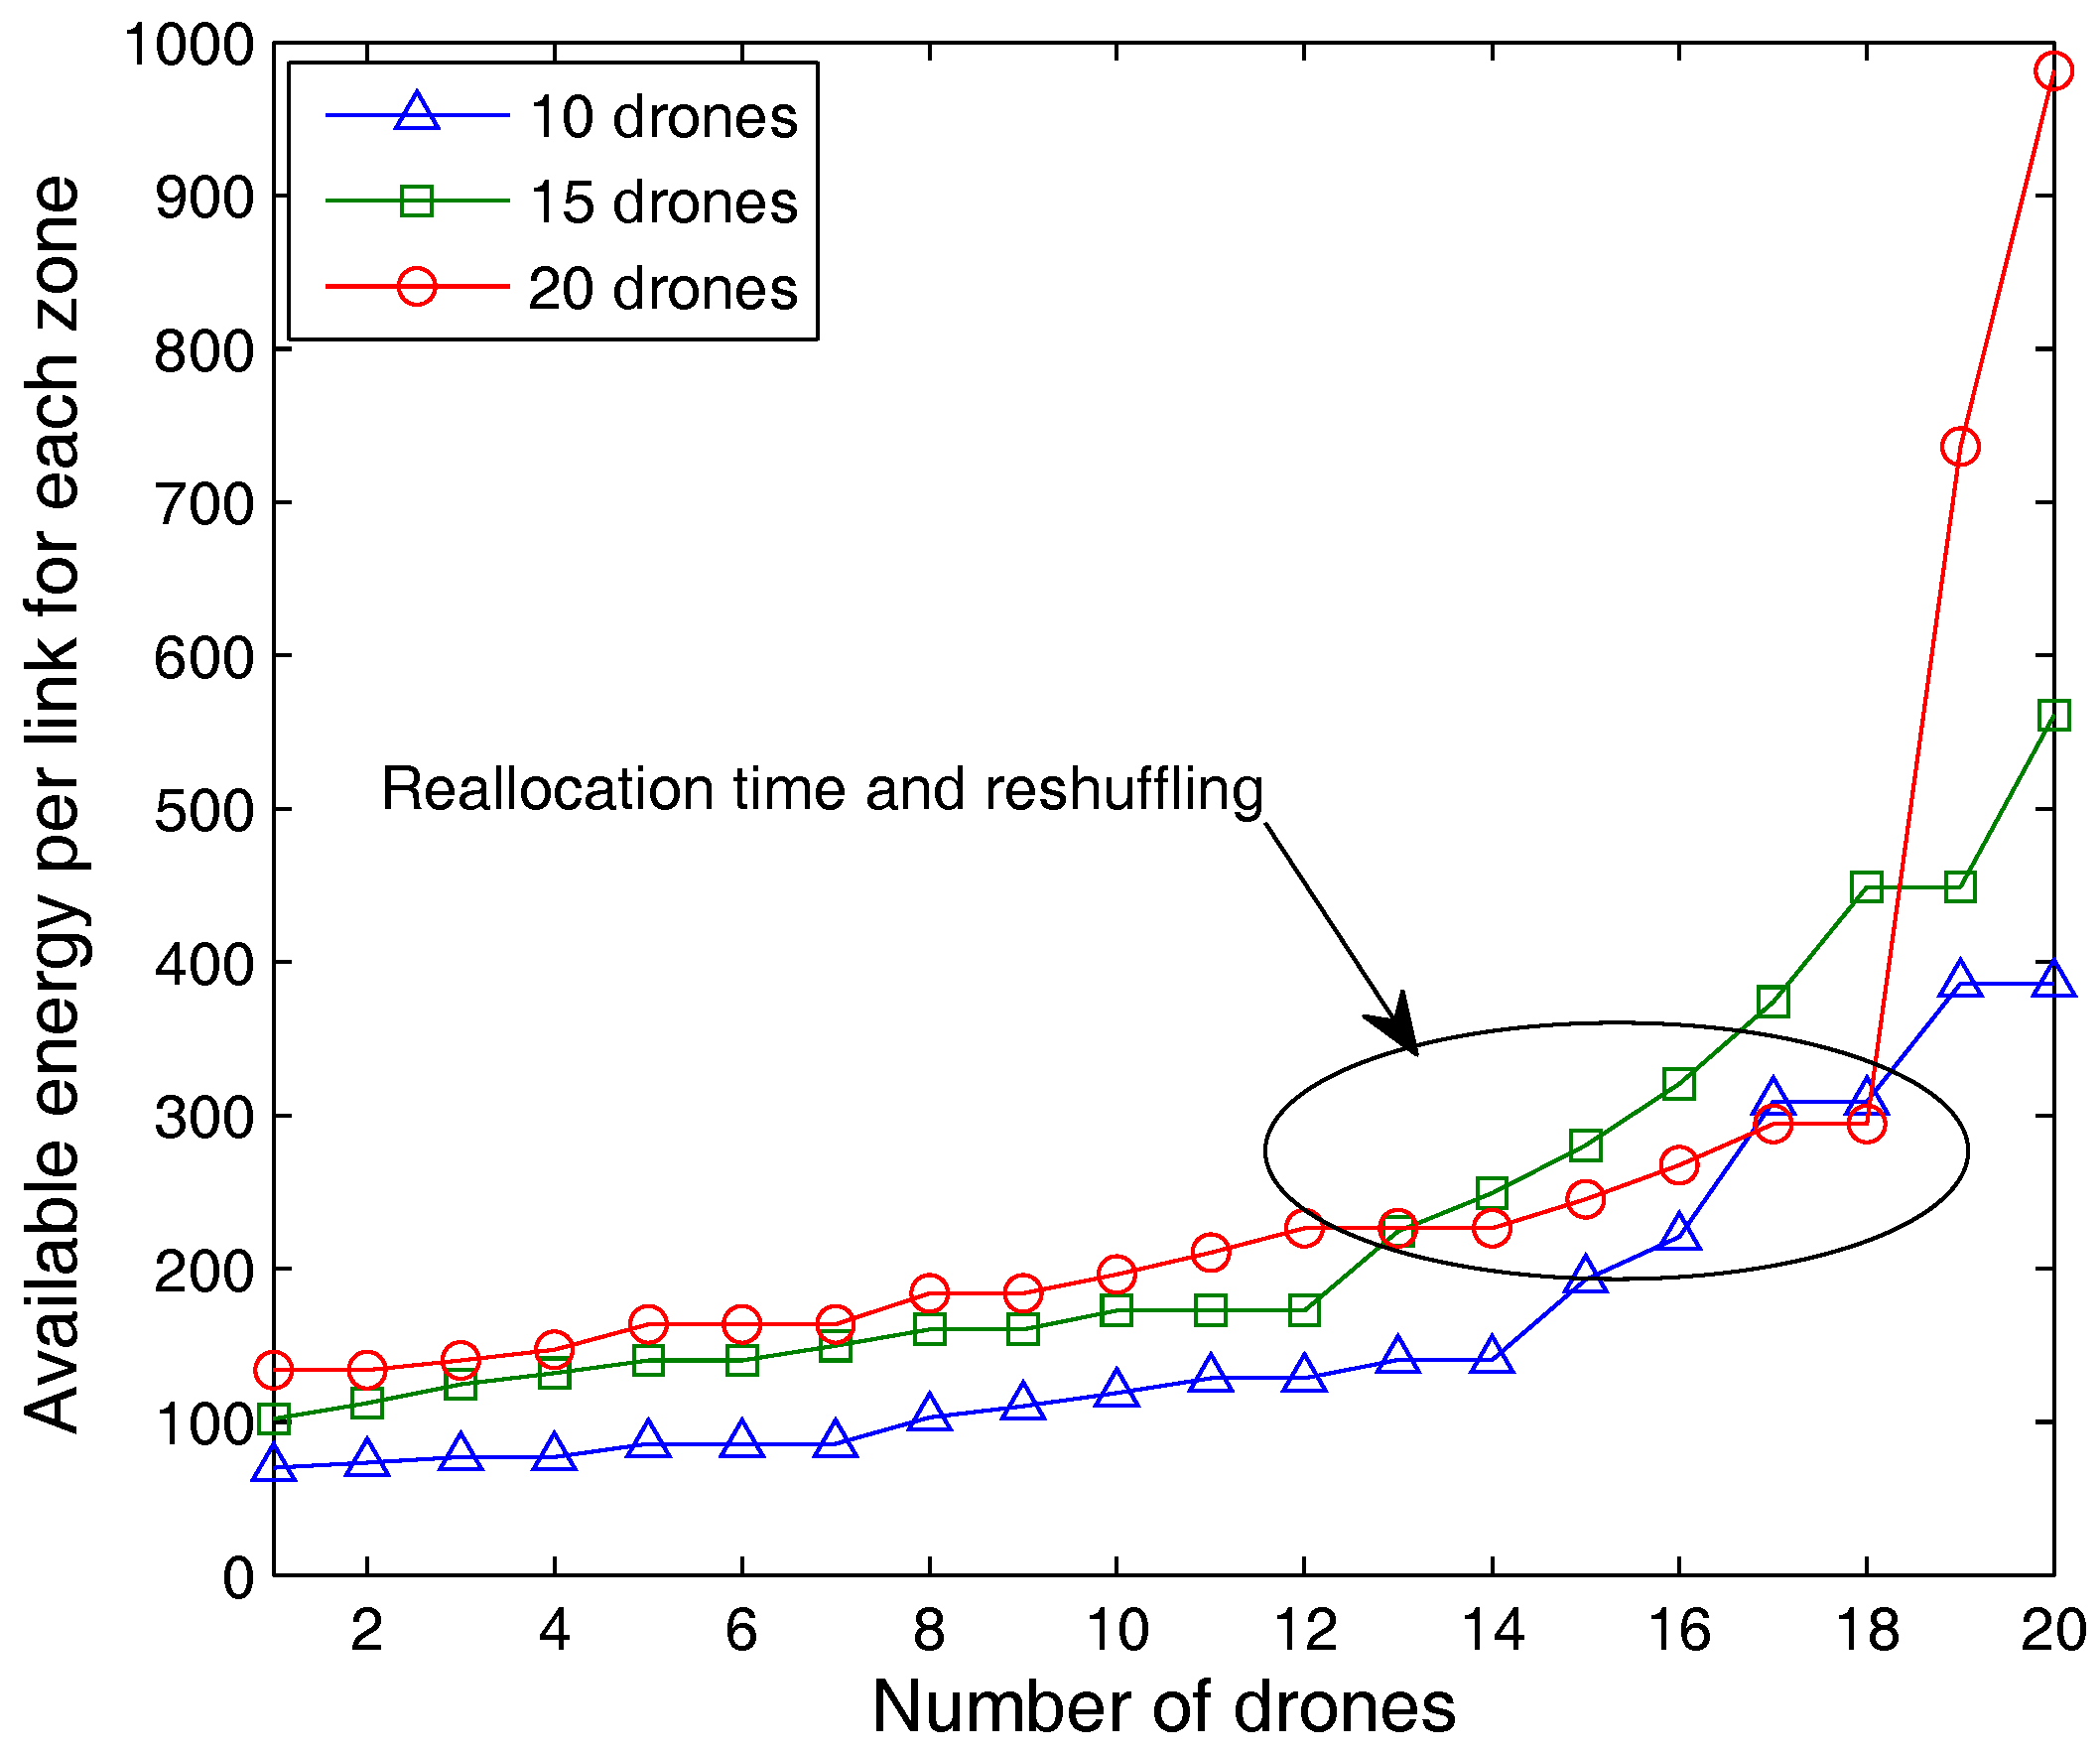
Apart from the above results, the system is also tested for results with the varying number of drones as shown in Figure 9 and Figure 10. The plots in Figure 9 and Figure 10 illustrate the outcomes for area stress and available energy of each link, respectively, for a different set of drones. The result for area stress shows that the setup with 20 drones causes 89.7% and 53.0% lower burden on the network than the setups with 10 and 15 drones, respectively. This suggests that increasing drones can help managing network connectivity as well as support multiple LoRaWAN gateways than can support surveillance even at a lower bit rate. Further, the per-link available energy of the network increases with an increase in the number of LoRaWAN gateways (drones). It is noticed that a network with 20 drones observes 39.2% and 12.6% more available energy for each active link in comparison with the networks operating with 10 and 15 drones, respectively. The decrement in the observed values in Figure 10 even for a higher number of drones is due to reallocation and reshuffling operations conducted through Algorithms 1–3. Further, it is noticed that the proposed approach operates with a no failure probability equal to 0.99, which is sufficient enough for demonstrating the capabilities of the proposed model. Thus, from the results presented in this paper, it is evident that the proposed approach of using drones as LoRaWAN gateways for energy-efficient surveillance in ITS provides a fail-safe and highly resilient connectivity even at a low rate of transmissions. Further, the observed overheads and energy consumptions are lowered with no-isolations and low-redundancy even at the higher overlapping of communicating zones.
6. Comparison with State-of-the-Art Solutions
The proposed approach provides fail-safe as well as resilient connectivity between the sensors and the drones during surveillance leading to high conservation of energy. The proposed approach uses drones as LoRaWAN gateways and allows extensive monitoring, coverage and communication with the underlying users. With the help of area stress metric, the proposed approach is able to identify the amount of energy that will be consumed by the involved entities during their operations. The novelty of the proposed approach is depicted in terms of the network model, energy-efficient surveillance and low-failure probability. Over the years, drones or UAVs have been exhaustively used for surveillance but there are limited studies which actually emphasizes the role of drones in ITS. Also, the ones with energy efficient architecture, are unable to support fail-safe communications, and the others with effective surveillance are unable to provide low-power and long-range support as that of LoRaWAN setup. Further, there are limited works that exploited the features of LoRaWAN setup for surveillance purposes.
Most of the existing works focused on capacity, scalability, cooperation and task allocations for drones in ITS [69,70], but advancement to energy-efficient surveillance is little. Despite limited works on the applications of LoRaWAN, some of the key solutions which emphasize on surveillance are identified and compared with the proposed approach as shown in Table 3. The comparisons are drawn for different parameters such as ideology, use of drones, support for cellular and wireless communications, surveillance, energy-efficient deployment, resilience, fail-safe operations, and use of LoRaWAN features. From these comparisons (to the best of authors’ knowledge), it is evident that none of the existing works has utilized the features of drones as well as LoRaWAN for energy-efficient surveillance, and the proposed approach is successful in supporting energy-efficient, fail-safe and highly resilient surveillance by drones for ITS.
7. Conclusions and Future Remarks
Energy efficient surveillance in IoT-ITS is a major issue which needs effective strategies as most of the devices involved in monitoring are battery operated. Majority of the devices involved in urban-surveillance in IoT-ITS are always at an edge of depleting resources that may result in the complete failure of the network. To resolve such a problem, a drone-assisted strategy was proposed in this paper which utilized the concept of LoRaWAN and its architecture for conserving energy via an efficient deployment of drones between the end users and the ground sensors. The proposed approach emphasized on using drones as LoRaWAN gateway and support communication without letting it travel to the application server, thus, saving unnecessary dependence on a centralized server. Further, drone modeling and traffic estimation were performed over the defined network model to form a base for energy efficient connectivity. Next, an intelligent solution for location identification and coverage by drones was proposed followed by energy efficient surveillance and LoRaWAN-based drone communication. Area stress, resilient factor, and energy conservation were the key metrics used for the operations of the proposed approach. The numerical results suggested that the proposed approach can conserve a maximum of 39.2% and a minimum of 12.6% of the total network energy and can improve the area stress by a maximum of 89.7% and a minimum of 53.0% for varying number of drones over a fixed area. It was also observed that the proposed approach can support continuous connectivity with no failure probability as high as 0.99. Thus, it can be concluded that the proposed approach is capable of providing energy efficient surveillance by using drones as LoRaWAN gateway in energy-deficit urban IoT-ITS.
At the moment, the proposed model does not account for the backhaul formed with the drones and LoRaWAN switches. This is marked as a future work and will be developed as an extension to the proposed work. Communication strategies and protocols for data dissemination over the defined network model are also required. Being energy constrained setup, the LoRaWAN infrastructure can be tested with different types of hardware that can facilitate the practical utilization of drones for LoRaWAN-based urban surveillance.
Acknowledgments
This work was supported by Institute for Information & communications Technology Promotion (IITP) grant funded by the Korea government (MSIP) (2015-0-00508, Development of Operating System Security Core Technology for the Smart Lightweight IoT Devices) as well as the Soonchunhyang University Research Fund.
Author Contributions
Conceptualization: Vishal Sharma, Ilsun You, Jae Deok Lim, Jeong Nyeo Kim; Funding acquisition: Ilsun You; Investigation: Vishal Sharma, Ilsun You; Methodology: Vishal Sharma, Ilsun You; Performance Evaluation: Vishal Sharma; Supervision: Ilsun You, Giovanni Pau, Mario Collotta; Validation: Vishal Sharma, Ilsun You, Giovanni Pau, Mario Collotta, Jae Deok Lim, Jeong Nyeo Kim; Visualization: Vishal Sharma, Ilsun You; Writing—original draft: Vishal Sharma, Ilsun You; Writing—review & editing: Vishal Sharma, Ilsun You, Giovanni Pau, Mario Collotta, Jae Deok Lim, Jeong Nyeo Kim.
Conflicts of Interest
The authors declare no conflict of interest.
References
- Zhang, J.; Wang, F.Y.; Wang, K.; Lin, W.H.; Xu, X.; Chen, C. Data-driven intelligent transportation systems: A survey. IEEE Trans. Intell. Transp. Syst. 2011, 12, 1624–1639. [Google Scholar] [CrossRef]
- Lin, Y.; Wang, P.; Ma, M. Intelligent Transportation System (ITS): Concept, Challenge and Opportunity. In Proceedings of the 2017 IEEE 3rd International Conference on Big Data Security on Cloud (BigDataSecurity), IEEE International Conference on High Performance and Smart Computing (HPSC), and IEEE International Conference on Intelligent Data and Security (IDS), Beijing, China, 26–28 May 2017; pp. 167–172. [Google Scholar]
- Saxena, N.; Roy, A.; Sahu, B.J.R.; Kim, H. Efficient IoT Gateway over 5G Wireless: A New Design with Prototype and Implementation Results. IEEE Commun. Mag. 2017, 55, 97–105. [Google Scholar] [CrossRef]
- Arasteh, H.; Hosseinnezhad, V.; Loia, V.; Tommasetti, A.; Troisi, O.; Shafie-khah, M.; Siano, P. Iot-based smart cities: A survey. In Proceedings of the 2016 IEEE 16th International Conference on Environment and Electrical Engineering (EEEIC), Florence, Italy, 7–10 June 2016; pp. 1–6. [Google Scholar]
- Sharma, V.; Song, F.; You, I.; Atiquzzaman, M. Energy efficient device discovery for reliable communication in 5G-based IoT and BSNs using unmanned aerial vehicles. J. Netw. Comput. Appl. 2017, 97, 79–95. [Google Scholar] [CrossRef]
- Luo, Y.; Xiang, Y.; Cao, K.; Li, K. A dynamic automated lane change maneuver based on vehicle-to-vehicle communication. Transp. Res. C Emerg. Technol. 2016, 62, 87–102. [Google Scholar] [CrossRef]
- Liu, X.; Liu, W.; Ma, H.; Fu, H. Large-scale vehicle re-identification in urban surveillance videos. In Proceedings of the 2016 IEEE International Conference on Multimedia and Expo (ICME), Seattle, WA, USA, 11–15 July 2016; pp. 1–6. [Google Scholar]
- Chen, N.; Chen, Y.; You, Y.; Ling, H.; Liang, P.; Zimmermann, R. Dynamic urban surveillance video stream processing using fog computing. In Proceedings of the 2016 IEEE Second International Conference on Multimedia Big Data (BigMM), Taipei, Taiwan, 20–22 April 2016; pp. 105–112. [Google Scholar]
- Jensen, O.B. Drone city-power, design and aerial mobility in the age of “smart cities”. Geogr. Helv. 2016, 71, 67–75. [Google Scholar] [CrossRef]
- Jensen, O.B. New ‘Foucauldian Boomerangs’: Drones and Urban Surveillance. Surveill. Soc. 2016, 14, 20–33. [Google Scholar]
- Ramon, P.; Arrue, B.C.; Acevedo, J.J.; Ollero, A. Visual Surveillance System with Multi-UAVs Under Communication Constrains. In Proceedings of the Robot 2015: Second Iberian Robotics Conference, Lisbon, Portugal, 19–21 November 2016; pp. 705–713. [Google Scholar]
- McNeal, G.S. Drones and the future of aerial surveillance. George Wash. Law Rev. 2016, 84, 354. [Google Scholar]
- Bor-Yaliniz, I.; Yanikomeroglu, H. The new frontier in RAN heterogeneity: Multi-tier drone-cells. IEEE Commun. Mag. 2016, 54, 48–55. [Google Scholar] [CrossRef]
- Zema, N.R.; Mitton, N.; Ruggeri, G. Using location services to autonomously drive flying mobile sinks in wireless sensor networks. In Proceedings of the International Conference on Ad Hoc Networks, Benidorm, Spain, 22–27 June 2014; pp. 180–191. [Google Scholar]
- Erdelj, M.; Król, M.; Natalizio, E. Wireless sensor networks and multi-UAV systems for natural disaster management. Comput. Netw. 2017, 124, 72–86. [Google Scholar] [CrossRef]
- Sharma, V.; You, I.; Leu, F.; Atiquzzaman, M. Secure and efficient protocol for fast handover in 5G mobile Xhaul networks. J. Netw. Comput. Appl. 2018, 102, 38–57. [Google Scholar] [CrossRef]
- Desnitsky, V.; Levshun, D.; Chechulin, A.; Kotenko, I.V. Design Technique for Secure Embedded Devices: Application for Creation of Integrated Cyber-Physical Security System. JoWUA 2016, 7, 60–80. [Google Scholar]
- Carniani, E.; Costantino, G.; Marino, F.; Martinelli, F.; Mori, P. Enhancing Video Surveillance with Usage Control and Privacy-Preserving Solutions. JoWUA 2016, 7, 20–40. [Google Scholar]
- Baiardi, F.; Tonelli, F.; Isoni, L. Application Vulnerabilities in Risk Assessment and Management. JoWUA 2016, 7, 41–59. [Google Scholar]
- Sharma, V.; Bennis, M.; Kumar, R. UAV-assisted heterogeneous networks for capacity enhancement. IEEE Commun. Lett. 2016, 20, 1207–1210. [Google Scholar] [CrossRef]
- Sharma, V.; Sabatini, R.; Ramasamy, S. UAVs assisted delay optimization in heterogeneous wireless networks. IEEE Commun. Lett. 2016, 20, 2526–2529. [Google Scholar] [CrossRef]
- Sharma, V.; Kumar, R. A cooperative network framework for multi-UAV guided ground ad hoc networks. J. Intell. Robot. Syst. 2015, 77, 629–652. [Google Scholar] [CrossRef]
- Li, J.; Chen, X.; Huang, X.; Tang, S.; Xiang, Y.; Hassan, M.M.; Alelaiwi, A. Secure distributed deduplication systems with improved reliability. IEEE Trans. Comput. 2015, 64, 3569–3579. [Google Scholar] [CrossRef]
- Chen, X.; Li, J.; Weng, J.; Ma, J.; Lou, W. Verifiable computation over large database with incremental updates. IEEE Trans. Comput. 2016, 65, 3184–3195. [Google Scholar] [CrossRef]
- Cai, J.; Wang, Y.; Liu, Y.; Luo, J.Z.; Wei, W.; Xu, X. Enhancing network capacity by weakening community structure in scale-free network. Future Gener. Comput. Syst. 2017. [Google Scholar] [CrossRef]
- Li, J.; Chen, X.; Li, M.; Li, J.; Lee, P.; Lou, W. Secure Deduplication with Efficient and Reliable Convergent Key Management. IEEE Trans. Parallel Distrib. Syst. 2014, 25, 1615–1625. [Google Scholar] [CrossRef]
- Hakiri, A.; Berthou, P.; Gokhale, A.; Abdellatif, S. Publish/subscribe-enabled software defined networking for efficient and scalable IoT communications. IEEE Commun. Mag. 2015, 53, 48–54. [Google Scholar] [CrossRef]
- Shin, D.; Sharma, V.; Kim, J.; Kwon, S.; You, I. Secure and Efficient Protocol for Route Optimization in PMIPv6-Based Smart Home IoT Networks. IEEE Access 2017, 5, 11100–11117. [Google Scholar] [CrossRef]
- Wei, Z.; Zhao, B. A Space Information Service Forwarding Mechnism Based on Software Defined Network. J. Internet Serv. Inf. Secur. 2017, 7, 48–60. [Google Scholar]
- Li, G.; Zhou, H.; Li, G.; Feng, B. Application-aware and Dynamic Security Function Chaining for Mobile Networks. J. Internet Serv. Inf. Secur. 2017, 7, 21–34. [Google Scholar]
- Neumann, P.; Montavont, J.; Noël, T. Indoor deployment of low-power wide area networks (LPWAN): A LoRaWAN case study. In Proceedings of the 2016 IEEE 12th International Conference on Wireless and Mobile Computing, Networking and Communications (WiMob), New York, NY, USA, 17–19 October 2016; pp. 1–8. [Google Scholar]
- Bardyn, J.P.; Melly, T.; Seller, O.; Sornin, N. IoT: The era of LPWAN is starting now. In Proceedings of the 42nd European Solid-State Circuits Conference (ESSCIRC Conference 2016), Lausanne, Switzerland, 12–15 September 2016; pp. 25–30. [Google Scholar]
- Sanchez-Iborra, R.; Gamez, J.S.; Santa, J.; Fernandez, P.J.; Skarmeta, A.F. Integrating LP-WAN Communications within the Vehicular Ecosystem. J. Internet Serv. Inf. Secur. 2017, 7, 45–56. [Google Scholar]
- Garcia, D.; Marin, R.; Kandasamy, A.; Pelov, A. LoRaWAN Authentication in RADIUS Draft-Garcia-Radext-Radius-Lorawan-03. 2 May 2017. Available online: https://www.ietf.org/archive/id/draft-garcia-radext-radius-lorawan-03.txt (accessed on 26 December 2017).
- Garcia, D.; Marin, R.; Kandasamy, A.; Pelov, A. LoRaWAN Authentication in Diameter Draft-Garcia-Dime-Diameter-Lorawan-00. 30 May 2016. Available online: https://tools.ietf.org/html/draft-garcia-dime-diameter-lorawan-00 (accessed on 26 December 2017).
- LoRa Alliance Technology. Available online: https://www.lora-alliance.org/technology (accessed on 25 January 2018).
- Casals, L.; Mir, B.; Vidal, R.; Gomez, C. Modeling the Energy Performance of LoRaWAN. Sensors 2017, 17, 2364. [Google Scholar]
- Naoui, S.; Elhdhili, M.E.; Saidane, L.A. Enhancing the security of the IoT LoraWAN architecture. In Proceedings of the International Conference on Performance Evaluation and Modeling in Wired and Wireless Networks (PEMWN), Paris, France, 22–25 November 2016; pp. 1–7. [Google Scholar]
- Sornin, N.; Luis, M.; Eirich, T.; Kramp, T.; Hersent, O. LoRaWAN Specification V1.0.2; Technical Report; LoRa Alliance: Beaverton, OR, USA, 2016. [Google Scholar]
- Motlagh, N.H.; Bagaa, M.; Taleb, T. UAV-Based IoT Platform: A Crowd Surveillance Use Case. IEEE Commun. Mag. 2017, 55, 128–134. [Google Scholar] [CrossRef]
- Wu, D.; Arkhipov, D.I.; Kim, M.; Talcott, C.L.; Regan, A.C.; McCann, J.A.; Venkatasubramanian, N. ADDSEN: Adaptive data processing and dissemination for drone swarms in urban sensing. IEEE Trans. Comput. 2017, 66, 183–198. [Google Scholar] [CrossRef]
- Naqvi, S.A.R.; Hassan, S.A.; Pervaiz, H.; Ni, Q. Drone-Aided Communication as a Key Enabler for 5G and Resilient Public Safety Networks. IEEE Commun. Mag. 2018, 56, 36–42. [Google Scholar] [CrossRef]
- Menouar, H.; Guvenc, I.; Akkaya, K.; Uluagac, A.S.; Kadri, A.; Tuncer, A. UAV-Enabled Intelligent Transportation Systems for the Smart City: Applications and Challenges. IEEE Commun. Mag. 2017, 55, 22–28. [Google Scholar]
- Zeng, Y.; Zhang, R. Energy-efficient UAV communication with trajectory optimization. IEEE Trans. Wirel. Commun. 2017, 16, 3747–3760. [Google Scholar] [CrossRef]
- Sharma, V.; You, I.; Kumar, R. Energy efficient data dissemination in multi-UAV coordinated wireless sensor networks. Mob. Inf. Syst. 2016, 2016, 8475820. [Google Scholar] [CrossRef]
- Trotta, A.; D’Andreagiovanni, F.; Di Felice, M.; Natalizio, E.; Chowdhury, K.R. When UAVs Ride A Bus: Towards Energy-efficient City-scale Video Surveillance. In Proceedings of the 2018 IEEE International Conference on Computer Communications (INFOCOM), Honolulu, HI, USA, 16–19 April 2018. [Google Scholar]
- Mathur, S.; Sankar, A.; Prasan, P.; Iannucci, B. Energy Analysis of LoRaWAN Technology for Traffic Sensing Applications. In Proceedings of the Intelligent Transportation Society of America (ITS) World Congress, Montréal, QC, Canada, 29 October–2 November 2017; Available online: https://works.bepress.com/bob/34/ (accessed on 25 January 2018).
- Adame Vázquez, T.; Barrachina-Muñoz, S.; Bellalta, B.; Bel, A. HARE: Supporting Efficient Uplink Multi-Hop Communications in Self-Organizing LPWANs. Sensors 2018, 18, 115. [Google Scholar] [CrossRef] [PubMed]
- Kennington, J.; Olinick, E.; Rajan, D. Wireless Network Design: Optimization Models and Solution Procedures; Springer: New York, NY, USA, 2010; ISBN 978-1-4419-6111-2. [Google Scholar]
- Bauschert, T.; Busing, C.; D’Andreagiovanni, F.; Koster, A.C.; Kutschka, M.; Steglich, U. Network planning under demand uncertainty with robust optimization. IEEE Commun. Mag. 2014, 52, 178–185. [Google Scholar] [CrossRef]
- Chiaraviglio, L.; Amorosi, L.; Cartolano, S.; Blefari-Melazzi, N.; Dell’Olmo, P.; Shojafar, M.; Salsano, S. Optimal superfluid management of 5G networks. In Proceedings of the 2017 IEEE Conference on Network Softwarization (NetSoft), Bologna, Italy, 3–7 July 2017; pp. 1–9. [Google Scholar]
- Shojafar, M.; Chiaraviglio, L.; Blefari-Melazzi, N.; Salsano, S. P5G: A bio-inspired algorithm for the superfluid management of 5G Networks. In Proceedings of the 18th IEEE GLOBECOM, Singapore, 4–8 December 2017; pp. 4–8. [Google Scholar]
- D’Andreagiovanni, F.; Mannino, C.; Sassano, A. GUB covers and power-indexed formulations for wireless network design. Manag. Sci. 2013, 59, 142–156. [Google Scholar] [CrossRef]
- D’Andreagiovanni, F.; Mett, F.; Nardin, A.; Pulaj, J. Integrating LP-guided variable fixing with MIP heuristics in the robust design of hybrid wired-wireless FTTx access networks. Appl. Soft Comput. 2017, 61, 1074–1087. [Google Scholar] [CrossRef]
- Garofalaki, Z.; Kallergis, D.; Katsikogiannis, G.; Douligeris, C. A Policy-Aware Model for Intelligent Transportation Systems. arXiv, 2017; arXiv:1706.04803. [Google Scholar]
- Sharma, V.; Chen, H.C.; Kumar, R. Driver behaviour detection and vehicle rating using multi-UAV coordinated vehicular networks. J. Comput. Syst. Sci. 2017, 86, 3–32. [Google Scholar] [CrossRef]
- Portelinha Júnior, F.M.; Carlos Zambroni de Souza, A.; Castilla, M.; Queiroz Oliveira, D.; Ribeiro, P.F. Control Strategies for Improving Energy Efficiency and Reliability in Autonomous Microgrids with Communication Constraints. Energies 2017, 10, 1443. [Google Scholar] [CrossRef]
- Afzal, B.; Alvi, S.A.; Shah, G.A.; Mahmood, W. Energy efficient context aware traffic scheduling for IoT applications. Ad Hoc Netw. 2017, 62, 101–115. [Google Scholar] [CrossRef]
- Memos, V.A.; Psannis, K.E.; Ishibashi, Y.; Kim, B.G.; Gupta, B. An Efficient Algorithm for Media-based Surveillance System (EAMSuS) in IoT Smart City Framework. Future Gener. Comput. Syst. 2017. [Google Scholar] [CrossRef]
- Zhang, B.; Liu, C.H.; Tang, J.; Xu, Z.; Ma, J.; Wang, W. Learning-based Energy-Efficient Data Collection by Unmanned Vehicles in Smart Cities. IEEE Trans. Ind. Inform. 2017. [Google Scholar] [CrossRef]
- Magrin, D.; Centenaro, M.; Vangelista, L. Performance evaluation of LoRa networks in a smart city scenario. In Proceedings of the 2017 IEEE International Conference on Communications (ICC), Paris, France, 21–25 May 2017; pp. 1–7. [Google Scholar]
- Cuomo, F.; Campo, M.; Caponi, A.; Bianchi, G.; Rossini, G.; Pisani, P. EXPLoRa: Extending the performance of LoRa by suitable spreading factor allocations. In Proceedings of the 2017 IEEE 13th International Conference on Wireless and Mobile Computing, Networking and Communications (WiMob), Rome, Italy, 9–11 October 2017; pp. 1–8. [Google Scholar]
- Chen, M.; Mozaffari, M.; Saad, W.; Yin, C.; Debbah, M.; Hong, C.S. Caching in the sky: Proactive deployment of cache-enabled unmanned aerial vehicles for optimized quality-of-experience. IEEE J. Sel. Areas Commun. 2017, 35, 1046–1061. [Google Scholar] [CrossRef]
- Weibull Reliability. Available online: http://www.weibull.com/hotwire/issue151/hottopics151.htm (accessed on 18 January 2018).
- Miller, R.G., Jr. Survival Analysis; John Wiley & Sons: Chichester, UK; New York, NY, USA, 2011; Volume 66. [Google Scholar]
- Maunder, E.; Moitinho de Almeida, J.; Ramsay, A. Visualisation of Stress Fields—From Stress Trajectories to Strut & Tie Models. In Proceedings of the 10th Annual Conference of the Association for Computational Mechanics in Engineering, Swansea, WA, USA, 14–17 April 2002; pp. 31–34. [Google Scholar]
- Peterson, R.E.; Peterson, R. Stress Concentration Factors; John Wiley and Sons: Hoboken, NJ, USA, 1967. [Google Scholar]
- Finkelstein, M. Failure Rate Modelling for Reliability and Risk; Springer Science & Business Media: London, UK, 2008. [Google Scholar]
- Mikhaylov, K.; Petaejaejaervi, J.; Haenninen, T. Analysis of capacity and scalability of the LoRa low power wide area network technology. In Proceedings of the 22th European Wireless Conference, Oulu, Finland, 18–20 May 2016; pp. 1–6. [Google Scholar]
- Sharma, V.; Kumar, R. Cooperative frameworks and network models for flying ad hoc networks: A survey. Concurr. Comput. Pract. Exp. 2017, 29, e3931. [Google Scholar] [CrossRef]
- Reda, H.T.; Daely, P.T.; Kharel, J.; Shin, S.Y. On the application of IoT: Meteorological information display system based on LoRa wireless communication. IETE Tech. Rev. 2017. [Google Scholar] [CrossRef]
- Pham, C. Low-cost, low-power and long-range image sensor for visual surveillance. In Proceedings of the 2nd Workshop on Experiences in the Design and Implementation of Smart Objects, New York, NY, USA, 3–7 October 2016; pp. 35–40. [Google Scholar]
- Zhan, W.; Wang, W.; Chen, N.; Wang, C. Efficient UAV path planning with multiconstraints in a 3D large battlefield environment. Math. Prob. Eng. 2014, 2014, 597092. [Google Scholar] [CrossRef]
- Samad, T.; Bay, J.S.; Godbole, D. Network-centric systems for military operations in urban terrain: The role of UAVs. Proc. IEEE 2007, 95, 92–107. [Google Scholar] [CrossRef]
- Xu, B.; Xu, X.; Own, C.M. On the feature detection of nonconforming objects with automated drone surveillance. In Proceedings of the 3rd International Conference on Communication and Information Processing, Tokyo, Japan, 24–26 November 2017; pp. 484–489. [Google Scholar]
- Ding, G.; Wu, Q.; Zhang, L.; Lin, Y.; Tsiftsis, T.A.; Yao, Y.D. An Amateur Drone Surveillance System Based on the Cognitive Internet of Things. IEEE Commun. Mag. 2018, 56, 29–35. [Google Scholar] [CrossRef]
- Scherer, J.; Rinner, B. Short and full horizon motion planning for persistent multi-UAV surveillance with energy and communication constraints. In Proceedings of the 2017 IEEE/RSJ International Conference on Intelligent Robots and Systems (IROS), Vancouver, BC, Canada, 24–28 September 2017; pp. 230–235. [Google Scholar]
Figure 1.
LoRaWAN properties, advantages and disadvantages.

Figure 2.
An exemplary illustration of drone-enabled LoRaWAN-based surveillance in ITS.

Figure 3.
An overview of drone modeling and traffic estimation via network state formations.
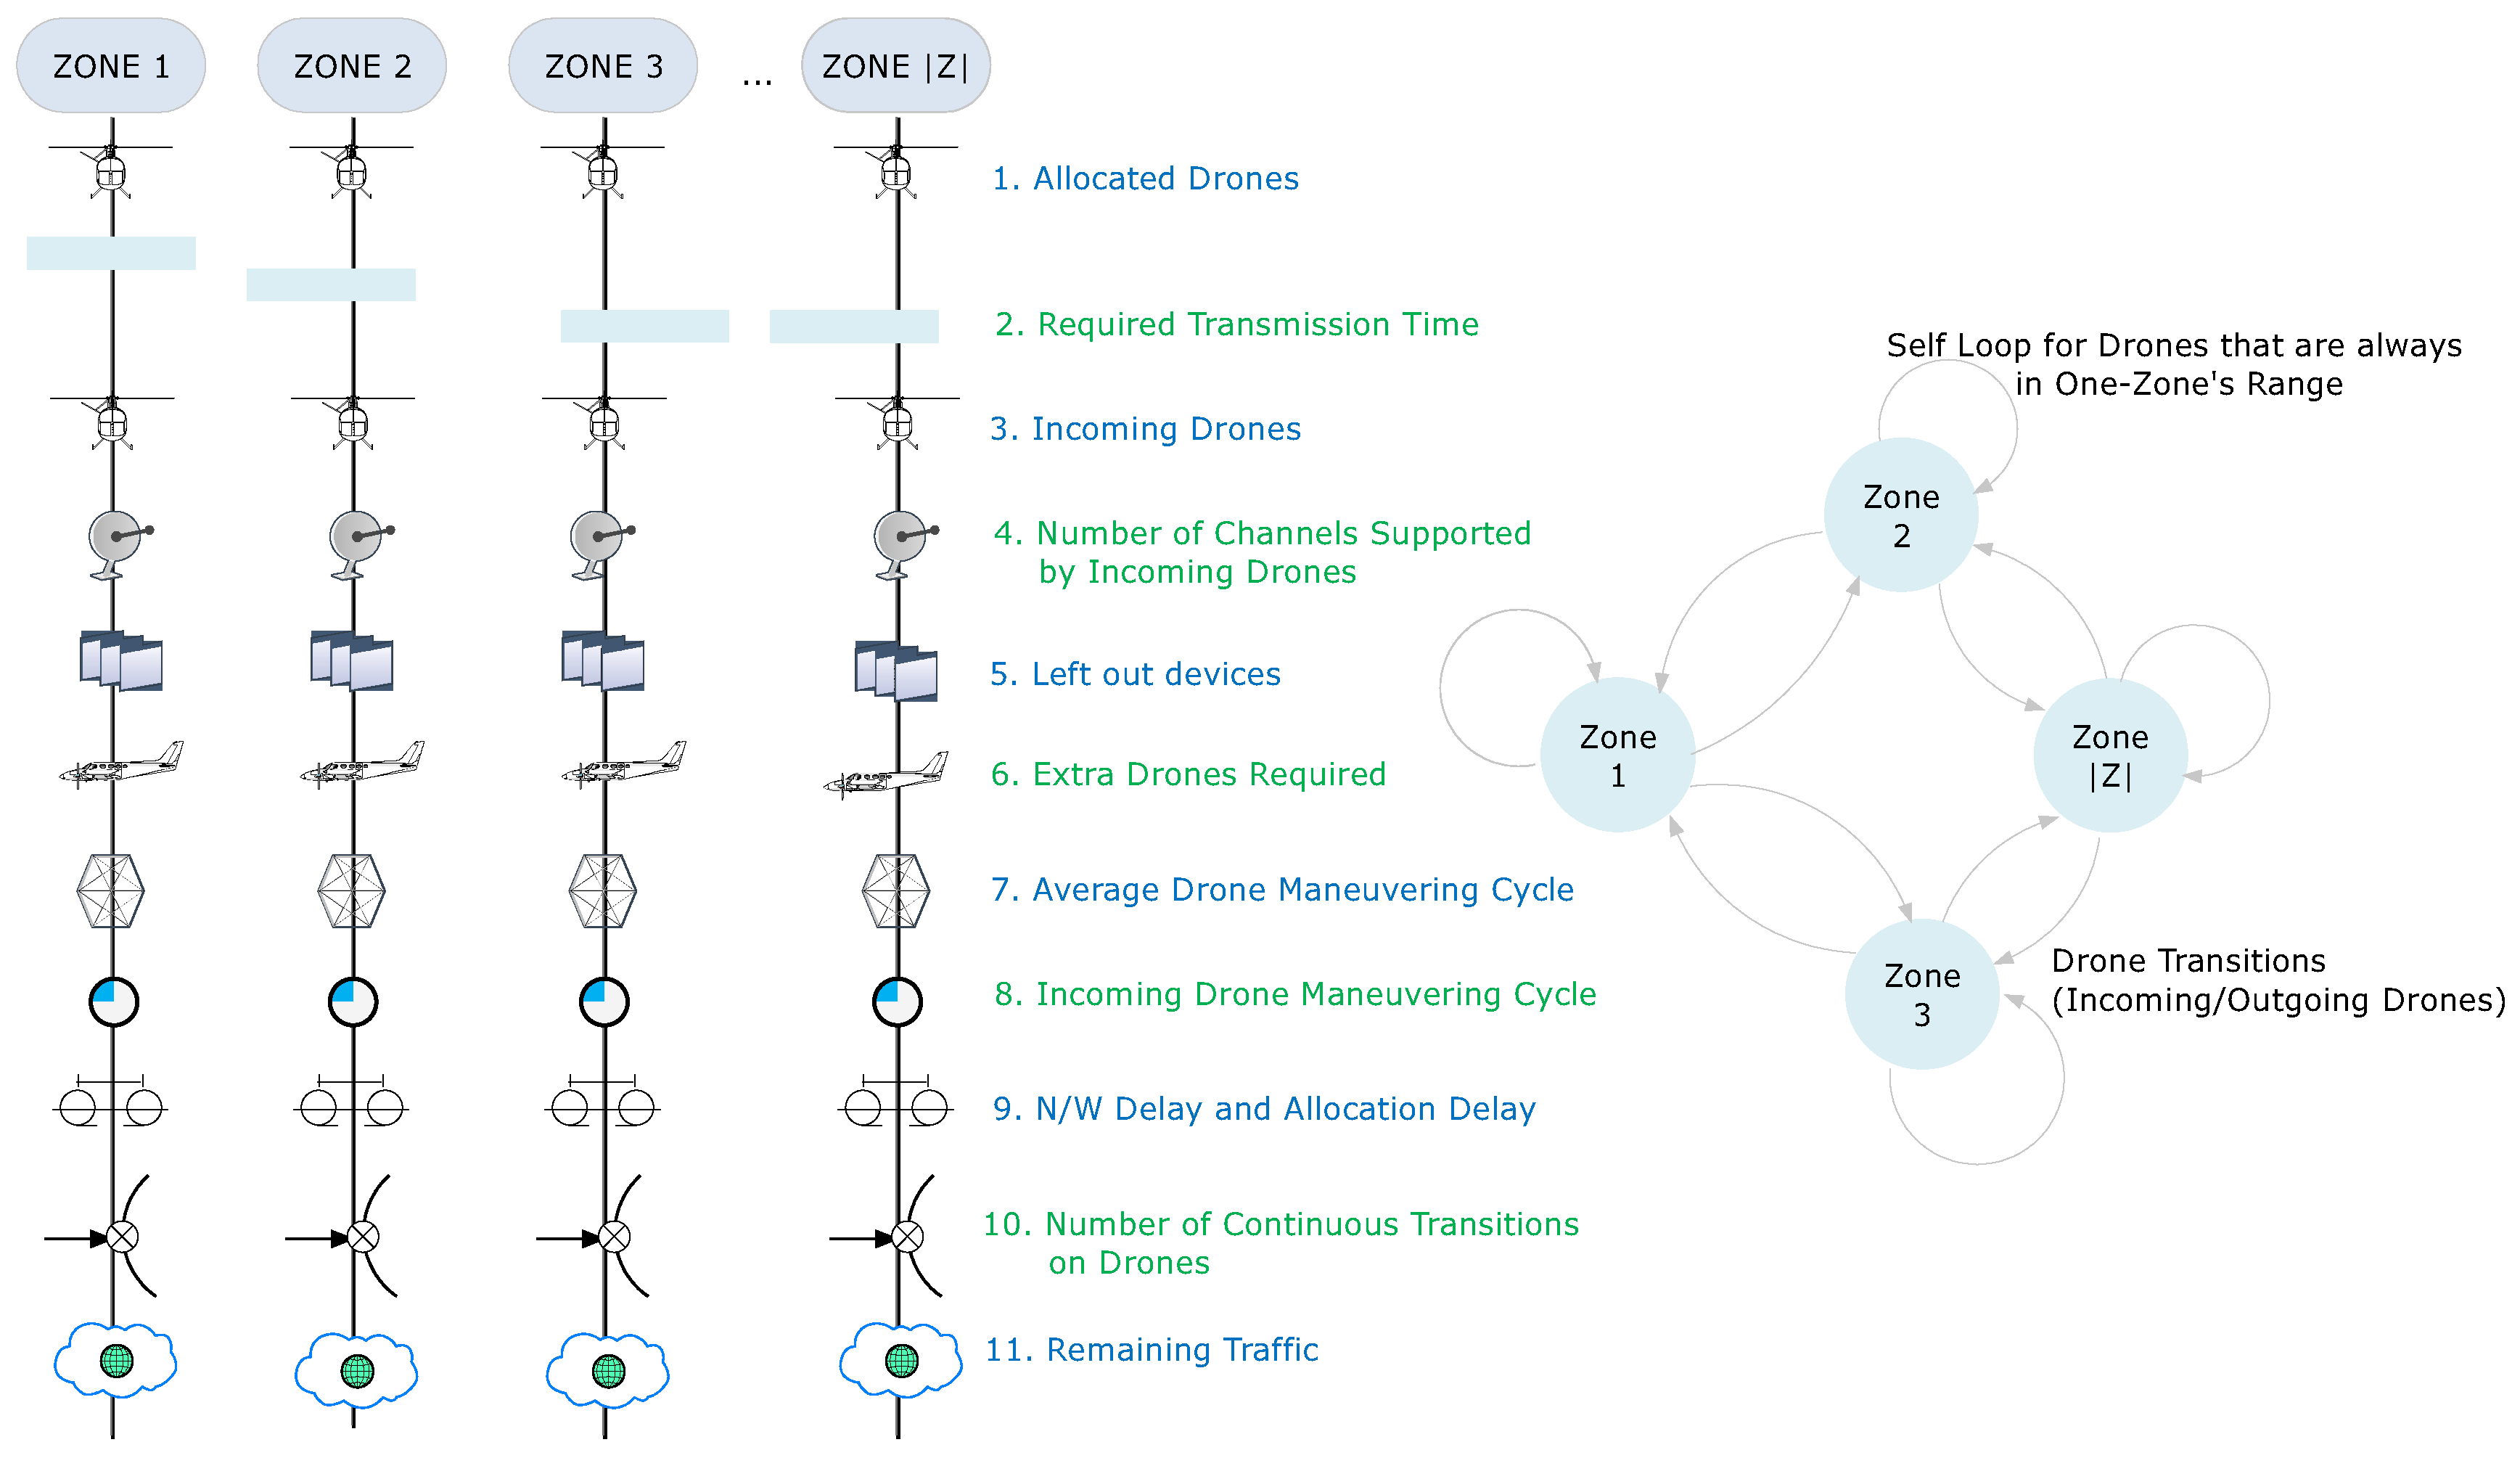
Figure 4.
Average degree of each device vs. total number of transmitting devices.

Figure 5.
Reliability of the network vs. frequency of received power to the thresholds for transmission.
Figure 5.
Reliability of the network vs. frequency of received power to the thresholds for transmission.
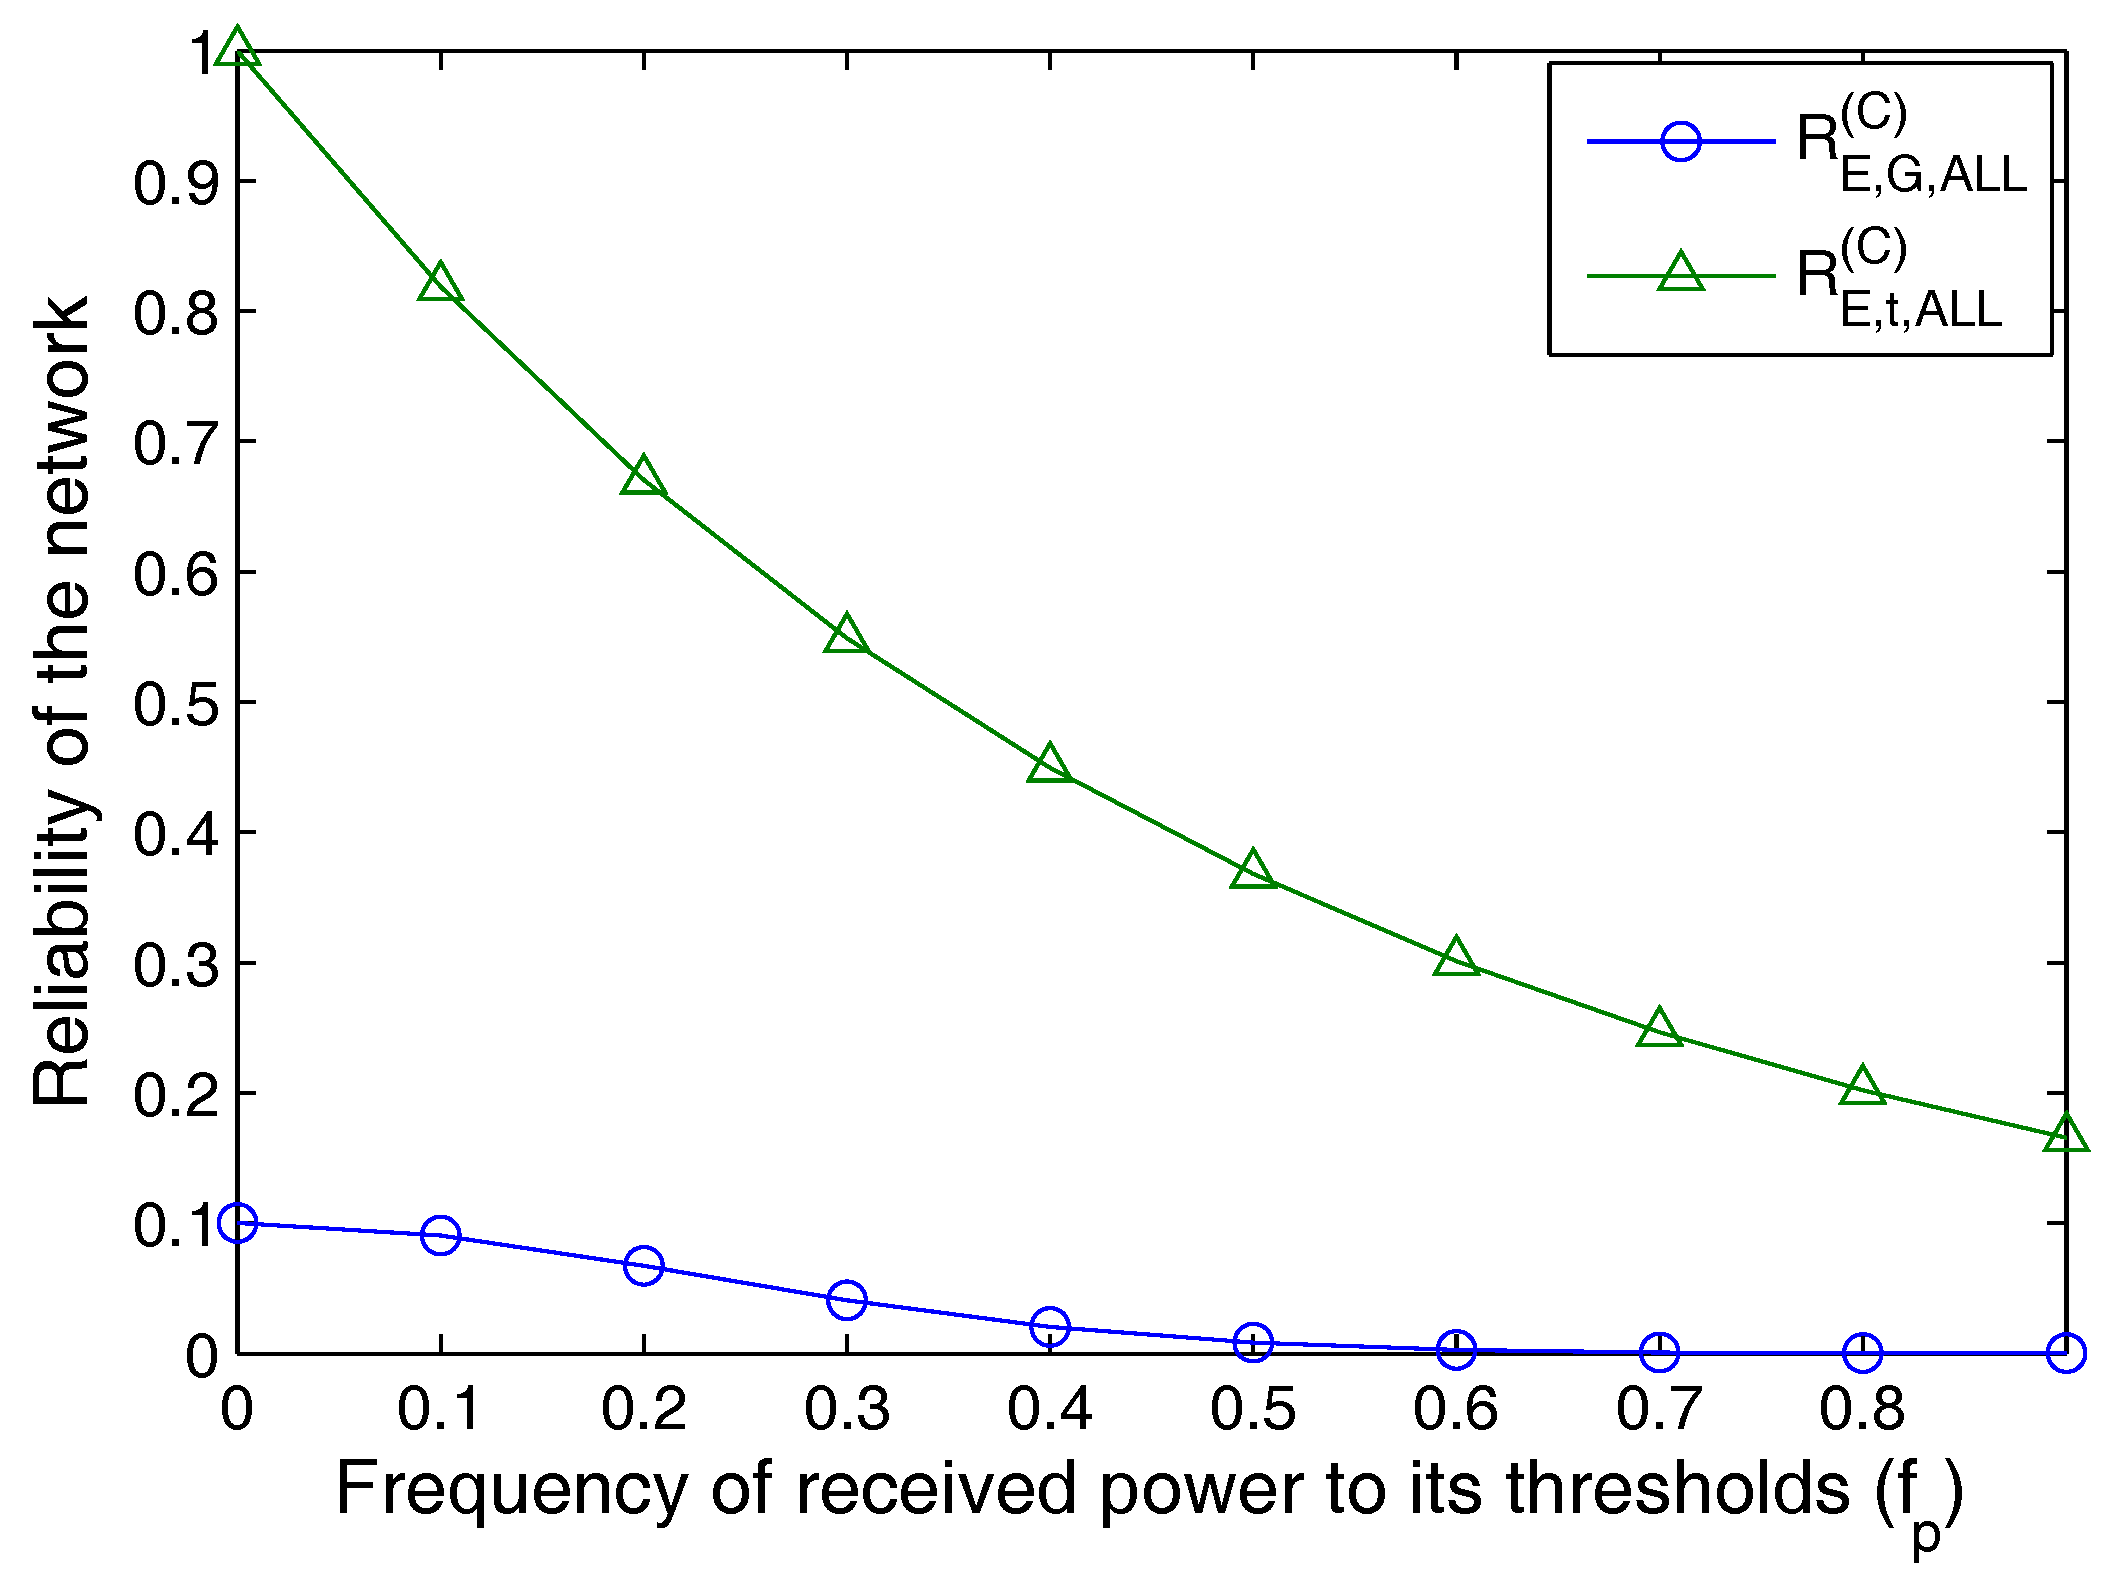
Figure 6.
Number of overlaps identified vs. observation values for area stress.

Figure 7.
Resilient factor and reliability vs. radio range of drones.

Figure 8.
Available energy for overlapping zones for time t vs. increasing number of overlaps.
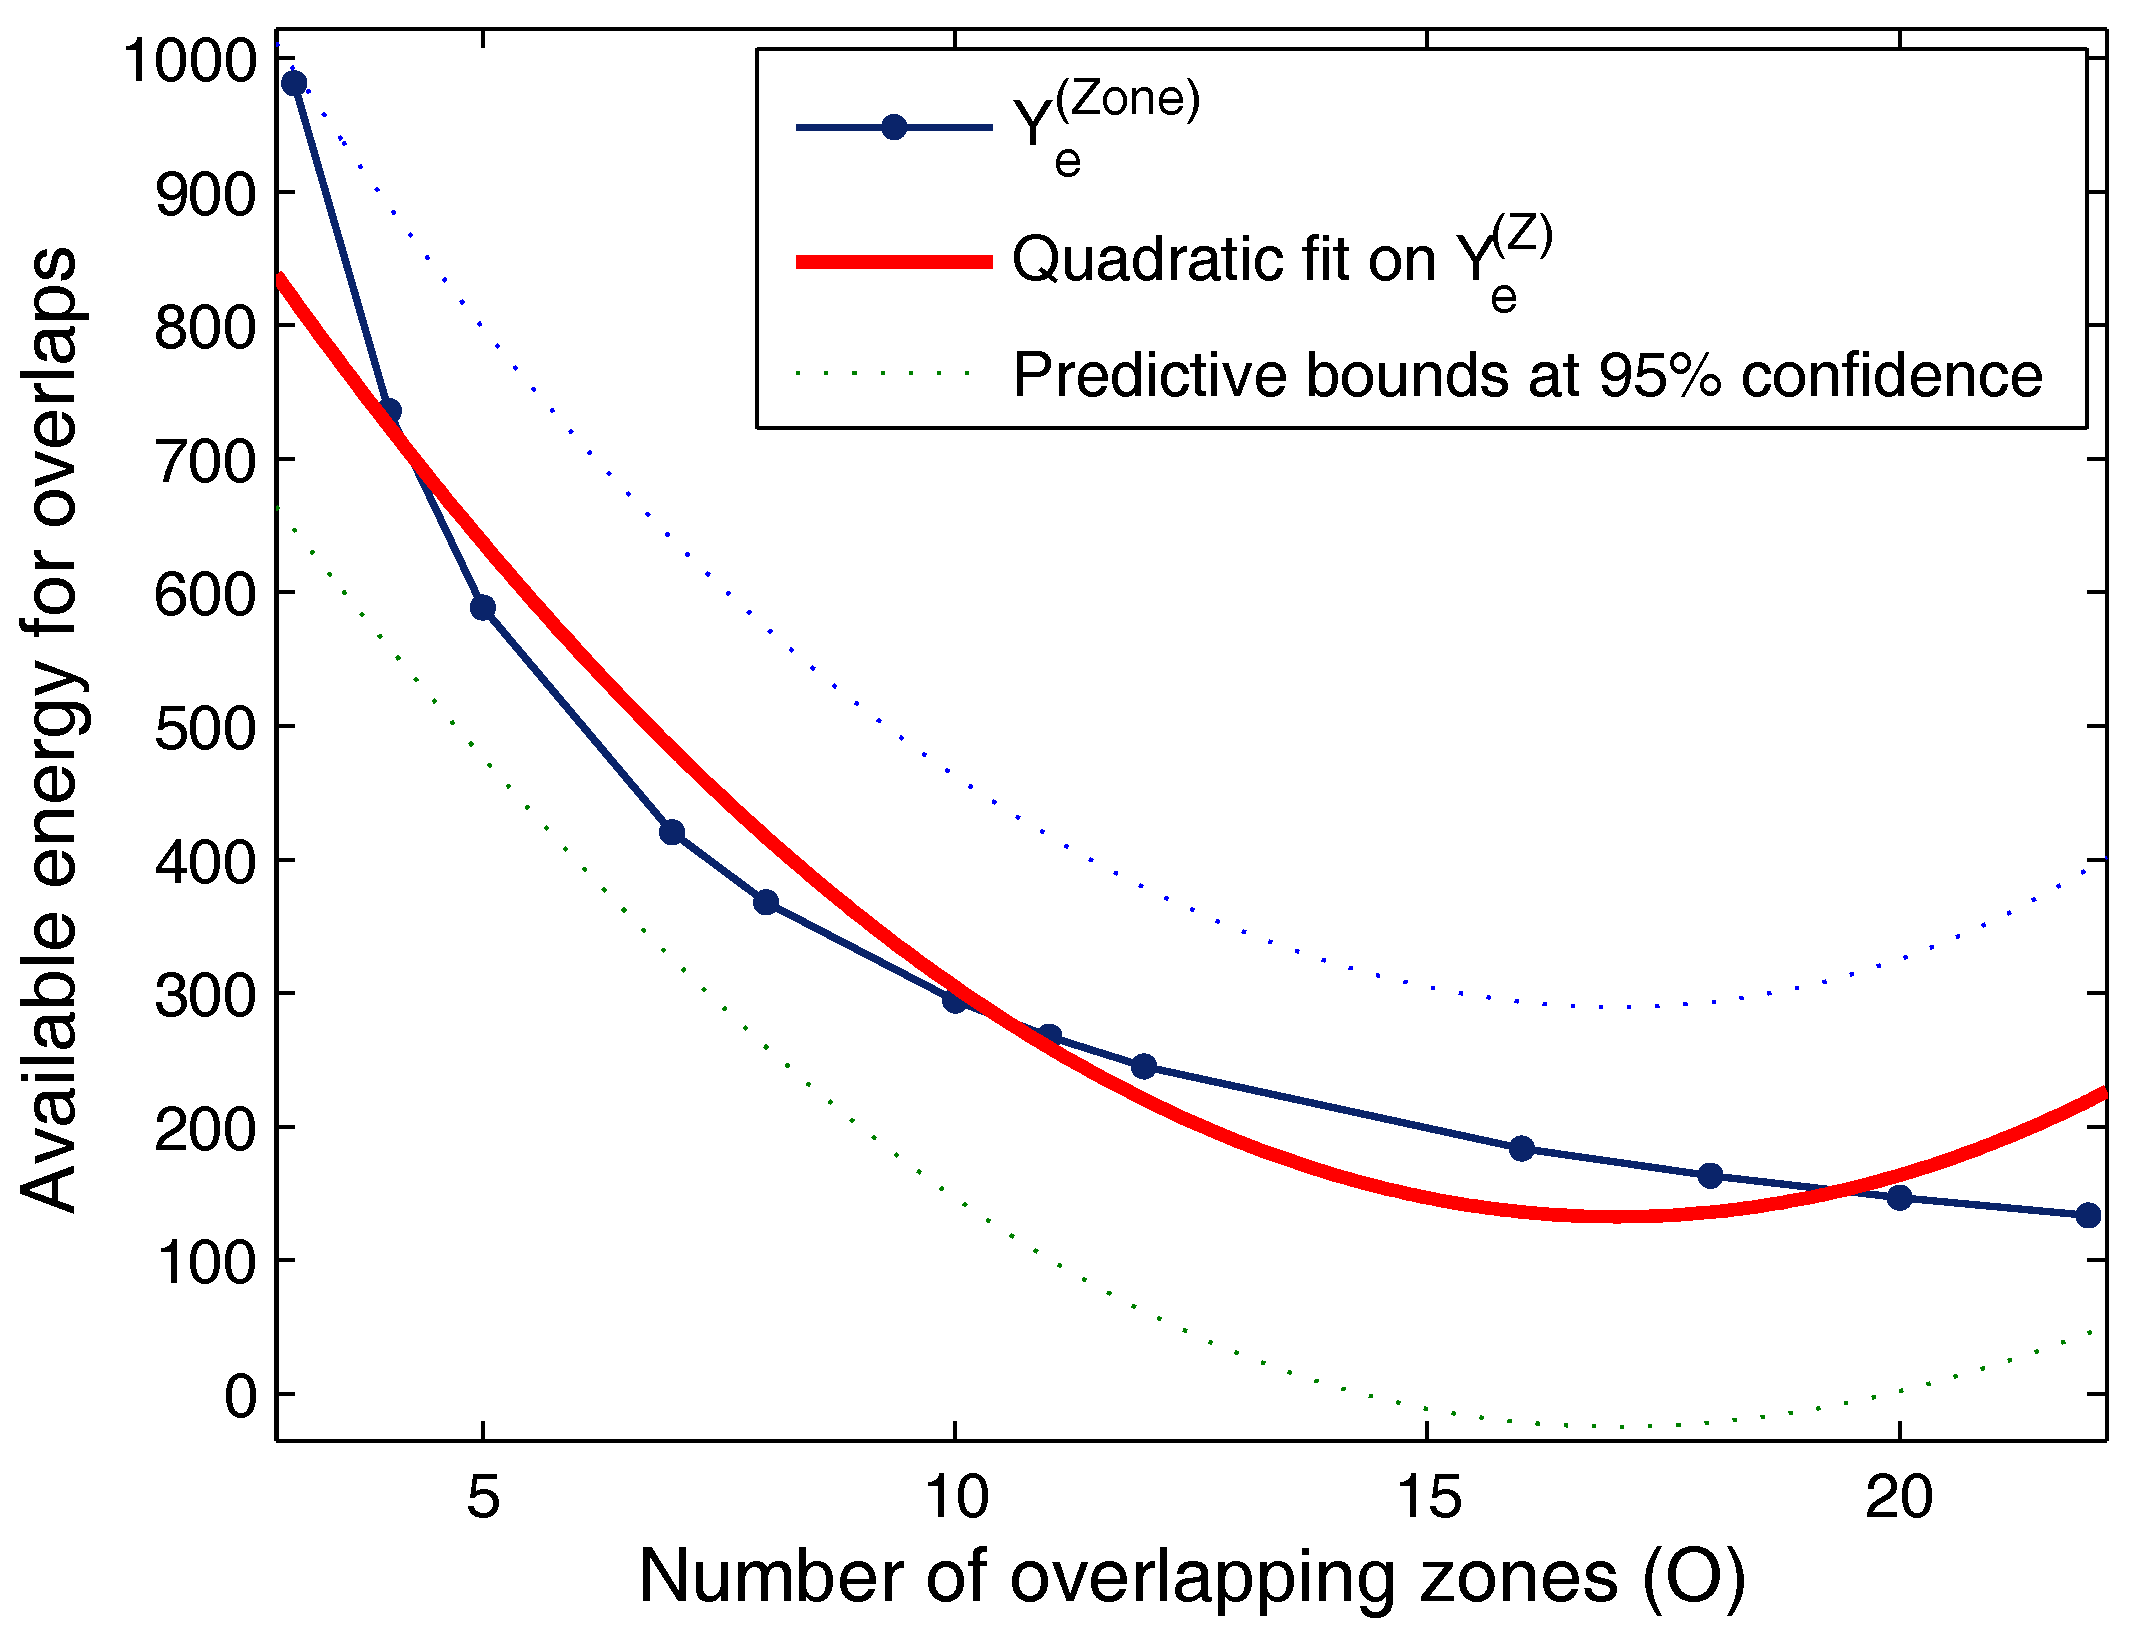
Figure 9.
Area stress vs. number of drones.
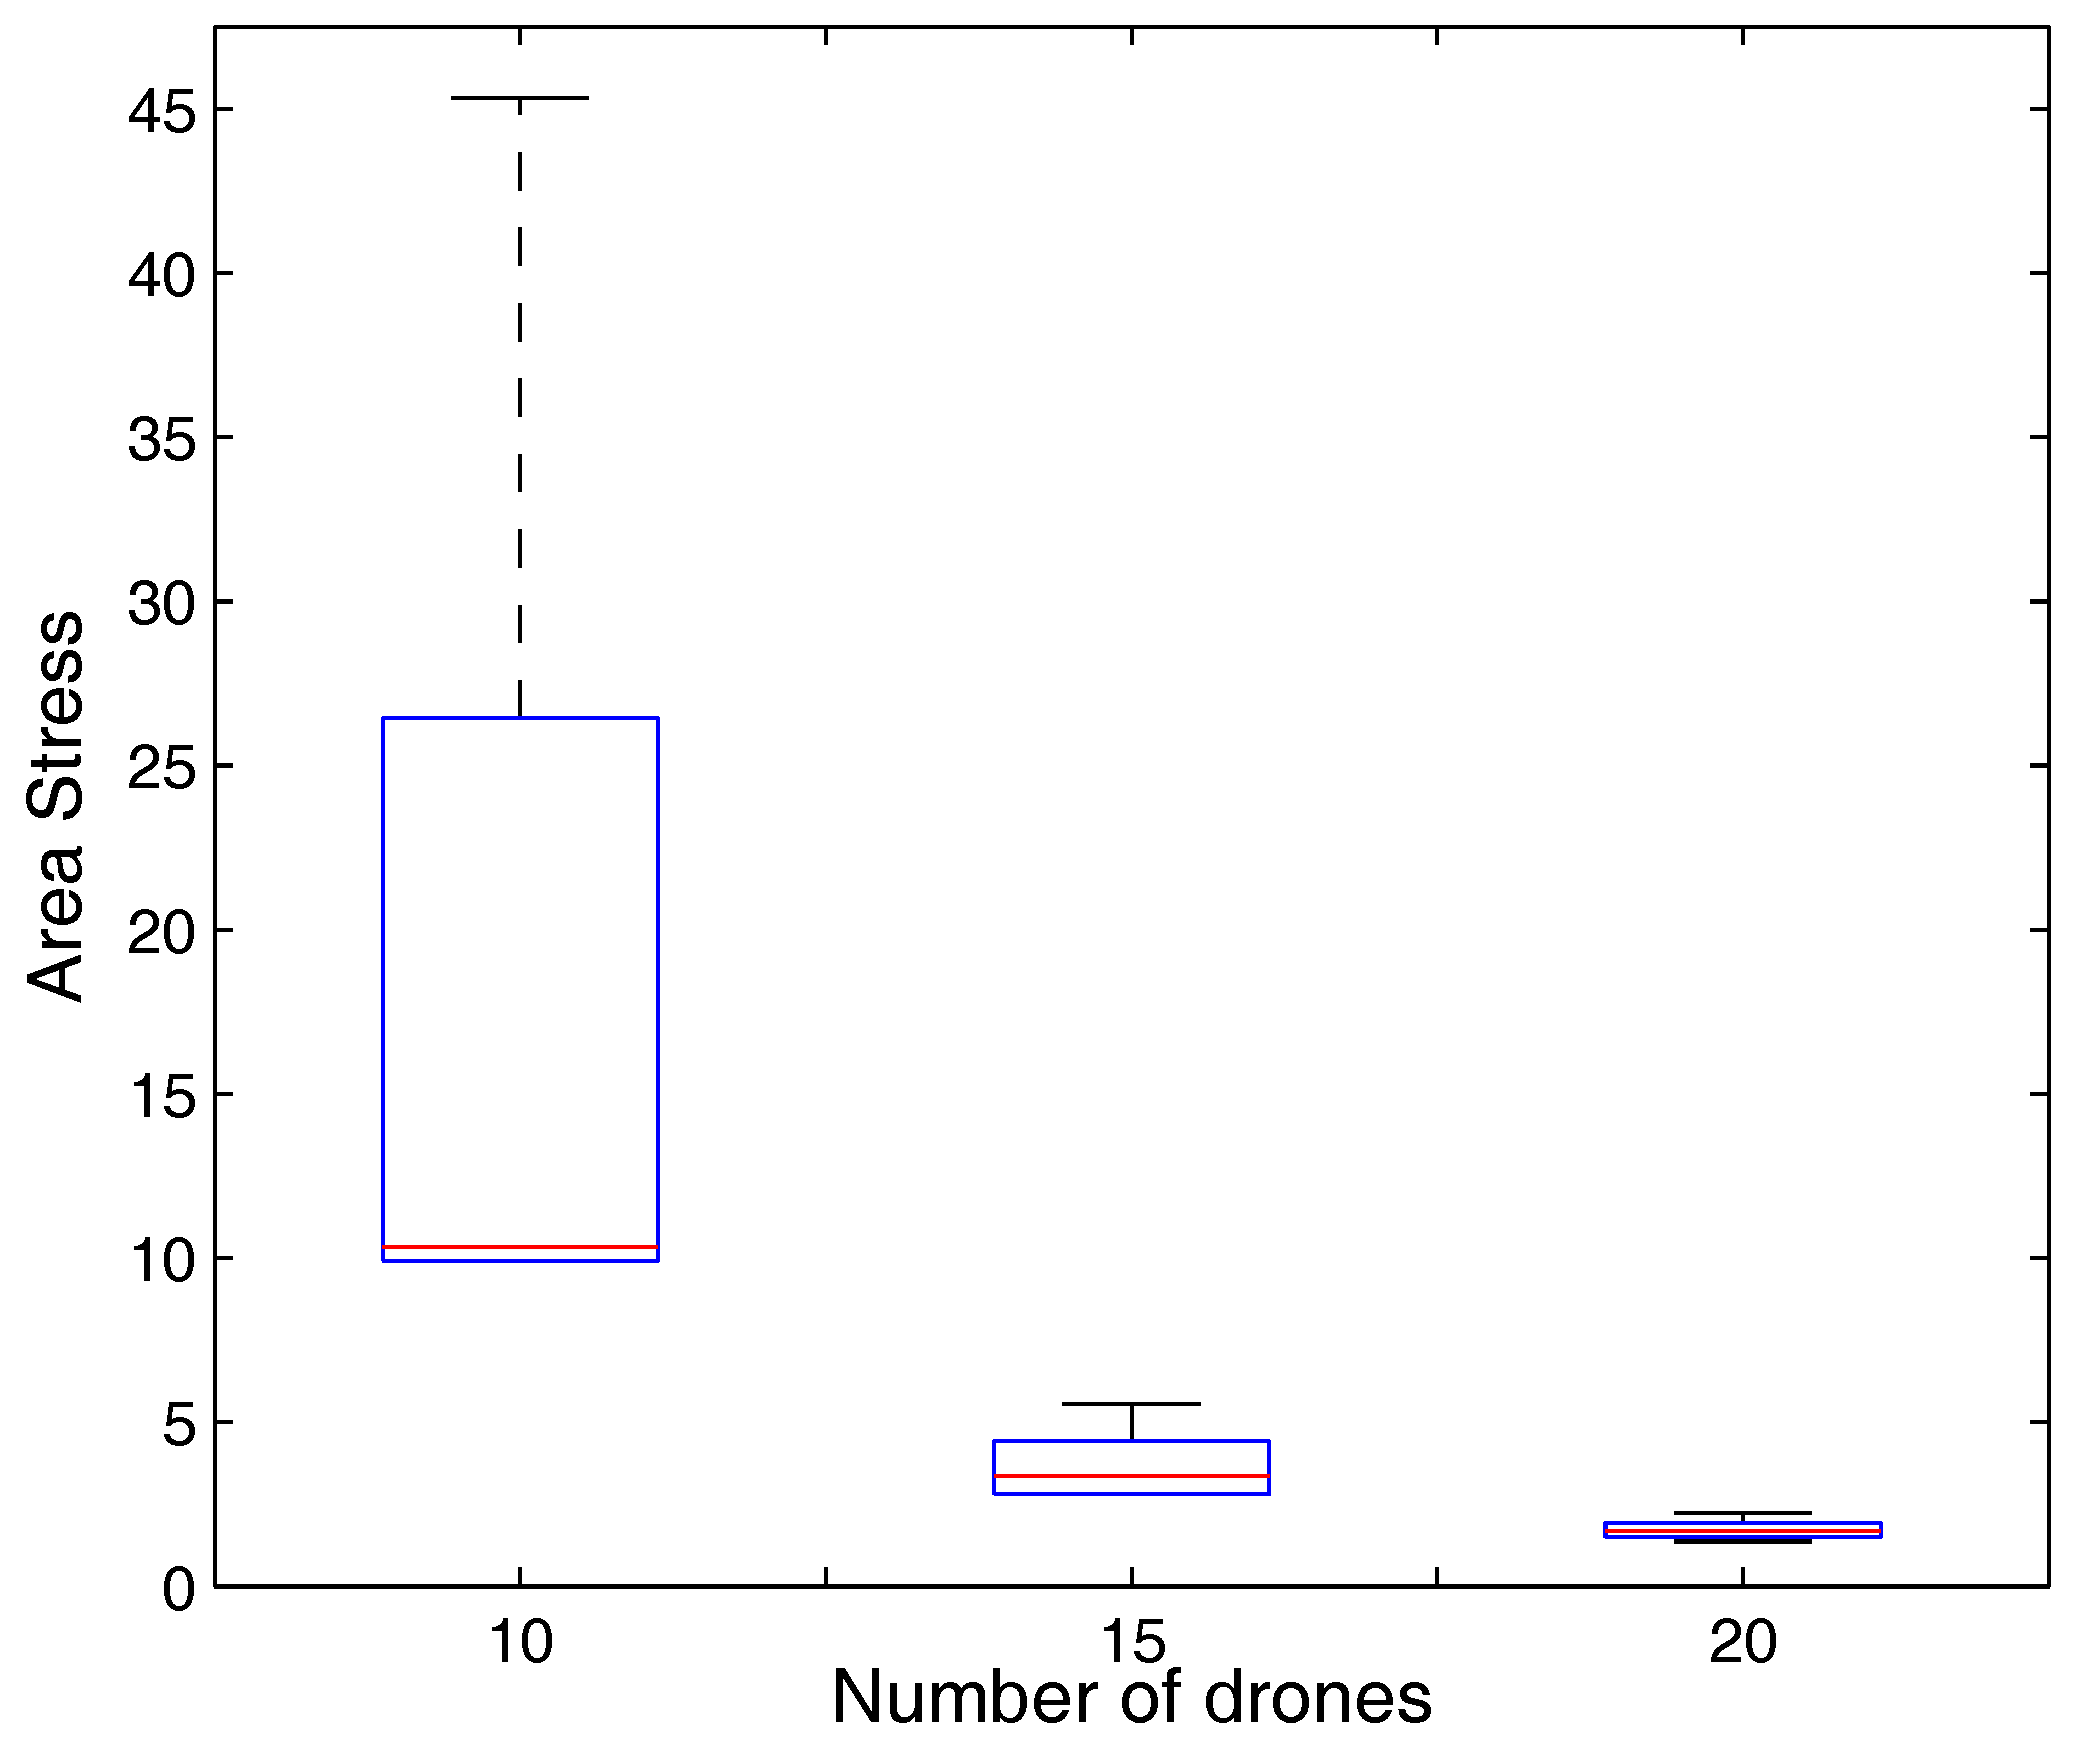
Figure 10.
Available energy per link for each zone vs. number of drones.


Table 1.
Symbols used in the paper.
| Symbol | Meaning | Symbol | Meaning |
|---|---|---|---|
| Signal to interference plus noise ratio | t | Transmission time | |
| Transmission power | Area under coverage | ||
| Antenna constant | Sensors in a zone | ||
| Transmission range | Set of zones | ||
| Spectral density of the network | Uplink time | ||
| Path loss exponent | Downlink time | ||
| Set of network servers | Mean lifetime | ||
| Set of data centers | Remaining energy of an entity | ||
| Set of cloud servers | Initial energy of an entity | ||
| Set of drones | Wait time for a drone | ||
| Set of users | Velocity of a drone | ||
| Set of switches | Radio range of a drone | ||
| Set of sensors or locators | Minimum active time for a drone | ||
| Path loss exponent for LoS | Area stress | ||
| Path loss exponent for NLoS | Range of a particular entity | ||
| Received power for NLoS | Coverage area | ||
| Received power for LoS | Number of overlaps | ||
| Shadowing component | Distance between centers of overlapping zones | ||
| Path length | Energy requirements of a zone | ||
| Transmission distance | Predicted energy requirements | ||
| Path loss at reference distance | Number of channels for end users | ||
| Path loss for an obstacle | Number of channels for sensors | ||
| Reliability of an entity | Processing energy | ||
| Failure factor | Transmitting energy | ||
| Number of concurrent channels | Energy loss due to interference | ||
| Number of states | Energy consumed in idle phase | ||
| Failure distribution function | Error rate for energy difference | ||
| Probability of failure of an entity | Resilient factor | ||
| Expected future lifetime of an entity | Fail safe metric (Probability of no failure) | ||
| Total connected devices with an entity | Number of entities operating in a given drone zone and number of entities a drone can support |
Table 2.
Parameter Configurations.
| Symbol | Value | Symbol | Value |
|---|---|---|---|
| 30 dBm | t | 200 s | |
| −11 dB | 2500 × 2500 sq.m. | ||
| 500 m | 50 | ||
| −174 dBm/Hz | 10 | ||
| 4 | 10 s | ||
| 10 | 5 s | ||
| 5 | 0.3 | ||
| 2 | 2000 J | ||
| 20 | 30 kmph | ||
| 500 | 500 m | ||
| 10 | 20 s | ||
| 500 | b | 1024 bytes | |
| 2 | 100 to 500 m | ||
| 2.4 | 0.00125 W | ||
| 0.1 | 0.0016 W | ||
| 500 | 50, 100 | ||
| 10 | 4 | ||
| 10 dB | 4 | ||
| 2 | 2 | ||
| 10 | 2 | ||
| 0.1 J | 0.25 J | ||
| 0.05 J | 0.32 J | ||
| 30 Kbps | 50 Kbps |
Table 3.
Comparison of the proposed approach with the state-of-the-art solutions for surveillance.
| Approach | Author | Ideology | Drones | Wireless Communication Support | Surveillance | Energy-Efficient Deployment | Resilient | Fail-Safe | LoRaWAN |
|---|---|---|---|---|---|---|---|---|---|
| Meteorological
information display | Reda et al. [71] | LoRa wireless communication | No | Yes | No | - | - | - | Yes |
| Visual surveillance | Pham [72] | Low-cost, low-power
and long-range visualization | No | Yes | Yes | Yes | - | - | Yes |
| UAV path planning | Zhan et al. [73] | Multiconstraints in a 3D environment | Yes | No | Yes | No | - | - | Yes |
| UAV-WSN networks | Sharma et al. [45] | Multi-UAV coordination | Yes | Yes | Yes | Yes | No | No | No |
| Urban Surveillance | Samad et al. [74] | Networm centric systems | Yes | Yes | Yes | - | - | - | No |
| Feature detection of
nonconforming objects | Xu et al. [75] | Key points matching problem | Yes | No | Yes | No | - | - | No |
| Amateur surveillance
System | Ding et al. [76] | Surveillance system based
on the cognitive Internet of Things | Yes | Yes | Yes | No | - | - | No |
| Motion planning | Scherer et al. [77] | Multi-UAV surveillance | Yes | Yes | Yes | Yes | - | - | No |
| Proposed | Sharma et al. | Drones as LoRaWAN gateways | Yes | Yes | Yes | Yes | Yes | Yes | Yes |
© 2018 by the authors. Licensee MDPI, Basel, Switzerland. This article is an open access article distributed under the terms and conditions of the Creative Commons Attribution (CC BY) license (http://creativecommons.org/licenses/by/4.0/).
Share and Cite
MDPI and ACS Style
Sharma, V.; You, I.; Pau, G.; Collotta, M.; Lim, J.D.; Kim, J.N. LoRaWAN-Based Energy-Efficient Surveillance by Drones for Intelligent Transportation Systems. Energies 2018, 11, 573. https://doi.org/10.3390/en11030573
AMA Style
Sharma V, You I, Pau G, Collotta M, Lim JD, Kim JN. LoRaWAN-Based Energy-Efficient Surveillance by Drones for Intelligent Transportation Systems. Energies. 2018; 11(3):573. https://doi.org/10.3390/en11030573
Chicago/Turabian StyleSharma, Vishal, Ilsun You, Giovanni Pau, Mario Collotta, Jae Deok Lim, and Jeong Nyeo Kim. 2018. "LoRaWAN-Based Energy-Efficient Surveillance by Drones for Intelligent Transportation Systems" Energies 11, no. 3: 573. https://doi.org/10.3390/en11030573
Note that from the first issue of 2016, this journal uses article numbers instead of page numbers. See further details here.