Study of Material Compatibility for a Thermal Energy Storage System with Phase Change Material


Abstract
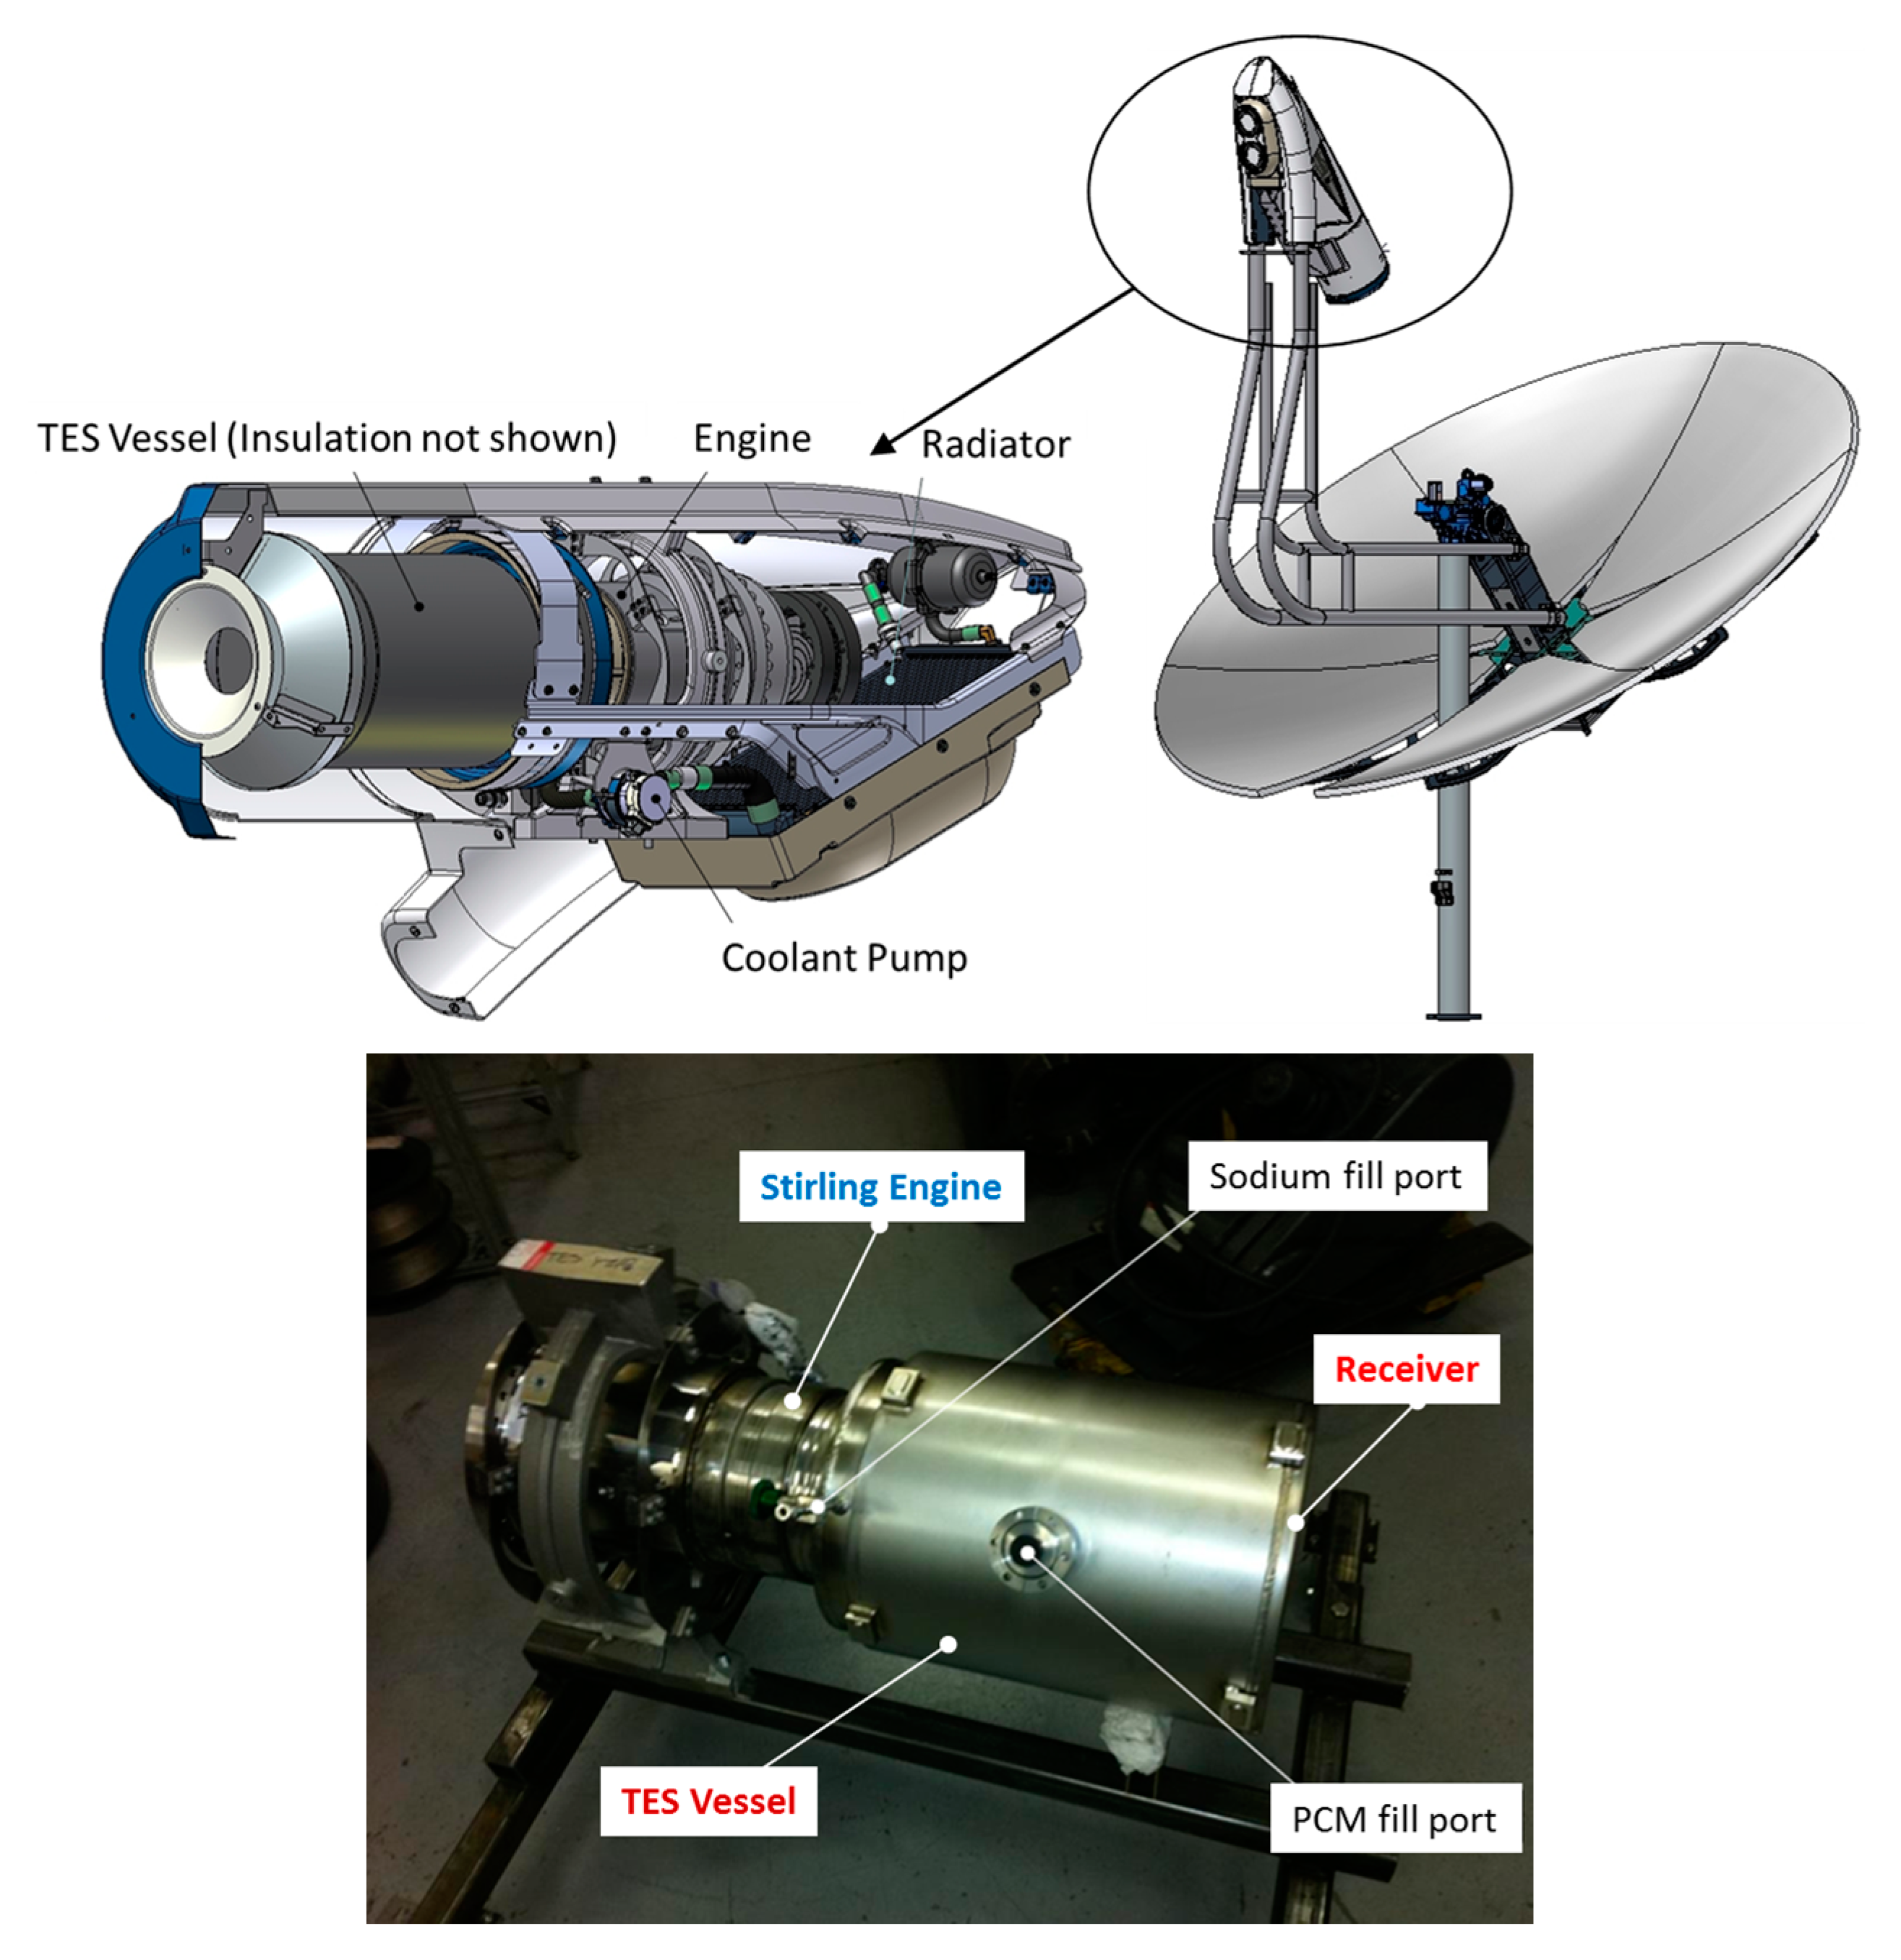
:1. Introduction
2. TES Vessel Material Selection
- High-temperature alloys can be used as containers for molten salt TES. Most notably, Inconel 617 and stainless steel 304 have demonstrated limited degradation with no signs of failure even after five years of thermal cycling.
- Oxygen, water residue, and sodium cations are the three oxidizing agents present in the PCM salt system.
- Over time, the corrosion rate of the metallic alloys in a molten salt will decelerate due to the limited availability of strong oxidizing agents.
- Minimizing the levels of oxygen and water vapor inside a TES vessel is crucial to the life of the hardware. Corrosion can cause material failure in under a week if significant traces of water and oxygen are present.
- Due to low electronegativity amongst the elements present in the material, sodium cations are not expected to be an active oxidizer within the system.
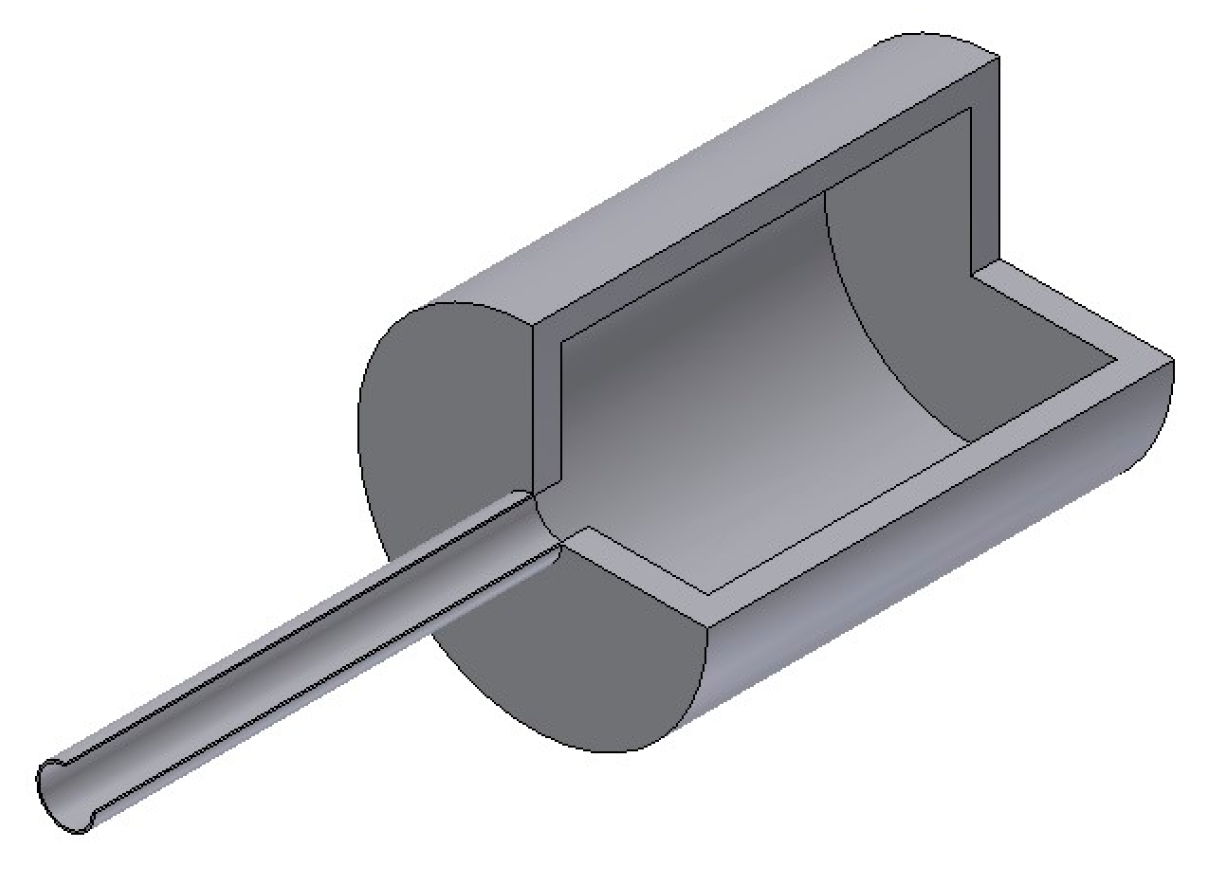
3. Sample Preparation and Testing
4. Test Results and Discussion
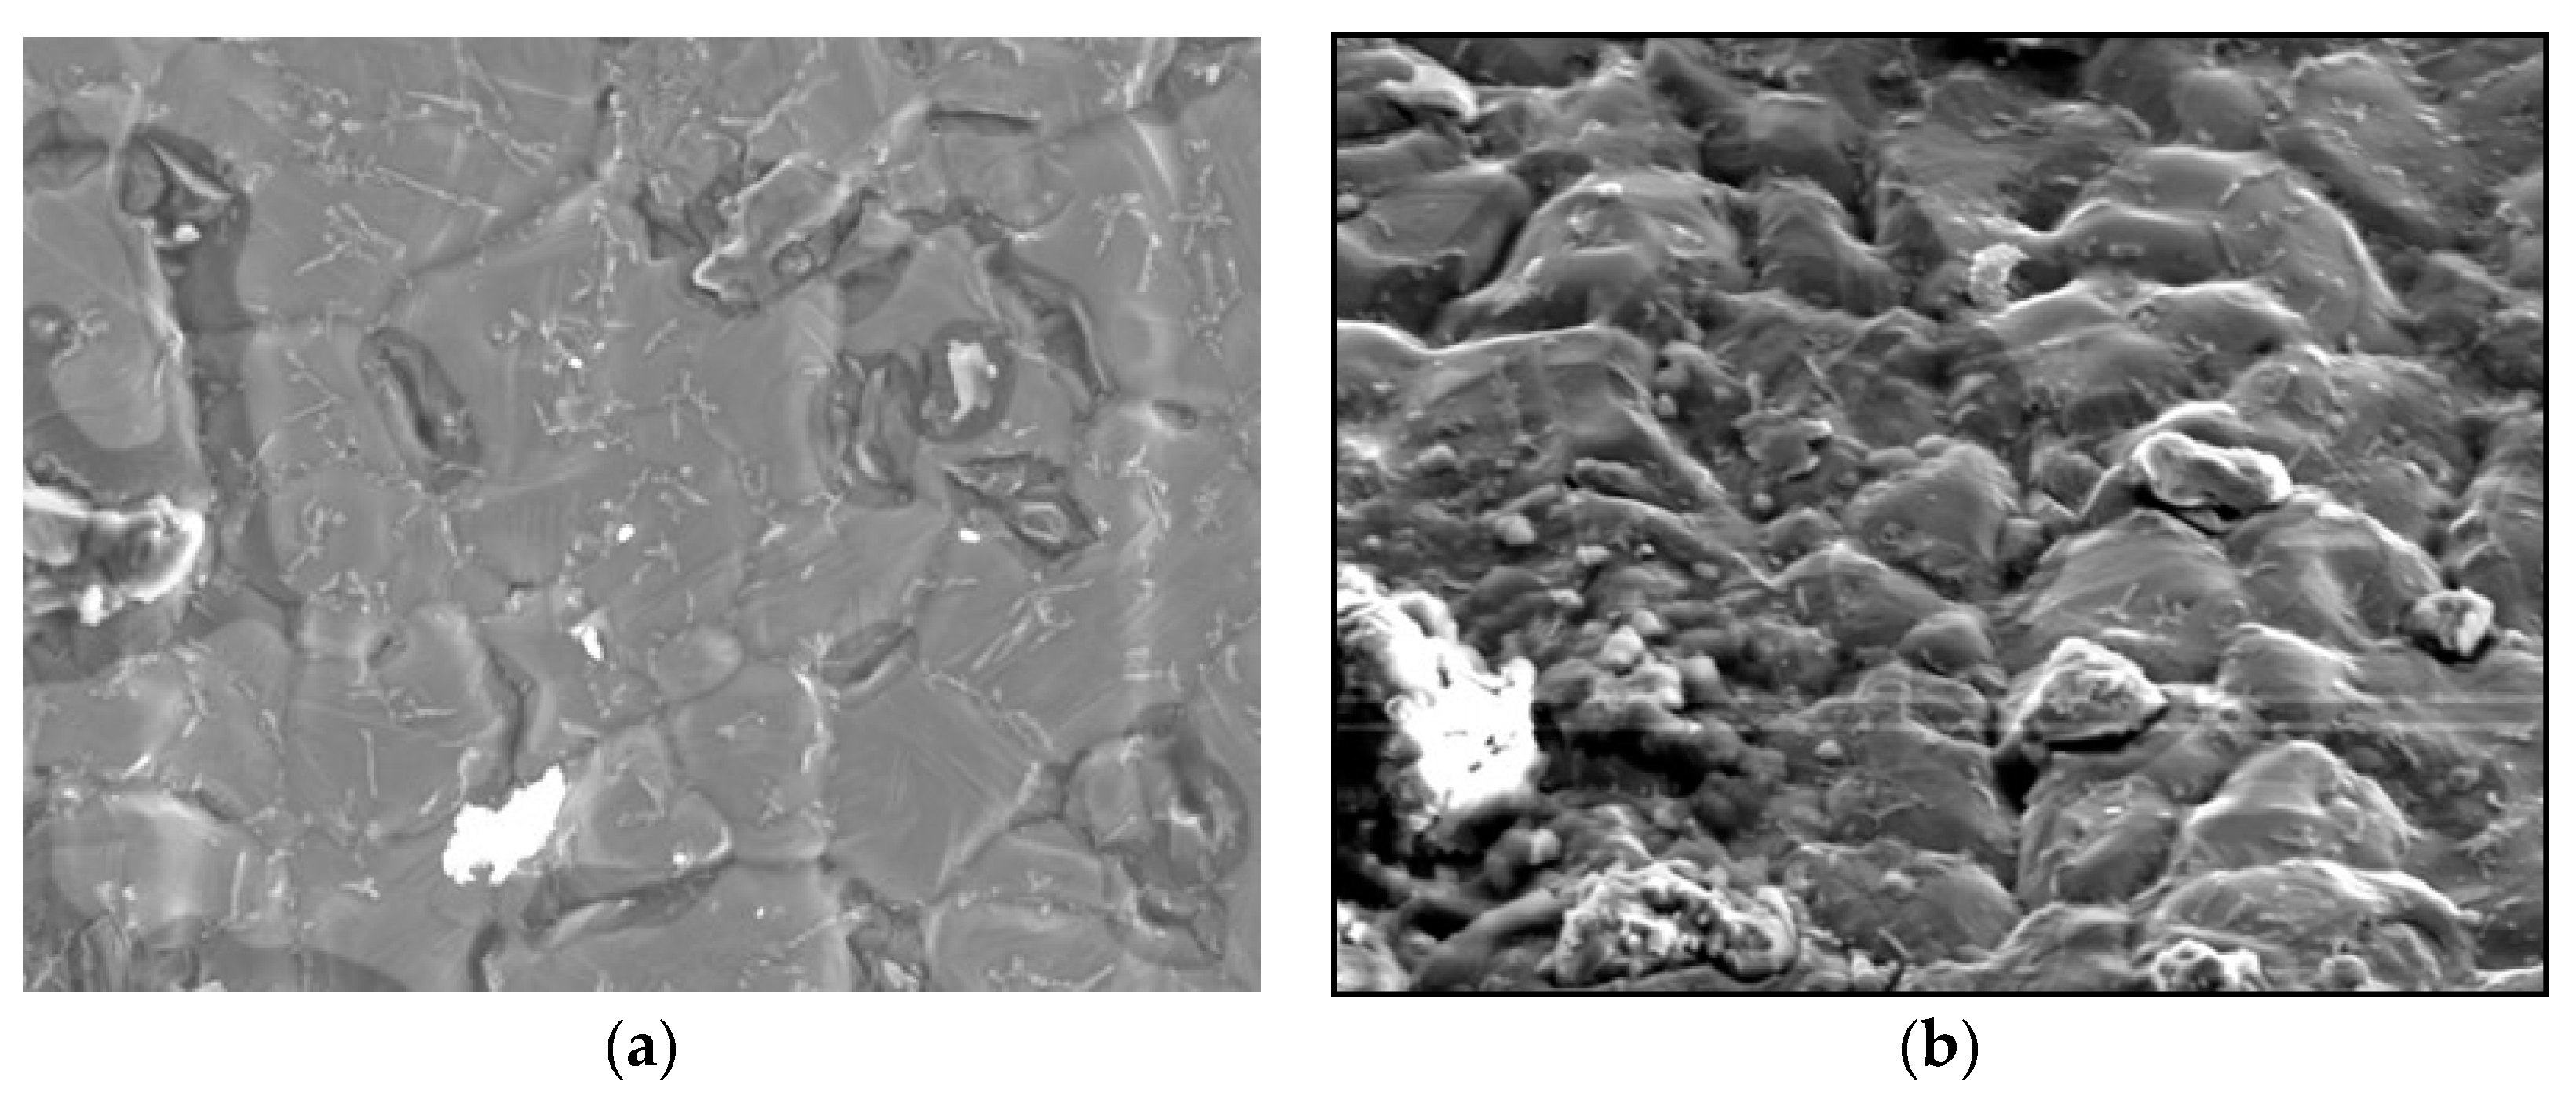
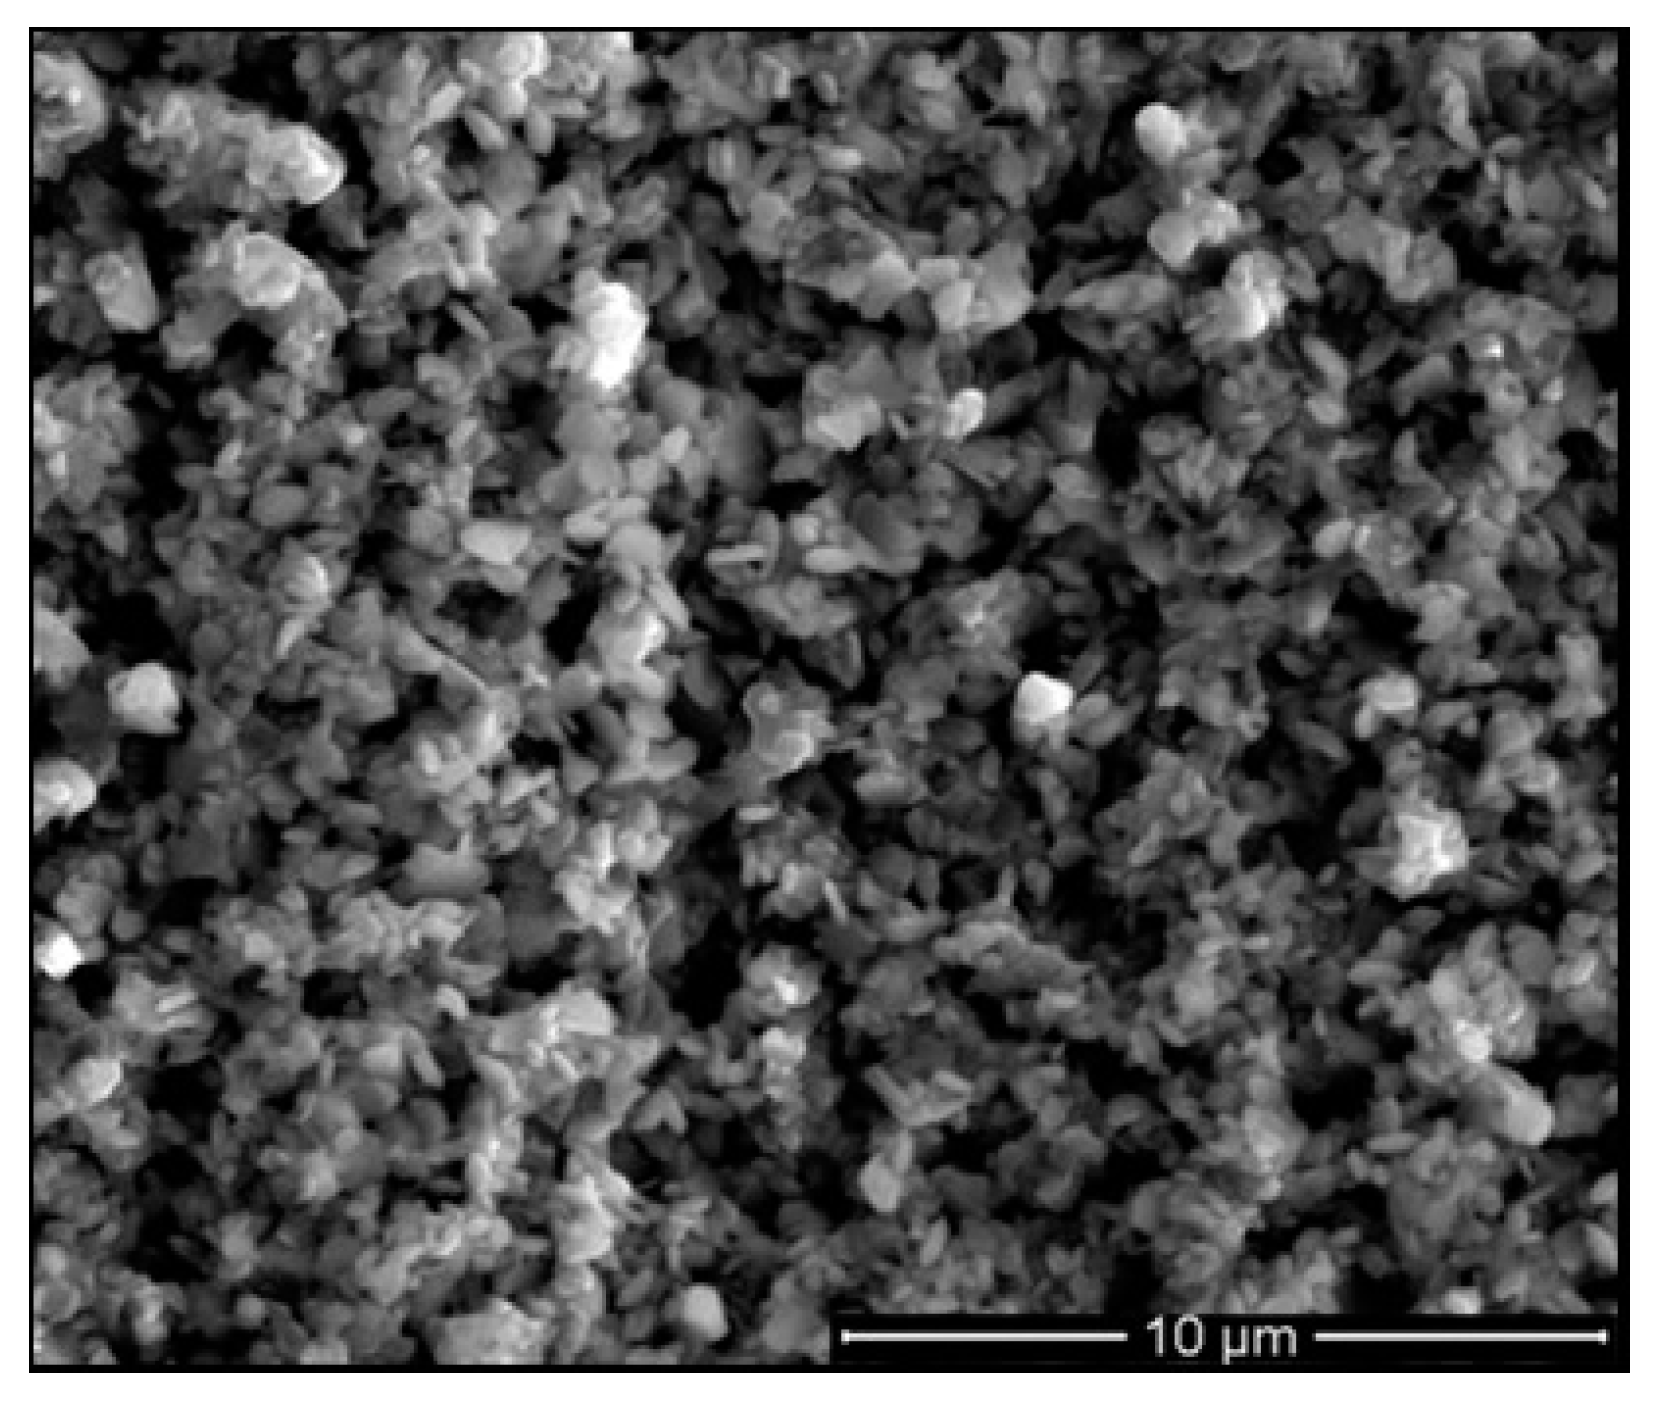
4.1. Stainless Steel 316L, 100 H Test
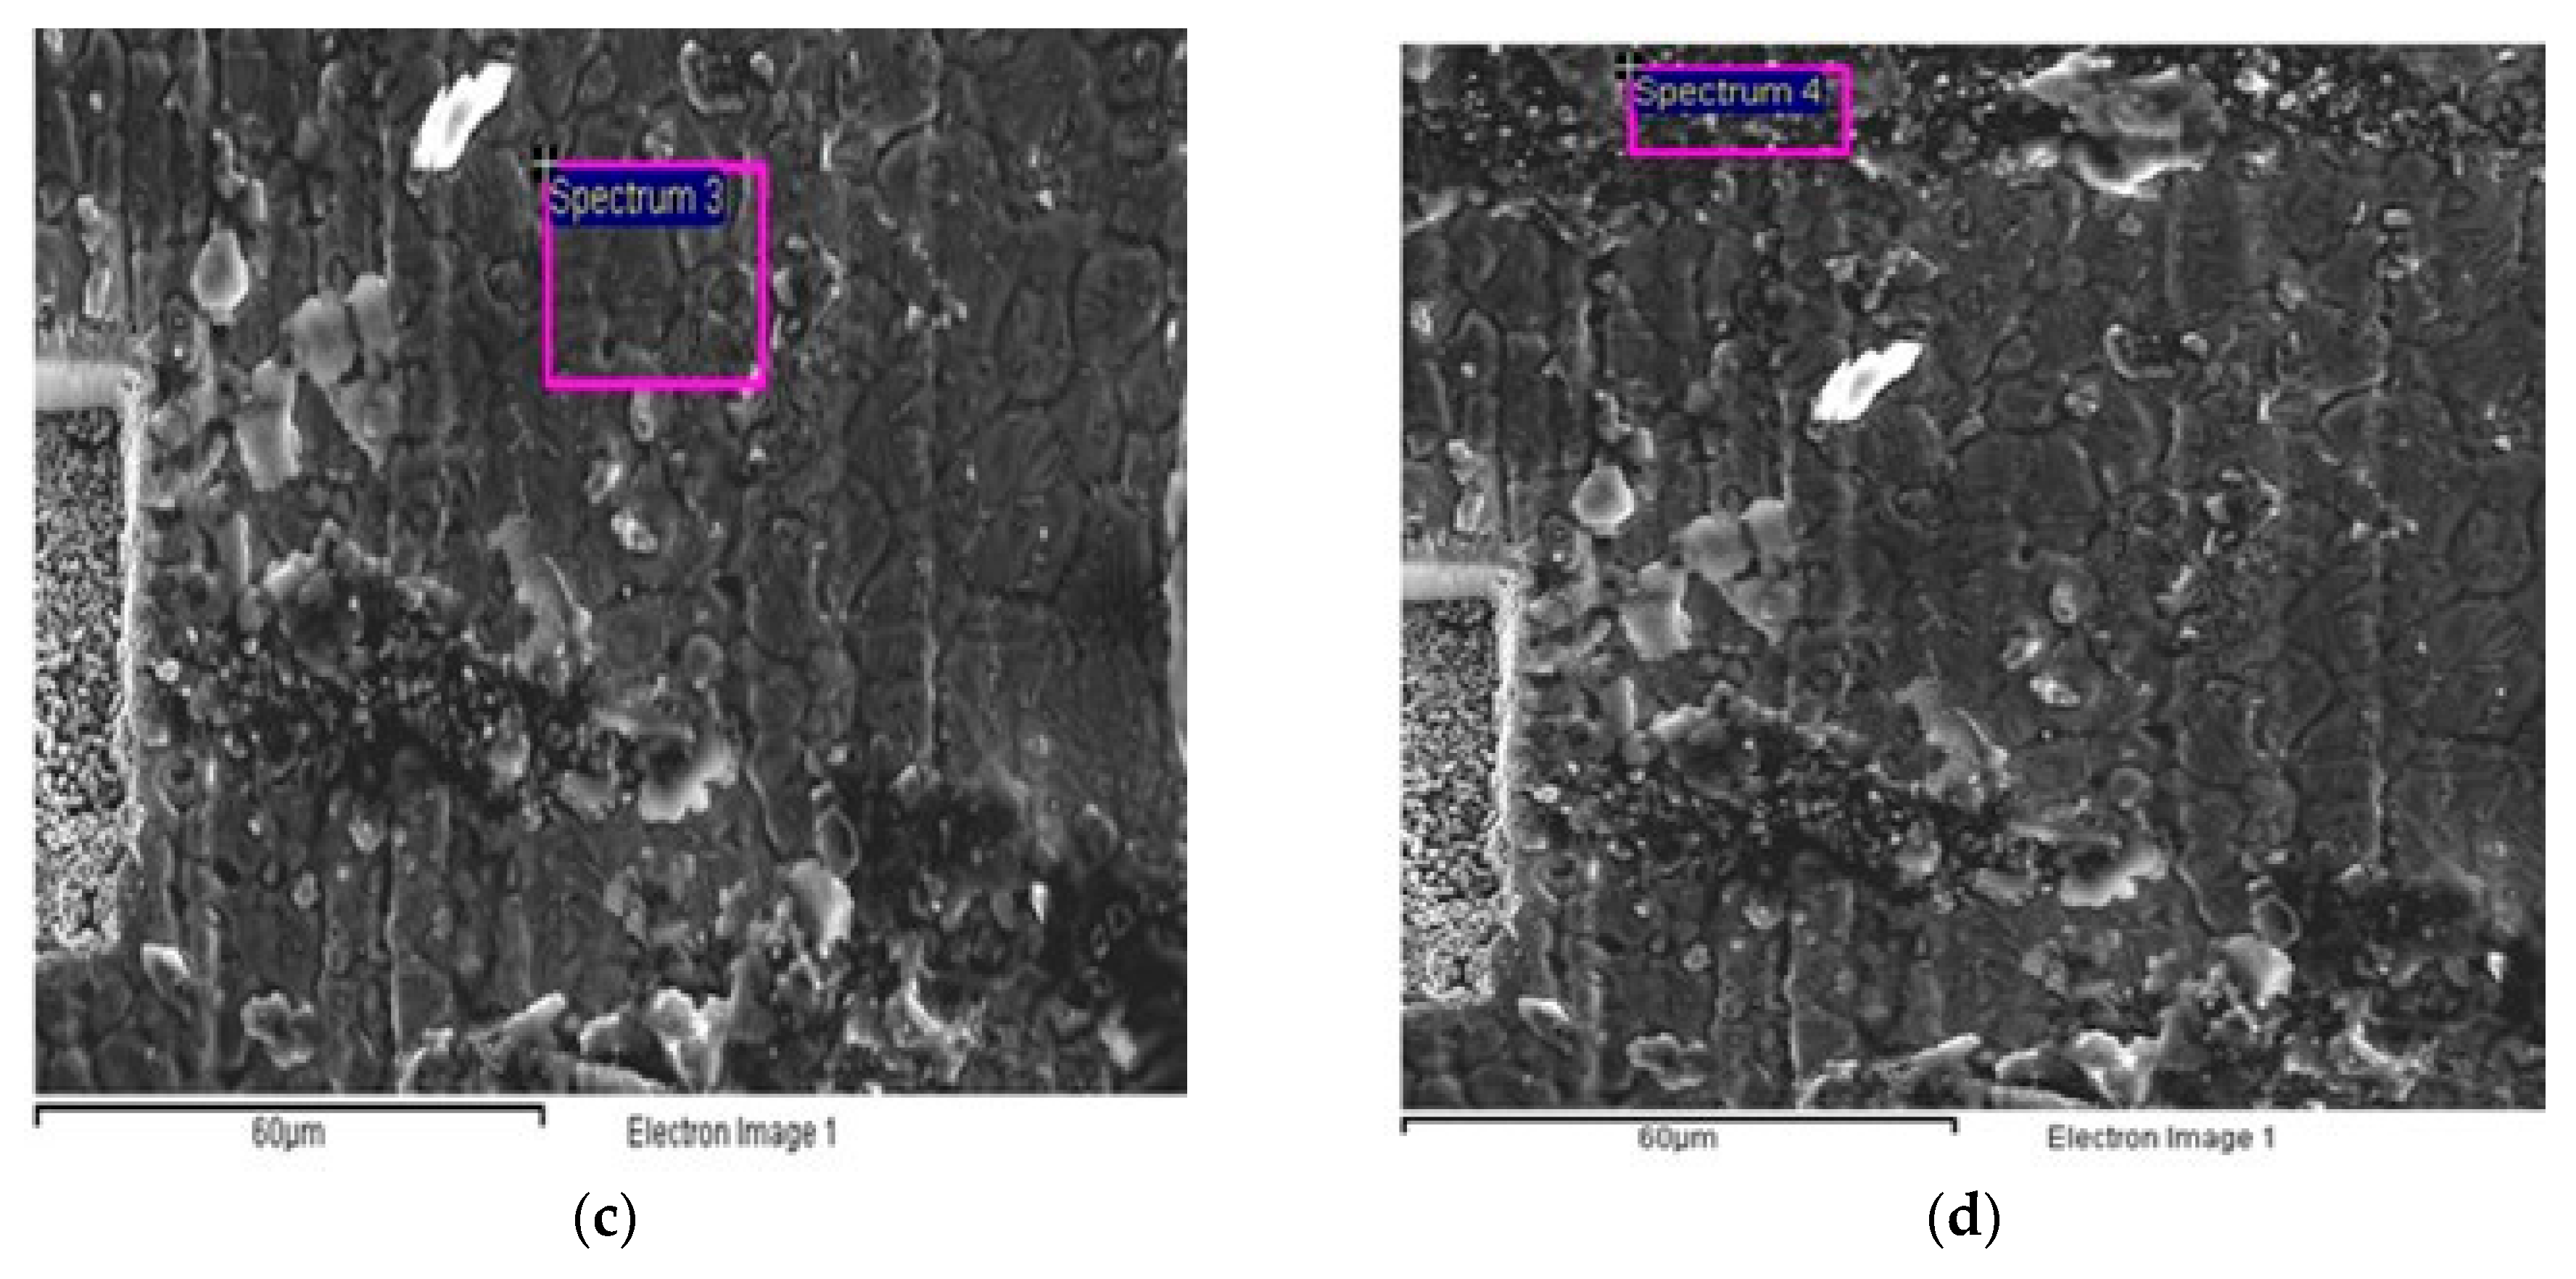
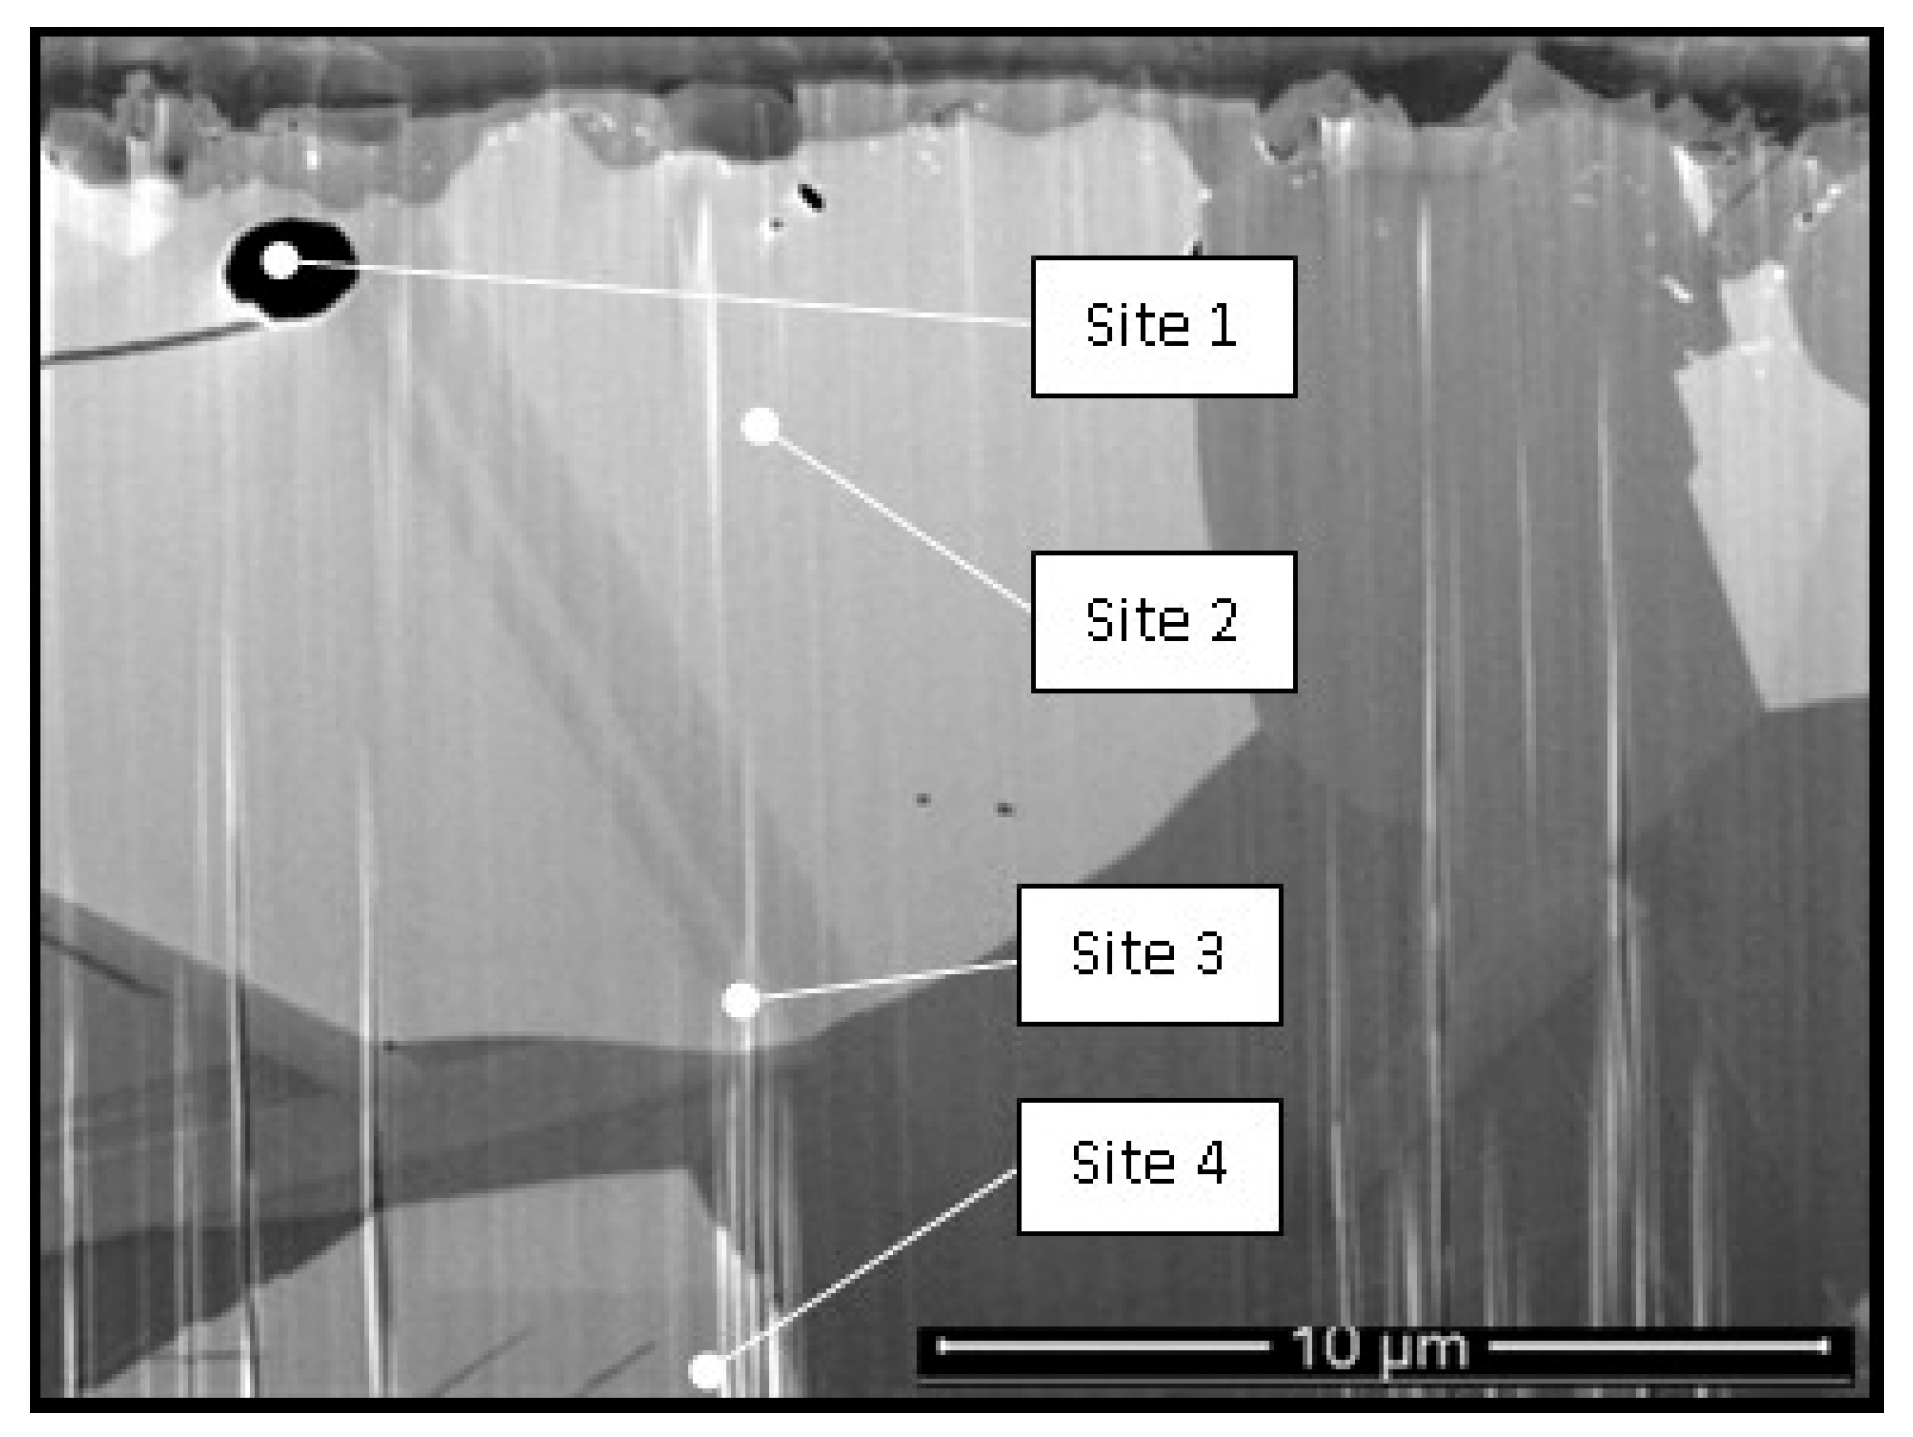
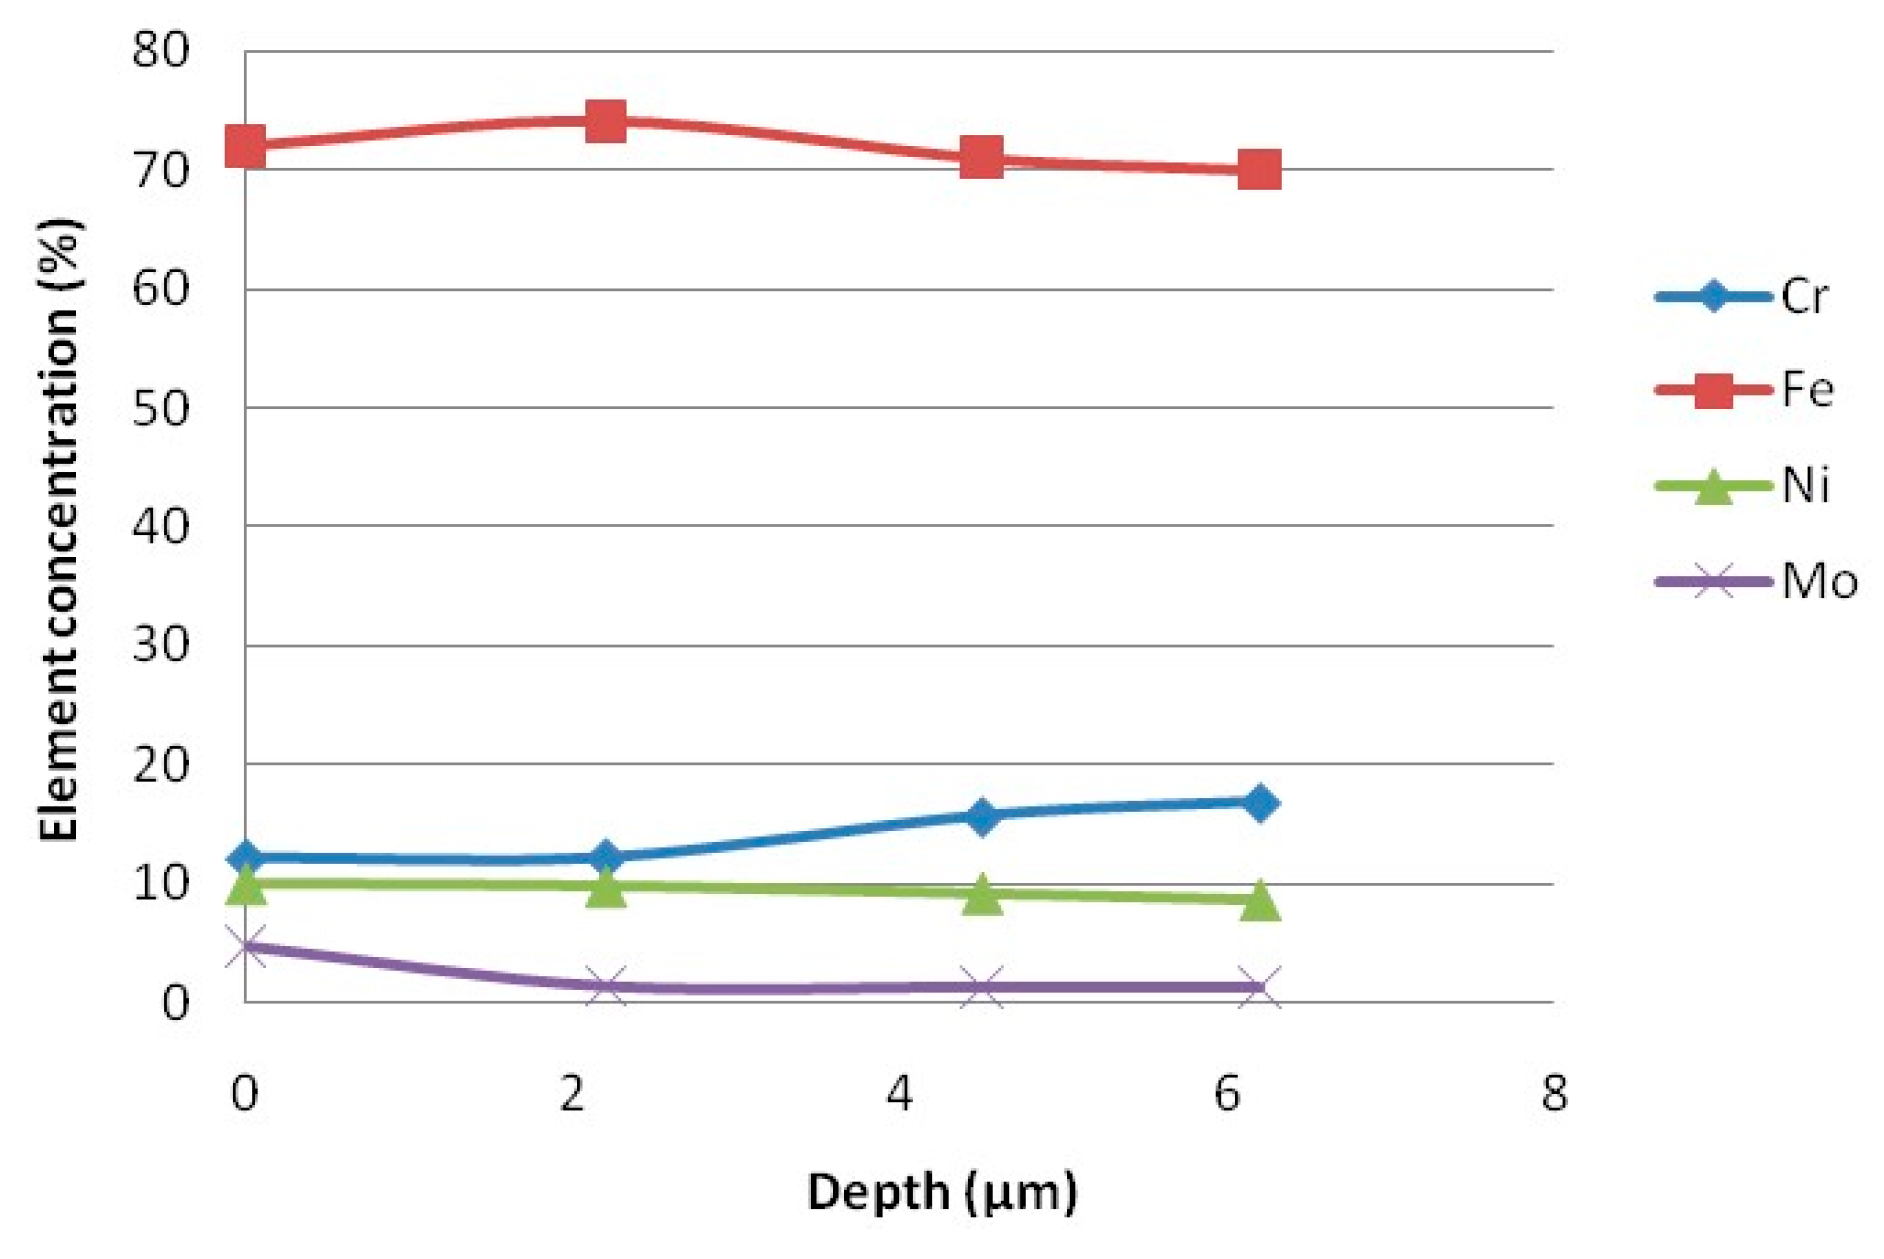
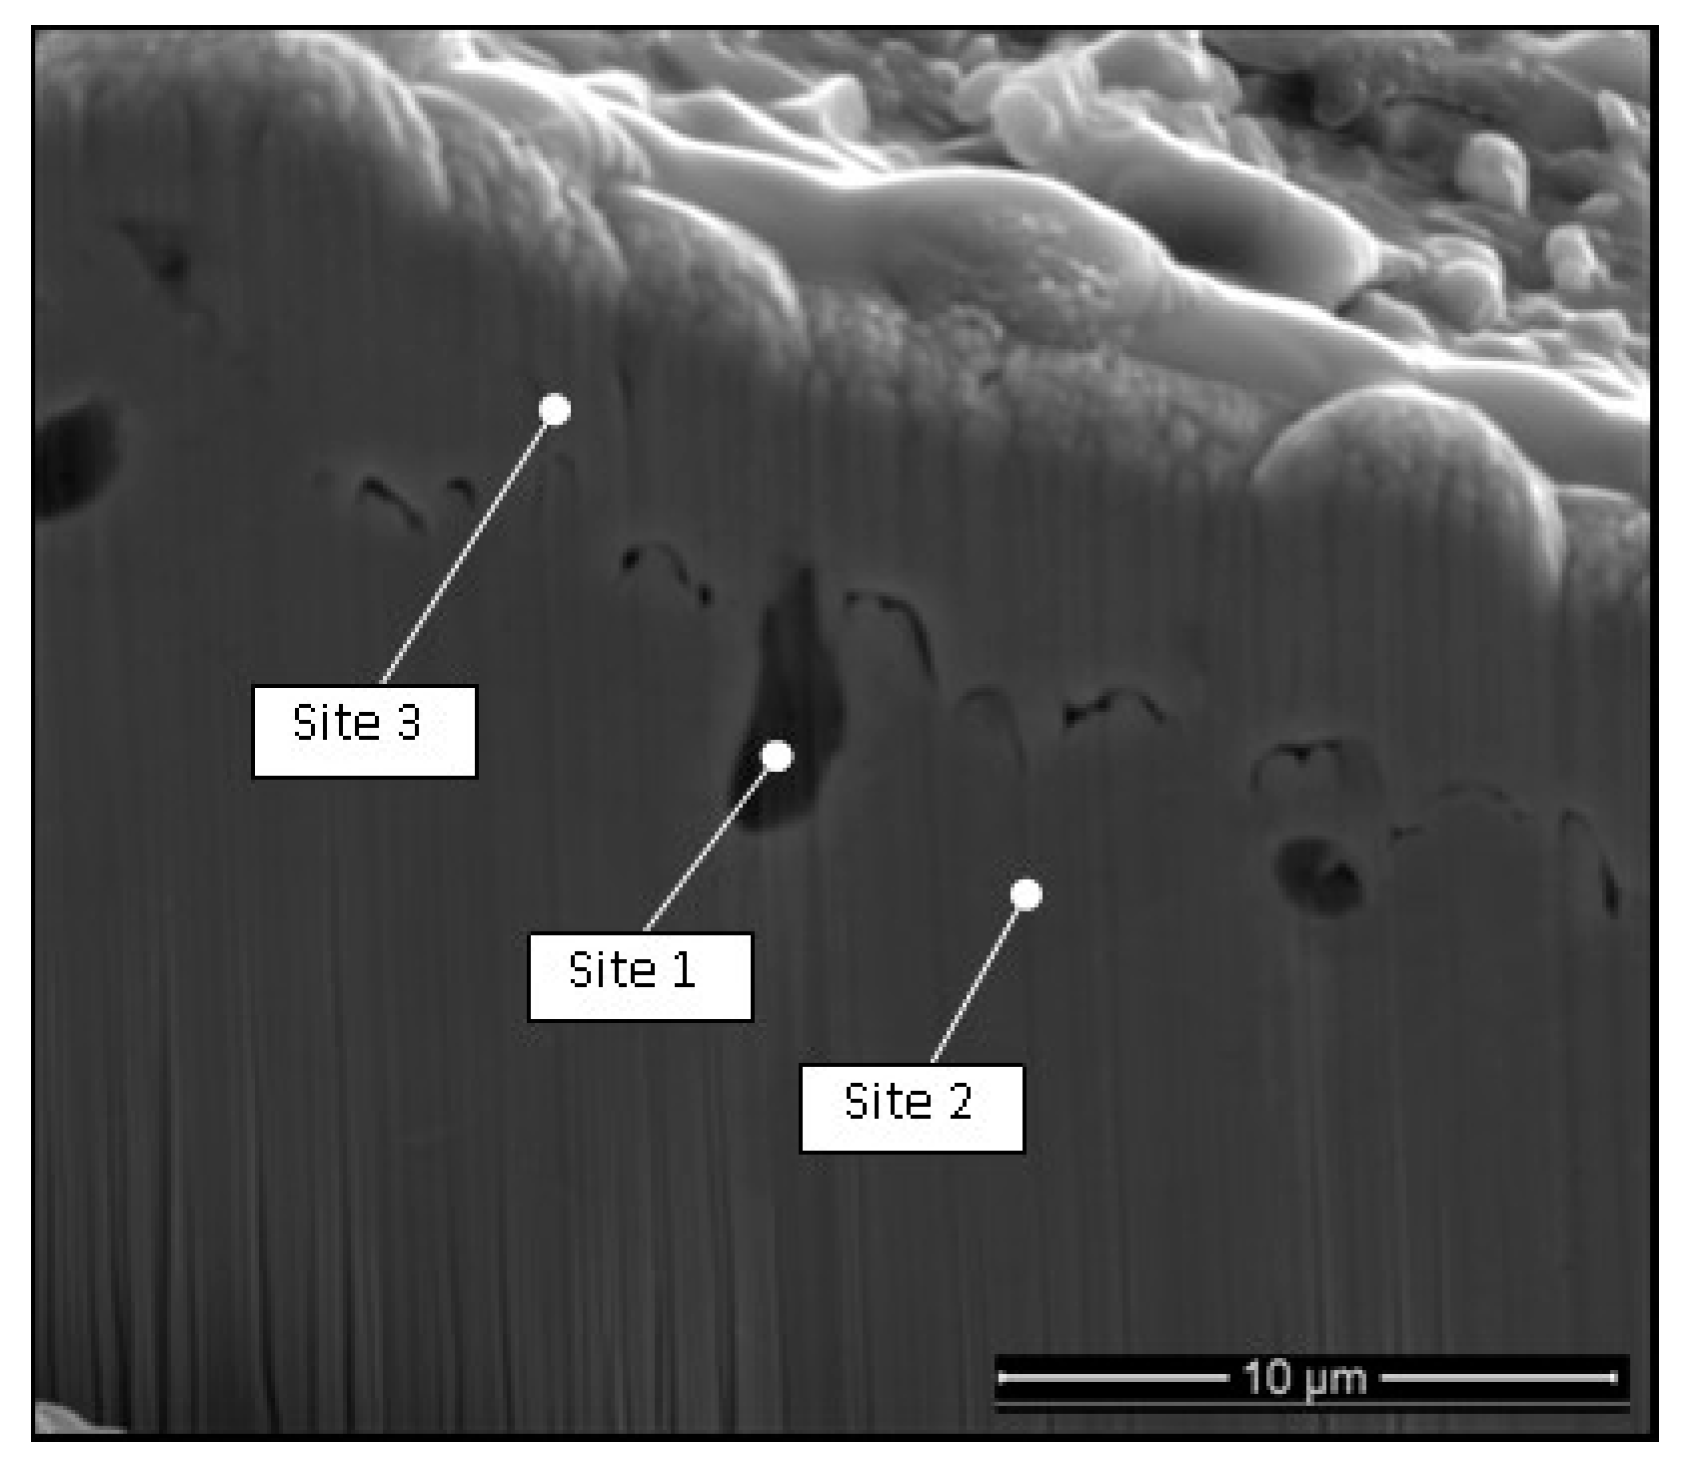
4.2. SS 316L, 2500 H
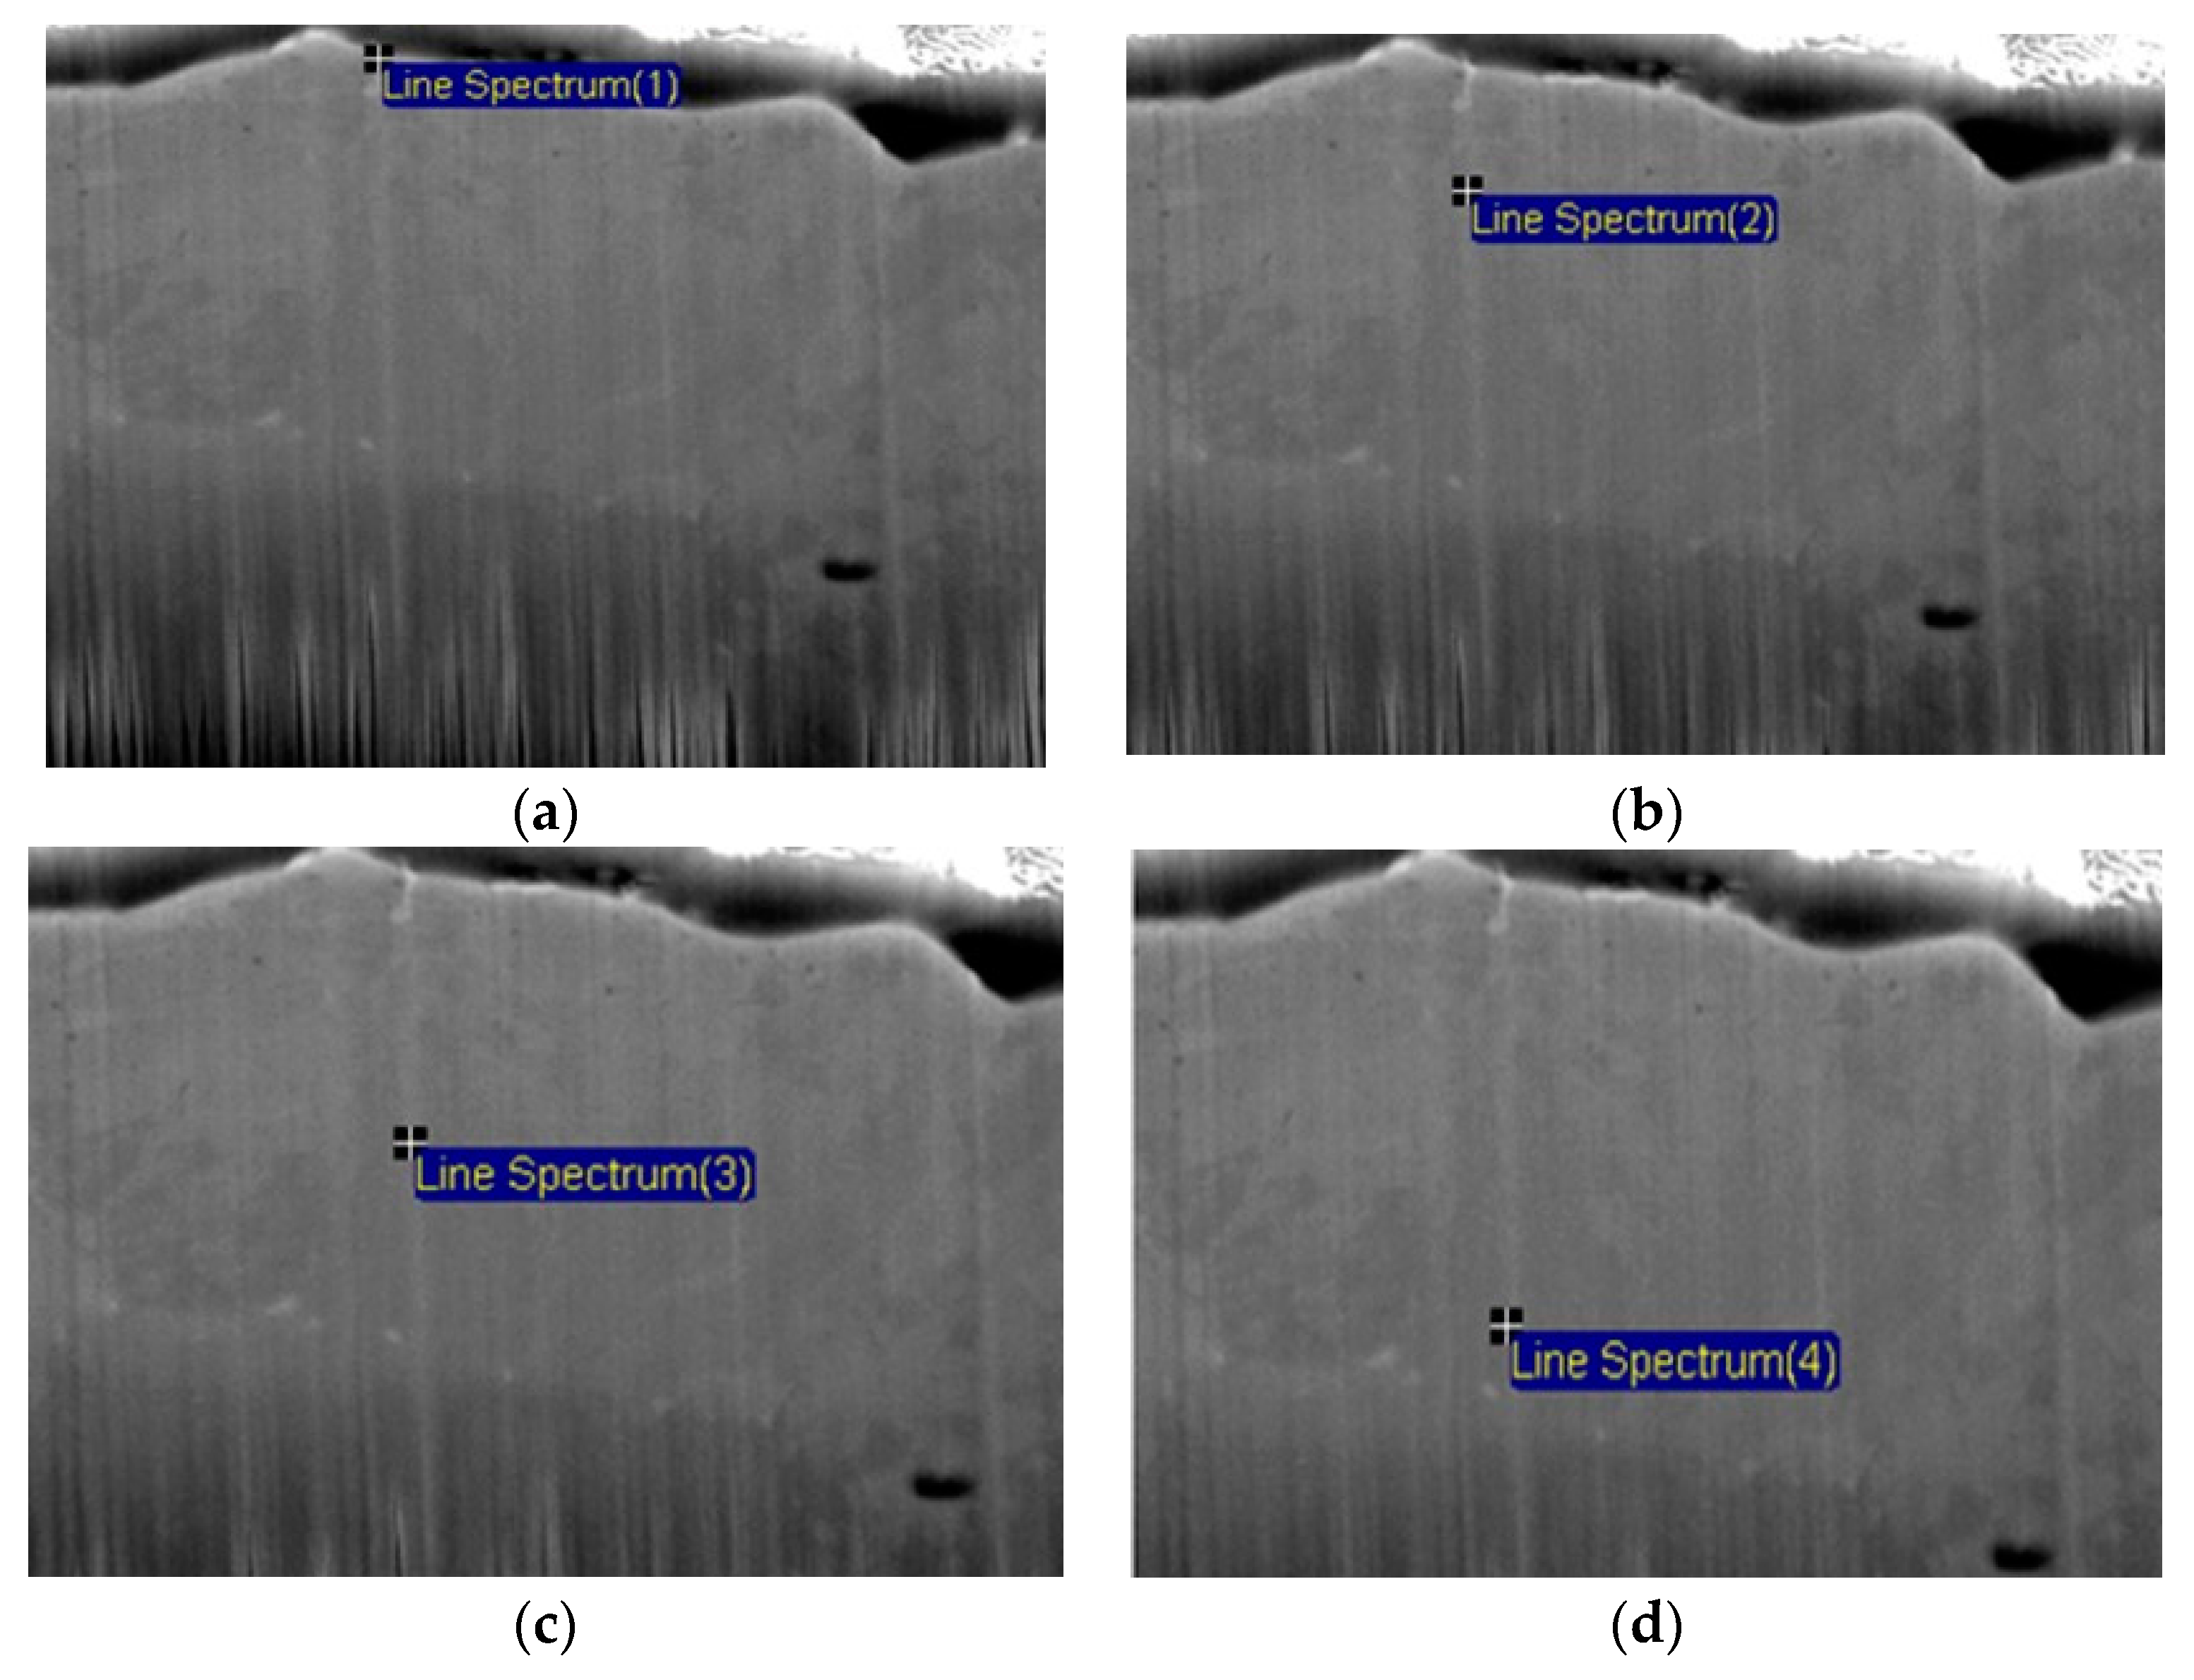
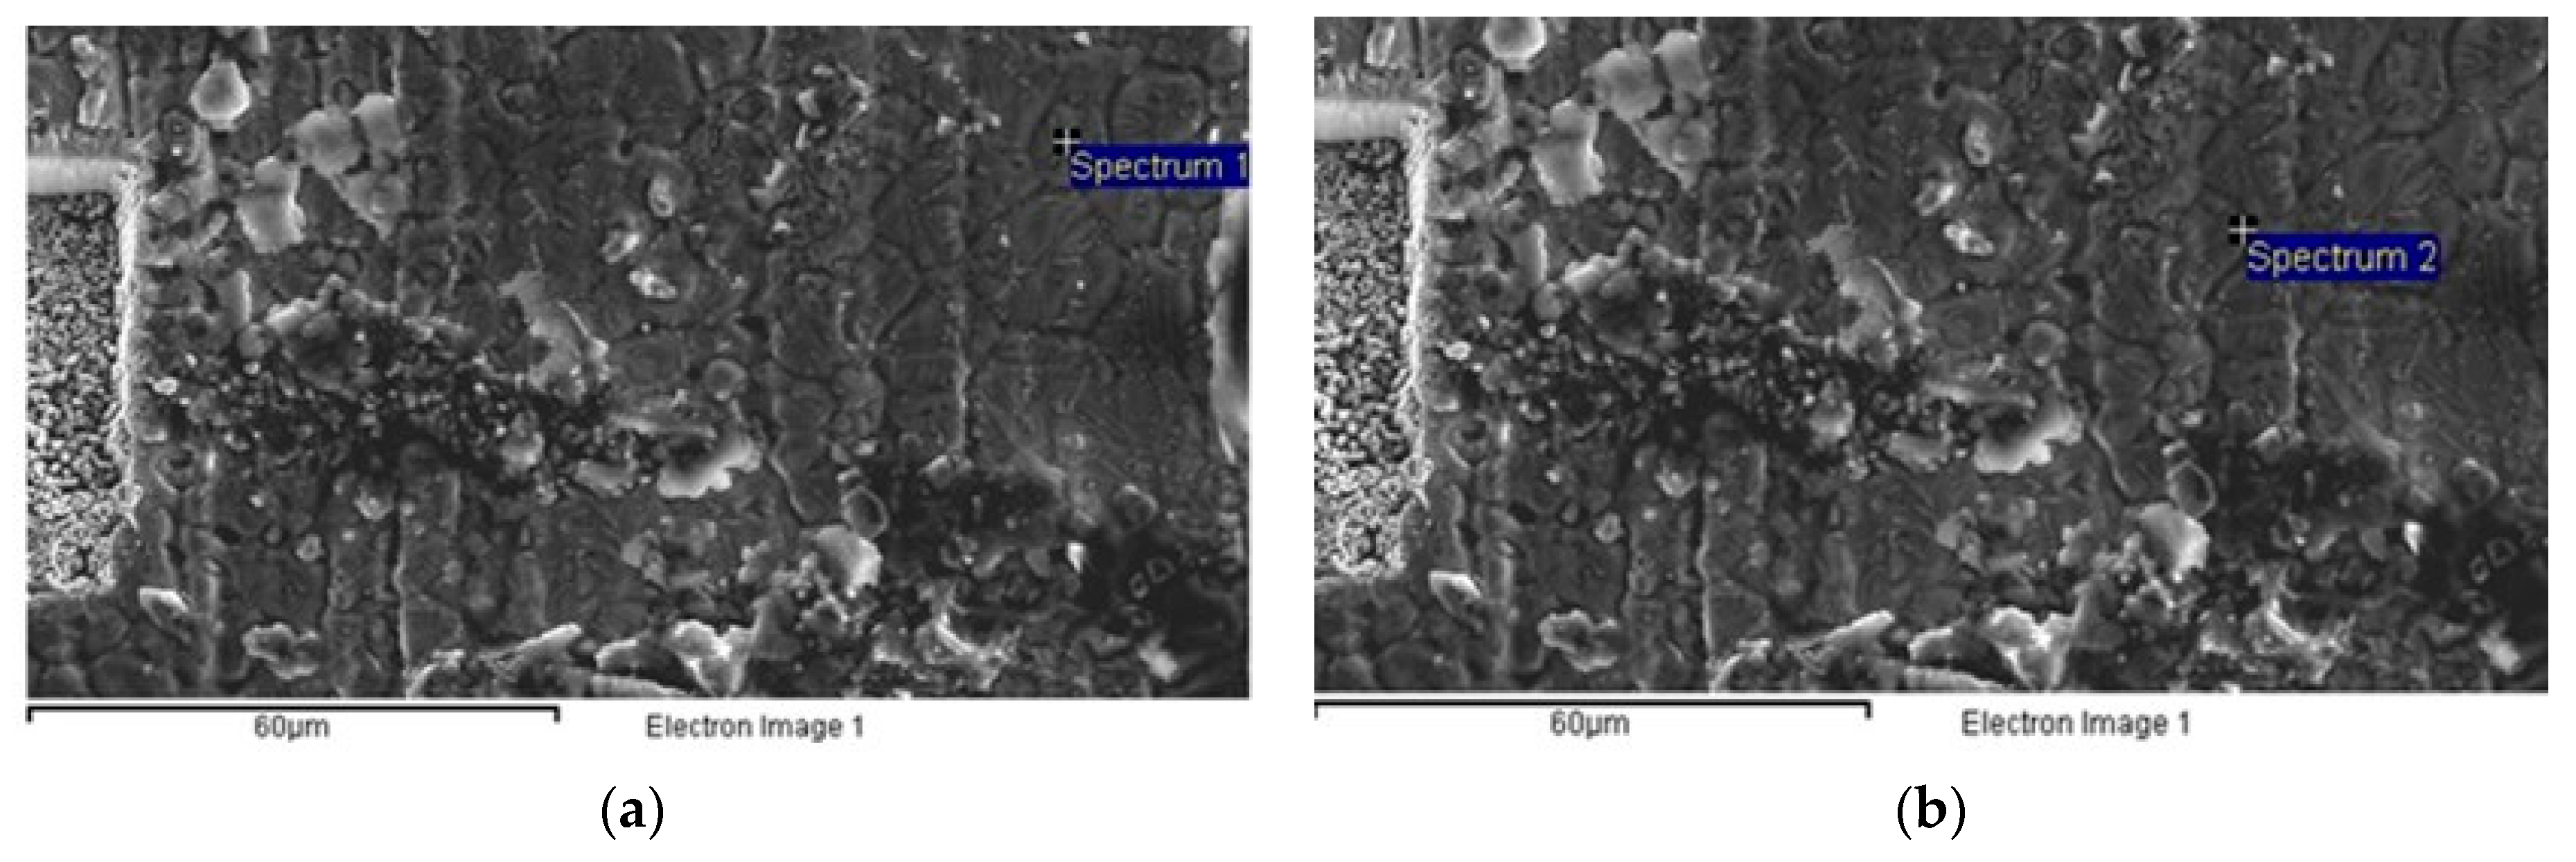
4.3. Inconel 625, 100 H
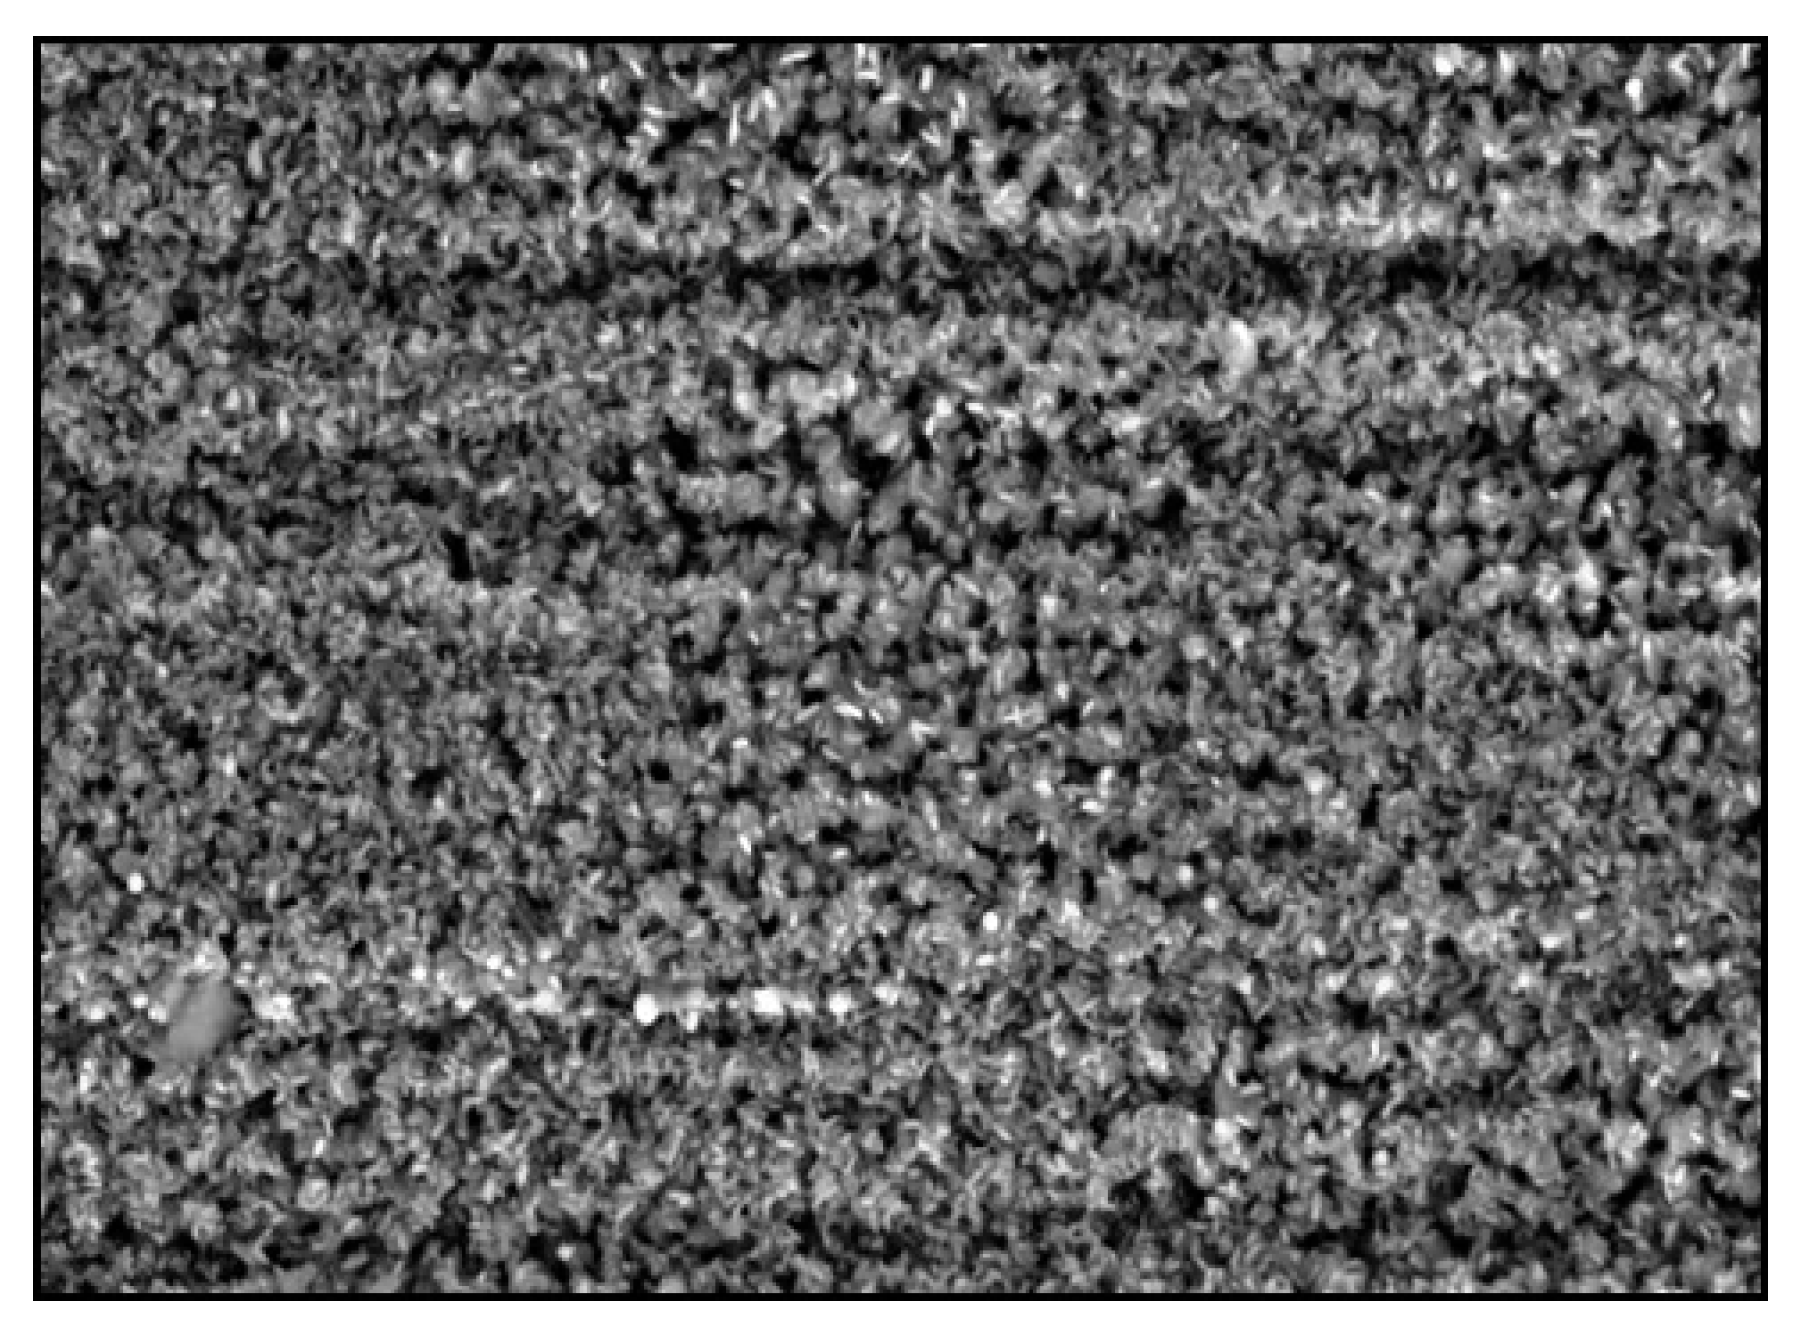
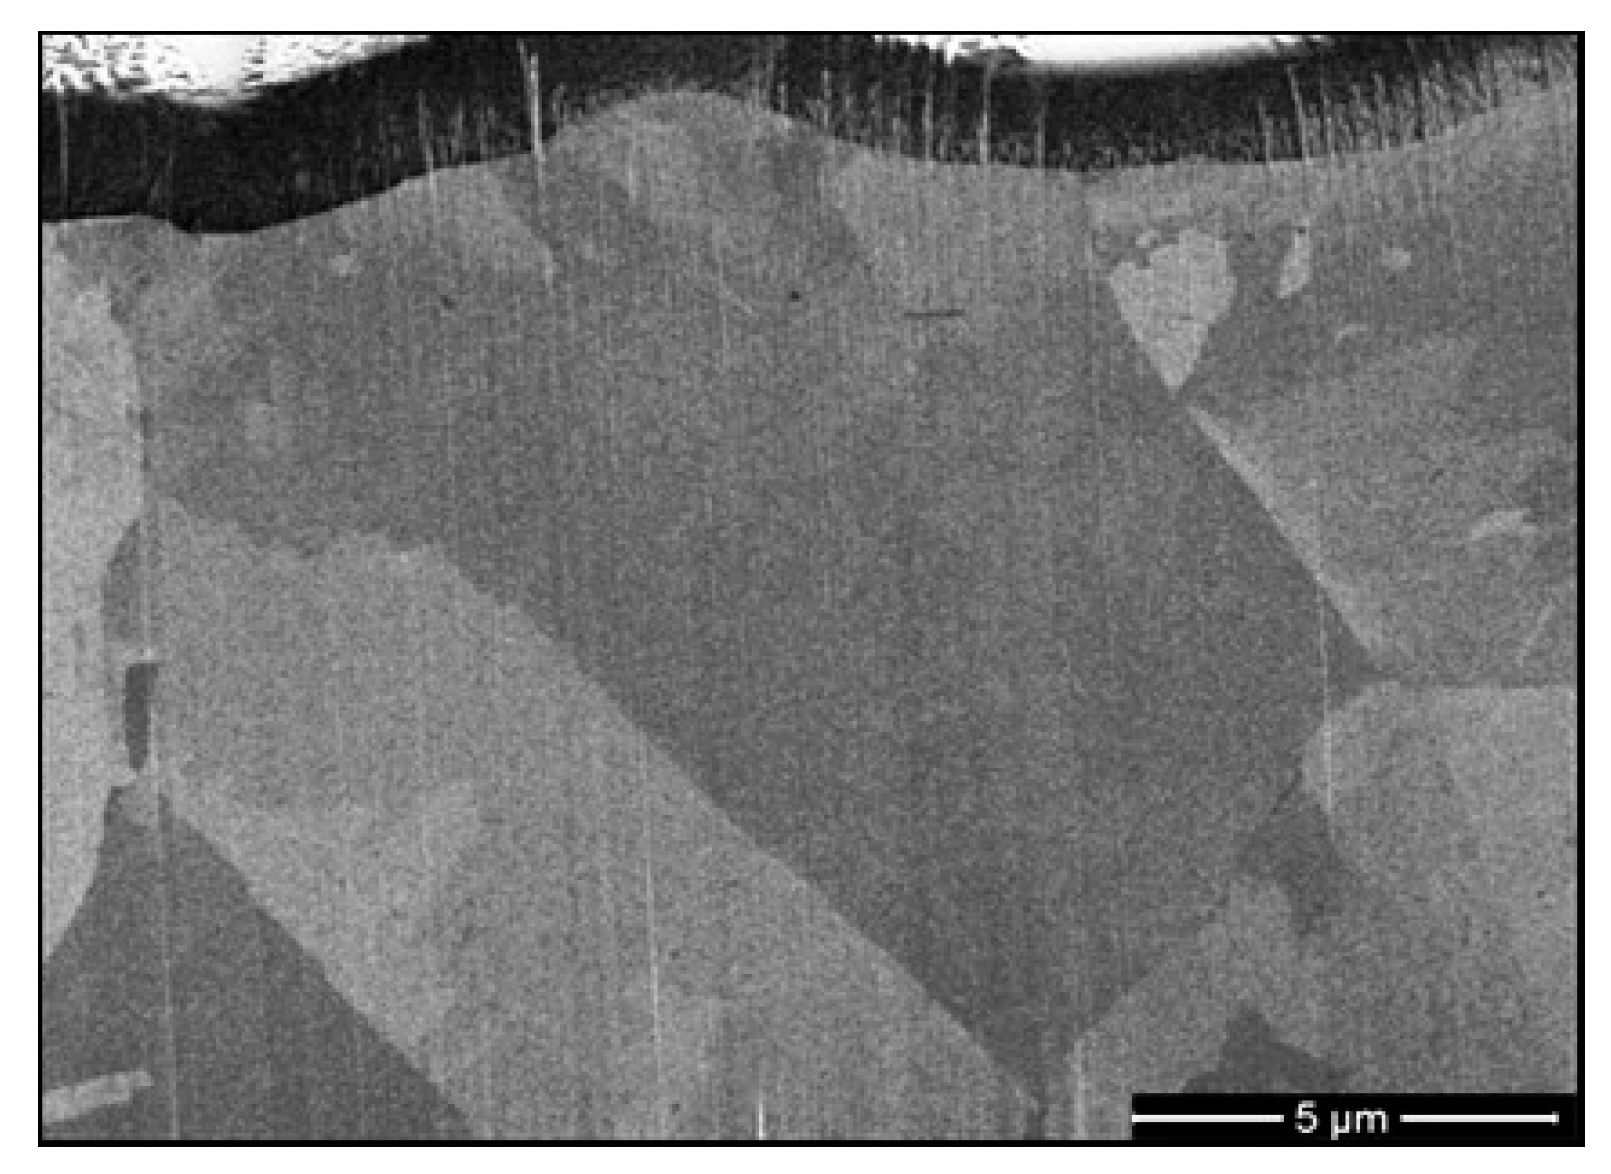
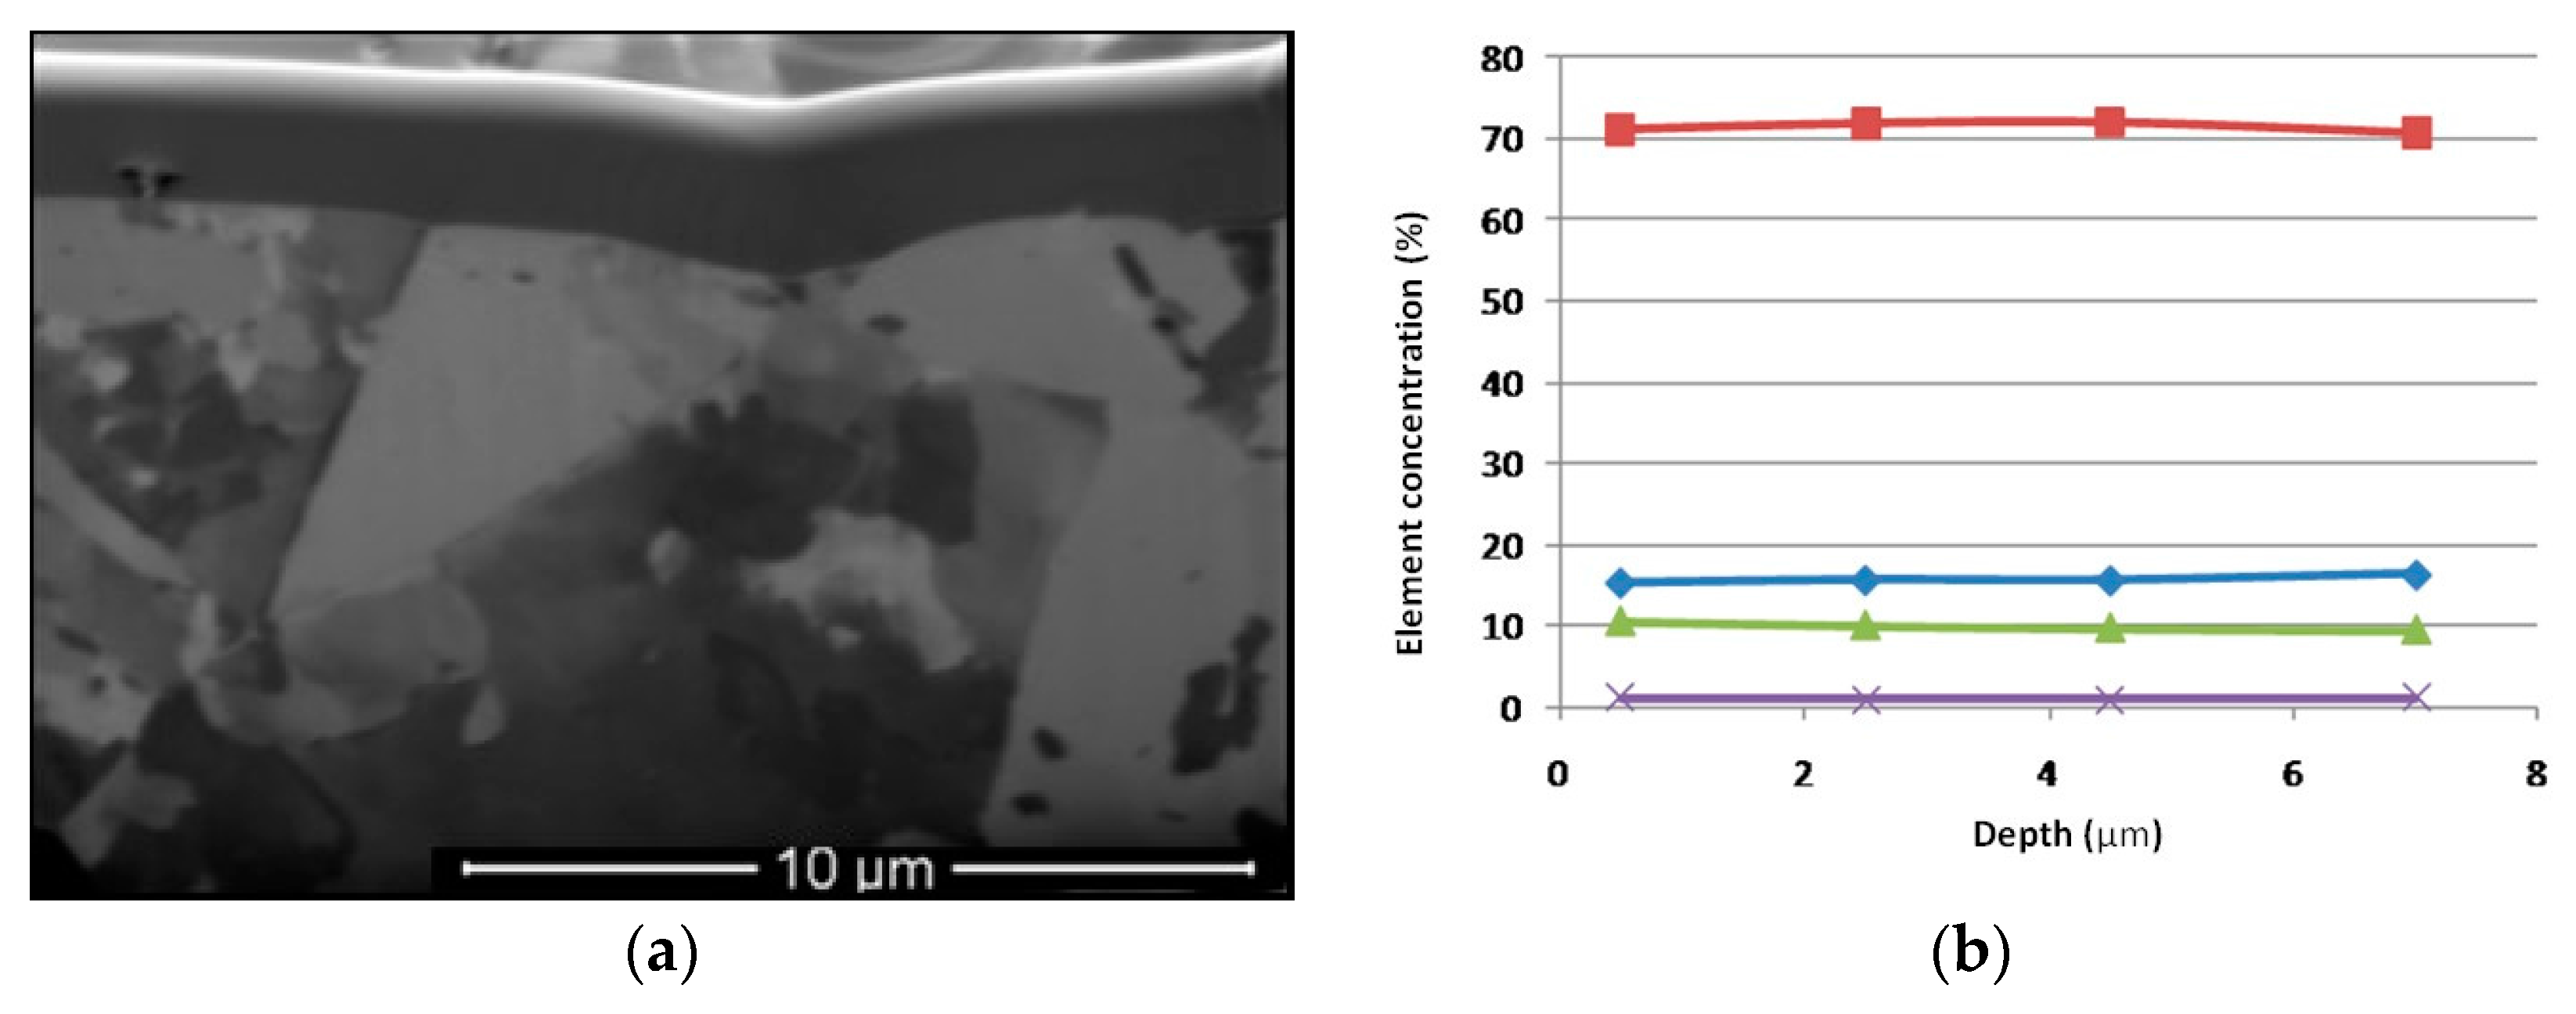
4.4. Inconel 625, 2500 H
5. Conclusions
Acknowledgments
Author Contributions
Conflicts of Interest
Abbreviations
| CSP | Concentrating Solar Power |
| EDX | Energy-Dispersive X-ray Spectroscopy |
| PCM | Phase Change Material |
| SEM | Scanning Electron Microscopy |
| TES | Thermal Energy Storage |
| EDX | Energy Dispersive X-ray Spectroscopy |
References
- Gil, A.; Medrano, M.; Martorell, I.; Lázaro, A.; Dolado, P.; Zalba, B.; Cabeza, L.F. State of the art on high temperature thermal energy storage for power generation. Part 1—Concepts, materials and modellization. Renew. Sustain. Energy Rev. 2010, 14, 31–55. [Google Scholar] [CrossRef]
- Kuravi, S.; Trahan, J.; Goswami, Y.; Rahman, M.M.; Stefanakos, E.K.; Goswami, D.Y.; Rahman, M.M.; Stefanakos, E.K.; Goswami, Y.; Rahman, M.M.; et al. Thermal energy storage technologies and systems for concentrating solar power plants. Prog. Energy Combust. Sci. 2013, 39, 285–319. [Google Scholar] [CrossRef]
- Stine, W.B.; Diver, R.B. A Compendium of Solar Dish/Stirling Technology; Sandia National Laboratories: Albuquerque, NM, USA, 1994.
- Zheng, Y.; Zhao, W.; Sabol, J.C.; Tuzla, K.; Neti, S.; Oztekin, A.; Chen, J.C. Encapsulated phase change materials for energy storage—Characterization by calorimetry. Sol. Energy 2013, 87, 117–126. [Google Scholar] [CrossRef]
- Zhao, W.; Zheng, Y.; Sabol, J.C.; Tuzla, K.; Neti, S.; Oztekin, A.; Chen, J.C. High temperature calorimetry and use of magnesium chloride for thermal energy storage. Renew. Energy 2013, 50, 988–993. [Google Scholar] [CrossRef]
- Solomon, L.; Oztekin, A.; Neti, S.; Jain, H.; Pfeifer, T.; Matyáš, J.; Balaya, P.; Singh, D.; Wei, J. Determination of Parameters for Improved Efficiency in Thermal Energy Storage Using Encapsulated Phase Change Materials. In Ceramics for Energy Conversion, Storage, and Distribution Systems; Pfeifer, T., Matyas, J., Balaya, P., Wei, J., Singh, D., Eds.; John Wiley & Sons, Inc.: Hoboken, NJ, USA, 2016; pp. 219–226. ISBN 9781119234531. [Google Scholar]
- Ushak, S.; Grageda, M. Using Molten Salts and Other Liquid Sensible Storage Media in Thermal Energy Storage (TES) Systems; Woodhead Publishing Limited: Sawston/Cambridge, UK, 2015; ISBN 9781782420965. [Google Scholar]
- Gomez, J.; Glatzmaier, G.C.; Starace, A.; Turchi, C.; Ortega, J. High Temperature Phase Change Materials for Thermal Energy Storage Applications Preprint. In Proceedings of the SolarPACES 2011, Granada, Spain, 20–23 September 2011. [Google Scholar]
- Singh, D.; Zhao, W.; Yu, W.; France, D.M.; Kim, T. Analysis of a graphite foam-NaCl latent heat storage system for supercritical CO2 power cycles for concentrated solar power. Sol. Energy 2015, 118, 232–242. [Google Scholar] [CrossRef]
- Thapa, S.; Chukwu, S.; Khaliq, A.; Weiss, L. Fabrication and analysis of small-scale thermal energy storage with conductivity enhancement. Energy Convers. Manag. 2014, 79, 161–170. [Google Scholar] [CrossRef]
- Almajali, M.; Lafdi, K.; Prodhomme, P.H. Effect of copper coating on infiltrated PCM/foam. Energy Convers. Manag. 2013, 66, 336–342. [Google Scholar] [CrossRef]
- Kim, T.; France, D.M.; Yu, W.; Zhao, W.; Singh, D. Heat transfer analysis of a latent heat thermal energy storage system using graphite foam for concentrated solar power. Sol. Energy 2014, 103, 438–447. [Google Scholar] [CrossRef]
- Zhao, C.Y.; Wu, Z.G. Heat transfer enhancement of high temperature thermal energy storage using metal foams and expanded graphite. Sol. Energy Mater. Sol. Cells 2011, 95, 636–643. [Google Scholar] [CrossRef]
- Baby, R.; Balaji, C. Experimental investigations on thermal performance enhancement and effect of orientation on porous matrix filled PCM based heat sink. Int. Commun. Heat Mass Transf. 2013, 46, 27–30. [Google Scholar] [CrossRef]
- Alam, T.E.; Dhau, J.S.; Goswami, D.Y.; Stefanakos, E. Macroencapsulation and characterization of phase change materials for latent heat thermal energy storage systems. Appl. Energy 2015, 154, 92–101. [Google Scholar] [CrossRef]
- Jacob, R.; Bruno, F. Review on shell materials used in the encapsulation of phase change materials for high temperature thermal energy storage. Renew. Sustain. Energy Rev. 2015, 48, 79–87. [Google Scholar] [CrossRef]
- Xu, B.; Li, P.; Chan, C. Application of phase change materials for thermal energy storage in concentrated solar thermal power plants: A review to recent developments. Appl. Energy 2015, 160, 286–307. [Google Scholar] [CrossRef]
- Solomon, L.; Elmozughi, A.F.; Neti, S.; Oztekin, A. High temperature thermal energy storage using EPCM-The effect of void. In Proceedings of the ASME International Mechanical Engineering Congress and Exposition (IMECE), Montreal, QC, Canada, 14–20 November 2014; Volume 6B. [Google Scholar]
- Solomon, L.; Oztekin, A. Encapsulated Phase Change Materials for use in High Temperature Thermal Energy Storage Encapsulated Phase Change Materials for use in High Temperature Thermal Energy Storage. In Advances in Energy Research; Acosta, M.J., Ed.; Nova Science Publishers Inc.: Hauppauge, NY, USA, 2016; ISBN 978-1-63485-515-0. [Google Scholar]
- Zheng, Y.; Barton, J.L.; Tuzla, K.; Chen, J.C.; Neti, S.; Oztekin, A.; Misiolek, W.Z. Experimental and computational study of thermal energy storage with encapsulated NaNO3 for high temperature applications. Sol. Energy 2015, 115, 180–194. [Google Scholar] [CrossRef]
- Elmozughi, A.F.; Solomon, L.; Oztekin, A.; Neti, S. Encapsulated phase change material for high temperature thermal energy storage—Heat transfer analysis. Int. J. Heat Mass Transf. 2014, 78, 1135–1144. [Google Scholar] [CrossRef]
- Solomon, L.; Elmozughi, A.F.; Oztekin, A.; Neti, S. Effect of internal void placement on the heat transfer performance—Encapsulated phase change material for energy storage. Renew. Energy 2015, 78, 438–447. [Google Scholar] [CrossRef]
- Liu, M.; Saman, W.; Bruno, F. Review on storage materials and thermal performance enhancement techniques for high temperature phase change thermal storage systems. Renew. Sustain. Energy Rev. 2012, 16, 2118–2132. [Google Scholar] [CrossRef]
- Sharifi, N.; Bergman, T.L.; Faghri, A. Enhancement of PCM melting in enclosures with horizontally-finned internal surfaces. Int. J. Heat Mass Transf. 2011, 54, 4182–4192. [Google Scholar] [CrossRef]
- Hosseini, M.J.; Ranjbar, A.A.; Rahimi, M.; Bahrampoury, R. Experimental and numerical evaluation of longitudinally finned latent heat thermal storage systems. Energy Build. 2015, 99, 263–272. [Google Scholar] [CrossRef]
- Shabgard, H.; Allen, M.J.; Sharifi, N.; Benn, S.P.; Faghri, A.; Bergman, T.L. Heat pipe heat exchangers and heat sinks: Opportunities, challenges, applications, analysis, and state of the art. Int. J. Heat Mass Transf. 2015, 89, 138–158. [Google Scholar] [CrossRef]
- Naghavi, M.S.; Ong, K.S.; Mehrali, M.; Badruddin, I.A.; Metselaar, H.S.C. A state-of-the-art review on hybrid heat pipe latent heat storage systems. Energy Convers. Manag. 2015, 105, 1178–1204. [Google Scholar] [CrossRef]
- Sharifi, N.; Wang, S.; Bergman, T.L.; Faghri, A. Heat pipe-assisted melting of a phase change material. Int. J. Heat Mass Transf. 2012, 55, 3458–3469. [Google Scholar] [CrossRef]
- Motahar, S.; Khodabandeh, R. Experimental study on the melting and solidification of a phase change material enhanced by heat pipe. Int. Commun. Heat Mass Transf. 2016, 73, 1–6. [Google Scholar] [CrossRef]
- Tiari, S.; Qiu, S.; Mahdavi, M. Numerical study of finned heat pipe-assisted thermal energy storage system with high temperature phase change material. Energy Convers. Manag. 2015, 89, 833–842. [Google Scholar] [CrossRef]
- Tiari, S.; Qiu, S. Three-dimensional simulation of high temperature latent heat thermal energy storage system assisted by finned heat pipes. Energy Convers. Manag. 2015, 105, 260–271. [Google Scholar] [CrossRef]
- Tiari, S.; Qiu, S.; Mahdavi, M. Discharging Process of a Finned Heat Pipe–assisted Thermal Energy Storage System with High Temperature Phase Change Material. Energy Convers. Manag. 2016, 118, 426–437. [Google Scholar] [CrossRef]
- Mahdavi, M.; Qiu, S. Mathematical modeling and analysis of steady state performance of a heat pipe network. Appl. Therm. Eng. 2015, 91, 556–573. [Google Scholar] [CrossRef]
- Mahdavi, M.; Qiu, S.; Tiari, S. Improvement of a novel heat pipe network designed for latent heat thermal energy storage systems. Appl. Therm. Eng. 2016, 108, 878–892. [Google Scholar] [CrossRef]
- Mahdavi, M.; Qiu, S.; Tiari, S. Numerical investigation of hydrodynamics and thermal performance of a specially configured heat pipe for high-temperature thermal energy storage systems. Appl. Therm. Eng. 2015, 81, 325–337. [Google Scholar] [CrossRef]
- Mohammadi Zahrani, E.; Alfantazi, A.M. Molten salt induced corrosion of Inconel 625 superalloy in PbSO4–Pb3O4–PbCl2–Fe2O3–ZnO environment. Corros. Sci. 2012, 65, 340–359. [Google Scholar] [CrossRef]
- Sarvghad, M.; Steinberg, T.A.; Will, G. Corrosion of steel alloys in eutectic NaCl + Na2CO3 at 700 °C and Li2CO3 + K2CO3 + Na2CO3 at 450 °C for thermal energy storage. Sol. Energy Mater. Sol. Cells 2017, 170, 48–59. [Google Scholar] [CrossRef]
- Liu, S.; Liu, Z.; Wang, Y.; Tang, J. A comparative study on the high temperature corrosion of TP347H stainless steel, C22 alloy and laser-cladding C22 coating in molten chloride salts. Corros. Sci. 2014, 83, 396–408. [Google Scholar] [CrossRef]
- Gomez-Vidal, J.C.; Tirawat, R. Corrosion of alloys in a chloride molten salt (NaCl–LiCl) for solar thermal technologies. Sol. Energy Mater. Sol. Cells 2016, 157, 234–244. [Google Scholar] [CrossRef]
- Sarvghad, M.; Will, G.; Steinberg, T.A. Corrosion of Inconel 601 in molten salts for thermal energy storage. Sol. Energy Mater. Sol. Cells 2017, 172, 220–229. [Google Scholar] [CrossRef]
- Lacy, D.; Coles-Hamilton, C.; Juhasz, A. Selection of High Temperature Thermal Energy Storage Materiials for Advanced Solar Dynamic Space Power Systems. In Proceedings of the Twenty-Second Intersociety Energy Conversion Engineering Conference (IECEC ’87), Philadelphia, PA, USA, 10–15 August 1987. [Google Scholar]
- Mancini, T.; Heller, P.; Butler, B.; Osborn, B.; Schiel, W.; Goldberg, V.; Buck, R.; Diver, R.; Andraka, C.; Moreno, J. Dish-Stirling Systems: An Overview of Development and Status. J. Sol. Energy Eng. 2003, 125, 135–151. [Google Scholar] [CrossRef]
- Qiu, S.; Solomon, L.; Rinker, G. Development of an Integrated Thermal Energy Storage and Free-Piston Stirling Generator for a Concentrating Solar Power System. Energies 2017, 10, 1361. [Google Scholar] [CrossRef]
- White, M.; Qiu, S.; Galbraith, R. Phase Change Salt Thermal Energy Storage for Dish Stirling Solar Power Systems. In Proceedings of the ASME 2013 7th International Conference on Energy Sustainability, Minneapolis, MN, USA, 14–19 July 2013. [Google Scholar] [CrossRef]
- Lide, D.R. CRC Handbook of Chemistry and Physics; CRC Press: Boca Raton, FL, USA, 1998. [Google Scholar]
- Mamantov, G.; Marassi, R. Molten Salt Chemistry: An Introduction and Selected Applications; Springer: Berlin, Germany, 1987; ISBN 978-94-009-3863-2. [Google Scholar]
- Grimes, W.R. Molten-Salt Reactor Chemistry. Nucl. Appl. Technol. 1970, 8, 137–155. [Google Scholar] [CrossRef]
- Luo, A.; Jacobson, D.L.; Ponnappan, R. Compatibility of Inconel 617R Alloy with LIF-MGF2-Kf Thermal Energy Storage Salts and Vacuum at High Temperature. J. Mater. Eng. Perform. 1992, 1, 755–761. [Google Scholar] [CrossRef]
- Khanna, A.S. Introduction to High Temperature Oxidation and Corrosion; ASM International: Materials Park, OH, USA, 2002; ISBN 0-87170-762-4. [Google Scholar]
- Dieter, G.E.; Kuhn, H.A.; Semiatin, S.L. Handbook of Workability and Process Design; ASM International: Materials Park, OH, USA, 2003; ISBN 0-87170-778-0. [Google Scholar]


| Candidate Material | Alloy | Ni | Fe + Cr | $ Rank |
|---|---|---|---|---|
| Stainless Steel 316L | Fe–Cr | Low | High | Low |
| Incoloy 800HT | Ni–Fe |  |  | |
| Inconel 617 | Ni–Cr | |||
| Inconel 625 | Ni–Cr | |||
| Hastelloy N | Hi Ni | High | Low | High |
| Sample Material | C | Fe | Cr | Ni | Mo | Mn | Cu |
|---|---|---|---|---|---|---|---|
| SS 316L | 0.21% | 78% | 16.5% | 10.1% | 2.05% | 1.7% | 0.43% |
| Sample Material | C | Fe | Cr | Ni | Mo | Nb | Al |
|---|---|---|---|---|---|---|---|
| Inconel 625 | 0.005% | 1% | 20.5% | 66% | 8.3% | 3.38% | 0.21% |
| Sample Material | O | Fe | Cr | Ni | Mn | Cu |
|---|---|---|---|---|---|---|
| SS 316L | 1.6% | 46% | 18.4% | 5% | 23% | 2% |
| Sample Site | O% | F% | Na% | Fe% | Cr% | Ni% | Mo% | Mn% |
|---|---|---|---|---|---|---|---|---|
| 1 | - | - | - | 71 | 11.62 | 10.9 | 6 | - |
| 2 | 2.55 | - | - | 61 | 10.54 | 8.7 | 10.2 | - |
| 3 | 1.78 | - | 1.57 | 70 | 11.24 | 10.3 | 3 | - |
| 4 | 11 | 13.4 | 16.7 | 11.5 | 33.06 | 1.6 | - | 2.1 |
| Sample Site | O% | Cl% | Na% | Fe% | Cr% | Ni% | Mo% | Mn% |
|---|---|---|---|---|---|---|---|---|
| 1 | 1.7 | 20.5 | 10.5 | 50 | 15.2 | 9.6 | 1.6 | 0.5 |
| 2 | 1.1 | - | - | 70.1 | 17.1 | 8.7 | 1.5 | 1.0 |
| 3 | 1.4 | 0.3 | 1.57 | 71 | 11.24 | 9.1 | 3 | 0.7 |
| Sample Material | O% | Fe% | Cr% | Ni% | Mo% | Nb% | Al% |
|---|---|---|---|---|---|---|---|
| Inconel 625 | 0.47 | 1.6 | 20.7 | 65.4 | 8.4 | 3.2 | 0.3 |
| Element | Cr | O | Ni | Mo | Fe | Na |
|---|---|---|---|---|---|---|
| Atomic% | 49 | 31 | 21.5 | 1.5 | 0.6 | 0.25 |
| Sample Site | Cr% | Ni% | O% | Mo% | Fe% | Al% | Mn% | Na% | Cl% |
|---|---|---|---|---|---|---|---|---|---|
| 1 | 53.2 | 31.7 | 12.9 | 2.8 | 1 | - | - | - | - |
| 2 | 18 | 67.9 | 3.9 | 4.4 | 1.7 | 4.4 | 0.1 | - | - |
| 3 | 18.6 | 68 | 3.7 | 4.6 | 1.7 | 3.1 | 0.16 | - | 0.2 |
| 4 | 18.2 | 74.6 | 0.35 | 5.1 | 1.7 | - | 0.1 | - | - |
| Sample Site | Ni% | Cr% | Fe% | Mo% | Nb% | O% | Na% | Cl% |
|---|---|---|---|---|---|---|---|---|
| 1 | 64.6 | 19.1 | 1.4 | 2.4 | 0.4 | 0.43 | 7 | 3.7 |
| 2 | 72.7 | 18.4 | 1.5 | 5.6 | 1.2 | 30.57 | - | - |
| 3 | 71.5 | 20.7 | 1.3 | 5.2 | 1.2 | 3.7 | - | 0.2 |
| 4 | 71 | 19.1 | 1.4 | 5.1 | 1.2 | 0.35 | - | - |
© 2018 by the authors. Licensee MDPI, Basel, Switzerland. This article is an open access article distributed under the terms and conditions of the Creative Commons Attribution (CC BY) license (http://creativecommons.org/licenses/by/4.0/).
Share and Cite
Qiu, S.; Solomon, L.; Fang, M. Study of Material Compatibility for a Thermal Energy Storage System with Phase Change Material. Energies 2018, 11, 572. https://doi.org/10.3390/en11030572
Qiu S, Solomon L, Fang M. Study of Material Compatibility for a Thermal Energy Storage System with Phase Change Material. Energies. 2018; 11(3):572. https://doi.org/10.3390/en11030572
Chicago/Turabian StyleQiu, Songgang, Laura Solomon, and Ming Fang. 2018. "Study of Material Compatibility for a Thermal Energy Storage System with Phase Change Material" Energies 11, no. 3: 572. https://doi.org/10.3390/en11030572
APA StyleQiu, S., Solomon, L., & Fang, M. (2018). Study of Material Compatibility for a Thermal Energy Storage System with Phase Change Material. Energies, 11(3), 572. https://doi.org/10.3390/en11030572