Miscible CO2 Flooding for EOR in the Presence of Natural Gas Components in Displacing and Displaced Fluids

Department of Energy and Petroleum Engineering, University of Stavanger, 4036 Stavanger, Norway
*
Author to whom correspondence should be addressed.
Energies 2018, 11(2), 391; https://doi.org/10.3390/en11020391
Submission received: 1 December 2017
/
Revised: 4 February 2018
/
Accepted: 5 February 2018
/
Published: 8 February 2018
Abstract
:Carbon dioxide (CO2) flooding is a complicated process as it involves phase behavior. The objective of this work was to understand the mass transfer mechanisms during flooding with CO2 and CO2/C1/C3 (CO2/HC) based on experimental and simulated composition changes. Three model oil compositions were used (n-C10, n-C10/C1, and n-C10/C1/C3). For a comparison, crude oil from a North Sea field was included. The second part of the investigation was to compare the effect of the combined light components (C1/C3) with CO2 as a displacing fluid on enhanced oil recovery (EOR). Equation of State EOS SRK–Peneloux was used for the simulations to predict composition changes. The highest recovery was obtained from model oil (n-C10) displaced with CO2 compared to model oil containing light components with the highest recovery recorded from model oil/C1 (live oil A) compared to model oil/C1/C3 at all of the tested temperatures. The presence of light components (C1/C3) in the injected CO2 at miscible conditions increased the oil recovery for crude oil compared to flooding only with CO2. Transverse dispersion of CO2 helps in eliminating/reducing the effect of viscous instabilities by shortening fingering travel/widening the fingers. The collected samples contained water, although the flooding was done on dry sandstone cores. Possible mechanisms are discussed in a later section.
1. Introduction
Most of the mature fields are approaching tail production/declining phase. This decline has inclined researchers towards opting for enhanced oil recovery (EOR). CO2 flooding, which lies in both secondary and tertiary recovery stages, is considered a promising EOR technique. Patents and papers by Beeson and Ortloff [1], Holm and Josendal [2], and Holm [3] have laid the foundation of the CO2 oil recovery processes. Initially, when the EOR method was introduced, immiscible flooding was under discussion as an alternative water-based EOR process. The increased application of CO2 for EOR demonstrates the potential for EOR and storing of CO2. Ferguson et al. [4] and Hamouda and Pranoto [5] took the advantage of the CO2 water dissolution trapping and showed that instead of following one regime for the whole injection period, using different regimes could enhance the storage capacity, eliminate the limitation associated with the initial water in the storage site, and enhance the oil recovery. Hamouda and Pranoto [6] addressed the synergy between CO2 and low-salinity water. Fai-Yengo et al. [7] performed various experiments using different compositions of methane (C1) and ethane (C2) in the injected CO2 gas (displacing fluid) and concluded that an acceleration of the incremental oil recovery was observed in the case of the richer gas. Jin [8] studied the impact of CO2 impurity on minimum miscible pressure (MMP). Hamouda and Tabrizy [9] investigated the effect of recombined light components with CO2 as a displacing fluid for asphaltenic oil and concluded that the presence of light components reduces oil recovery in the presence of asphaltene.
Three major processes take place with the injection of CO2 into the oil. These are diffusion/mass transfer, solubility, and dispersion. Other factors that also affect the displacement efficiency with CO2 injection include density, viscosity difference between displacing and displaced fluids, mobility ratios, relative permeability, wetting properties of the rock, and injection and production rates and their changes during the injection period.
Moortgat et al. [10] investigated the overall CO2 composition (mole fraction) distribution for vertical and horizontal cores.
This work addresses oil recovery from both stabilized and live oils from sandstone reservoirs and the dynamic changes in their composition following flooding with CO2 alone and CO2 with light hydrocarbon. It is stated in the literature, (Jin. L, 2016), [8] that injection of pure CO2 does not necessarily lead to the best recovery. It was, therefore, decided to address the effect of light components in the model oil n-C10 compared to crude oil (from the North Sea) at 200 bars by flooding with CO2 and CO2/C1/C3 at different temperatures. Sampling and analysis of the components during flooding are tedious and time consuming. The work approach was to test combining EOS (PVT simulation) in order to ease the work and fulfil missing data.
2. Materials and Methods
Core flood experiments were performed using outcrop Bentheimer sandstone and Berea sandstone as indicated in Table 1. The two types of sandstone have almost the same physical and chemical properties. Both sandstone (outcrops) cores used in this work were acquired from Koucurek Industries Inc., Caldwell, TX, USA. In the comparison experiments, Berea sandstone cores were used. The cores were 9–10 cm in length and 3.8 cm in diameter. The porosity of the core was between 20% and 25% and the permeability was 900–1200 mD. Table 1 depicts the details of the core characteristics, the associated fluid used, and the flooding conditions. Table 2 shows the composition of the model oils (stabilized n-C10, live oil A (n-C10/C1), and live oil B (n-C10/C1/C3)). The composition of the light components in live oil A and live oil B were almost the same (about 20 mole %). The composition of the North Sea crude oil is given in Table 3.
2.1. Experimental Procedure
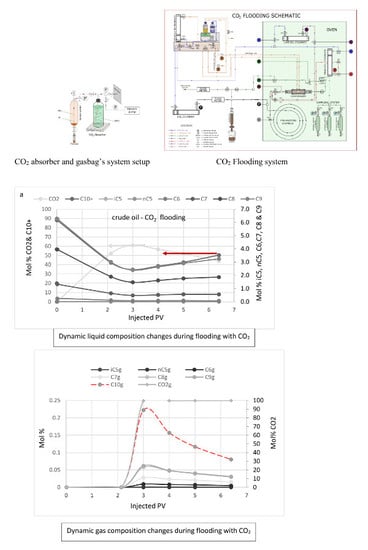
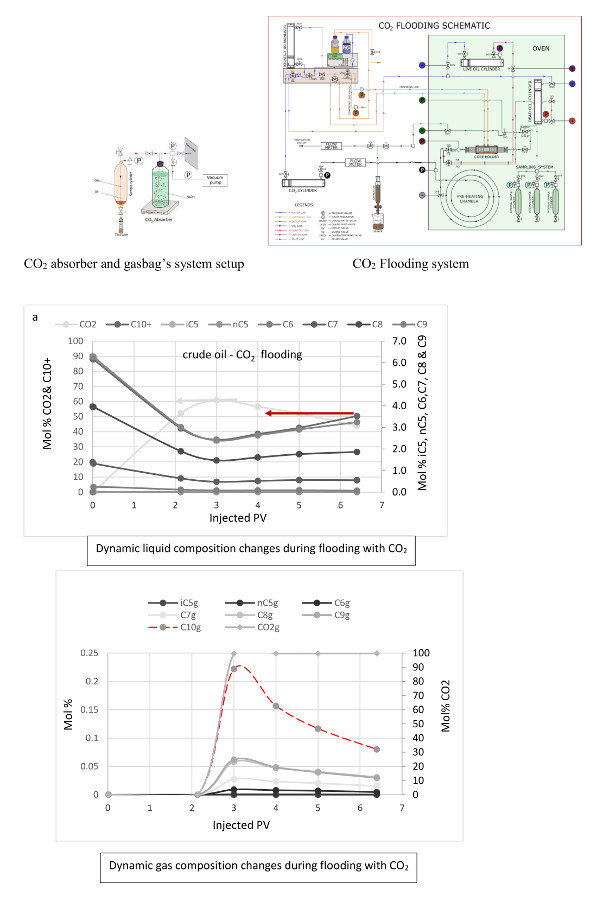
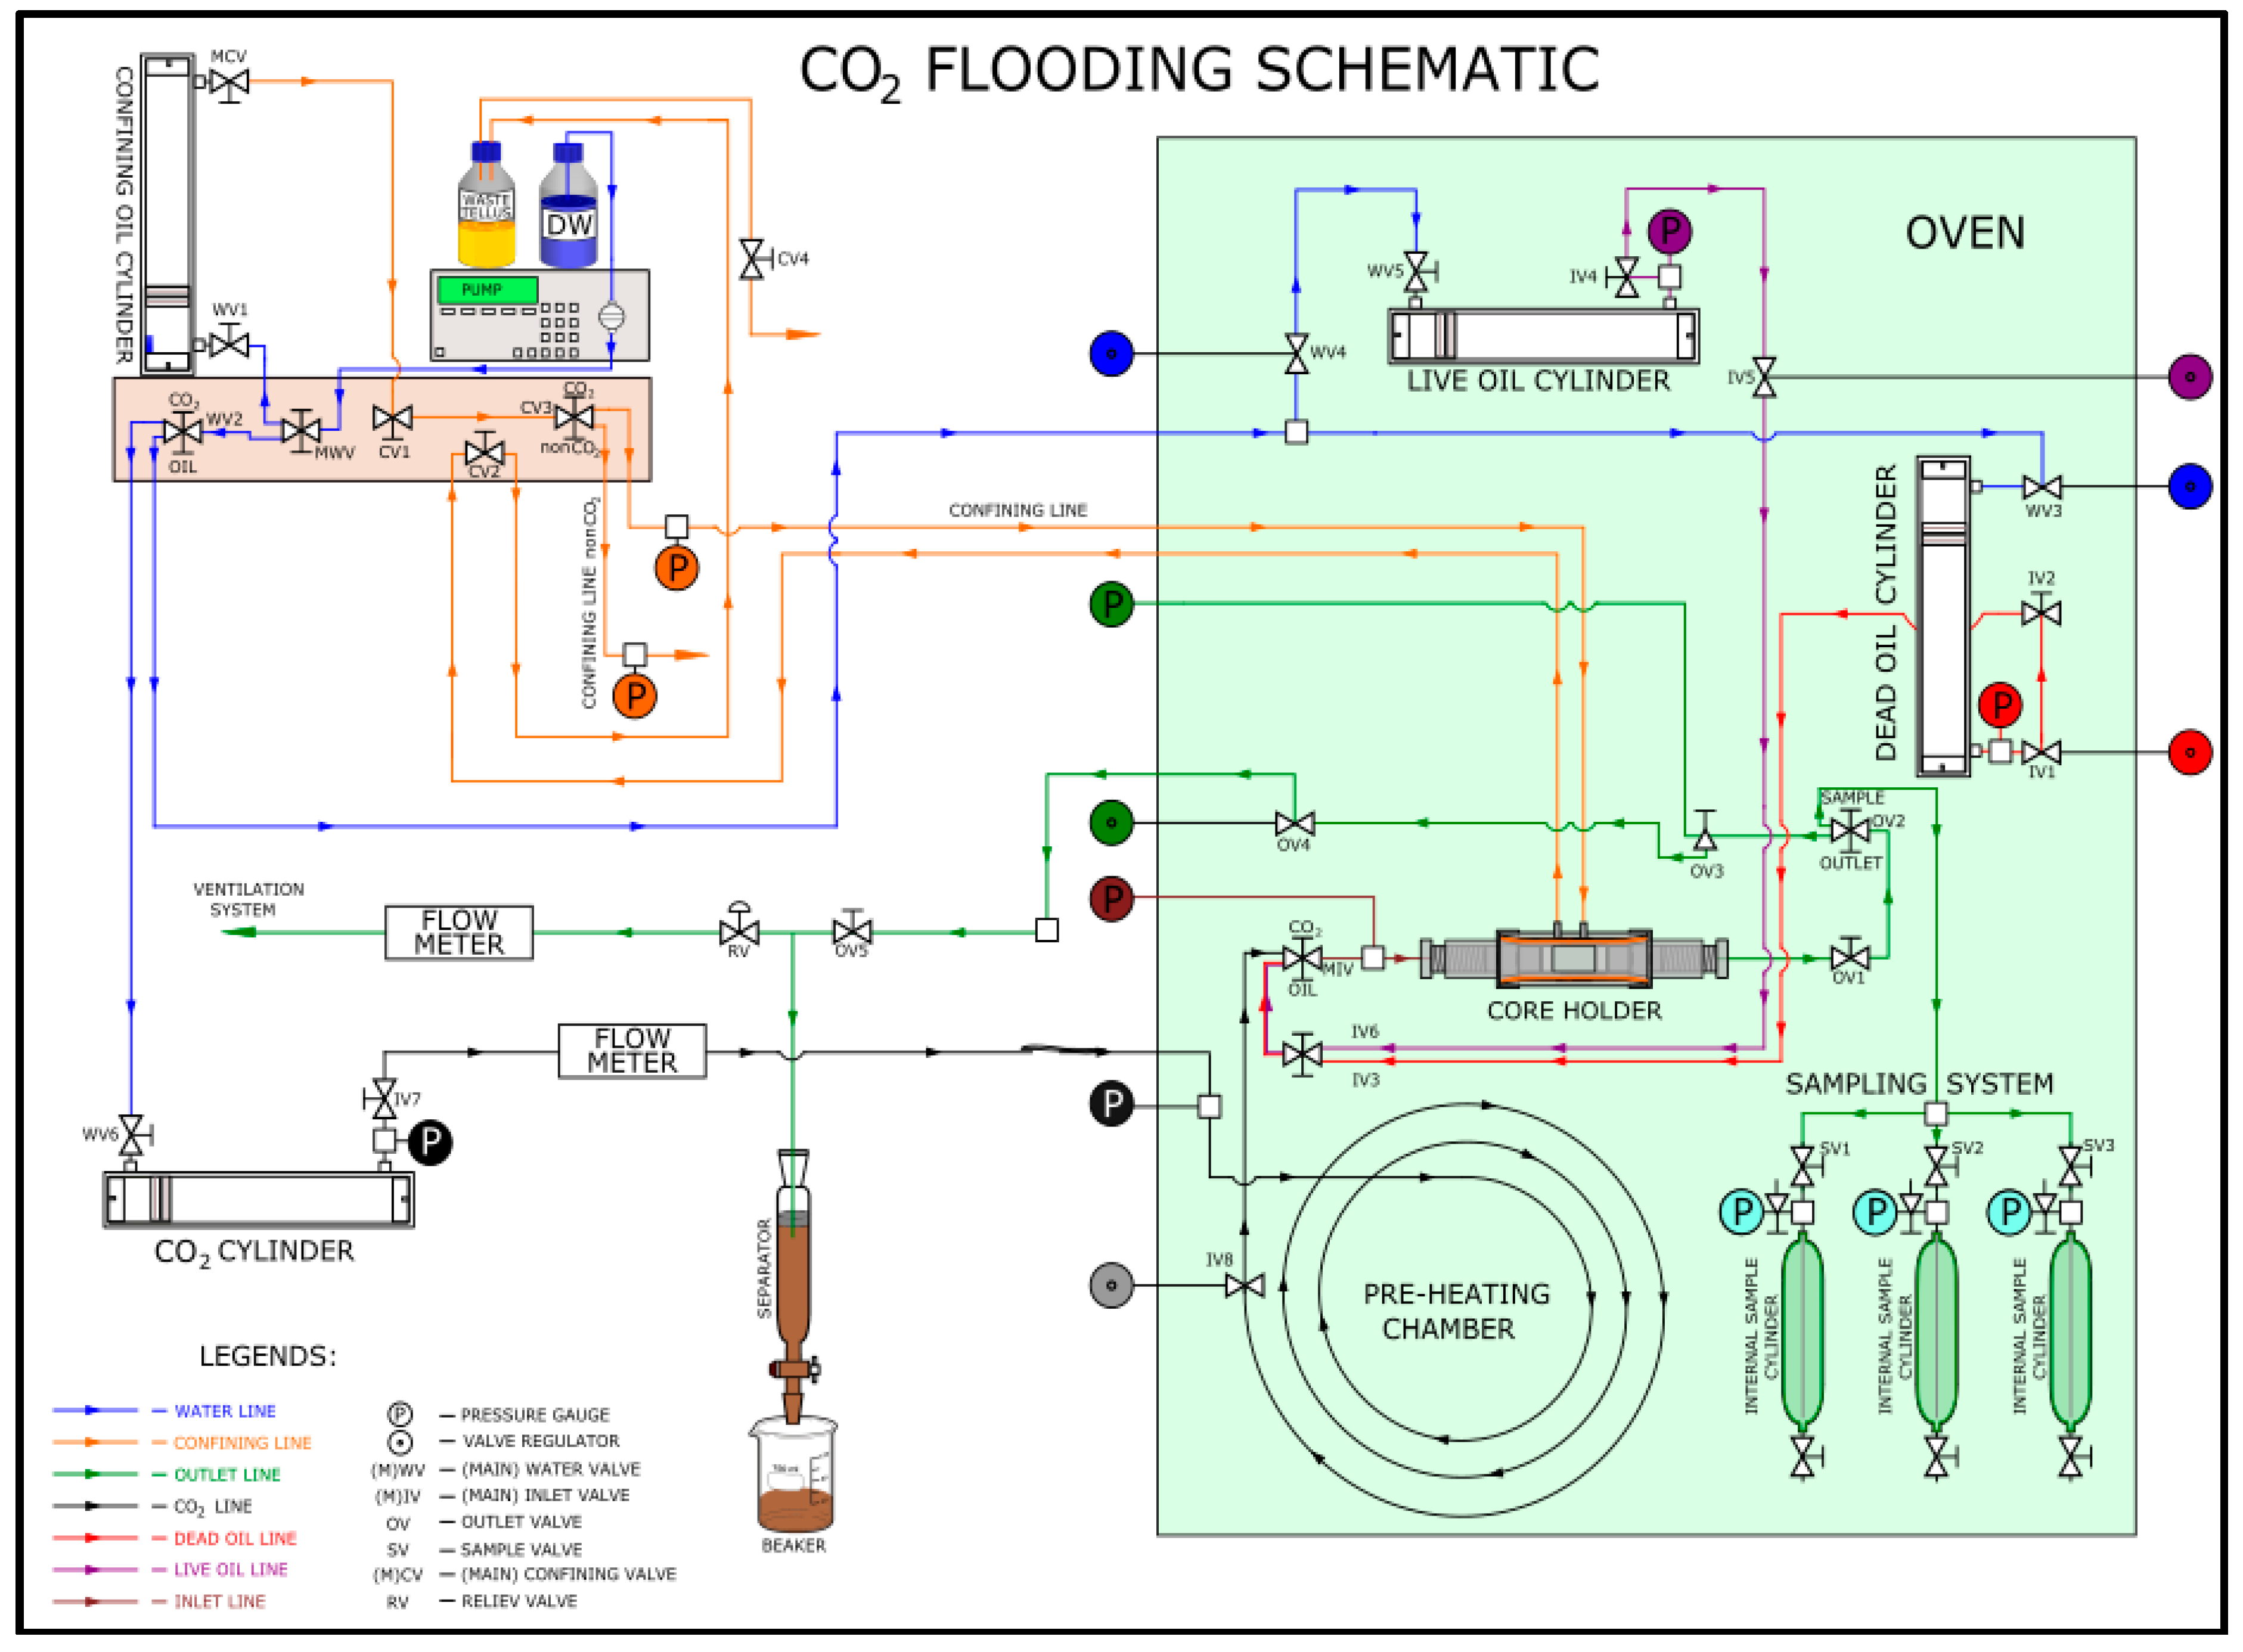
Figure 1 represents a schematic flow diagram of the experimental setup for the CO2 flooding. The main components of the setup were the core holders, inlet and outlet gas flowmeters, pressure regulators, Gilson pump, pressure manometers, graduated gas/oil separator, and the CO2 and live oil piston cylinders. LabVIEW version 7.1 was used for digital data acquisition. The cores were initially saturated with synthetic model oil and/or crude oil. The cores were aged for at least two weeks. Two weeks of aging at 50 °C was proven to be sufficient for altering the wettability. The aged cores were inserted into a rubber sleeve and then mounted in a core holder. In the case of live-oil experiments, about two pore volumes (PVs) of dead oil was displaced by live oil at a slow rate (0.05–0.09 mL/min) and further 2 PVs were displaced at a faster rate (0.1–0.5 mL/min). Once the cores were fully saturated with live oil (after a total of about 4 PVs), CO2 flooding started at 200 bar and temperatures of 50 °C, 70 °C, or 90 °C. The schematic diagram of the CO2 flooding system is shown in Figure 1.
2.2. Sampling
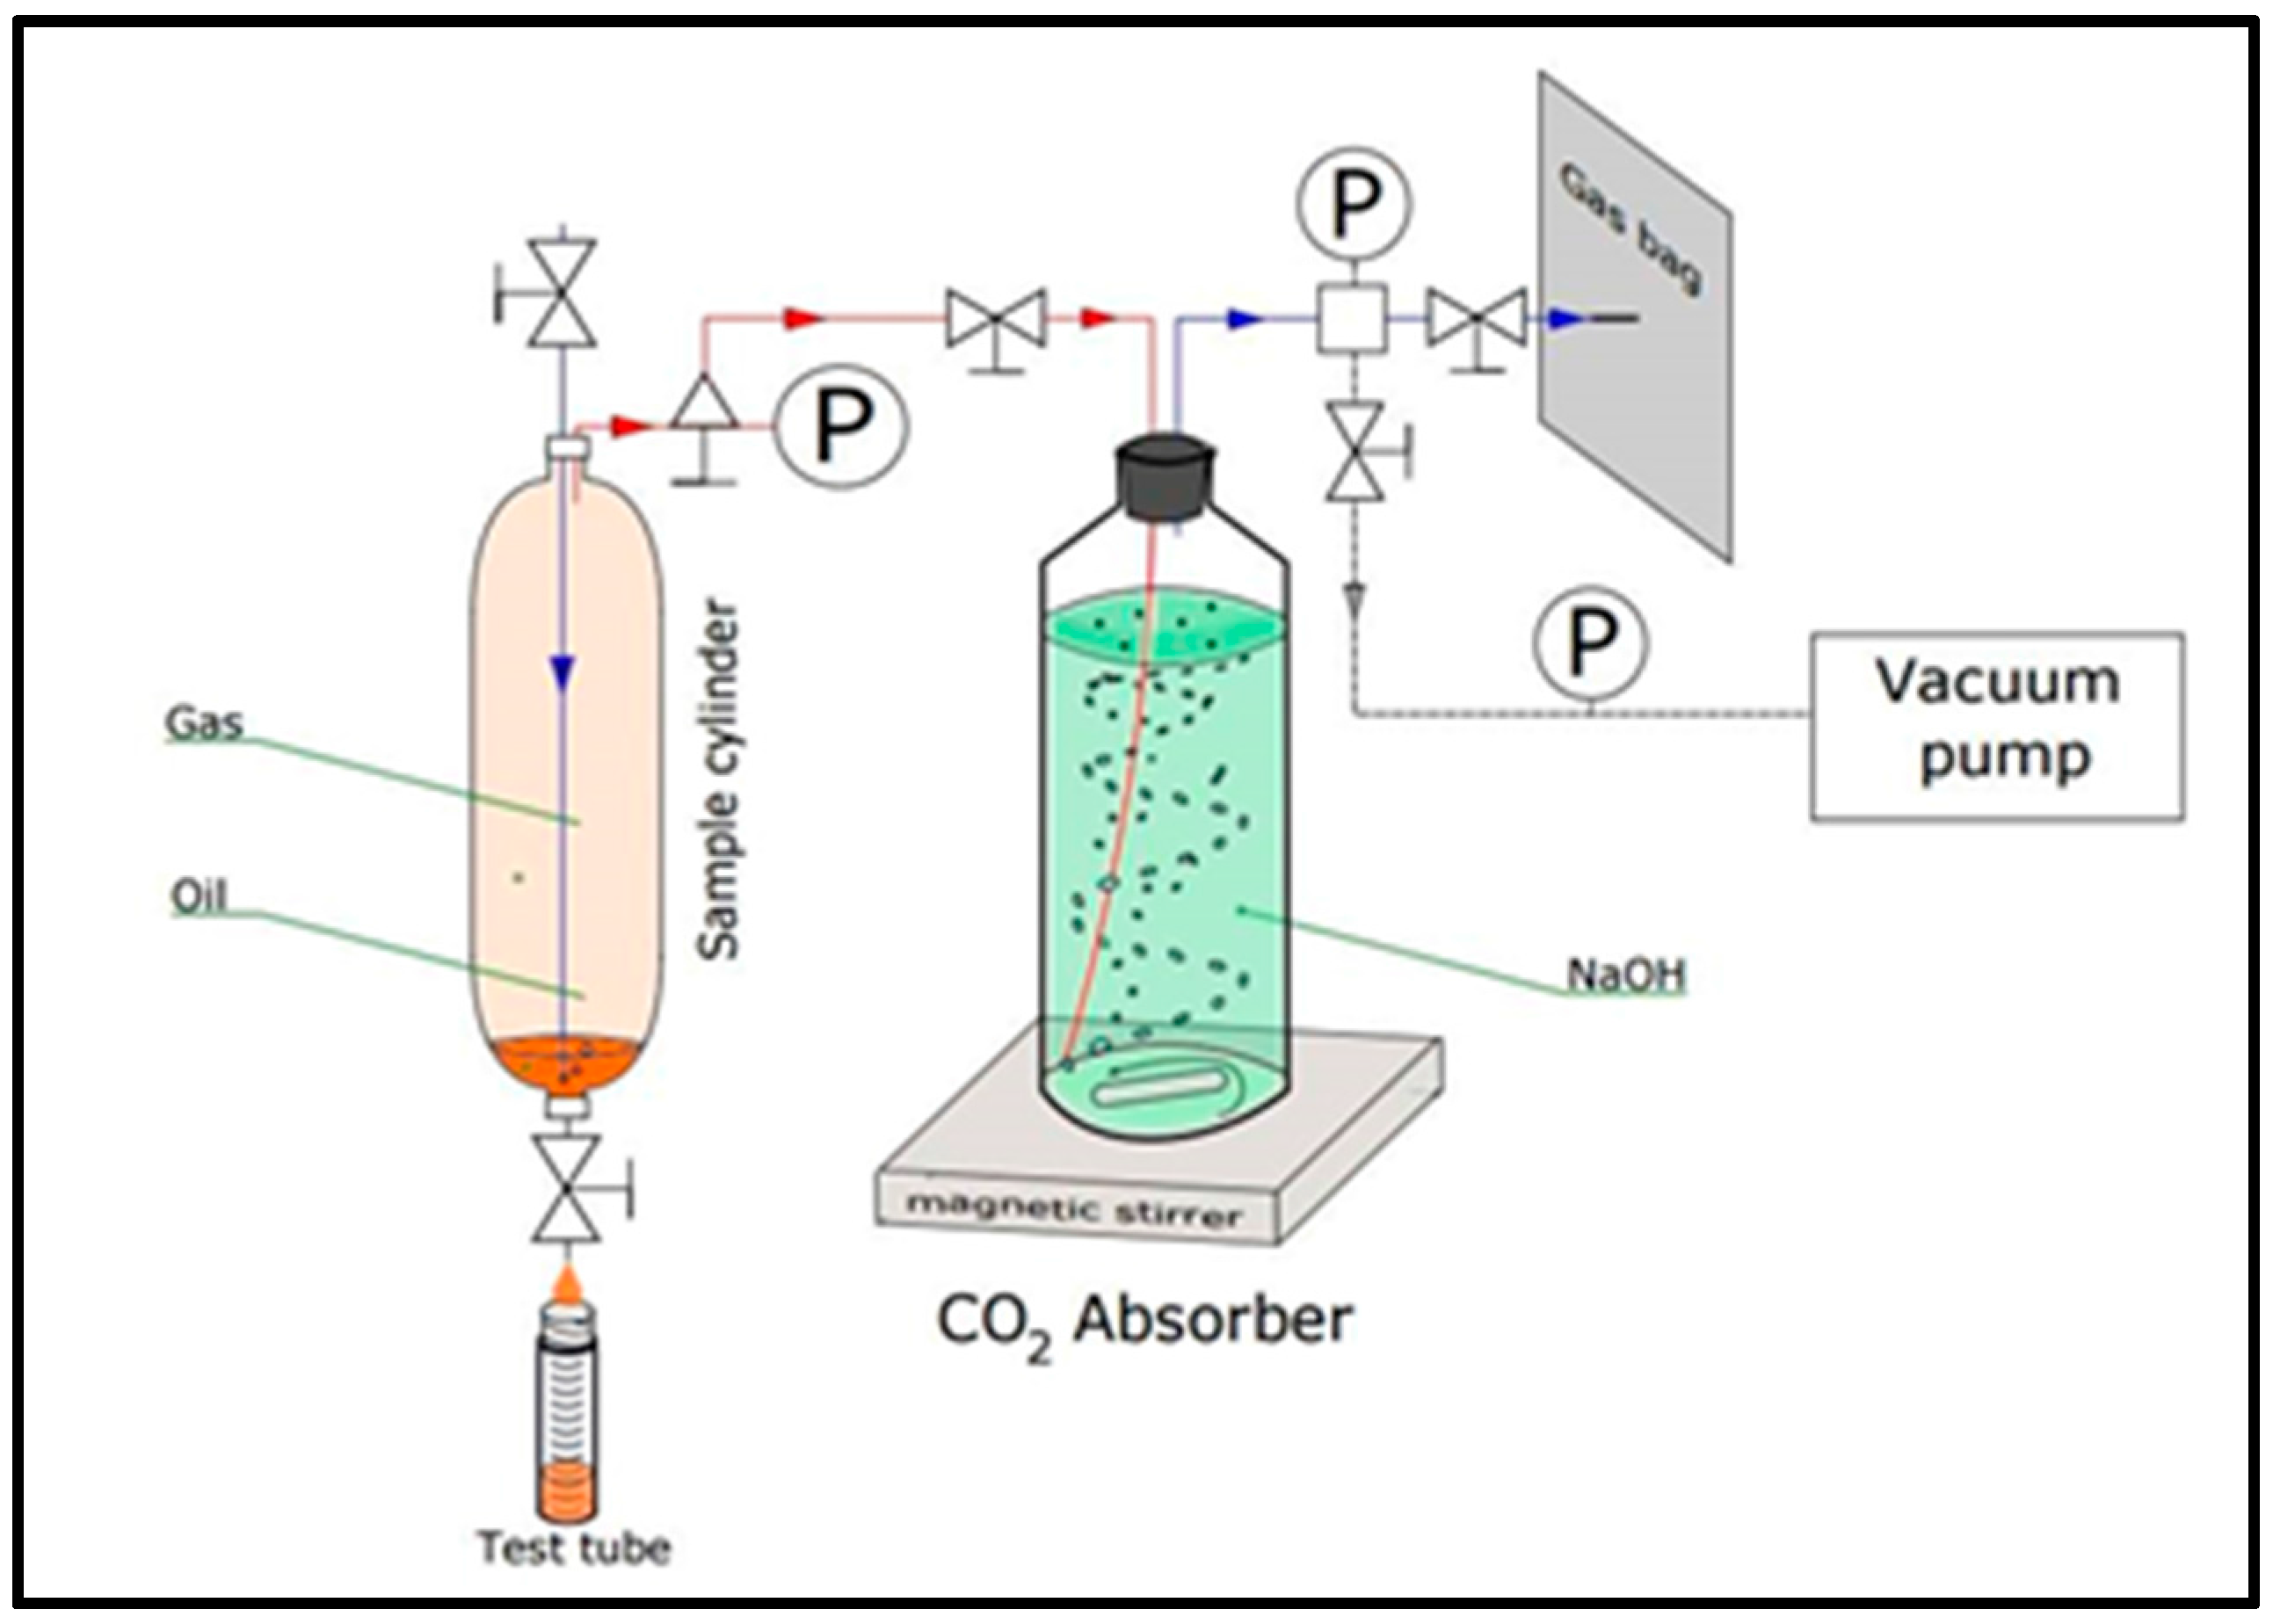
Three flooding experiments with CO2 were done for each of live oil A, live oil B, and dead oil n-C10 at 50, 70, and 90 °C. Two flooding experiments were performed on each crude oil and dead oil (n-C10) sample; the floodings were done using CO2 and a CO2 mixture (C1 and C3). During each experiment, three sets of samples were analyzed. The samples were collected at the initial stage of the experiment. The temperature was kept constant at 70 °C at 200 bar for comparison reasons. The final set of samples was taken after the gas breakthrough. The samples were analyzed for CO2 by discharging the gas from the sample into the absorption cell. The fluid in the absorption cell was NaOH. The absorbed CO2 was then analyzed by volumetric titration while the natural gas content from the samples was passed through the absorption cell into the gas collection bag and was analyzed using gas chromatography (GC). Most of the CO2 was captured by the absorber and any traces of CO2 left in the gas was obtained with the natural gas by the GC. The CO2 absorber setup is shown in Figure 2. The setup also shows the gas collection bag. The liquid part of the sample was drained and the volume was then measured. In the collected liquid samples, various volumes of water were observed depending on the temperature, although all the experiments had dry cores. The amount of water was found to increase with the flooding temperature. In the case of oil A at 70 °C, about 10.8 mL of water was produced in the second sample, which was taken close to the breakthrough and about 5.3 mL of water in the third sample, which was taken during the decline stage (i.e., after the gas breakthrough). In the case of the dead oil at 90 °C, about 31.2 mL of water was collected with the samples in the third sample.
3. Results and Discussions
This section compares the oil recovery by injection of CO2 and CO2/HC (C1&C3) for model oils (n-C10) and crude oil (North Sea). Possible flooding mechanism(s) based on the experimental compositional analysis and simulation and phase behavior are addressed.
3.1. Effect of Temperature on Oil Recovery at a Constant Pressure of 200 Bar
Flooding was performed on the sandstone cores saturated with the synthetic live (n-C10/C1/C3) and dead oil (stabilized, n-C10) at 50 °C, 70 °C, and 90 °C, as shown in Table 2. Higher recovery was observed at 90 °C for all of the model oil types, as illustrated in Figure 3. This may be related to a reduction in the viscosity of the displaced fluid (i.e., improved oil mobility).
3.2. Effect of Added Light Components to CO2 as a Displacing Fluid on Oil Recovery
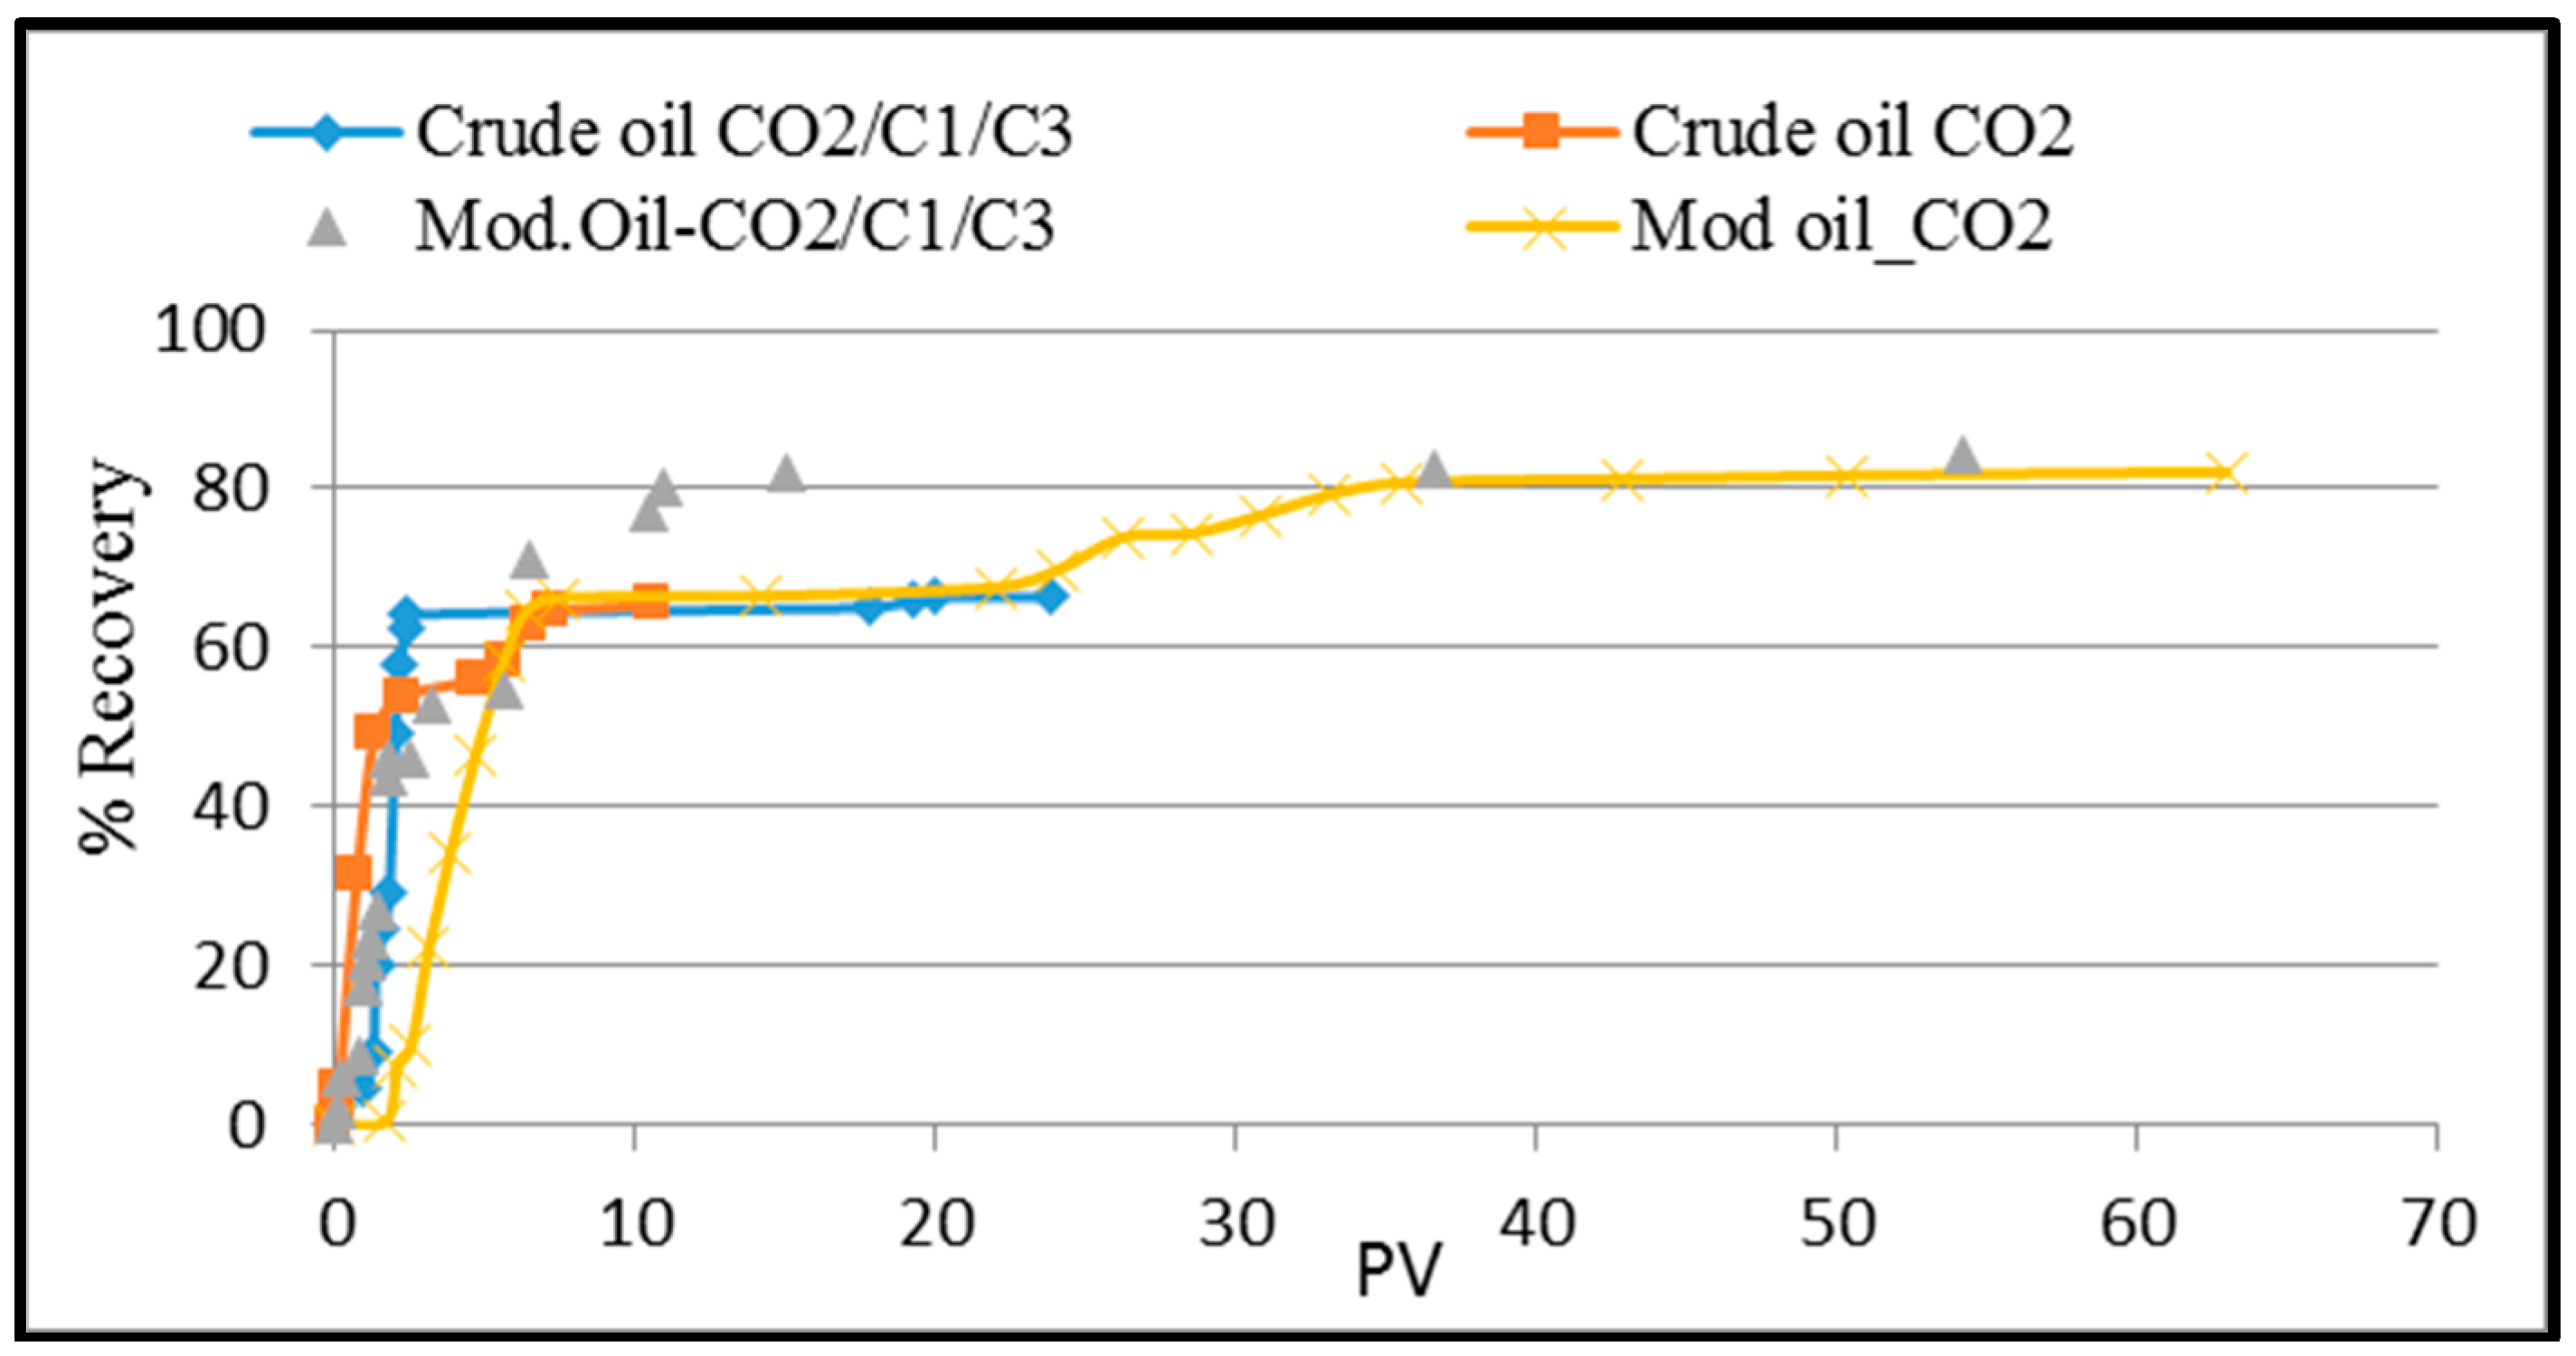
In these experiments, the temperature was set at 70 °C. Flooding with CO2 was taken as a reference for the comparison. Figure 4 compares oil recoveries. The highest oil recovery was obtained by flooding the dead oil (n-C10). Figure 4 shows that the oil recoveries of the model oil (n-C10) with CO2 and CO2/C1/C3 were approximately the same (about 82%). However, the ultimate recovery was reached at about 15 and 36 injected PVs for CO2/C1/C3 and CO2, respectively. This agrees with the conclusion by [7]. On the other hand, the recoveries of flooded crude oil with CO2 and CO2/C1/C3 were about 65% and 76%, respectively, where the ultimate recovery was reached after about 7 and 19 injected PVs of CO2 and CO2/C1/C3, respectively. Jin L, 2016 [8] investigated the impact of CO2 impurity (C1) on MMP and stated that the purest CO2 does not lead to the best oil recovery at the same period. The paper suggested that the reason for the difference is due to compressibility of the light hydrocarbon, where practically methane usually has the largest content.
3.3. Comparison of the Experimental Compositional Analysis and the Simulation
In this section a comparison is made between the experimental and simulated compositions to verify the use of the simulation for a later stage of this work.
A comparison of the experimental composition (spot samples obtained during the flooding and analyzed by GC and CO2 absorber) and the dynamic simulation was done at the corresponding temperature and pressures of the sample. Table 4 compares the analytical data for model oil (n-C10) and live oil B flooded with CO2/C1/C3. The experimental and simulated data are numbered according to their sampling sequence to capture the sampling pressures at 70 °C. The samples were taken at the start of the flooding and then at different times (PVs). The % difference between the simulated and experimental data are shown in the tables for each component. The total average difference between the experimental and the simulation was between 21% and 39%. In other words, the agreement was within about 70% as an average, with minimum and maximum agreement of about 33% and 91%, respectively. The differences were not surprising since the experimental process included various steps; for example, the CO2 went through absorption and was then analyzed volumetrically and by GC. The used hydrocarbon reference for the GC was kept constant—that is, the reference did not reflect the changes in the composition of the components that corresponded to the samples, which may have contributed to the differences. However, the comparison indicates that the dynamic simulation using PVTsim simulator (CALSEP A/S, Lyngby, Denmark) with EOS SRK–Peneloux and the experimental results were close. The miscibility was determined by EOS SRK–Peneloux (PVTsim simulator).
3.4. Dynamic Composition Change in Experiments and Simulations during Flooding
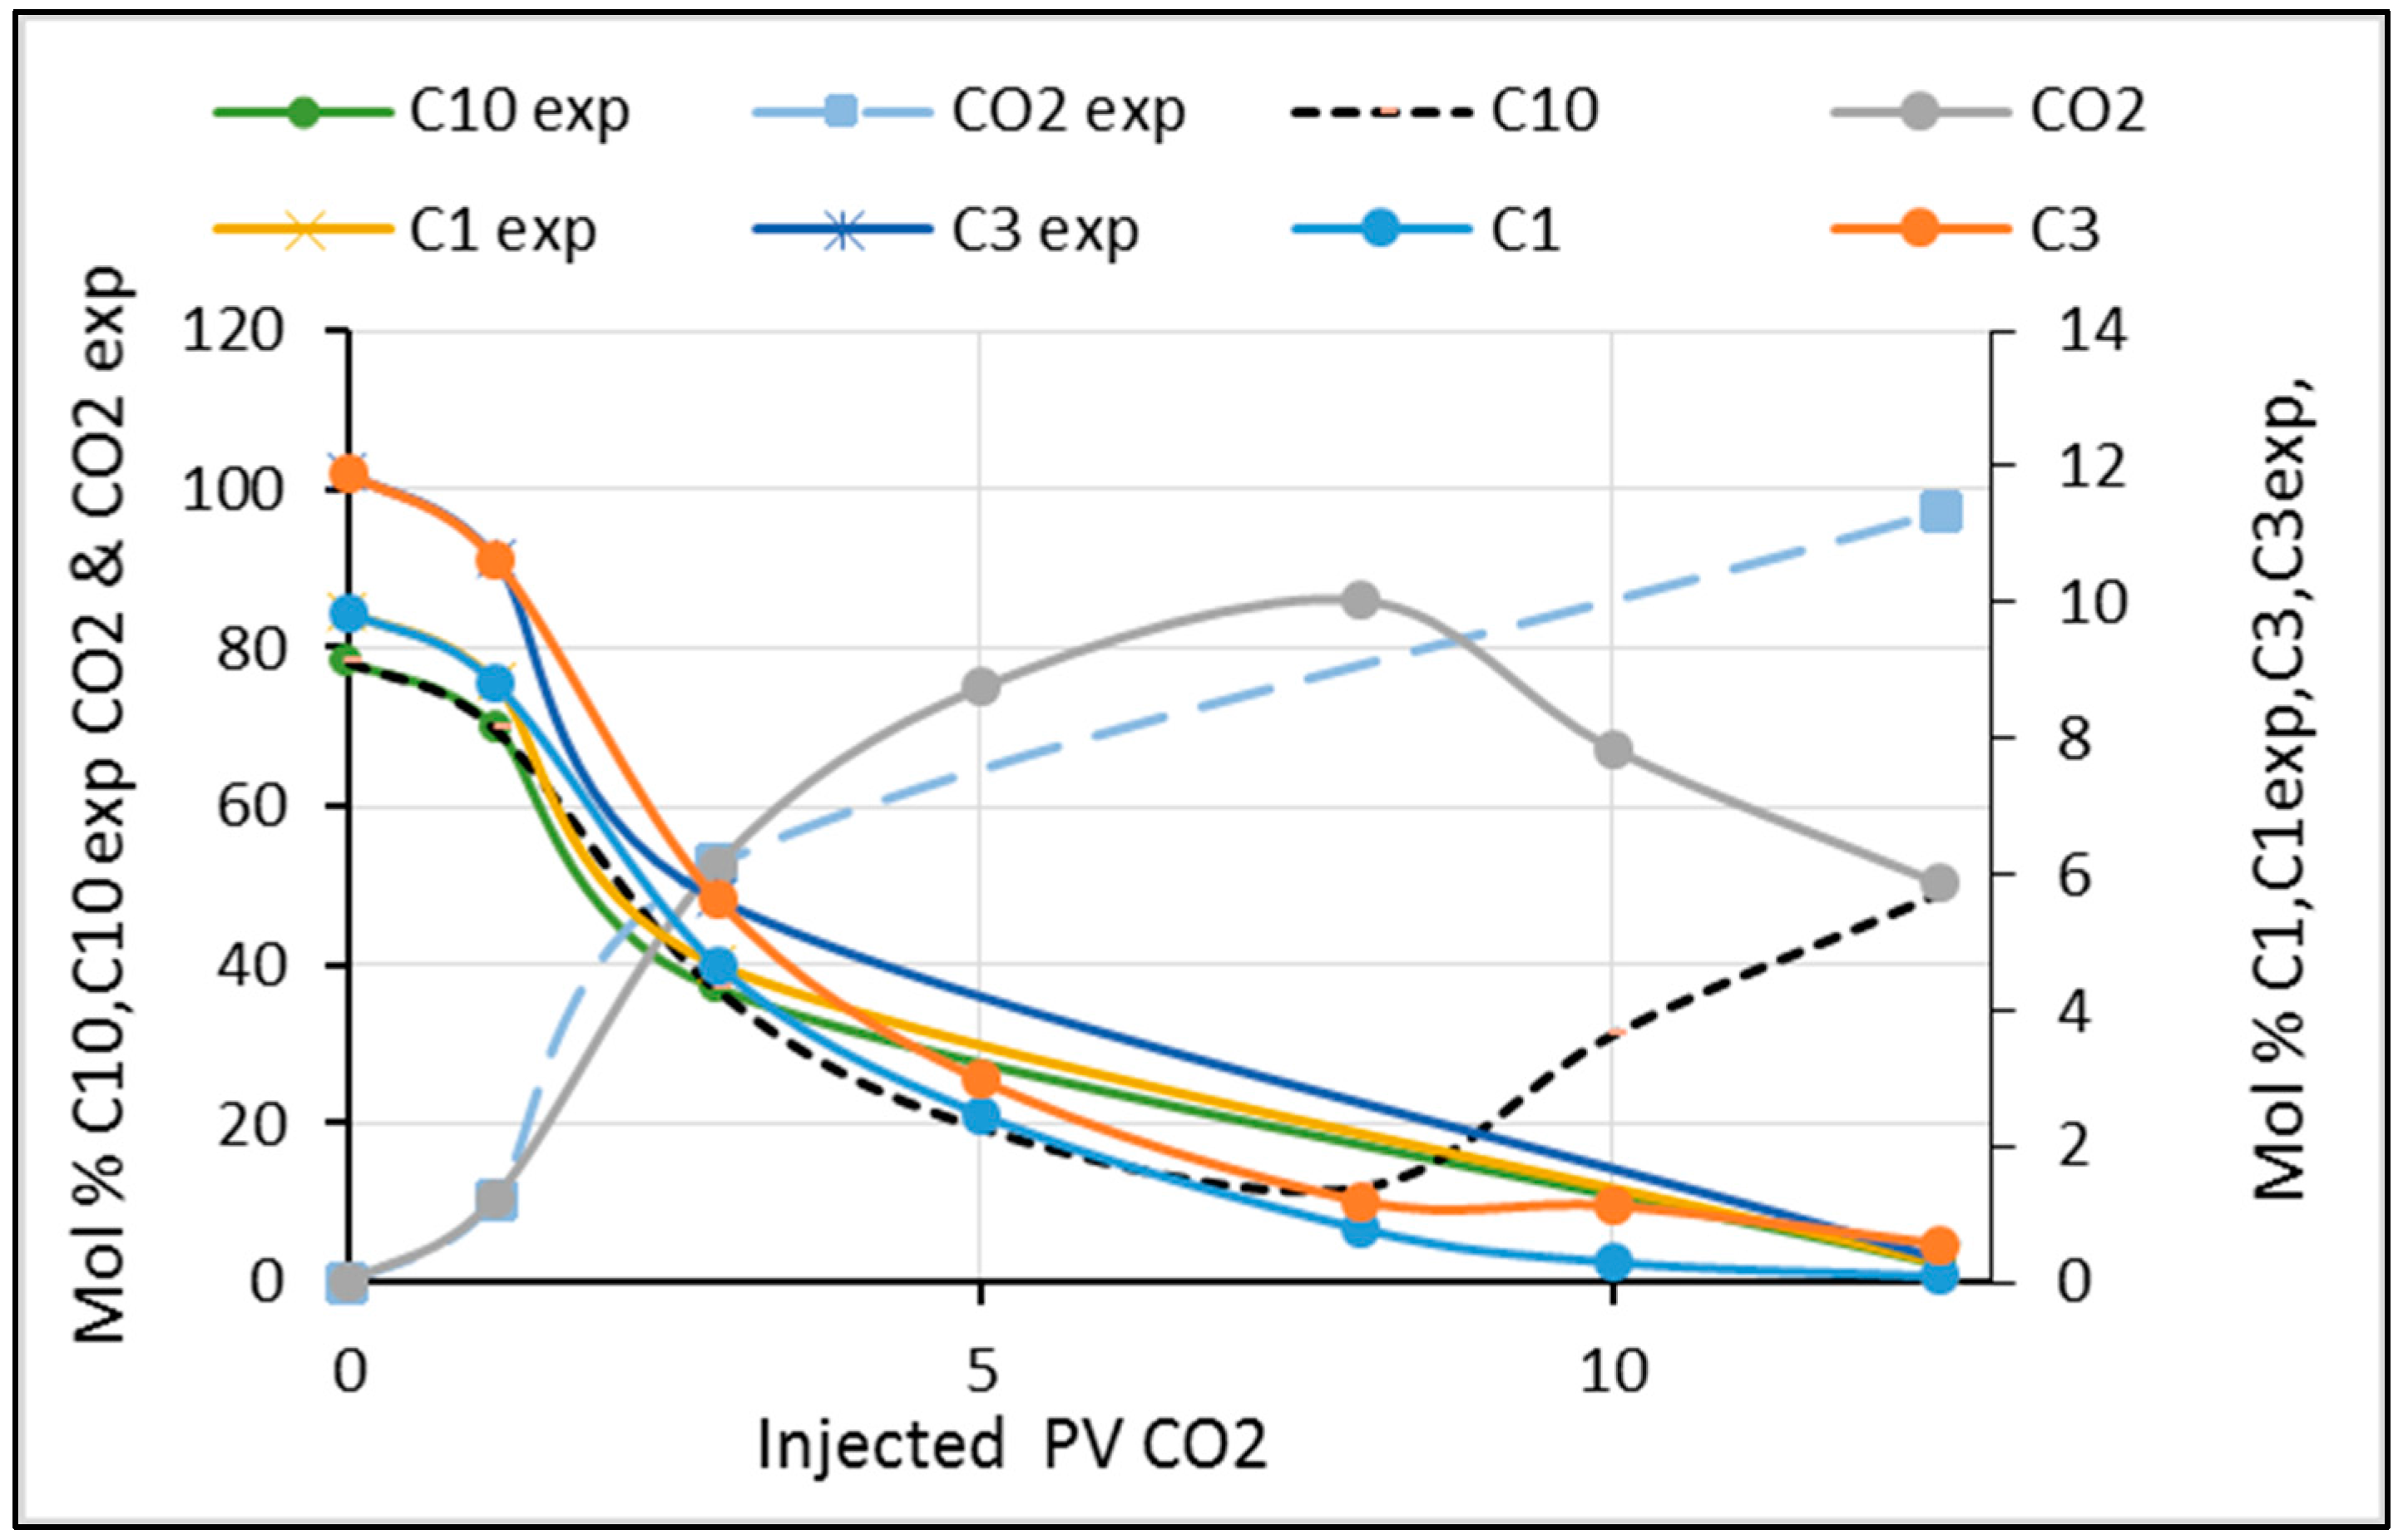
Figure 5 shows the sequence (dynamic) composition changes during the flooding of live oil B with CO2. This was done to compare the obtained dynamic composition and the experimental data (spot) as a function of injected PV. The experimental and simulation trends are in a good agreement; hence, a reasonable mechanism of the flooding may be deduced based on the change of the compositions and the trends. This figure may be simplified as all the liquid components decrease (except for the last experimental points for C10 and CO2) indicating evaporation processes were taking place as the CO2 was injected. The last experimental point of the CO2 trend and C10 deviated from the simulation. The content of CO2 at this point was high after the breakthrough and a minor error in sampling could have caused the deviation; however, the discrepancy may be due to the small volume of n-C10 at the end of the experiment. Both discrepancies influence each other since they affect the total mole percent. However, the composition of all the components, excluding the end experiment composition of CO2 and n-C10, agrees well. Therefore, it was concluded that based on the component changes, the dynamic simulation approach can reflect reasonably well the flooding mechanism/mass transfer and can give insight into the effect of the light components in the displacing fluid.
3.5. Effect of Light Components (C1&C3) in the Displacing Fluid of CO2 on the Recovery of Model and Crude Oils
3.5.1. Model Oil (n-C10) Flooded with CO2/C1/C3
Figure 6a,b represents the simulated composition changes in the oil and vapor phases, respectively, during flooding of the model oil with CO2/C1/C3. As the displacing fluid contacts the model oil, CO2/C1/C3 condensates into the oil phase (Figure 6a). Condensation of CO2 from the injection fluid was more pronounced not only because of its high content in the injection gas but also because of its diffusion and solubility into n-C10 [11,12]. As the injection continued, the C1 and C3 contents increased in the oil phase while the C10 content (mole %) was reduced. The vapor composition is shown in Figure 6b and indicates the development of the two-phase with the displacing and displaced fluids.
3.5.2. Crude Oil Flooded with CO2
Compositional changes of crude oil with CO2 flooding are shown in Figure 7a,b. At the first contact, CO2 condenses/dissolves/disperses in the oil, as shown in the case of the model oil. Within about 2 PVs injected, two phases developed. The vapor composition is shown in Figure 7b. At about 3 PVs, the CO2 content reached about 99.6 mole % and the rest was composed of the other vaporized crude oil components.
3.5.3. Crude Oil Flooded with CO2/C1/C3
Similar to the above flooding, Figure 8a,b shows component tracking for crude oil during flooding with CO2/C1/C3. At the first contact, the displacing fluid CO2/C1/C3 condenses, then by the extraction process crude oil components are then transferred into the vapor phase. Two phases were established at about 3.5 PV of injection.
3.5.4. Displacement Mechanisms and the Effect of the Light Components on Recovery
In the previous sections, higher oil recovery was shown to be by flooding with CO2/C1/C3 than with CO2. When CO2 contacts oil, diffusion, dissolution and dispersion processes take place. These processes cause the swelling of the oil to different degrees. The relative increase in the volume swelling depends on pressure, temperature, and oil composition. Continuing injection leads to component extraction from the oil and the development of two phases. Figure 7b illustrates the composition of the extracted components in the vapor phase. The extracted components from oil are relatively small and hence have an unnoticeable effect on the magnitude of the swelling [13]. Similarly, when flooding with CO2/C1/C3, the components of the displacing fluid condense as they contact the oil. Figure 8a shows the increase of the injected gas components in the crude oil. The two phases were established at about 3.5 injected PV (i.e., about 1.5 PV later than in the case of CO2 injection). This is consistent with Figure 4 where the ultimate recovery took longer to reach than in the case of CO2. It also shows higher oil recovery compared to the CO2 phase.
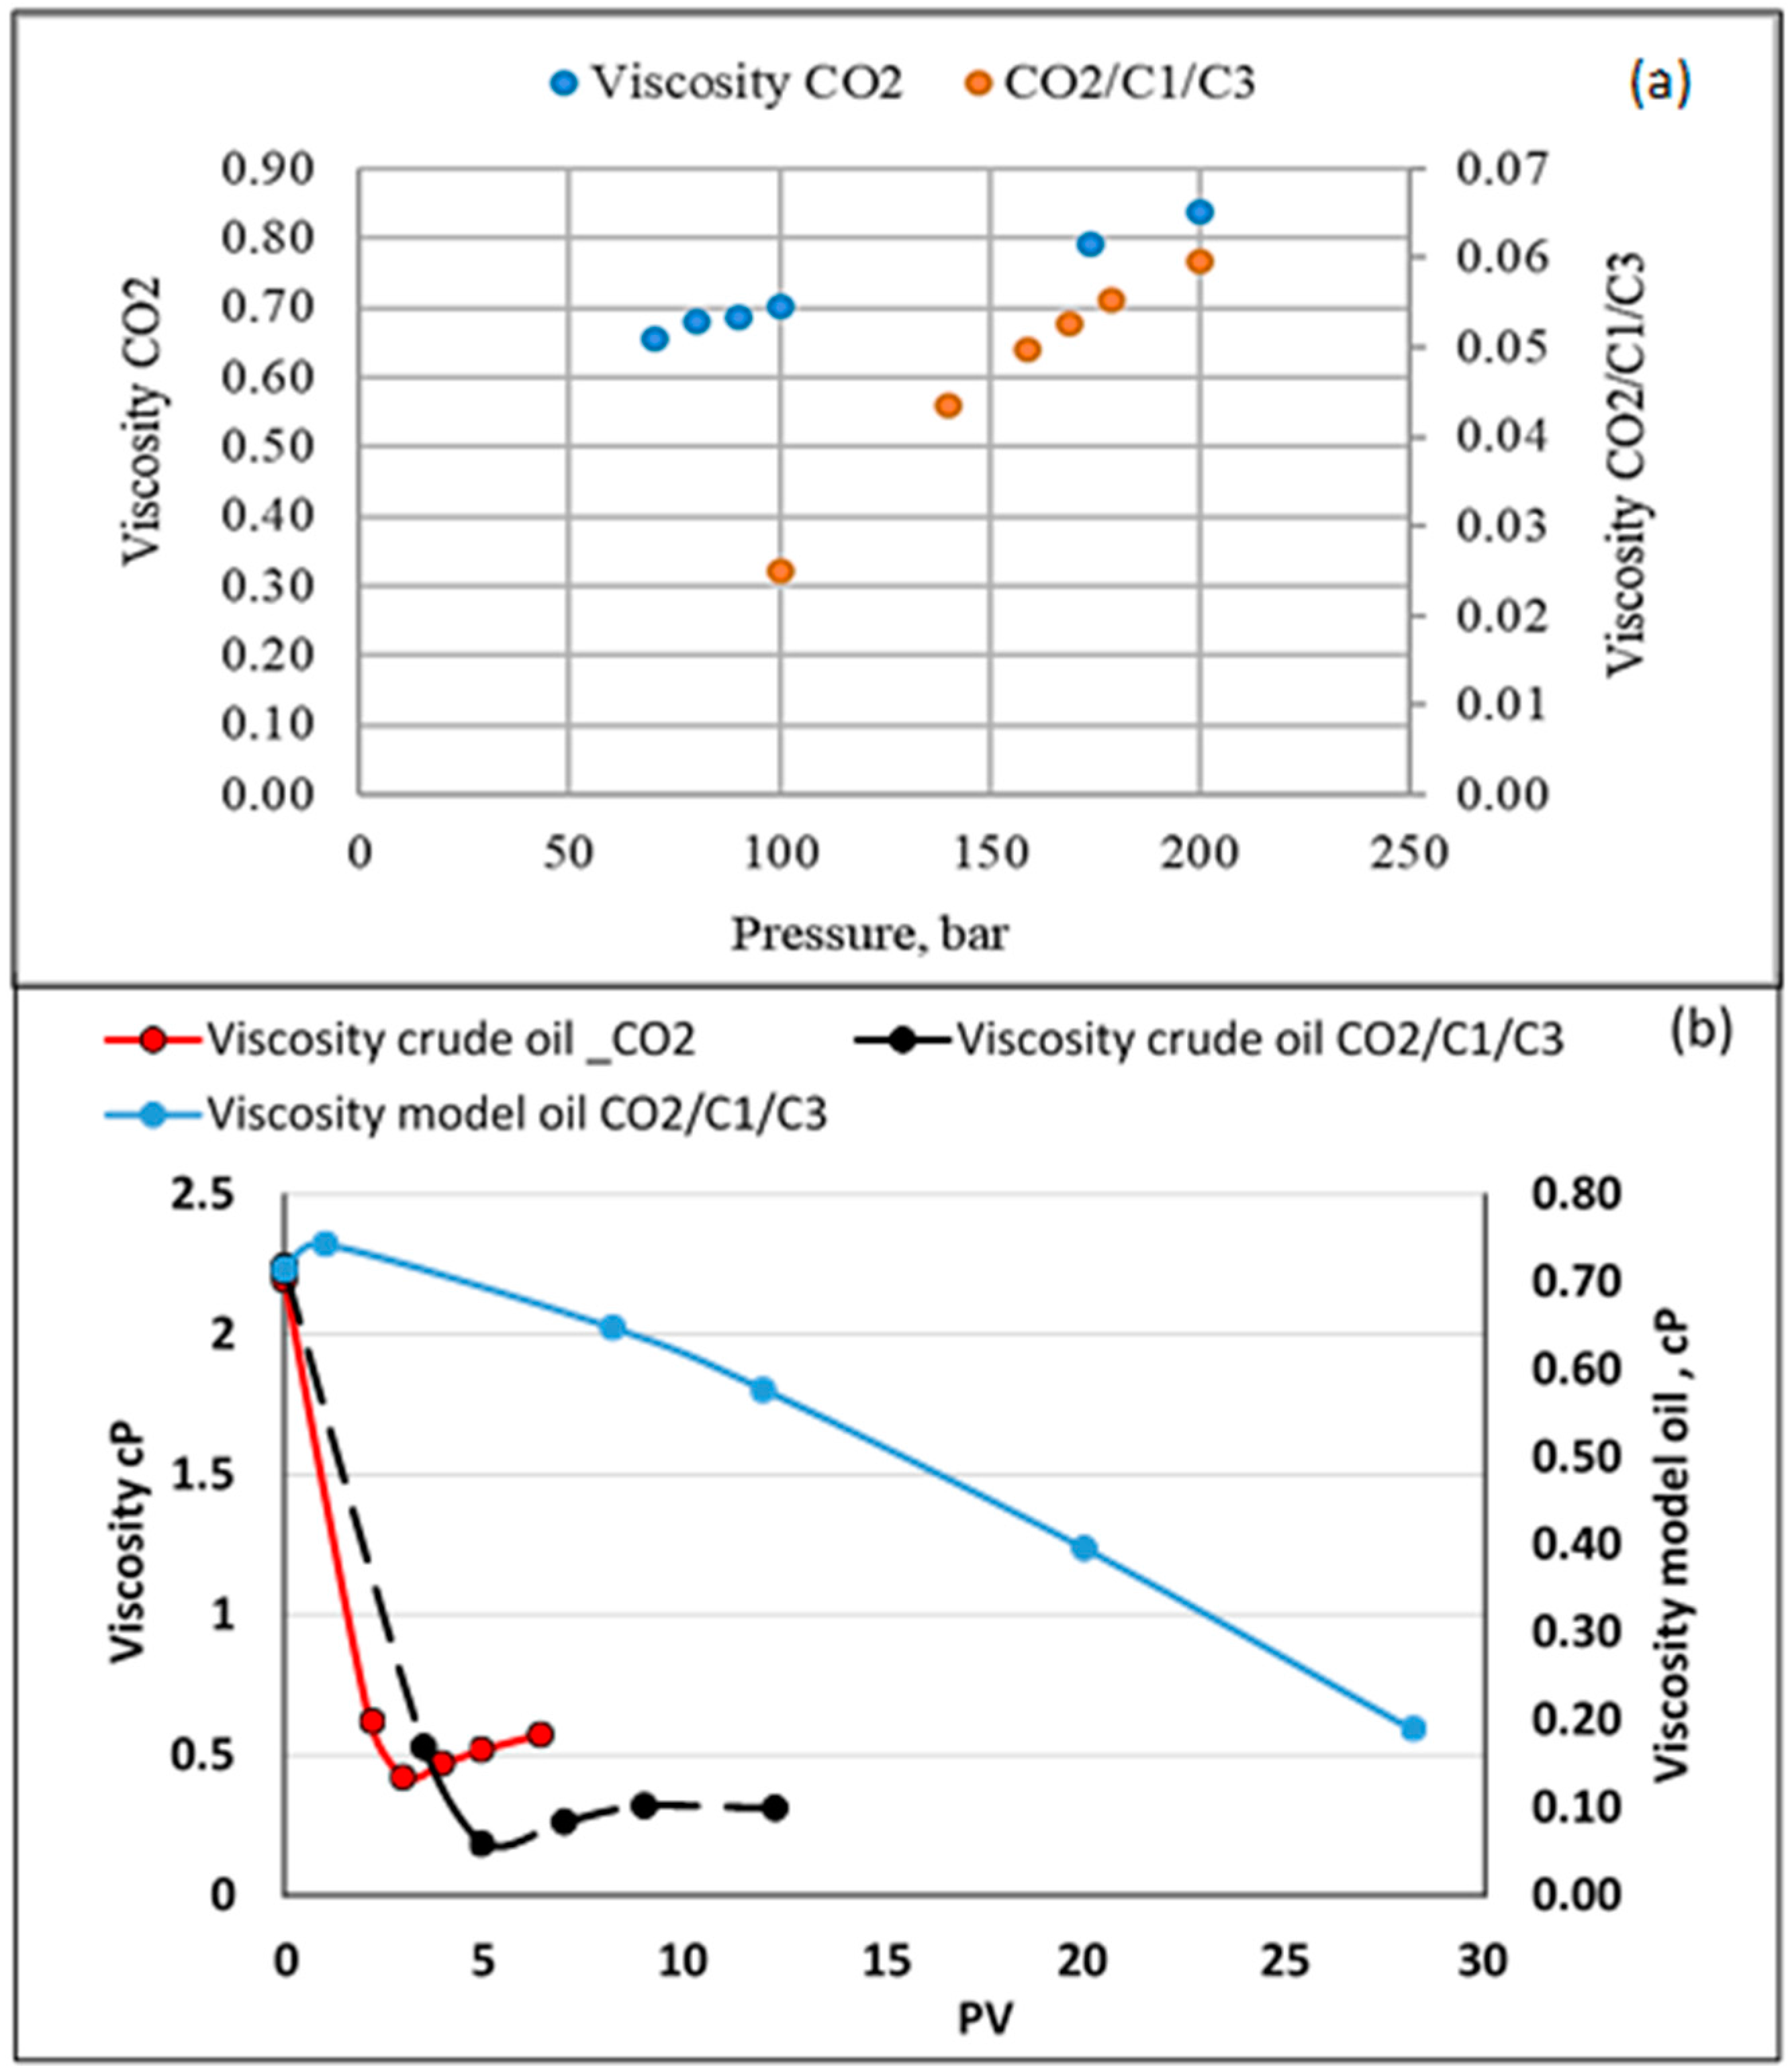
Figure 9a shows the changes in the viscosities of the displacing fluids with CO2 and CO2/C1/C3 during the flooding at the corresponding pressures and 70 °C. Figure 9b compares the viscosities (obtained by EOS SRK–Peneloux) between crude oil flooded with CO2 and CO2/C1/C3 and model oil flooded with CO2/C1/C3. For model oil and crude oil flooded with CO2/C1/C3, the pressure changed from the injection pressure of 200 to about 100 bar at the end of the experiments. In the case of the crude oil flooded with CO2, the pressure changed from 200 to about 70 bar. It is interesting to see the changes in the viscosity. In the case of the crude oil, a sharp decline in the viscosity occurred during the flooding conditions compared to that with the model oil. In the cases of crude oil/CO2 and crude oil/CO2/C1/C3, the viscosities were reduced from about 2.2 to 0.42 and 0.2 after about 3 and 5 PVs, respectively. The minima represent transition points (TPs) after which crude oil becomes lean in light components and the viscosity increases. In other words, as the injection continues, evaporation–condensation processes occur around the TPs. The average viscosities were 1.3 and 1.2 cP for CO2 and CO2/C1/C3, respectively. This may explain the reason for almost the same recovery of about 82% in both cases for the model oil. The difference in the oil viscosities of the crude oil flooded with CO2 and CO2/C1/C3 was about 0.2 cP. The difference in the recovery (of about 65% and 76%, for CO2 and CO2/C1/C3, respectively) may not be explained based only on the difference in the viscosities. As the injected fluid contacts the oil, different processes such as solubility, dispersion, and condensation/extraction take place [12]. Transverse dispersion helps to eliminate the effect of viscous instabilities by shortening the fingering travel/widening the fingers [14]. This may resemble the case with CO2/C1/C3 injection into the crude oil.
3.5.5. Water Produced from Flooded Dry Sandstone Cores
The three hydroxyl groups on the silica surface are classified as isolated, hydrogen bonded, and inaccessible [15], where the fraction of the two first groups participate in the surface reaction. They also found that CO2 penetrated the regions containing the inaccessible groups, in addition to the ability of the supercritical CO2 to remove the adsorbed water layer on silica. Kim, Y et al. 2012 [16] investigated the de-wetting of silica surfaces upon reactions with supercritical CO2. They stated that the brine contact angle increased from 0° to 80°. The above may explain the observed water production from dry core saturated with oil during the flooding, whereas examples (among other recorded water volumes) of about 8.1 mL of water was observed in the sample taken in the case of model oil flooded with CO2/C1/C3.
4. Summary and Conclusions
This section is organized to briefly state the observed phenomena with possible explanations to elucidate the relevant conclusions.
Compositional changes during the flooding were compared with the simulation as a cross-check and were shown to be in a good agreement. This encourages applying simulation in this work to fill gaps due to insufficient sampling and reduce the number of reference samples for GC analysis.
- In general, as the temperature increases with miscible CO2 flooding at a constant pressure of 200 bar, oil recovery increases. The highest recovery was obtained with model oil (n-C10). The presence of light components in the model oil phase reduced the recovery. Lower recovery was observed in the presence of C1 and C3 (live oil B) compared to only C1 (live oil A). This may be explained by more CO2 diffusing into the oil in the case of live oil A since methane is readily transferred into the vapor phase due to its limited solubility and exchanged with the higher soluble CO2. In turn, the more CO2 available, the larger the increase of the hydrocarbon swelling—that is, more oil recovery compared to oil containing C1/C3 where C3 is more soluble in C10 than in C1; hence less CO2 mass transfer.
- An opposite case was investigated where the light components (C1/C3) were combined with CO2 as displacing fluid (CO2/C1/C3). Comparisons were made of crude oil flooded with the two displacing fluids (CO2 and CO2/C1/C3) and model oil (n-C10) displaced with CO2/C1/C3. In general, recovery from the model oil was higher than from the crude oil, which may be due to the differences between their mobility. There was almost no difference in the recovery of model oil (≈82%) with the two displacing fluids. However, in the case of crude oil, the recoveries were 65 and 76% for the displacing fluids of CO2 and CO2/C1/C3, respectively. As the injected fluid contacts the oil, different processes, such as solubility, dispersion, and condensation/extraction, take place. Transverse dispersion of CO2 helps in eliminating/reducing the effect of viscous instabilities by shortening fingering travel/widening the fingers, as discussed earlier. A sharp decline in viscosity was also shown during the flooding of the crude oil with CO2 compared to a lesser declining slope in the case of CO2/C1/C3. The sharp decline in viscosity may cause the early formation of fingers and promote their growth and hence the lower recovery. In addition, the ultimate recovery with CO2 was reached earlier than that with CO2/C1/C3. Injected light components with CO2 showed a relatively slower rate to reach minimum system viscosity compared to that for CO2 flooding, which may promote transverse dispersion of the displacing fluid and hence less traveling of fingers. A longer flooding time may also promote the lateral growth of fingers.
- An additional interesting observation was the water production in the obtained samples from the flooded dry sandstone cores. This may be explained by the ability of CO2 to penetrate regions containing the inaccessible hydroxyl groups, in addition to the ability of the supercritical CO2 to remove the adsorbed water layer on silica.
Acknowledgments
Authors acknowledge Krzystof Nowicki, laboratory assistant, for technical support during the experiments and for pressure testing of the equipment, Per Eirik Krossgått Widvey for mechanical help, and Kim Andre Nesse Vorland for help with LabVIEW and data collection. Thanks to Inger Johanne for ordering the needed chemicals and parts and for the setup.
Author Contributions
Aly Hamouda and Sidra Chughtai conceived and designed the experiments; Aly Hamouda and Sidra Chughtai performed the experiments; Aly Hamouda and Sidra Chughtai analyzed the data; Aly Hamouda and Sidra Chughtai wrote the paper.
Conflicts of Interest
The authors declare no conflict of interest. The funding sponsors had no role in the design of the study; in the collection, analyses, or interpretation of data; in the writing of the manuscript, and in the decision to publish the results.
References
- Beeson, D.; Ortloff, G. Laboratory investigation of the water-driven carbon dioxide process for oil recovery. J. Pet. Technol. 1959, 11, 63–66. [Google Scholar] [CrossRef]
- Holm, L.W.; Josendal, V.A. Effect of oil composition on miscible-type displacement by carbon dioxide. Soc. Pet. Eng. J. 1982, 22, 87–98. [Google Scholar] [CrossRef]
- Holm, W.L. Evolution of the carbon dioxide flooding processes. J. Pet. Technol. 1987, 39, 1337–1342. [Google Scholar] [CrossRef]
- Ferguson, R.C.; Nichols, C.; Van Leeuwen, T.; Kuuskraa, V.A. Storing CO2 with enhanced oil recovery. Energy Procedia 2009, 1, 1989–1996. [Google Scholar] [CrossRef]
- Hamouda, A.A.; Pranoto, A. Synergy between low salinity water flooding and CO2 for eor in chalk reservoirs. In Proceedings of the SPE EOR Conference at Oil and Gas West Asia, Muscat, Oman, 20–23 March 2016. [Google Scholar]
- Hamouda, A.A.; Pranoto, A. Innovative approach for maximizing CO2 storage and enhancing oil recovery by co-optimization and late operation stage optimization. Int. J. Res. Comput. Commun. Eng. 2016, 4, 1111–1122. [Google Scholar]
- Fai-Yengo, V.A.; Rahnema, H.; Alfi, M. Impact of light component stripping during CO2 injection in bakken formation. In Proceedings of the Unconventional Resources Technology Conference (URTEC), Denver, CO, USA, 25–27 August 2014. [Google Scholar]
- Jin, L. Impact of CO2 impurity on mmp and oil recovery performance of the bell creek oil field. In Proceedings of the 13th International Conference on Greenhouse Gas Control Technologies, GHGT-13, Lausanne, Switzerland, 14–18 November 2016. [Google Scholar]
- Hamouda, A.; Tabrizy, V.A. The effect of light gas on miscible CO2 flooding to enhance oil recovery from sandstone and chalk reservoirs. J. Pet. Sci. Eng. 2013, 108, 259–266. [Google Scholar] [CrossRef]
- Moortgat, J.B.; Firoozabadi, A.; Li, Z.; Espósito, R.O. CO2 injection in vertical and horizontal cores: Measurements and numerical simulation. SPE J. 2013, 18, 331–344. [Google Scholar] [CrossRef]
- Bagalkot, N.; Hamouda, A.A. Experimental and numerical method for estimating diffusion coefficient of the carbon dioxide into light components. Ind. Eng. Chem. Res. 2017, 56, 2359–2374. [Google Scholar] [CrossRef]
- Yang, Z.; Li, M.; Peng, B.; Lin, M.; Dong, Z. Volume expansion of CO2 + oil at near critical and supercritical conditions of CO2. Fuel 2013, 112, 283–288. [Google Scholar] [CrossRef]
- Jennings, D.W.; Schucker, R.C. Comparison of high-pressure vapor- liquid equilibria of mixtures of CO2 or propane with nonane and C9 alkylbenzenes. J. Chem. Eng. Data 1996, 41, 831–838. [Google Scholar] [CrossRef]
- Gardner, J.; Ypma, J. An investigation of phase behavior-macroscopic bypassing interaction in CO2 flooding. Soc. Pet. Eng. J. 1984, 24, 508–520. [Google Scholar] [CrossRef]
- McCool, B.; Tripp, C.P. Inaccessible hydroxyl groups on silica are accessible in supercritical CO2. J. Phys. Chem. B 2005, 109, 8914–8919. [Google Scholar] [CrossRef] [PubMed]
- Kim, Y.; Wan, J.; Kneafsey, T.J.; Tokunaga, T.K. Dewetting of silica surfaces upon reactions with supercritical CO2 and brine: Pore-scale studies in micromodels. Environ. Sci. Technol. 2012, 46, 4228–4235. [Google Scholar] [CrossRef] [PubMed]
Figure 1.
Schematic of the CO2 flooding system.

Figure 2.
CO2 absorber and gas bag system setup.

Figure 3.
Comparison of ultimate oil recovery for model live oils A&B and dead oil (n-C10) at 50 °C, 70 °C, and 90 °C.
Figure 3.
Comparison of ultimate oil recovery for model live oils A&B and dead oil (n-C10) at 50 °C, 70 °C, and 90 °C.
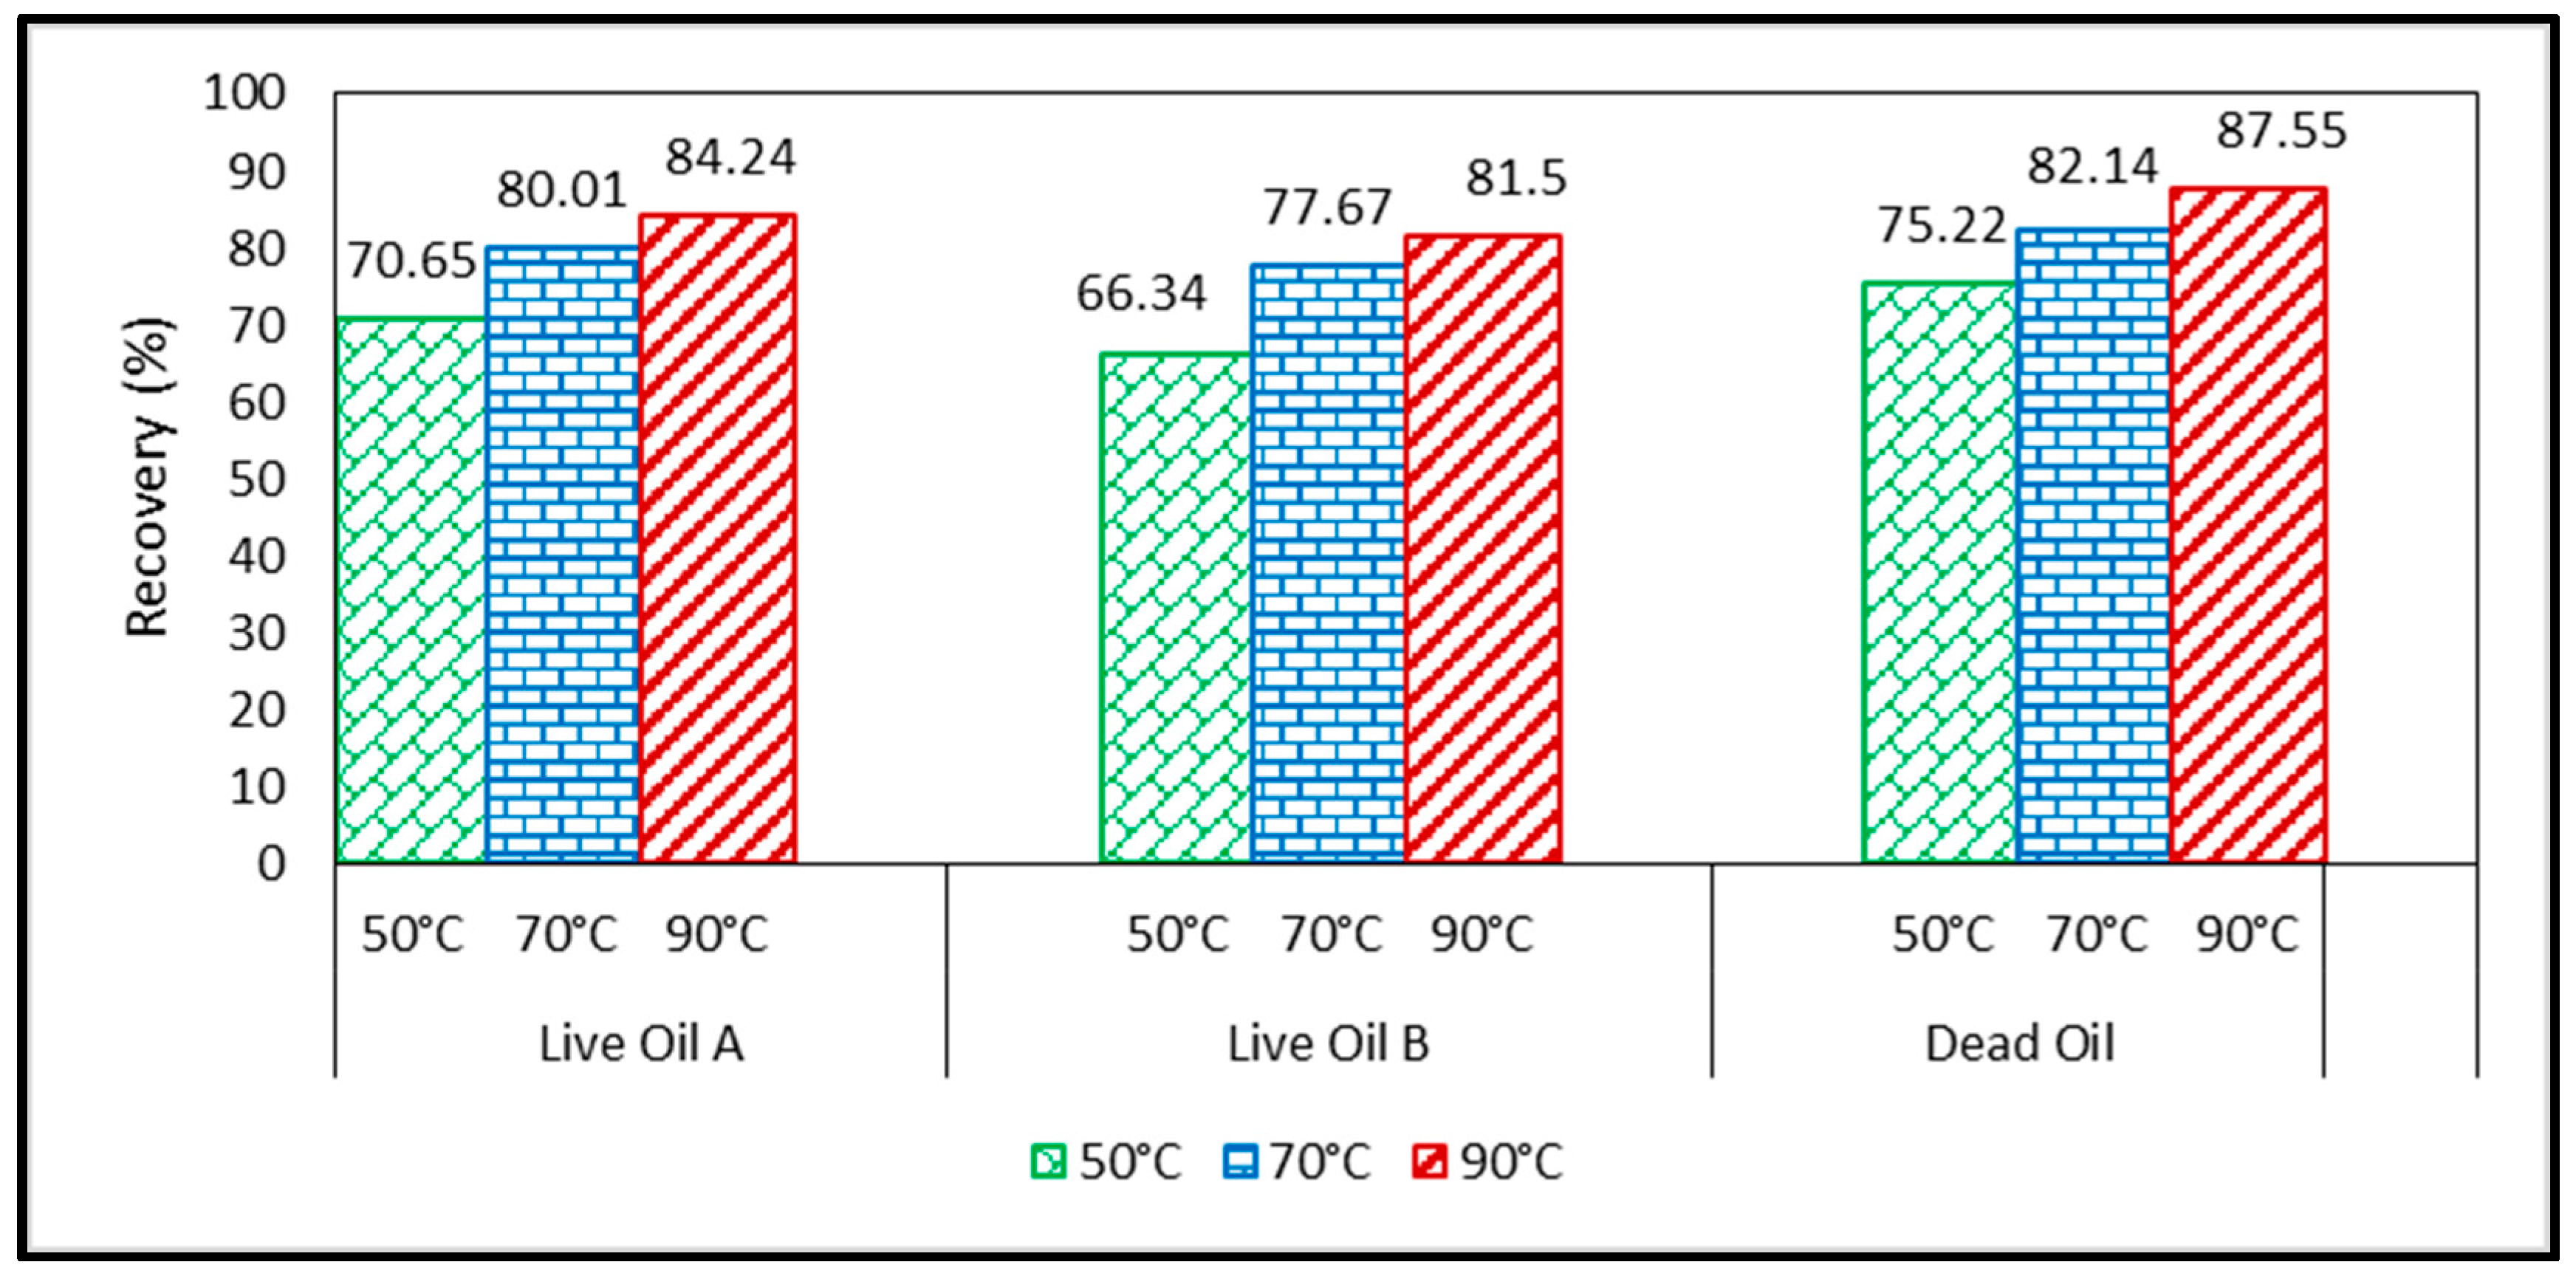
Figure 4.
Comparison between the recovery of crude and model oils flooded with CO2 and CO2/C1/C3 at 70 °C and 200 bar.
Figure 4.
Comparison between the recovery of crude and model oils flooded with CO2 and CO2/C1/C3 at 70 °C and 200 bar.

Figure 5.
Dynamic changes in the composition in the liquid phase as a function of the injected pore volume (PV) for live Oil B (78.23 mole % n-C10/9.86 mole % C1/11.9 mole % C3) flooded with CO2.
Figure 5.
Dynamic changes in the composition in the liquid phase as a function of the injected pore volume (PV) for live Oil B (78.23 mole % n-C10/9.86 mole % C1/11.9 mole % C3) flooded with CO2.

Figure 6.
Dynamic composition changes as a function of the injected pore volume of CO2/C1/C3 into model oil (n-C10), (a) in liquid phase and (b) in the vapor phase.
Figure 6.
Dynamic composition changes as a function of the injected pore volume of CO2/C1/C3 into model oil (n-C10), (a) in liquid phase and (b) in the vapor phase.
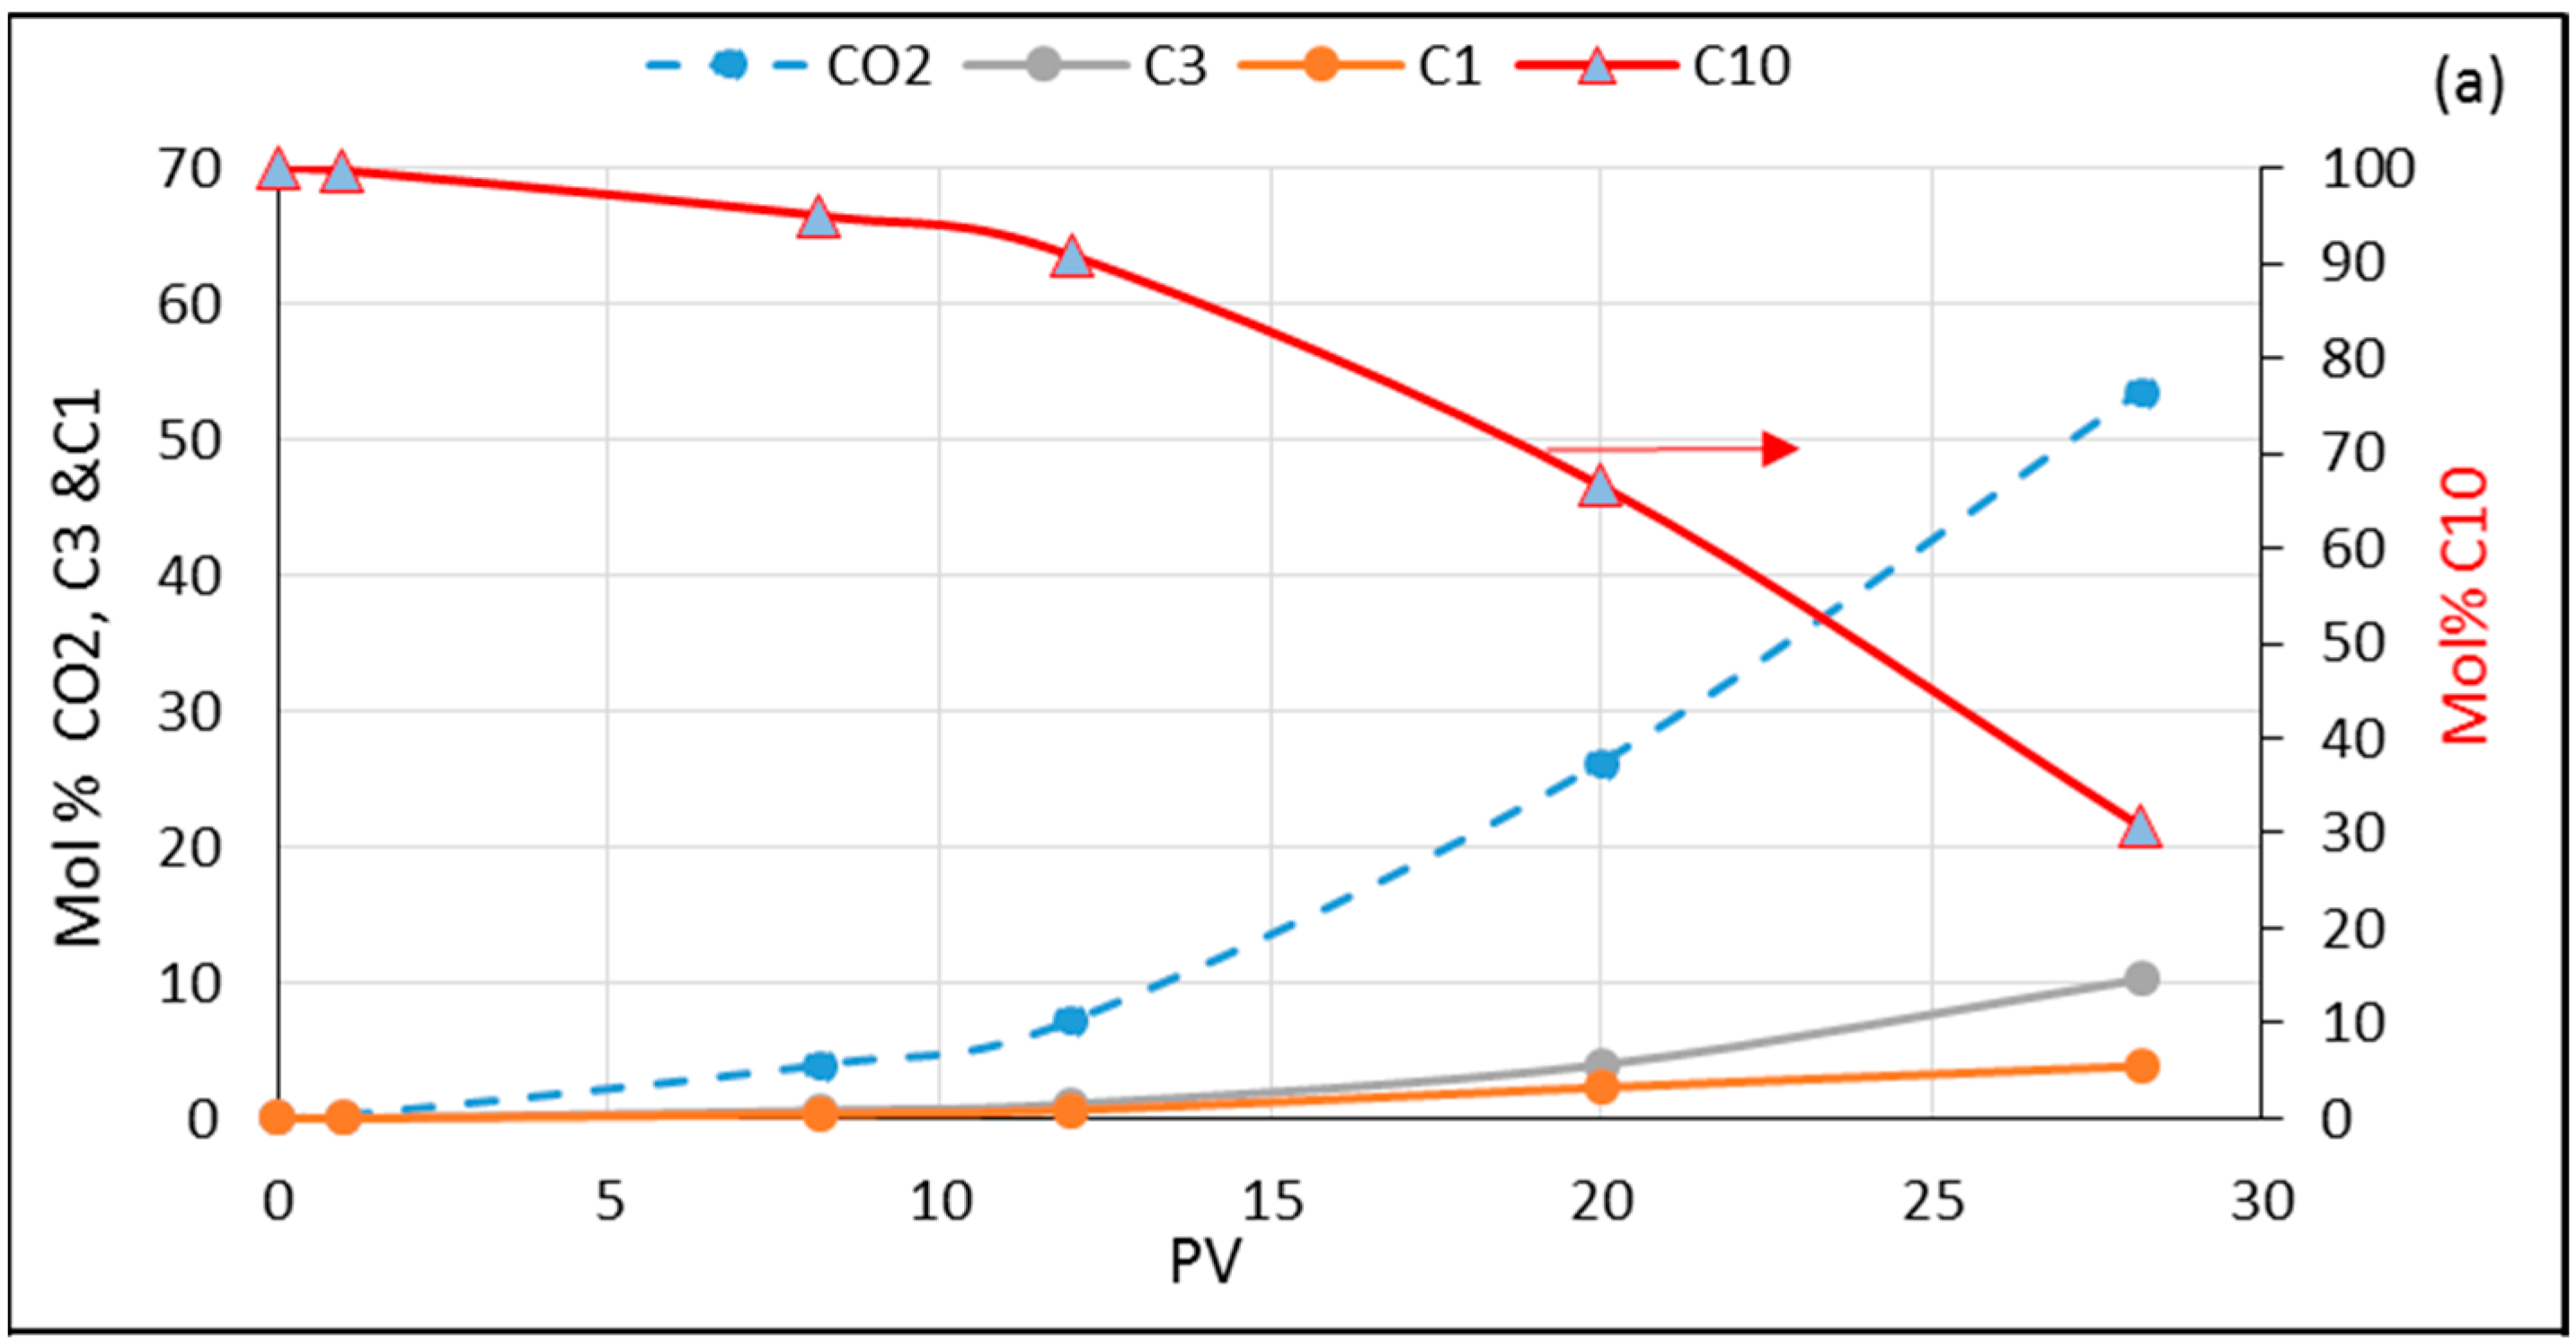
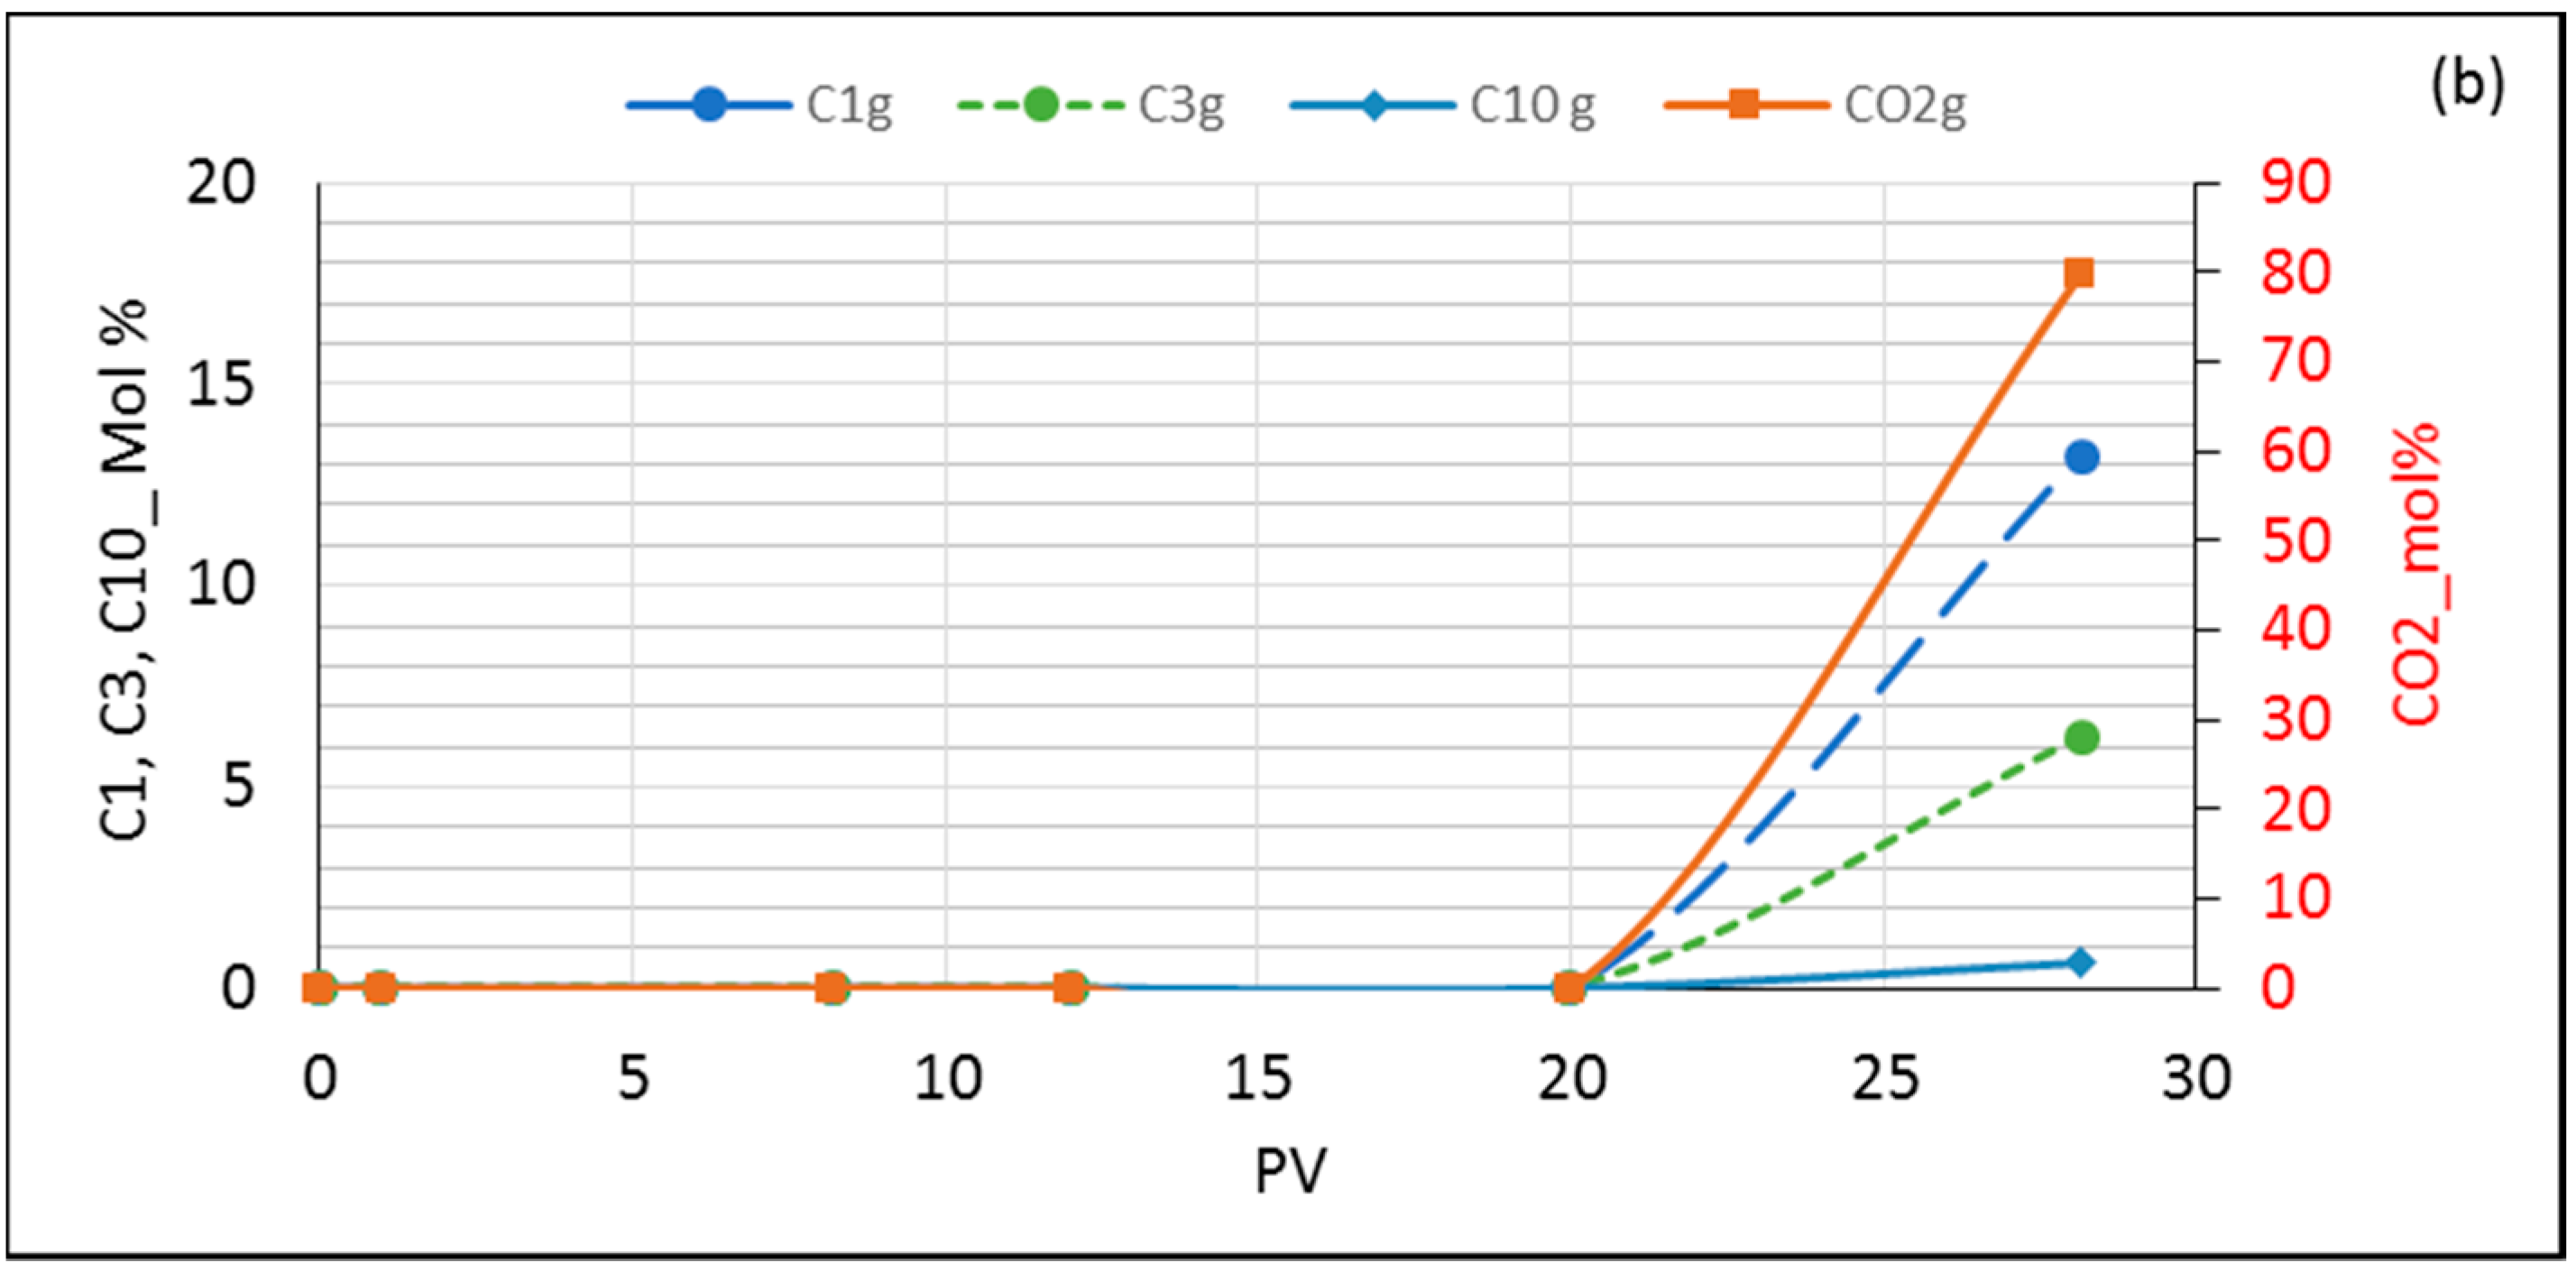
Figure 7.
Dynamic composition changes as a function of the injected pore volume of CO2 into crude oil (a) in liquid phase and (b) in vapor phase.
Figure 7.
Dynamic composition changes as a function of the injected pore volume of CO2 into crude oil (a) in liquid phase and (b) in vapor phase.
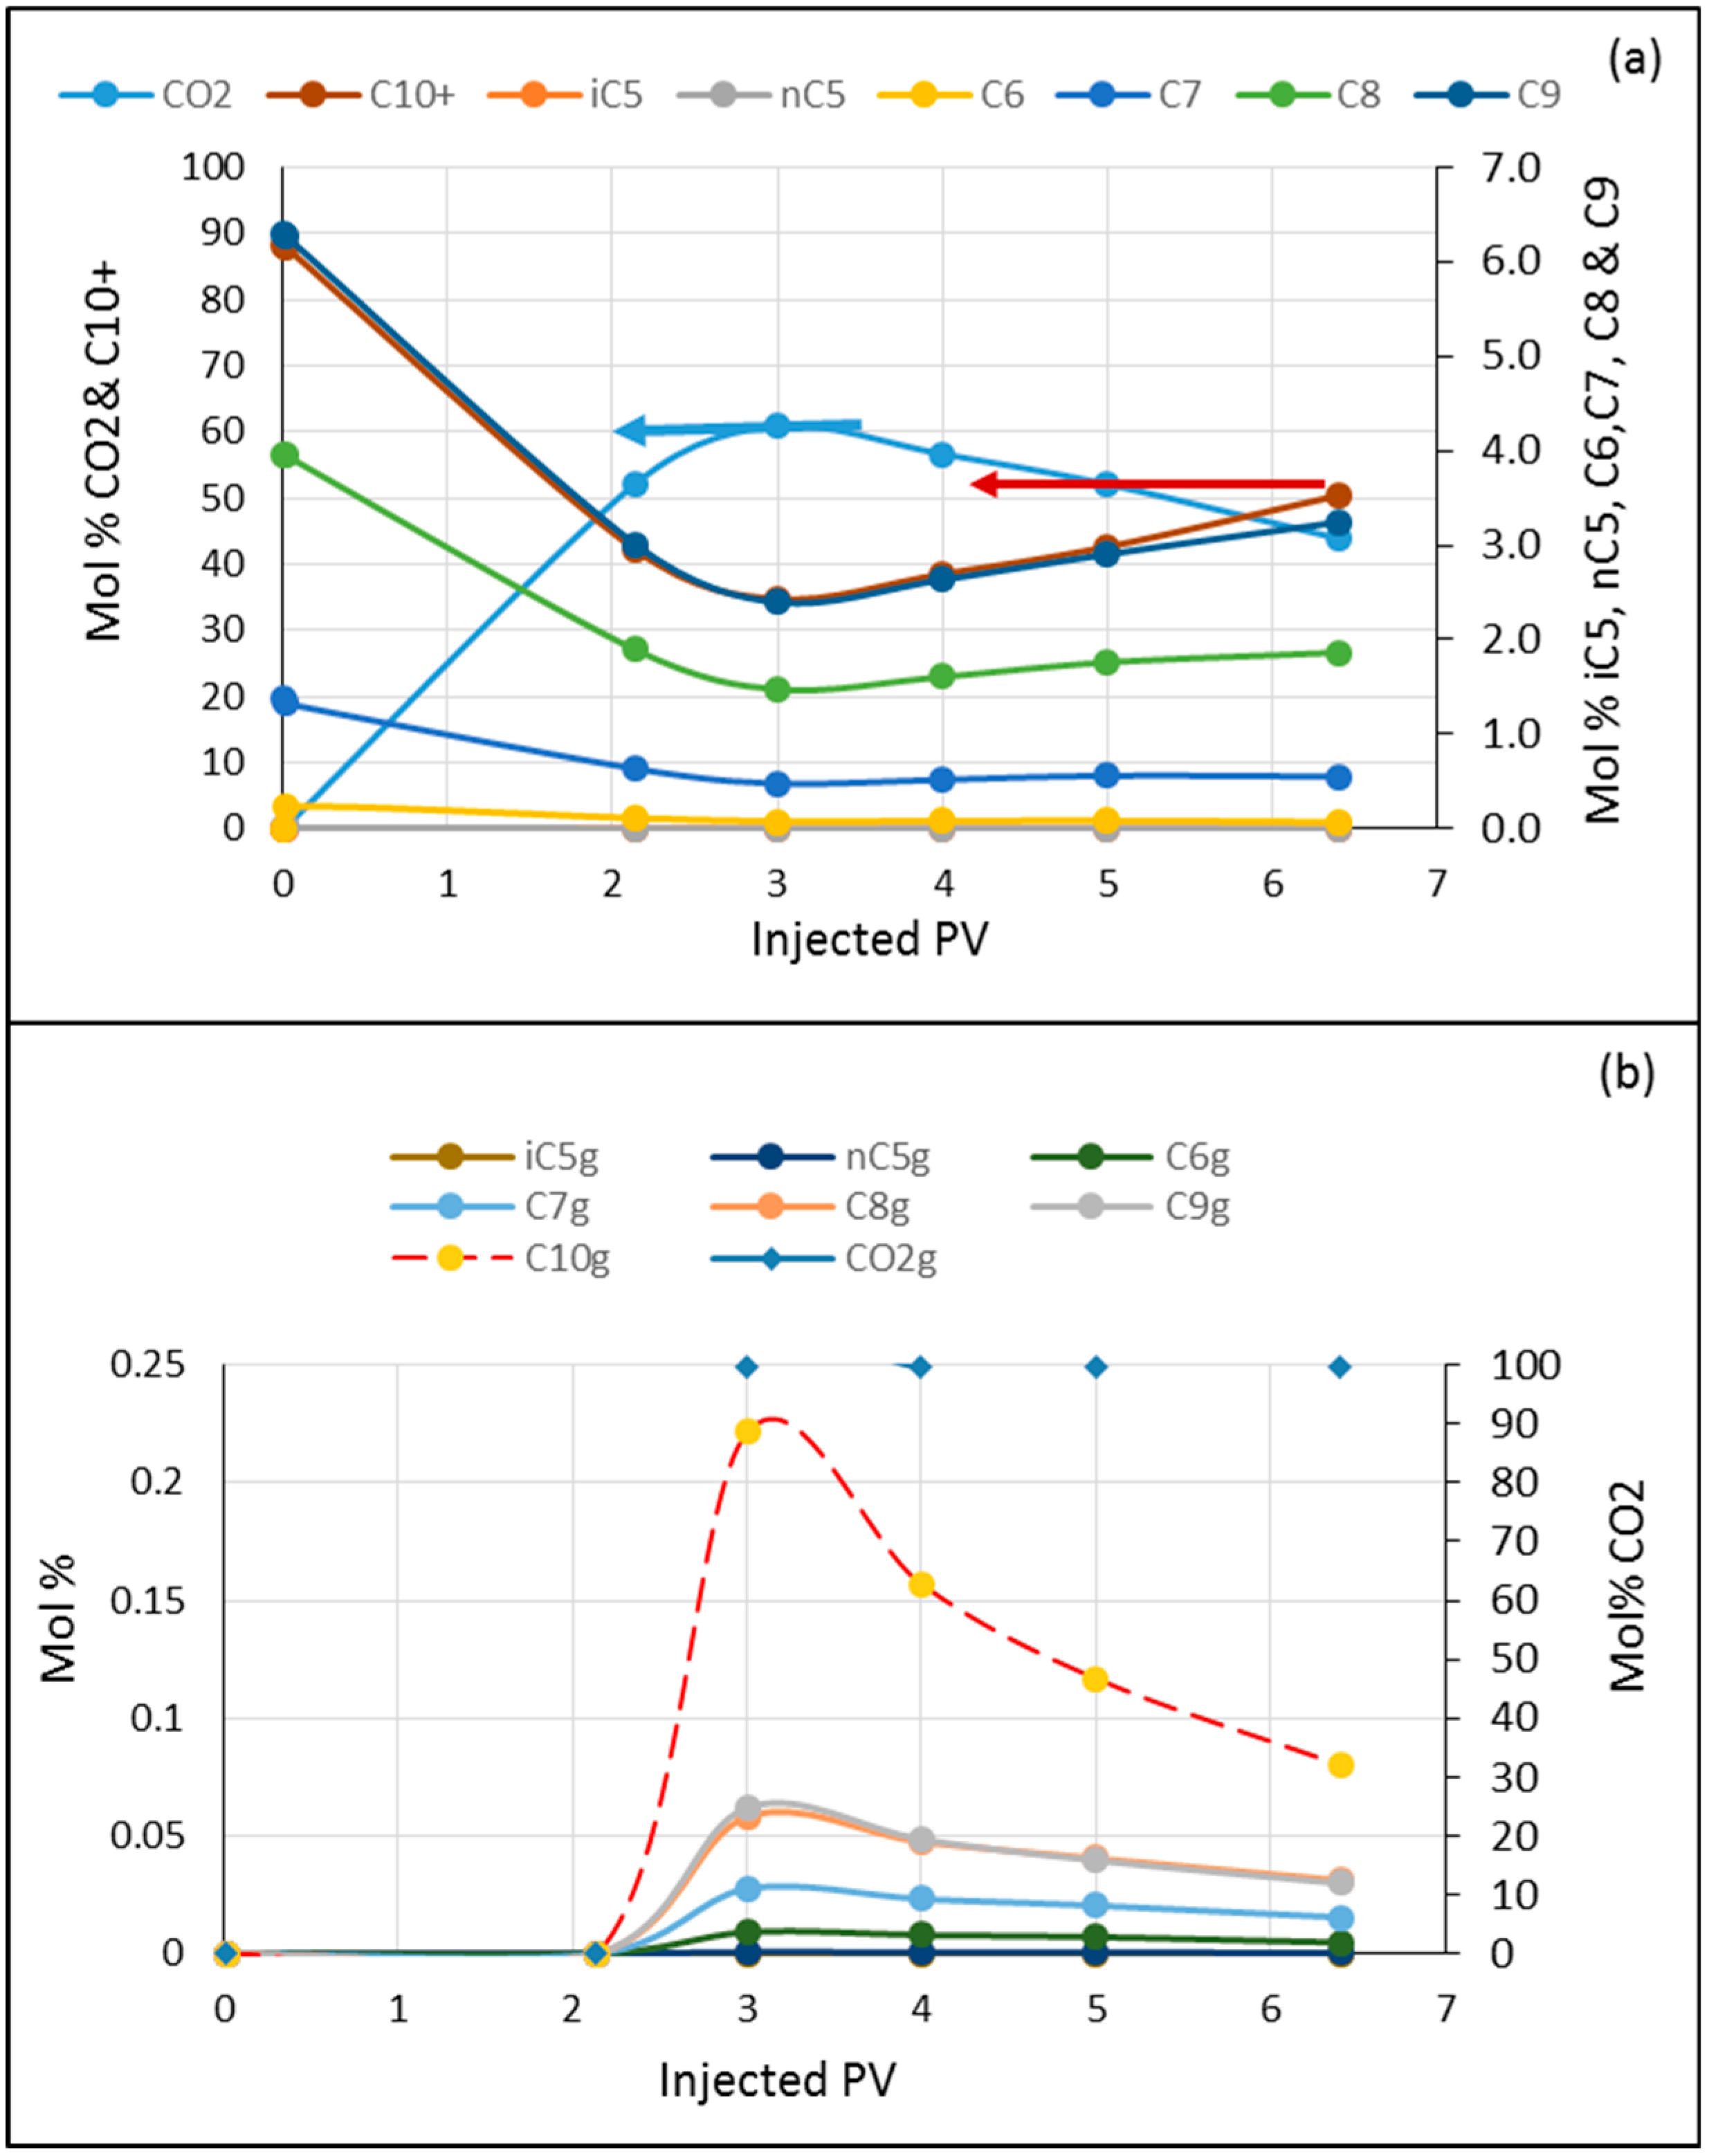
Figure 8.
Dynamic composition as a function of injected pore volume of CO2/C1/C3 into crude oil (a) in liquid phase and (b) in vapor phase.
Figure 8.
Dynamic composition as a function of injected pore volume of CO2/C1/C3 into crude oil (a) in liquid phase and (b) in vapor phase.
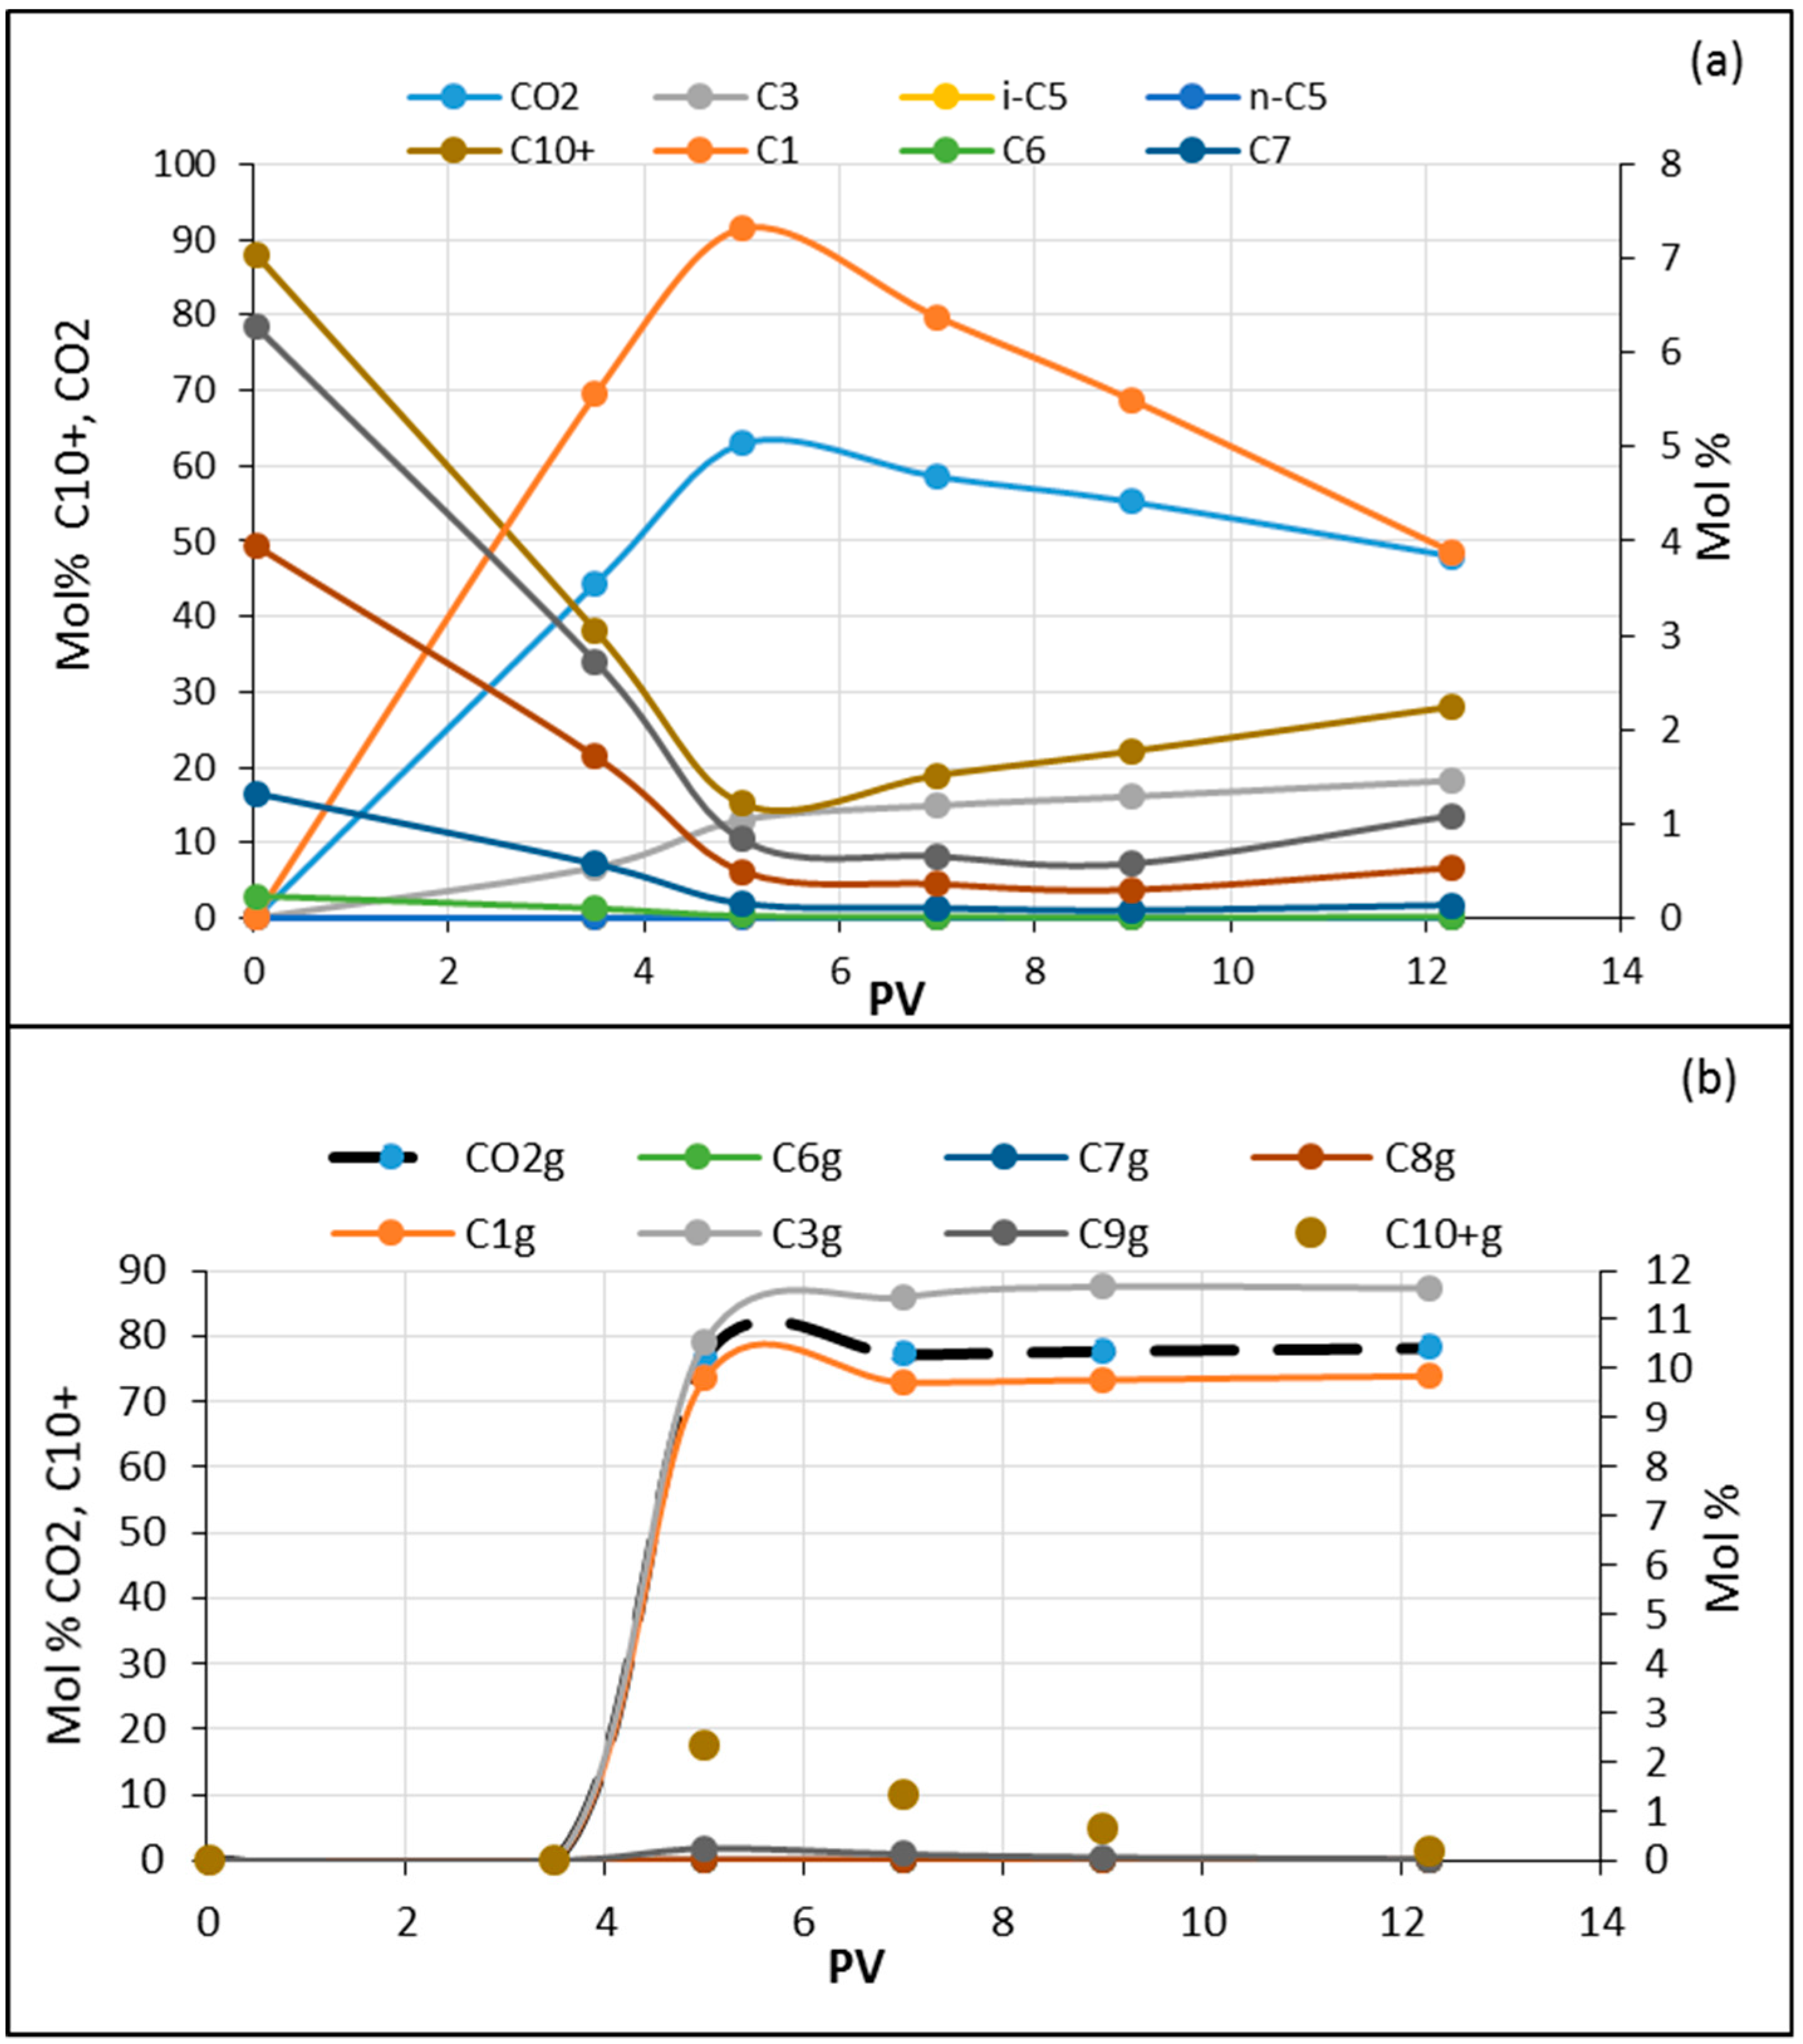
Figure 9.
(a) Viscosity of the displacing fluids as a function of the experimental pressures and (b) comparison between viscosities of crude oil flooded with CO2 and (CO2/C1/C3) CO2 and the viscosity of model oil flooded with (CO2/C1/C3).
Figure 9.
(a) Viscosity of the displacing fluids as a function of the experimental pressures and (b) comparison between viscosities of crude oil flooded with CO2 and (CO2/C1/C3) CO2 and the viscosity of model oil flooded with (CO2/C1/C3).

Table 1.
Characteristics of cores along with associated fluid and flooding conditions.
| Exp. No. | Core Type | Porosity (%) | Length (cm) | Saturating Fluid | Displacing Fluid | Flooding Temp. (°C) |
|---|---|---|---|---|---|---|
| 1 | Bentheimer | 21.70 | 5.07 | Live-oil A | CO2 | 50 |
| 2 | Bentheimer | 21.25 | 9.00 | Live-oil A | CO2 | 70 |
| 3 | Berea | 19.30 | 8.96 | Live-oil A | CO2 | 90 |
| 4 | Bentheimer | 23.24 | 9.00 | Live-oil B | CO2 | 50 |
| 5 | Bentheimer | 23.30 | 9.00 | Live-oil B | CO2 | 70 |
| 6 | Berea | 19.60 | 9.09 | Live-oil B | CO2 | 90 |
| 7 | Bentheimer | 20.20 | 8.90 | Dead-oil | CO2 | 50 |
| 8 | Bentheimer | 21.05 | 9.00 | Dead-oil | CO2 | 70 |
| 9 | Bentheimer | 21.97 | 8.90 | Dead-oil | CO2 | 90 |
| 10 | Berea | 21.68 | 9.00 | Model oil (Crude) | CO2 + C1 + C3 | 70 |
| 11 | Berea | 21.88 | 9.00 | Crude-oil | CO2 + C1 + C3 | 70 |
| 12 | Berea | 21.22 | 9.00 | Crude-oil | CO2 | 70 |
Table 2.
Oil composition.
| Oil Type | C1 (Mole %) | C3 (Mole %) | n-decane (Mole %) |
|---|---|---|---|
| Live Oil A | 20.14 | - | 79.86 |
| Live Oil B | 9.86 | 11.9 | 78.23 |
| Dead oil | - | - | 100 |
Table 3.
Composition of the North Sea crude oil.
| Component | Mole (%) |
|---|---|
| i-C5 | 0.0018 |
| n-C5 | 0.0117 |
| C6 | 0.0024 |
| C7 | 1.390 |
| C8 | 3.961 |
| C9 | 6.287 |
| C10+ | 88.171 |
Table 4.
(a) Comparison between the experimental and the simulation results for the flooded model oil (n-C10) with CO2/C1/C3. The total average difference is about 21%. Note that the negative values indicate exp. data > sim. data. (b) Comparison between the experimental and the simulation results for the flooded live model oil B (n-C10/C1/C3) with CO2/C1/C3. The total average difference is about 39%. Note that the negative values indicate exp. data > sim. data.
| (a) | ||||||||||
| Components | Exp. 1 | Sim. 1 | Exp. 2 | Sim. 2 | Exp. 3 | Sim. 3 | % Diff. 1 | % Diff. 2 | % Diff. 3 | % Avg/Comp. |
| CO2 | 0.1 | 0.198 | 3.7 | 3.93 | 49.3 | 53.47 | 49.5 | 5.9 | 7.9 | 21 |
| C1 | 0.012 | 0.012 | 0.59 | 0.481 | 20.24 | 5.53 | 0 | −22.7 | 72.7 | 32 |
| C3 | 0.02 | 0.015 | 0.573 | 0.58 | 7.8 | 10.3 | −33 | 1.7 | 24.27 | 20 |
| nC10 | 99.8 | 99.8 | 95.1 | 95.0 | 22.7 | 30.7 | 0 | −0.11 | 26.1 | 9 |
| (b) | ||||||||||
| Components | Exp. 1 | Sim. 1 | Exp. 2 | Sim. 2 | Exp. 3 | Sim. 3 | % Diff. 1 | % Diff. 2 | % Diff. 3 | % Avg/Comp. |
| CO2 | 10.48 | 99.0 | 52.64 | 52.61 | 97.1 | 50.2 | 89.4 | −0.03 | −46.9 | 45 |
| C1 | 8.84 | 8.8 | 4.67 | 4.67 | 0.29 | 0.08 | −0.45 | 0 | >−200 | 67 |
| C3 | 10.65 | 10.6 | 5.64 | 5.64 | 0.35 | 0.56 | −0.05 | 0 | 37.5 | 12.6 |
| n-C10 | 70.03 | 69.9 | 37.05 | 37.08 | 2.27 | 49.15 | −0.13 | 0.081 | 95.4 | 31 |
© 2018 by the authors. Licensee MDPI, Basel, Switzerland. This article is an open access article distributed under the terms and conditions of the Creative Commons Attribution (CC BY) license (http://creativecommons.org/licenses/by/4.0/).
Share and Cite
MDPI and ACS Style
Hamouda, A.A.; Chughtai, S. Miscible CO2 Flooding for EOR in the Presence of Natural Gas Components in Displacing and Displaced Fluids. Energies 2018, 11, 391. https://doi.org/10.3390/en11020391
AMA Style
Hamouda AA, Chughtai S. Miscible CO2 Flooding for EOR in the Presence of Natural Gas Components in Displacing and Displaced Fluids. Energies. 2018; 11(2):391. https://doi.org/10.3390/en11020391
Chicago/Turabian StyleHamouda, Aly A, and Sidra Chughtai. 2018. "Miscible CO2 Flooding for EOR in the Presence of Natural Gas Components in Displacing and Displaced Fluids" Energies 11, no. 2: 391. https://doi.org/10.3390/en11020391
Note that from the first issue of 2016, this journal uses article numbers instead of page numbers. See further details here.