Pulse Current of Multi-Needle Negative Corona Discharge and Its Electromagnetic Radiation Characteristics

1
State Key Laboratory of Mechatronics Engineering and Control, Beijing Institute of Technology, Beijing 100081, China
2
Xi’an Institute of Electromechanical Information Technology, Xi’an 710065, China
*
Author to whom correspondence should be addressed.
Energies 2018, 11(11), 3120; https://doi.org/10.3390/en11113120
Submission received: 20 October 2018
/
Revised: 4 November 2018
/
Accepted: 6 November 2018
/
Published: 12 November 2018
(This article belongs to the Section F: Electrical Engineering)
Abstract
:Negative corona discharge occurs widely in high voltage transmission lines and other “high voltage” uses, which can cause strong electromagnetic interference (EMI). In this research, the pulse current of multi-needle negative corona discharge and its electromagnetic (EM) radiation characteristics were studied and compared with that of single-needle negative corona discharge. A dipole radiation model was established to analyze the EM radiation characteristics of the negative corona discharge. The results show that the Trichel pulse discharge process of one discharge needle in multi-needle discharge structure will inhibit the discharge of the other discharge needles. It is only when the voltage reaches a certain threshold will the current and EM radiation fields of multi-needle discharge structure with a significant increasing of amolitude. The frequency of EM radiation of negative corona discharge is not affected by the number of needles, but is only related to ambient air pressure. This research provides a basis for detecting corona discharge sources in different conditions.
1. Introduction
Corona discharge, which is a relatively low-energy discharge process, occurs only in a strong electric field near a electrode with small radius of curvature [1] is a common discharge phenomenon in plasma generator [2], ozone generator [3], electrostatic precipitator [4], electrostatic printing, electrostatic charge of aerosol particles [5], high voltage transmission lines [6], and charged aircraft [7]. Corona discharge usually performs simultaneously in a multi-needle (multi-point) format [8,9,10].
Negative corona discharge currents exhibit a regular pulse form, called Trichel pulse [11], which can cause strong electromagnetic (EM) interference. The EM radiation characteristics of multi-point and single-point corona discharge are significantly different. On the one hand, multi-needle negative corona discharge can cause the loss of power high voltage equipment, radio interference and television interference [12]. On the other hand, multi-needle negative corona discharge EM radiation signals can be used as target signals for high-voltage transmission line detection and high-altitude aircraft target recognition [13]. Therefore, it is of great significance to study the pulse current of multi-needle negative corona discharge and its EM radiation characteristics.
Reid A.J. [14], Mutakamihigashi T. [15], and Nugraha F.A. [16] studied the EM radiation characteristics that were produced by partial discharge (PD). IEC 62478 standard [17] and Tungkmawanich A. [18] proposed methods for PD detection using EM radiation signals of PD. However, their research focuses more on strong discharge, such as spark discharge, but less on EM radiation characteristics of corona discharge. Yasuyuki T. et al. [19] experimentally studied the spectrum of the negative corona discharge radiation signal under the needle-plate discharge structure and compared it with the spark discharge EM radiation signal. Although they obtained the spectrum of the negative corona radiation signal, they did not analyze the mechanism of the radiation signal. He W. [20] studied the characteristics of alternating current corona discharge pulses and its radio interference level in a coaxial wire-cylinder gap. They focused on the radio interference current at a frequency of 0.5 MHz. Zhang Y. [21] studied the relationship between the spectrum of the single-needle negative corona radiation signal and the discharge parameters. He believed that the spectrum of the discharge EM radiation signal is only related to the rising time of the Trichel pulse current. But, the study did not analyze the discharge EM radiation process.
The above studies did not pay attention to the EM radiation characteristics of multi-needle DC negative corona discharge. At present, researches on multi-needle (multi-point) discharge mainly focus on the volt-ampere characteristics of discharge and the interaction analysis of discharge process [9,22]. In addition, Albarracin R. [23] studied the EM radiation characteristics of multi-needle corona discharge under AC voltage. His research provides a good basis for the study of EM radiation characteristics of multi-needle corona discharge. However, further research is needed on the EM radiation characteristics of multi-needle negative corona discharge. The pulse current characteristics of the multi-needle negative corona discharge should be studied, and the corresponding relationship between EM radiation signal and pulse current should be analyzed. The effects of multi-needle discharge structure on pulse current and EM radiation characteristics of negative corona discharge must be further studied.
In this paper, we focus on the current characteristics of multi-needle negative corona discharge and its EM radiation characteristics. A test system for negative corona discharge radiation characteristics was set up. The effects of discharge parameters on the single-needle negative corona discharge Trichel pulse current and its EM radiation field were tested. The current superposition of multi-needle negative corona discharge and the interference of the EM radiation field were studied. The EM radiation model of dipole negative corona discharge was established, and the relationship between the EM radiation characteristics of negative corona discharge and the parameters of the discharge system was analyzed. Effects of multi-needle discharge structure on the EM radiation characteristics of negative corona discharge were studied. This study can provide promising methods for the evaluation of insulation condition of electric apparatus as well as the detection of the discharge sources.
2. Experimental Setup
The experimental system is shown in Figure 1a, which consists of a high voltage generating module, a discharging module, a signal detection module, and a shielding module. The high voltage generating module includes the high voltage power supply and the high voltage capacitor. During the experiment, the high voltage capacitor is charged at first with the high voltage power supply. The high voltage power supply is turned off after the voltage reaches a predetermined value. The high voltage capacitor is used to supply the discharge needle to eliminate the EM radiation interference that was generated by the high voltage power supply. The capacitance is 20 μF and the withstand voltage is 20 kV. The discharging module is designed according to IEC 60270 standard [24], which includes a corona discharge object and a vacuum box, as shown in Figure 1b,c. Discharge experiments of discharge needles of different tip radius can be carried out through the change of the discharge needle on the discharge object, and multi-needle simultaneous discharge experiments can also be performed. The displacement platform on the corona discharge object can be used to precisely control the gap of the electrodes. The vacuum box can control the air pressure of the discharge environment in the range of 0.01 MPa to 0.1 MPa. The grounding plate is grounded through a 1 kΩ sampling resistor.
The signal detection module includes an oscilloscope (Tektronix MDO3104, Tektronix, Tektronix, Beaverton, OR, USA), a spectrum analyzer (Agilent E4447A, Agilent, Santa Clara, CA, USA), and a receiving antenna (Discone Antenna OX-08-02, 20 MHz to 1000 MHz. Kelixun, Chengdu, China). The antenna has a S11 parameter lower than 2 in the 20 MHz to 1000 MHz band. The oscilloscope measures the voltage waveform on the sampling resistor to calculate the discharge current. The corona discharge EM radiation signal is received by the wide-band diskcone antenna, and the distance d between the antenna and the discharge device can be adjusted. The signal, received by the antenna, is collected by the oscilloscope after being analyzed by the spectrum analyzer.In order to eliminate the influence of external electromagnetic interference (EMI) on the test results, all experiments were proceeded in a microwave anechoic chamber.
3. Experimental Results and Analysis
3.1. Single-Needle Negative Corona Discharge Trichel Pulse Current and Its Radiation Characteristics
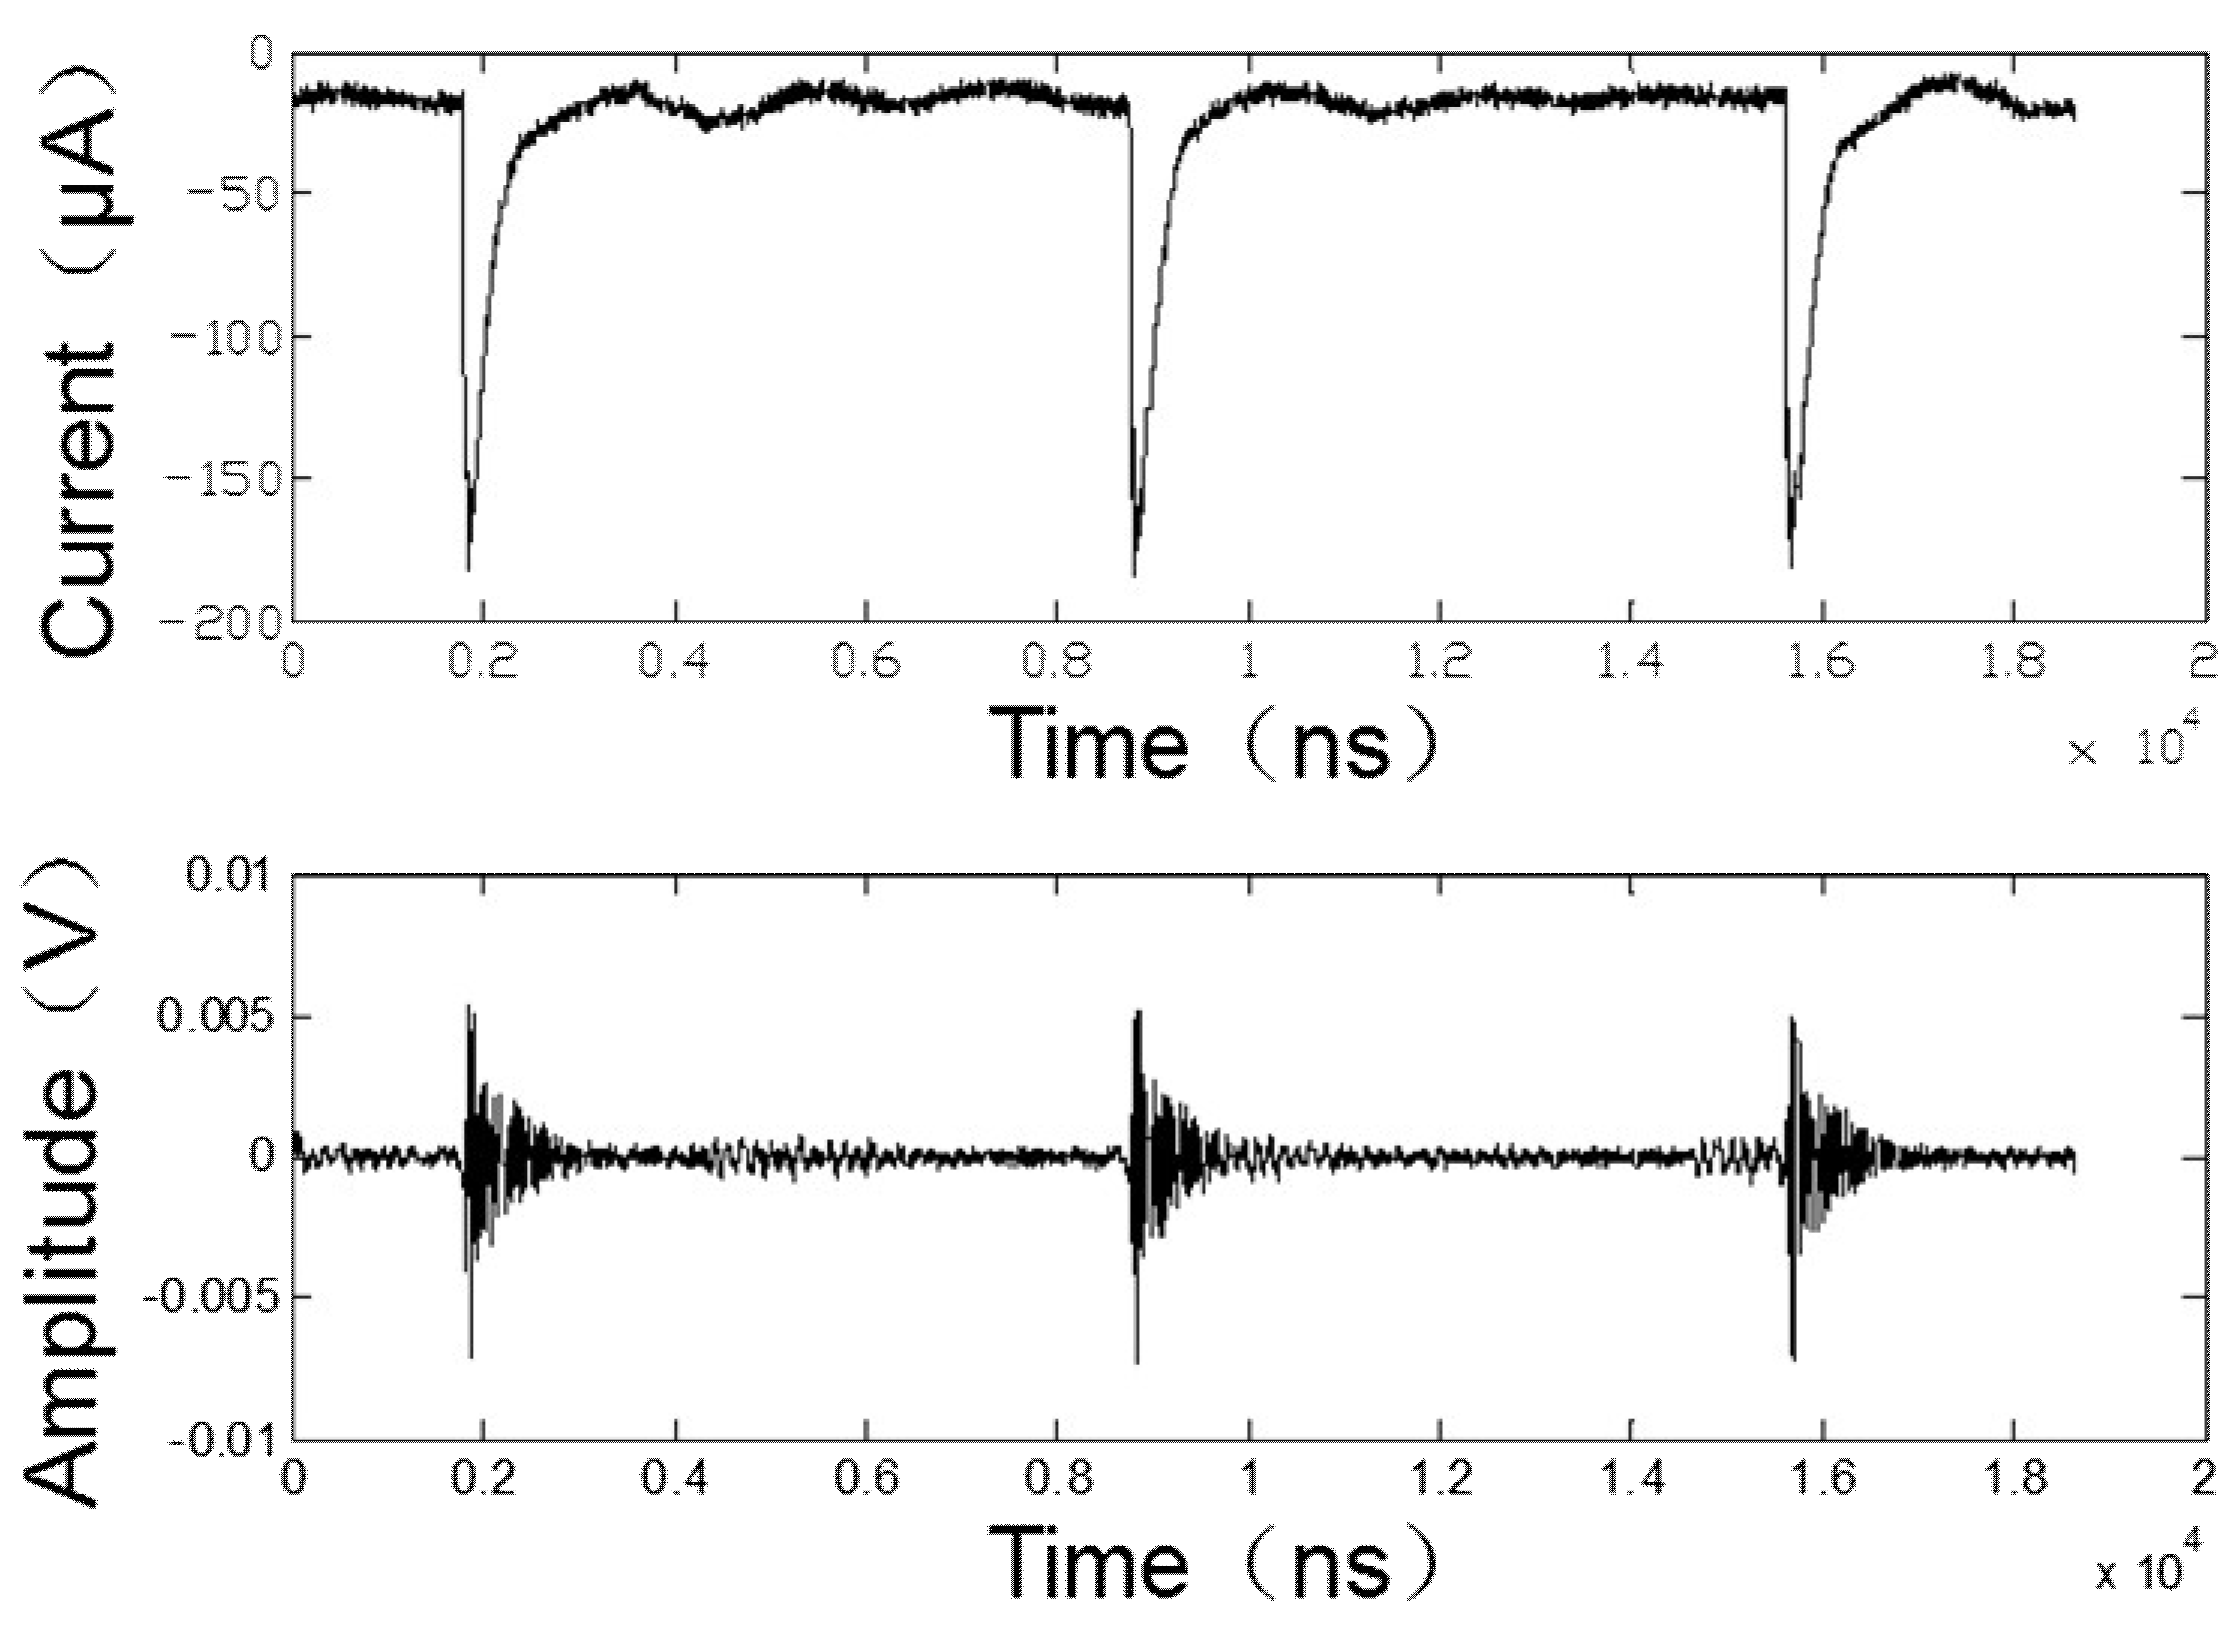
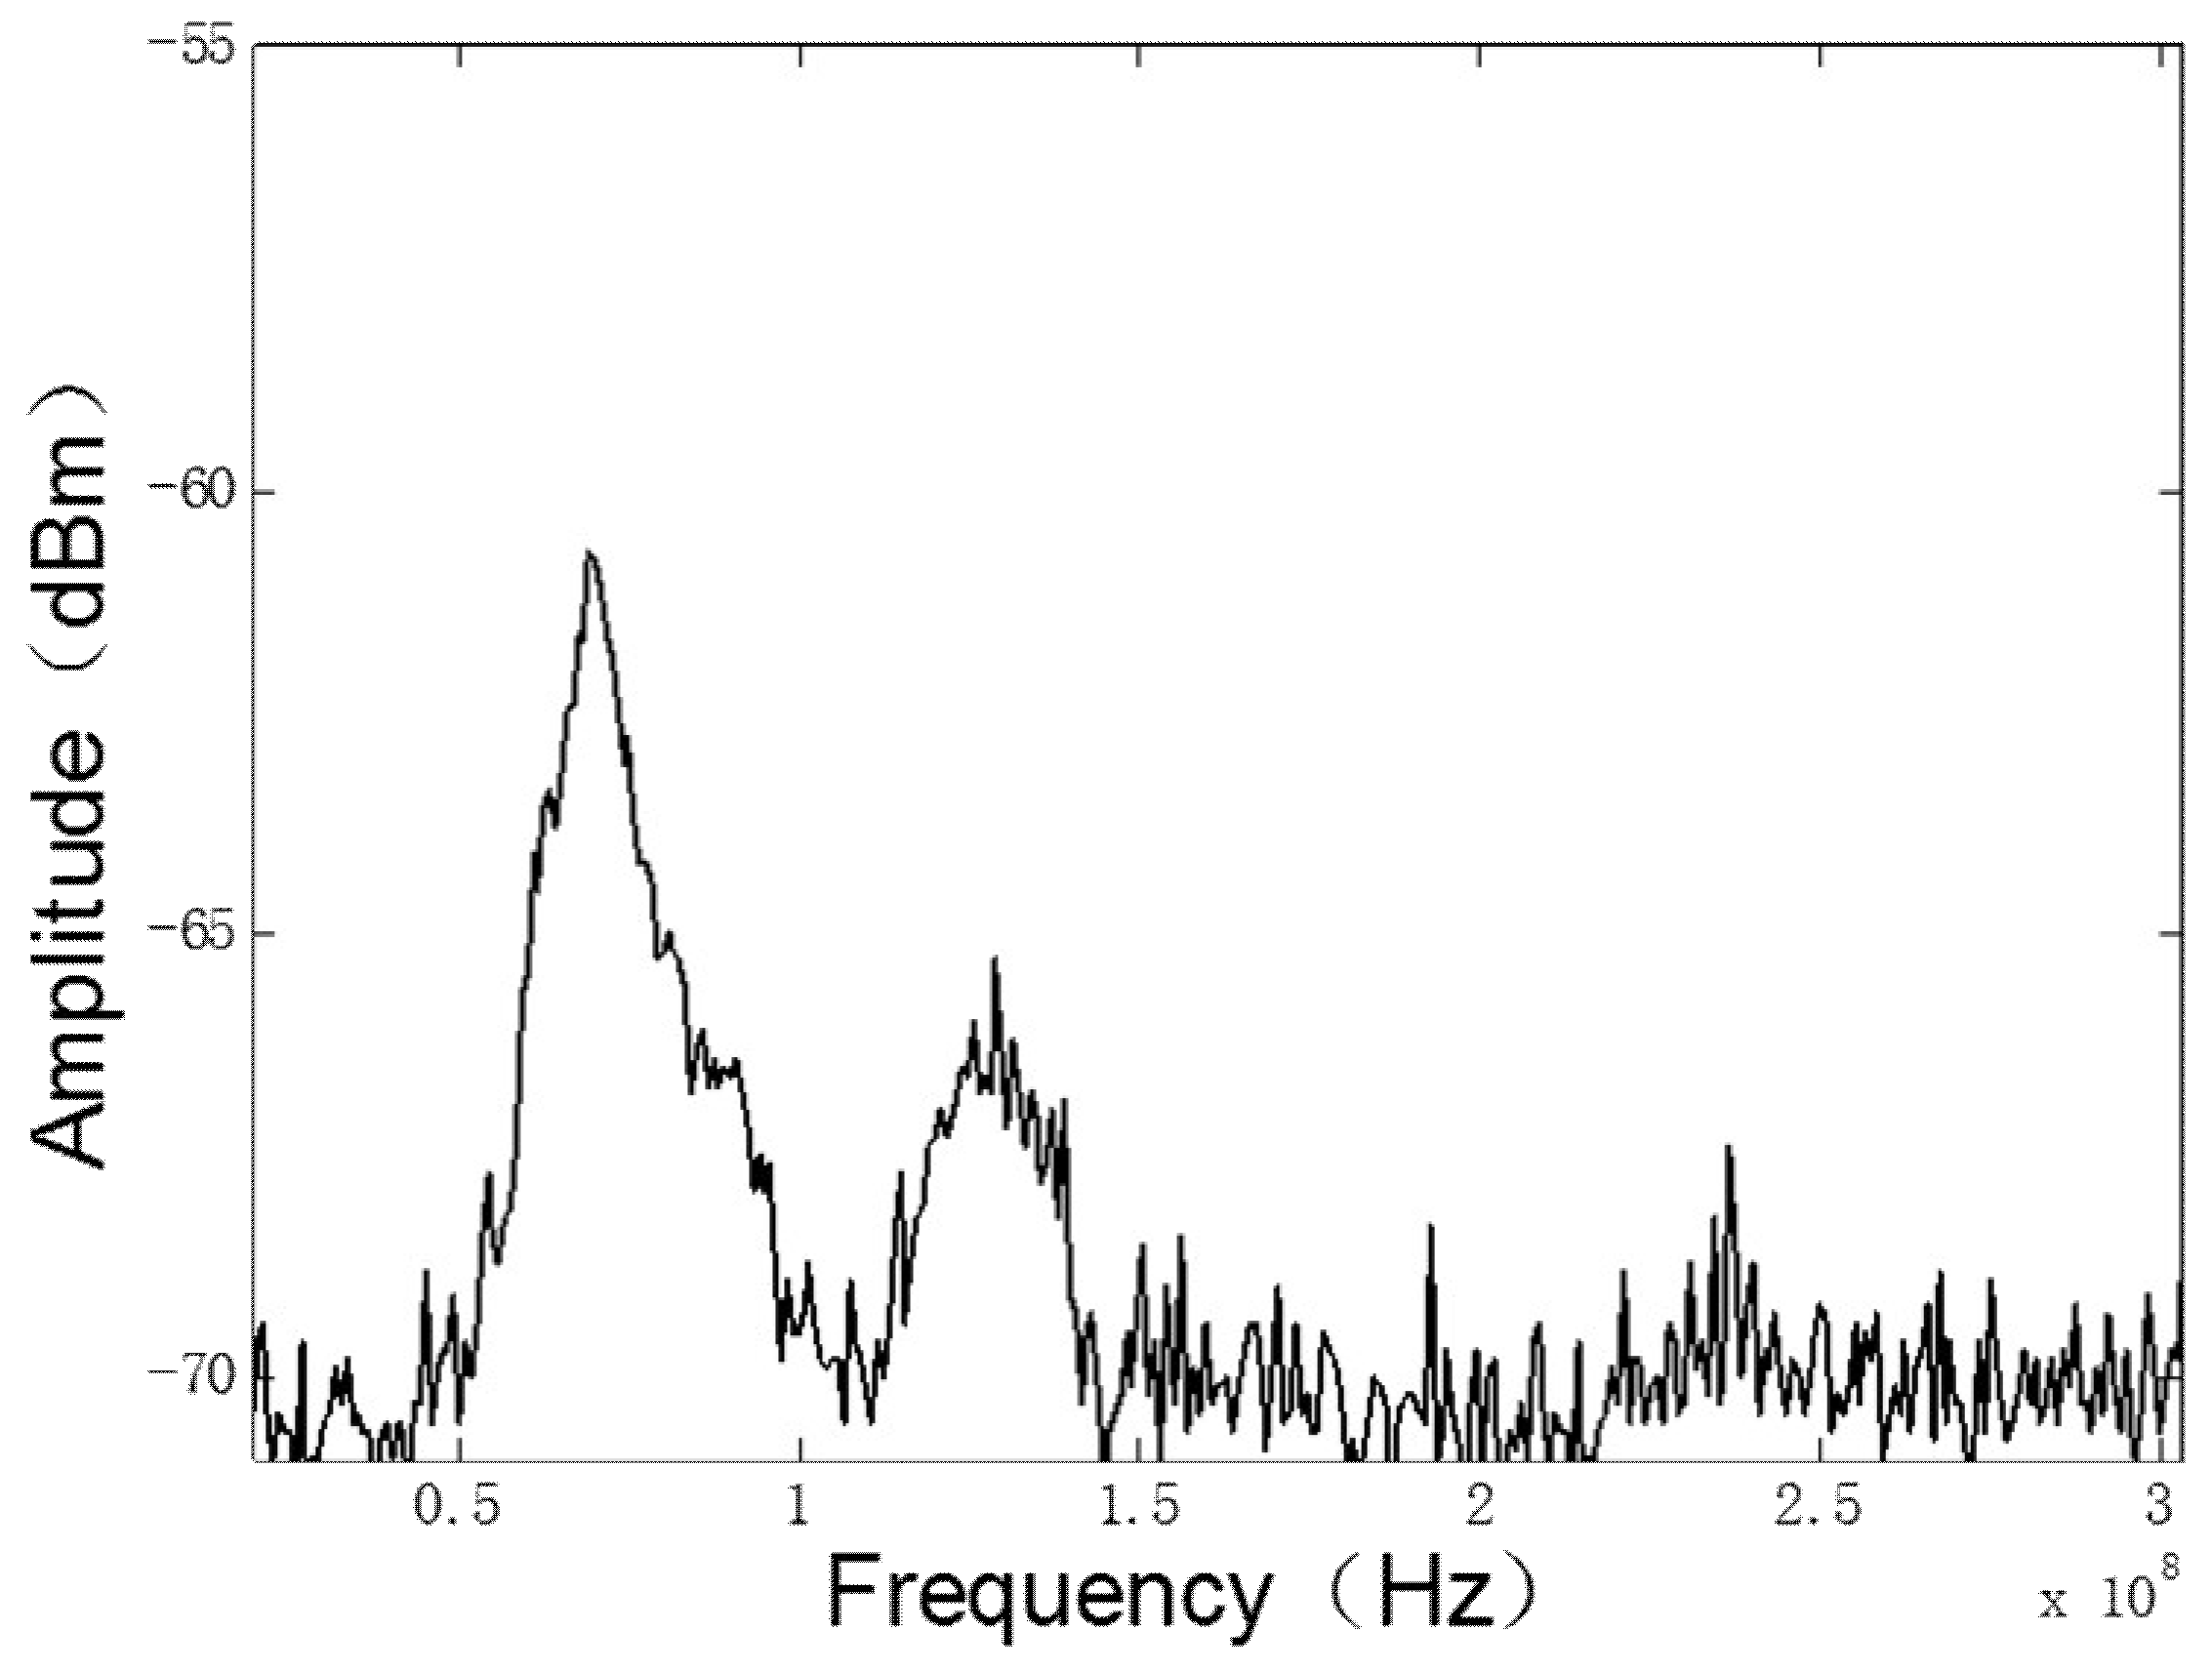
The initial stage of negative corona discharge is the Townsend discharge stage, where the discharge current is usually within 1 μA and is relatively stable. As the applied voltage increases, the discharge enters the Trichel pulse stage. Figure 2 shows the Trichel pulse current and its radiated signal waveform. Trichel pulses have a short rising time, which is typically tens of ns. The falling time is typically a few hundred ns, much longer than the rising time. Trichel pulses have a stable repetition rate. In the Trichel pulse stage, EM waves will be radiated to the surroundings. The waveform of the discharge EM radiation signal that was received by the antenna corresponds to the Trichel pulse current waveform with the same repetition frequence. Therefore, it is believed that the discharge radiation signal is generated by the Trichel pulse process. The frequency spectrum of the discharge EM radiation signal under atmospheric pressure is shown in Figure 3. The figure indicates that the frequency of the single-needle discharge radiation signal is mainly within 200 MHz. There is a large energy distribution near 70 MHz (the fundamental frequency of the EM radiation signal), and also a certain energy distribution near 132 MHz. (second-harmonic generation of the EM radiation signal).
The Trichel pulse that is generated by negative corona discharge is related to factors such as applied voltage, air pressure, and tip radius of the discharge needle, etc. Figure 4 shows the relationship between the repetition frequency of the Trichel pulse and the applied voltage. The repetition frequency of Trichel pulse increases with the raise of applied voltage, while the amplitude of a single pulse decreases slightly. This is consistent with the research results of Leob [25]. The spectrum of the discharge radiation signal at different pulse repetition frequencies is shown in Figure 5. The intensity of the discharge EM radiation signal decreases slightly, the frequency of the EM radiation signal does not change, the spectral lines become denser, and the average power of the discharge radiation signal increases as the increase of the repetition frequency of Trichel pulse current that is generated by the negative corona discharge. It also indicates that the changes in gap distance of electrode do not affect the intensity and frequency of the radiation signal.
As shown in Table 1, when the air pressure is reduced from 0.1 MPa to 0.04 MPa, the rising time of the Trichel pulse increases from 52 ns to 265 ns, while the pulse amplitude remains unchanged. Studies show that the discharge EM radiation signal spectrum is only related to the rising time of Trichel pulse [19]. The main frequency position of the EM radiation signal that is generated by the negative corona discharge shifts from 70 MHz to 45 MHz, while the power of the discharge EM radiation signal decreases from 1.926 nW to 0.218 nW.
As the tip radius of the discharge needle increases from 62 μm to 210 μm, the amplitude of the Trichel pulse increases from 240 μA to 550 μA, while the rising and falling time of the pulse remains unchanged. This result is consistent with that of Lama [26] and Dordizadeh [27]. The frequency of the negative corona discharge EM radiation signal remains unchanged and the power of the radiation signal increases from 1.926 nW to 8.581 nW.
Therefore, the frequency of the single-needle negative corona discharge EM radiation signal will be determined by the air pressure. The intensity of the EM radiation signal of the negative corona discharge is affected by the air pressure and the tip radius of cathode. The applied voltage and the gap distance of the electrode have no effect on the EM radiation signal frequency, but affect the intensity and the average power of the discharge radiation signal.
3.2. Multi-Needle Negative Corona Discharge Characteristics
In practical applications, corona discharge often has a multi-needle (multi-point) structure. The waveform of a multi-needle discharge is significantly different from single-needle discharge. We firstly measured the double-needle discharge Trichel pulse current. To distinguish the Trichel pulse currents that were generated by different discharge needles, we chose two discharge needles with tip radius of 168 μm and 94 μm, respectively, for experiments (the larger the tip radius is, the larger the amplitude of the Trichel pulse current will be). The discharge condition is: applied voltage 7.4 kV, gap distance 10 mm, ambient pressure 0.1 MHz, and relative humidity 42%. The discharge current is shown in Figure 6a. It can be clearly indicates that the amplitude of the Trichel pulse current that is generated by the discharge needle with a smaller radius is about 270 μA, and the pulse interval time is 1.32 μs., while the large radius are respectively 440 μA and 6.08 μs. Under this voltage, the Trichel pulse currents that were generated by the two discharge needles appear separately. Through further increasing the applied voltage, the discharge current waveform is shown in Figure 6b. It indicates that as the applied voltage increases, the amplitude of the Trichel pulse current that is generated by the smaller radius tip decreases from about 270 μA to about 245 μA, and the pulse interval time decreases to 0.69 μs. At the same time, when the applied voltage rises to a certain value, the Trichel pulses that were generated by the discharge needle with larger tip radius and smaller tip radius superimpose with each other. The maximum amplitude of the superimposed pulse current can reach 535 μA and the minimum 490 μA, which is significantly larger than the unsuperimposed pulse. We also measured the discharge current of the multi-needle discharge structure. The test result is similar to the double-needle discharge. As the applied voltage increase, the smaller tip radius needle begins to discharge first. The other needles begin to discharge with further increases of applied voltage. The Trichel pulse current between the needles occurs separately in a certain voltage range. However, as the applied voltage continues to increase, the Trichel pulse current generated by the different discharge needles will be superimposed, and the amplitude of the superimposed pulse will increase significantly.
When the applied voltage is lower, the Trichel pulse processes of the two needles will not happen at the same time. The EM radiation signal, which corresponds to the Trichel pulse current, is determined by the Trichel pulse current generated by each needle. When the applied voltage rises to an appropriate value, the Trichel pulse processes of the two needles will occur simultaneously. The Trichel pulse current waveform and the EM field signal generated during the simultaneous discharge of the two needles are shown in Figure 7. The pulses pointed by arrow 1 and arrow 2 are the Trichel pulse generated by two different discharge needles respectively, and the larger pulse pointed by the arrow 0 is the superimposed pulse that is generated by the simultaneous discharge of the two discharge needles. It can be seen that the discharge EM radiation signal generated by the non-superimposed Trichel pulse current has amplitude of about 4.5 mV, and for the superimposed pulse current, the amplitude can reach 7.5 mV. Therefore, when the double-needle simultaneous discharge pulse currents superimpose, the generated EM radiation field will also be superimposed, and the intensity will increase significantly.
The double-needle discharge radiation spectrum is shown in Figure 8. The air pressure is 0.1 MPa and the tip radius of both discharge needles is 60 μm. It indicates that the spectrum of the EM radiation signal of the double-needle negative corona discharge is mainly distributed within 200 MHz, the signal intensity is large in the frequency band around 70 MHz, and there is also a certain frequency distribution in the frequency band around 140 MHz. Under the same discharge condition, the double-needle negative corona discharge has the same frequency as the single-needle negative corona discharge. However, when the Trichel pulse processes of two discharge needles occur simultaneously, the spectral intensity of the generated EM radiation signal increases significantly when the pulse process is superimposed, and the spectral intensity near 70 MHz is increased from −60 dBm of the single-needle discharge structure to –57 dBm of the double-needle.
The frequency of the EM radiation signal generated by the double-needle negative corona discharge is only related to the ambient air pressure. When the air pressure is determined, the frequency of the EM radiation signal generated by the double-needle discharge will remain unchanged. The intensity is related to the air pressure, the tip radius of cathode, and applied voltage.
It is found in the experimental test that the multi-needle simultaneous discharge current characteristics and EM radiation characteristics are basically consistent with those of the double-needle discharge structure. When the applied voltage is low, the pulse processes of the discharge needles do not occur at the same time, and the radiation signals are generated by the discharge pulse process of each discharge needle alone. As the applied voltage rises, different discharge needle pulse processes may occur simultaneously, and the pulse currents will be linearly superimposed, which can result in an increase in the discharge radiation field intensity. If the applied voltage is increased continuously, then the corona discharge will enter the glow stage, the discharge current will be in a DC state, and the EM radiation signal will disappear. The frequency of the EM radiation signal of the multi-needle negative corona discharge is only related to the air pressure, while the intensity is affected by number of discharge needles, tip radius of cathode, gap distance of electrode, and applied voltage. Therefore, when the air pressure is determined, the frequency of the EM radiation signal will also be determined, and the detection of the negative corona discharge can be realized by detecting the characteristic spectrum of the negative corona discharge radiation signal.
4. Discussion
4.1. Mechanism Analysis of EM Radiation Generated by Negative Corona Discharge
The space between the two electrodes of negative corona discharge can be divided into a ionization zone, a plasma zone, and a drift zone [28]. As shown in Figure 9, the ionization region is near the tip of the discharge needle. At the beginning of the discharge, the seed electrons near the electrode collide with the neutral air molecules under the action of a strong electric field. The neutral molecules are ionized into positive ions and electrons, the positive ions move toward the negative electrode under the action of the electric field, and the electrons continue to ionize other neutral molecules under the action of the electric field. In a very short time, the number of electrons increases sharply, forms an ionosphere near the tip of the discharge needle, and the external circuit current increases sharply. This process is called electronic avalanche. The thickness of the ionization region of the negative corona discharge is usually about 1.5 mm [1]. Since the electric field is relatively strong and the charge-to-mass ratio of the electron is relatively large in this region, the velocity of electrons in this region can reach 0.01 times of light speed [29,30]. After leaving the ionization region, the electrons will enter the plasma region. The electric field in the plasma region cannot provide sufficient energy for the electrons to complete the impact ionization. Therefore, the electrons combine with the neutral air molecules to form negative ions in the plasma region, then enter into the drift region, and move towards the anode under the action of the electric field. Since the charge-to-mass ratio of positive ions and negative ions is much larger than that of electrons, the velocity of positive ions and negative ions is negligible when compared to electrons moving at high speed in the ionization region. Therefore, it can be considered that for each pulse process in the entire discharge region, the discharge EM radiation field is generated due to the exponential growth and the rapid movement of electrons in the process of the electron avalanche in the ionization region and the plasma region.
Wilson P.F. et al. [31] equate the EM radiation field generated by spark discharge with a dipole radiation model. The length of the dipole is equal to that of the discharge gap. According to his findings, we equate the EM radiation field that is generated by negative corona discharge with the dipole radiation model, as shown in Figure 10. However, the length of the negative corona dipole model is different from that of the spark discharge dipole model. The dipole length dl = 1.5 mm (thickness of the ionization region), the direction is along the z-axis of the cylindrical coordinates, and the center of the dipole is the coordinate origin. For this configuration, the fields are found to be [31]:
where (V/m) is the electric field strength of the EM wave, (T) is the magnetic field strength of the EM wave, R (m) is the distance from the discharge point to the observation point (ρ, φ, z), (Ω) is the free space wave impedance, and (A) is the discharge current time-dependent waveform evaluated at time u (s), where u = t − R/c indicates the time lag when the radiation signal propagates to point .
According to Equation (1), the space around the discharge needle can be divided into a near-field () and a far-field region (), where is the wavelength of the radiation signal [31]. In the near-field region, the EM radiation signal is mainly determined by . The intensity is attenuated as . While in the far field are and .
Substitute the experimentally measured Trichel pulse current into the dipole radiation model to calculate the EM radiation field generated by the Trichel pulse. Figure 11 shows the Trichel pulse current of the discharge needle with a tip radius of 210 μm under 0.1 MPa. The current amplitude is 550 μA and the rising time is 53 ns.
Substitute the Trichel pulse current into Equation (1) to calculate the discharge radiation field intensity waveform at different detection distances. As shown in Figure 12, the calculated EM radiation field intensity forms a pulse form, and the amplitude of the radiation signal is approximately inversely proportional to the detection distance. The EM wave propagates in the space at the speed of light, and the EM radiation field delay time is different at different positions.
4.2. Comparison of Calculation Results of Dipole Radiation Model with Experimental Test Results
Document [21] has studied the effect of Trichel pulse current parameters on the discharge radiation spectrum. This paper mainly analyzes the relationship between the amplitude of discharge EM radiation field and Trichel pulse parameters. When the single Trichel pulse current waveform is the same, as the pulse repetition frequency increases, the average power of the radiation signal will increase, but the repetition frequency of the pulse will not affect the EM radiation signal that is generated by each pulse current, which is consistent with the experimental results (Figure 5).
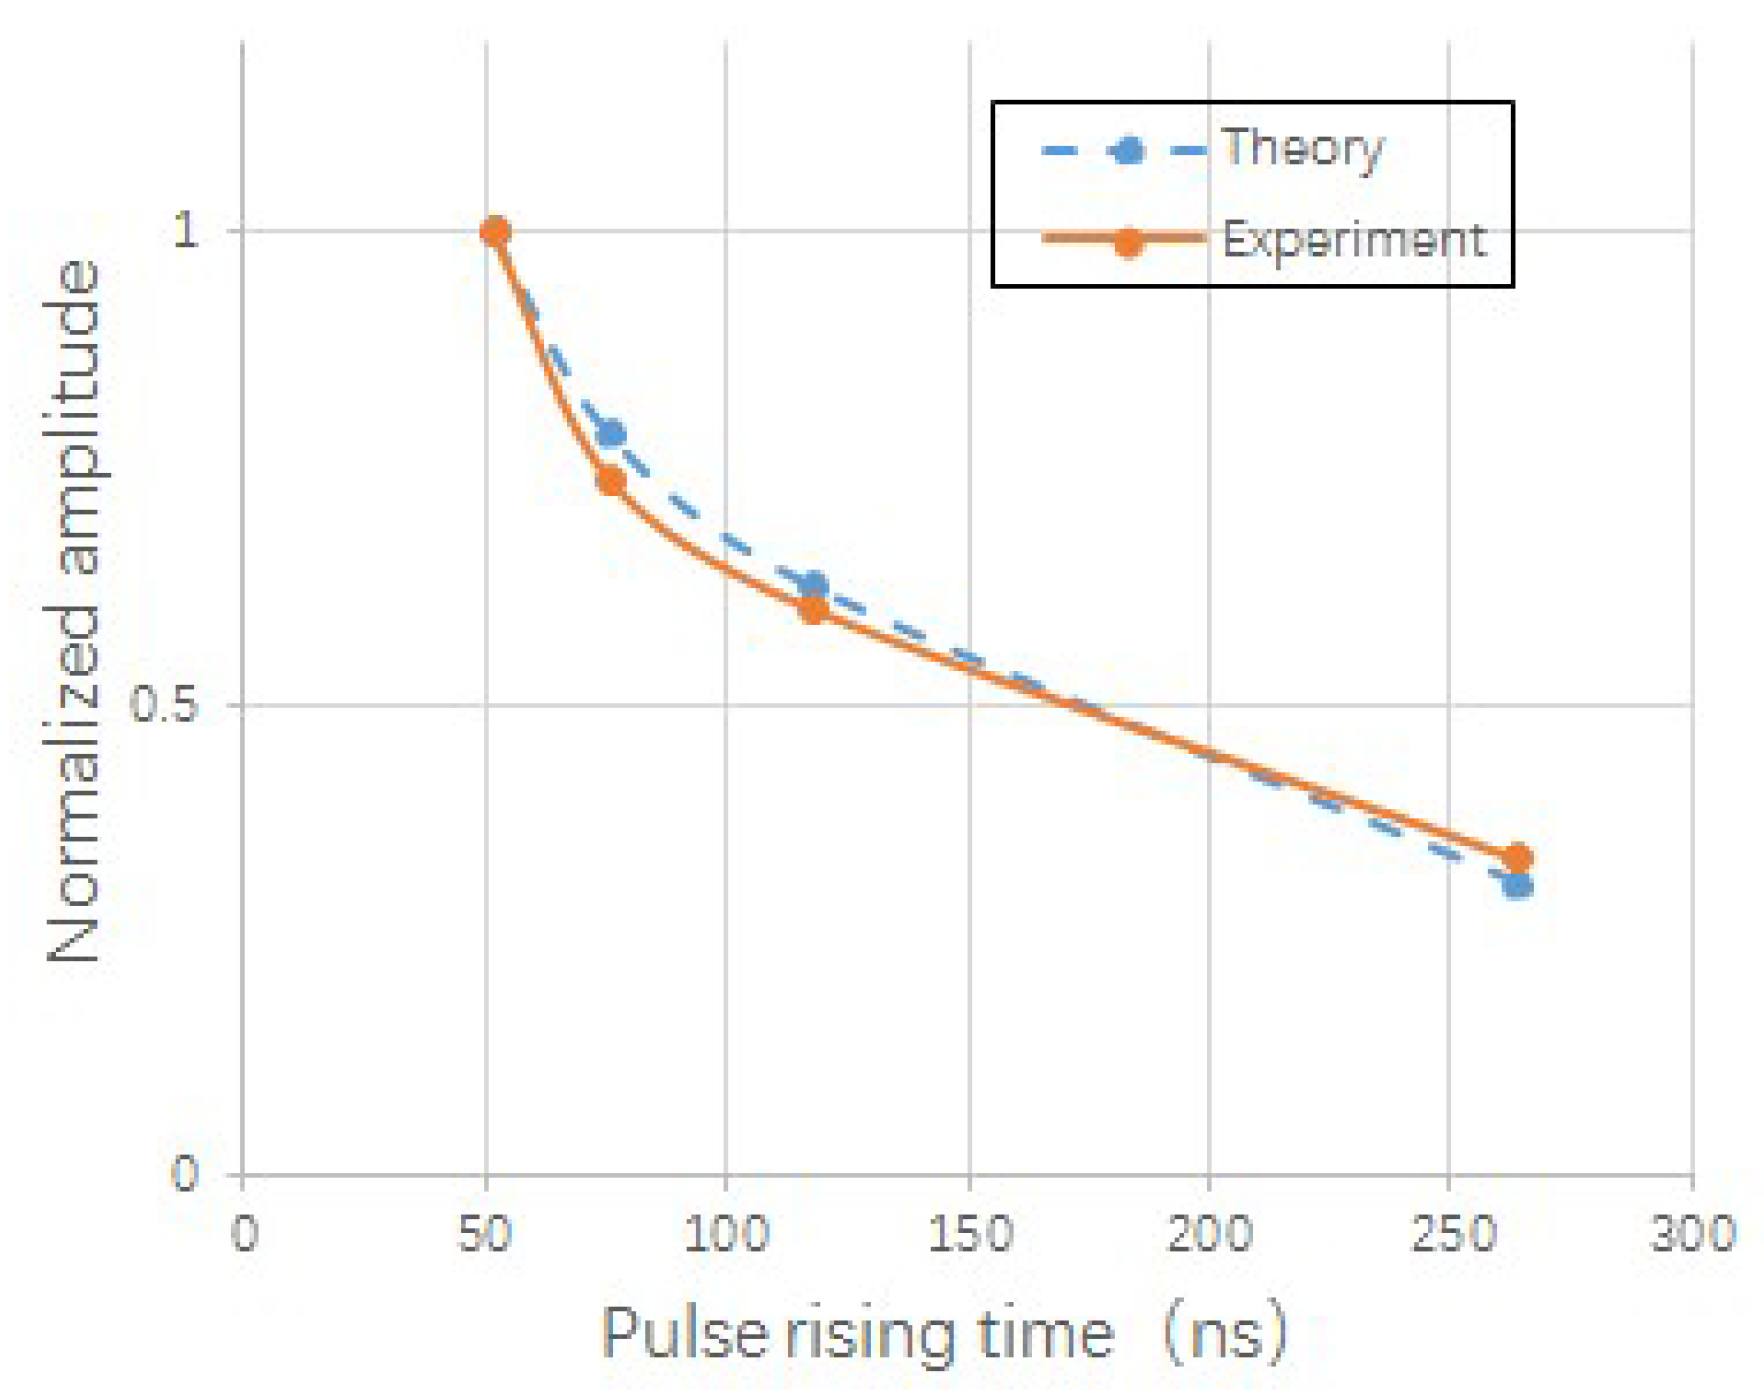
Figure 13 shows the relationship between the amplitude of EM radiation signal and the rising time of Trichel pulse. The tip radius of the needle used in the experiment is 94 μm. Trichel pulse current produced by negative corona discharge and its EM radiation characteristics were measured at ambient pressure of 0.1 MPa, 0.08 MPa, 0.06 MPa, and 0.04 MPa, respectively. We measured 20 sets of data at each ambient pressure, each of which was 10 μs long and contained about 20 Trichel pulses. The rising time of Trichel pulse measured at ambient pressure of 0.1 MPa, 0.08 MPa, 0.06 MPa, and 0.04 MPa was 52 ns, 78 ns, 118 ns and 264 ns, respectively. The power of the measured EM radiation signals is 8.824 mV, 6.504 mV, 4.936 mV, and 2.97 mV, respectively. After normalizing the amplitude of EM radiation signals, the yellow curve in Figure 13 is obtained. The Trichel pulse currents that were measured at different ambient pressures are taken into Equation (1) to calculate the electric field at a distance of 3 m from the discharge point. According to the parameters of the antenna, the calculated electric field is filtered from 20 MHz to 1000 MHz. Normalizing the filtered electric field can obtain the normalized theoretical EM radiation signal amplitude, as shown in Figure 13.
Figure 14 shows the relationship between the amplitude of the EM radiation signal and the amplitude of the Trichel pulse current. We measured the Trichel pulse current and its radiation characteristics of needles with a tip radius of 62 μm, 94 μm, 120 μm, 165 μm, and 210 μm. We measured 20 sets of data at each tip radius, each of which was 10 μs long and contained about 20 Trichel pulses. The measured amplitudes of the Trichel pulses are 180 μA, 250 μA, 290 μA, 410 μA, and 550 μA, respectively. The amplitude of the EM radiation signal is 7.83 mV, 8.824 mV, 10.965 mV, 14.216 mV, and 19.016 mV. After normalizing the amplitude of EM radiation signals, the yellow curve in Figure 14 is obtained. Bring the Trichel pulse current generated by needles with different tip radius into Equation (1) to calculate the electric field at a distance of 3 m from the discharge point. The calculated electric field is filtered and normalized to obtain the blue curve in Figure 14.
The band of the antenna used in the experimental test is 20~1000 MHz. When the antenna was placed at a distance of 3 m from the discharge device, the received radiation signal shows far-field characteristics. The discharge EM radiation signal was dominated by . If the becomes smaller, then the amplitude of the EM radiation signal will be smaller. As the air pressure decreases, the rising time of the Trichel pulse becomes larger, and other parameters of the Trichel pulse remain unchanged. As shown in Figure 13, when the rising time of the pulse increases from 52 ns to 264 ns, the amplitude of the theoretically calculated EM radiation signal decreases by 69%, and the amplitude of the experimentally tested EM radiation signal decreases by about 66%. The theoretical and experimental results were basically consistent. When the tip radius of the cathode increases, the amplitude of the Trichel pulse increases, and other parameters of the Trichel pulse remain unchanged. When the amplitude of the Trichel pulse increases from 180 μA to 550 μA, the increases, the intensity of the EM radiation signal increases, as shown in Figure 14. The theoretically calculated amplitude of the radiation signal increases approximately linearly, and the measured value is consistent with the theoretical value.
4.3. Effects of Multi-Needle Discharge Structure on EM Radiation Characteristics of Negative Corona Discharge
The ionization during negative corona discharge generates a large number of electrons and positive ions in the ionization region. Since the charge-to-mass ratio of electrons is much smaller than that of ions, which move slowly in the electric field and form positive ion clouds in the ionization region. The electrons leave the ionization region during the movement to the anode and combine with the neutral particles to form negative ions, form a negative ion cloud outside the ionization region. The space charge of the positive ion cloud and the negative ion cloud will generate a spatial electric field, which has an effect on the original electric field [32]. In the multi-needle discharge structure, the ion cloud formed by the discharge needle in the pulse phase will affect the electric field around the nearby discharge needle, thereby affecting the Trichel pulse process. As shown in Figure 15, when a discharge needle is subjected to a pulse process, the positive ion cloud formed by it has little effects on the electric field in the ionization direction of the other discharge needle, and the negative ion cloud has a significant weakening effect on the electric field in the ionization direction of the other discharge needle. Therefore, in the case of a small applied voltage, the previous discharge needle pulse process has an inhibitory effect on the other [22]. As the applied voltage increases, the effect of the negative ion cloud is reduced, and the pulse processes of the two discharge needles occur simultaneously.
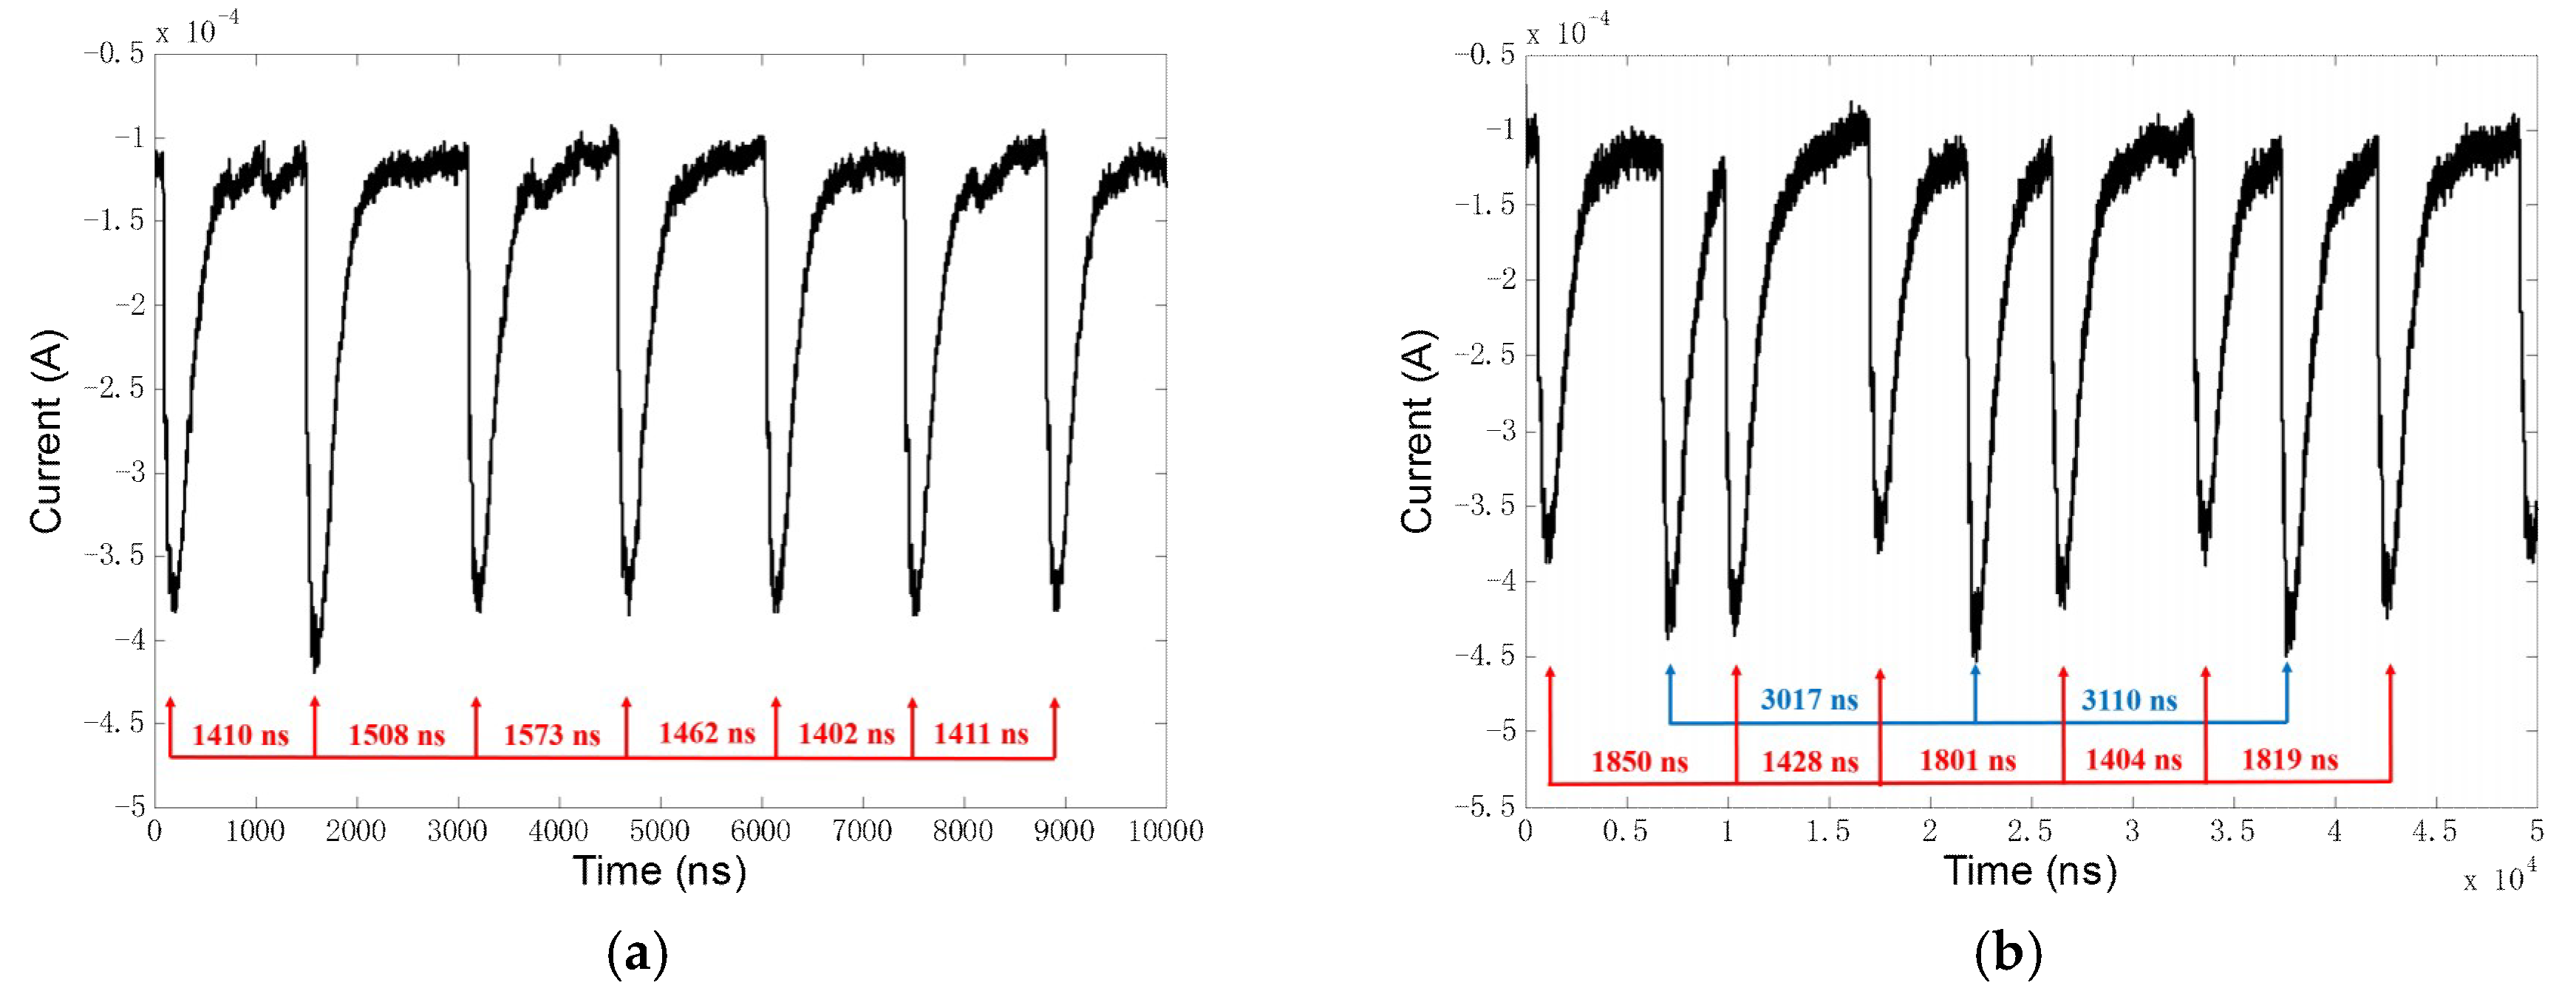
In order to prove that the Trichel pulse discharge process of one discharge needle in the multi-needle discharge structure will inhibit that of the other discharge needle, we measured the PRPD of the single-needle and double-needle discharge structure under the same applied voltage, as shown in Figure 16. The tip radius of the discharge needle selected for measurement is 158 μm and 165 μm, respectively. Firstly, a single needle discharge experiment was performed using the needle with a tip radius of 158 μm and a Trichel pulse sequence with a discharge voltage of 8.6 kV was obtained, as shown in Figure 16a. The Trichel pulse interval of the single-needle discharge structure is between 1400 ns and 1600 ns when the applied voltage is 8.6 kV. The experiment was then carried out using a two-needle discharge structure consisting of two discharge needles with tip radius of 158 μm and 165 μm. The Trichel pulse sequence of the double-needles discharge structure at an applied voltage of 8.6 kV is shown in Figure 16b. The Trichel pulse indicated by the blue arrow is generated by the discharge needle with a tip radius of 165 μm with interval is of approximately 3000 ns. The Trichel pulses indicated by the red arrow in the figure are generated by the discharge needle with a tip radius of 158 μm. The time intervals of these Trichel pulses vary greatly. When there is another Trichel pulse generated by another discharge needle between the two Trichel pulses, the interval between the two pulses can reach 1800 ns; otherwise, it is about 1400 ns. Such measurement results can explain that when a discharge needle is subjected to a pulse process, the pulse process of the other needle will be suppressed. The interval of the Trichel pulse will increase. The EM radiation signal corresponds to the pulse current signal of negative corona discharge. When the pulse current signal is superimposed, the EM radiation signal will also be superimposed.
5. Conclusions
In this paper, the pulse current characteristics of multi-needle negative corona discharge and its EM radiation characteristics are studied.
Based on the study of EM radiation characteristics of single-needle negative corona discharge by Zhang Y. [21], we studied the pulse current and its EM radiation characteristics of multi-needle negative corona. Different from Abdel-Salam’s [8,22] research on the volt-ampere characteristics of multi-needle negative corona discharge, we analyzed the pulse current characteristics of the negative corona discharge and studied the corresponding relationship between EM radiation signal and pulse current. The effect of multi-needle discharge structure on the EM radiation characteristics of negative corona discharge is analyzed.
In the multi-needle discharge structure, the Trichel pulse discharge process of one discharge needle in the multi-needle discharge structure will inhibit the discharge of the other discharge needle. When the applied voltage is low, the negative corona discharge Trichel pulse processes of the respective discharge needles are mutually suppressed, and the discharge needle pulse processes occur separately. When the applied voltage increases to a certain threshold, the pulse processes of different discharge needles will occur simultaneously, the multi-needle discharge current will be linearly superimposed, and the generated EM radiation field will also be linearly superimposed. The frequency of the radiation signal after multi-needle simultaneous discharge superposition is the same as the frequency of the single-needle, but the amplitude is increased.
The negative corona discharge radiation process can be equivalent to the dipole antenna radiation model. The dipole length is the sum of the thickness of the ionization region and the plasma region. The radiation field in the near-field region is dominated by and the discharge radiation field in the far-field region is dominated by . The amplitude of the EM radiation signal is related to the tip radius of the cathode and the air pressure. The larger the tip radius is, the larger the amplitude of the pulse current and the intensity of the EM radiation signal will be. As to the air pressure, which gets lower, the rising time of the pulse will be longer, while the change of current as time, and the intensity of the radiation signal will be smaller. The spectral characteristics of the EM radiation of the multi-needle negative corona discharge are only related to the air pressure. The intensity of the EM radiation signal is related to the tip radius of the cathode, the air pressure, and the number of discharge needles.
The results of this work may provide promising method for evaluation of insulation condition of electric apparatus, as well as detection of the discharge sources.
Author Contributions
Conceptualization, C.W. and X.C.; Methodology, C.W., T.L. and J.O.; Software, C.W. and J.F.; Validation, C.W., J.O. and X.C.; formal analysis, C.W. and J.F.; Investigation, J.O.; Resources, C.W. and X.C.; Data curation, C.W. and X.C.; Writing—original draft preparation, C.W. and X.C.; Writing—review and editing, C.W. and T.L.; Visualization, C.W.; Supervision, X.C.; Project administration, X.C.; Funding acquisition, C.W., X.C. and J.O.
Funding
This work was financially supported by grants from National Natural Science Foundation of China (#U1630130, #51777010, #51707008, #51407009).
Conflicts of Interest
The authors declare no conflict of interest.
References
- Rycroft, M.J. Gas discharge physics. J. Atmos. Terr. Phys. 1993, 55, 1487. [Google Scholar] [CrossRef]
- Dau, V.T.; Dinh, T.; Tran, C.D.; Terebessy, T.; Bui, T.T. Dual-pin electrohydrodynamic generator driven by alternating current. Exp. Therm. Fluid Sci. 2018, 97, 290–295. [Google Scholar] [CrossRef]
- Dong, S.; Li, J.; Kim, M.H.; Cho, J.; Park, S.J.; Nguyen, T.H.; Eden, J.G. Deactivation of Legionella Pneumophila in municipal wastewater by ozone generated in arrays of microchannel plasmas. J. Phys. D Appl. Phys. 2018, 51, 255501. [Google Scholar] [CrossRef] [Green Version]
- Arif, S.; Branken, D.J.; Everson, R.C.; Neomagus, H.W.J.P.; le Grange, L.A.; Arif, A. CFD modeling of particle charging and collection in electrostatic precipitators. J. Electrost. 2016, 84, 10–22. [Google Scholar] [CrossRef]
- Jaworek, A.; Marchewicz, A.; Sobczyk, A.T.; Krupa, A.; Czech, T. Two-stage electrostatic precipitator with dual-corona particle precharger for PM2.5 particles removal. J. Clean. Prod. 2017, 164, 1645–1664. [Google Scholar] [CrossRef]
- Terrab, H.; Kara, A. Parameters design optimization of 230 kV corona ring based on electric field analysis and response surface methodology. Electr. Power Syst. Res. 2018, 163, 782–788. [Google Scholar] [CrossRef]
- Tanner, R.L.; Nanevicz, J.E. An Analysis of Corona-Generated Interference in Aircraft. Proc. IEEE 1964, 52, 44–52. [Google Scholar] [CrossRef]
- Abdel-Salam, M.; Hashem, A.; Sidique, E. Characteristics of negative corona discharge in single-needle- and multi-needle-to-plane configurations. Int. J. Plasma Environ. Sci. Technol. 2013, 7, 121–135. [Google Scholar]
- Thanh, L.C. Negative Corona in a Multiple Interacting Point-to-Plane Gap in Air. IEEE Trans. Ind. Appl. 1985, IA-21, 518–522. [Google Scholar] [CrossRef]
- Jaworek, A.; Krupa, A. Electrical characteristics of a corona discharge reactor of multipoint-to-plane geometry. Czechoslov. J. Phys. 1995, 45, 1035–1047. [Google Scholar] [CrossRef]
- Trichel, G.W. The mechanism of the negative point to plane corona near onset. Phys. Rev. 1938, 54, 1078–1084. [Google Scholar] [CrossRef]
- Fernando, S.C. Electromagnetic Radiation due to Partial Discharge and Fault Detection Method for Overhead Distribution Lines. Ph.D. Thesis, RMIT University, Melbourne, Australia, 2012; pp. 1–118. [Google Scholar]
- Zhang, L.; Han, X.; Li, J. Partial discharge detection and analysis of needle-plane defect in SF6 under negative oscillating lightning impulse voltage based on UHF method. IEEE Trans. Dielectr. Electr. Insul. 2017, 24, 296–303. [Google Scholar] [CrossRef]
- Reid, A.J.; Judd, M.D.; Stewart, B.G.; Fouracre, R.A. Frequency distribution of RF energy from PD sources and its application in combined RF and IEC60270 measurements. In Proceedings of the 2006 IEEE Conference on Electrical Insulation and Dielectric Phenomena, Kansas City, MO, USA, 15–18 October 2006; pp. 640–643. [Google Scholar] [CrossRef]
- Mutakamihigashi, T.; Kuroishi, Y.; Ueno, H. Polarity effect and electromagnetic radiation of partial discharge accompanying growth of electrical tree. Electr. Eng. Jpn. 2015, 192, 19–26. [Google Scholar] [CrossRef]
- Nugraha, F.A.; Harid, N.; Barkat, B.; Al Sayari, N.; Jayaram, S.; Griffiths, H. Analysis of partial discharge in air using emitted electromagnetic waves and the HFCT method. In Proceedings of the 2016 IEEE Electrical Insulation Conference (EIC), Montreal, QC, Canada, 19–22 June 2016; pp. 551–554. [Google Scholar] [CrossRef]
- IEC-62478. High-Voltage Test Techniques—Measurement of Partial Discharges by Electromagnetic and Acoustic Methods. Proposed Horizontal Standard, 1st ed.; International Electrotechnical Commission (IEC): Geneva, Switzerland, 2016; submitted. [Google Scholar]
- Tungkanawanich, A.; Kawasaki, Z.I.; Abe, J.; Matsuura, K. Location of partial discharge source on distribution line by measuring emitted pulse-train electromagnetic waves. In Proceedings of the 2000 IEEE Power Engineering Society Winter Meeting, Conference Proceedings (Cat. No. 00CH37077), Singapore, 23–27 January 2000; Volume 4, pp. 2453–2458. [Google Scholar] [CrossRef]
- Tsutsumi, Y.; Ono, K.; Fujii, K.; Higaki, M. Electromagnetic noise spectra of corona discharge at point-to-plane electrodes in air. IEEJ Trans. Fundam. Mater. 2008, 111, 733–740. [Google Scholar] [CrossRef]
- He, W.; Chen, X.; Wan, B.; Lan, L.; Fu, W.; Guo, H.; Wen, X. Characteristics of Alternating Current Corona Discharge Pulses and Its Radio Interference Level in a Coaxial Wire-Cylinder Gap. IEEE Trans. Plasma Sci. 2018, 46, 598–605. [Google Scholar] [CrossRef]
- Zhang, Y.; Liu, L.; Miao, J.S.; Peng, Z.L.; Ouyang, J.T. Trichel pulse in negative DC corona discharge and its electromagnetic radiations. J. Electr. Eng. Technol. 2015, 10, 1174–1180. [Google Scholar] [CrossRef]
- Lama, W.L.; Gallo, C.F. Interaction of the “trichel” current pulses of a pair of negative coronas. J. Phys. D. Appl. Phys. 1973, 6, 1963–1972. [Google Scholar] [CrossRef]
- Ricardo Albarracín, S. Medida de Descargas Parciales en Radiofrecuencia. Ph.D. Thesis, Departamento de Ingeniería Eléctrica, Universidad Carlos III de Madrid, Getafe, Spain, 2014. [Google Scholar]
- IEC-60270. High-Voltage Test Techniques—Partial Discharge Measurements, 3rd ed.; International Electrotechnical Commission (IEC): New Delhi, India, 2000. [Google Scholar]
- Loeb, L.B.; Kip, A.F.; Hudson, G.G.; Bennett, W.H. Pulses in negative point-to-plane corona. Phys. Rev. 1941, 60, 714–722. [Google Scholar] [CrossRef]
- Lama, W.L.; Gallo, C.F. Systematic study of the electrical characteristics of the “trichel” current pulses from negative needle-to-plane coronas. J. Appl. Phys. 1974, 45, 103–113. [Google Scholar] [CrossRef]
- Dordizadeh, P.; Adamiak, K.; Castle, G.P. Experimental study of the characteristics of Trichel pulses in the needle-plane negative corona discharge in atmospheric air. J. Electrostat. 2017, 88, 49–54. [Google Scholar] [CrossRef]
- Chen, J.; Davidson, J.H. Model of the Negative DC Corona Plasma: Comparison to the Positive DC Corona Plasma. Plasma Chem. Plasma Process. 2003, 23, 83–102. [Google Scholar] [CrossRef]
- Nath, D.; Kumar, U. Total electric field due to an isolated electron avalanche. IEEE Trans. Dielectr. Electr. Insul. 2016, 23, 2562–2571. [Google Scholar] [CrossRef]
- Cooray, V.; Cooray, G. Electromagnetic radiation field of an electron avalanche. Atmos. Res. 2012, 117, 18–27. [Google Scholar] [CrossRef]
- Wilson, P.F.; Ma, M.T. Fields Radiated by Electrostatic Discharges. IEEE Trans. Electromagn. Compat. 1991, 33, 10–18. [Google Scholar] [CrossRef]
- Colver, G.M.; El-Khabiry, S. Modeling of DC corona discharge along an electrically conductive flat plate with gas flow. IEEE Trans. Ind. Appl. 1999, 35, 387–394. [Google Scholar] [CrossRef]
Figure 1.
Experimental set-up: (a) Schematic of the experimental set-up; (b) Corona discharge object; (c) Vacuum box; and, (d) Photograph of the experimental set-up and background electromagnetic (EM) noise of microwave anechoic chamber.
Figure 1.
Experimental set-up: (a) Schematic of the experimental set-up; (b) Corona discharge object; (c) Vacuum box; and, (d) Photograph of the experimental set-up and background electromagnetic (EM) noise of microwave anechoic chamber.

Figure 2.
Trichel pulse current and its EM radiation signal.

Figure 3.
The spectrum of negative corona discharge EM radiation signal.

Figure 4.
The relationship between Trichel pulse repetition frequency and applied voltage.
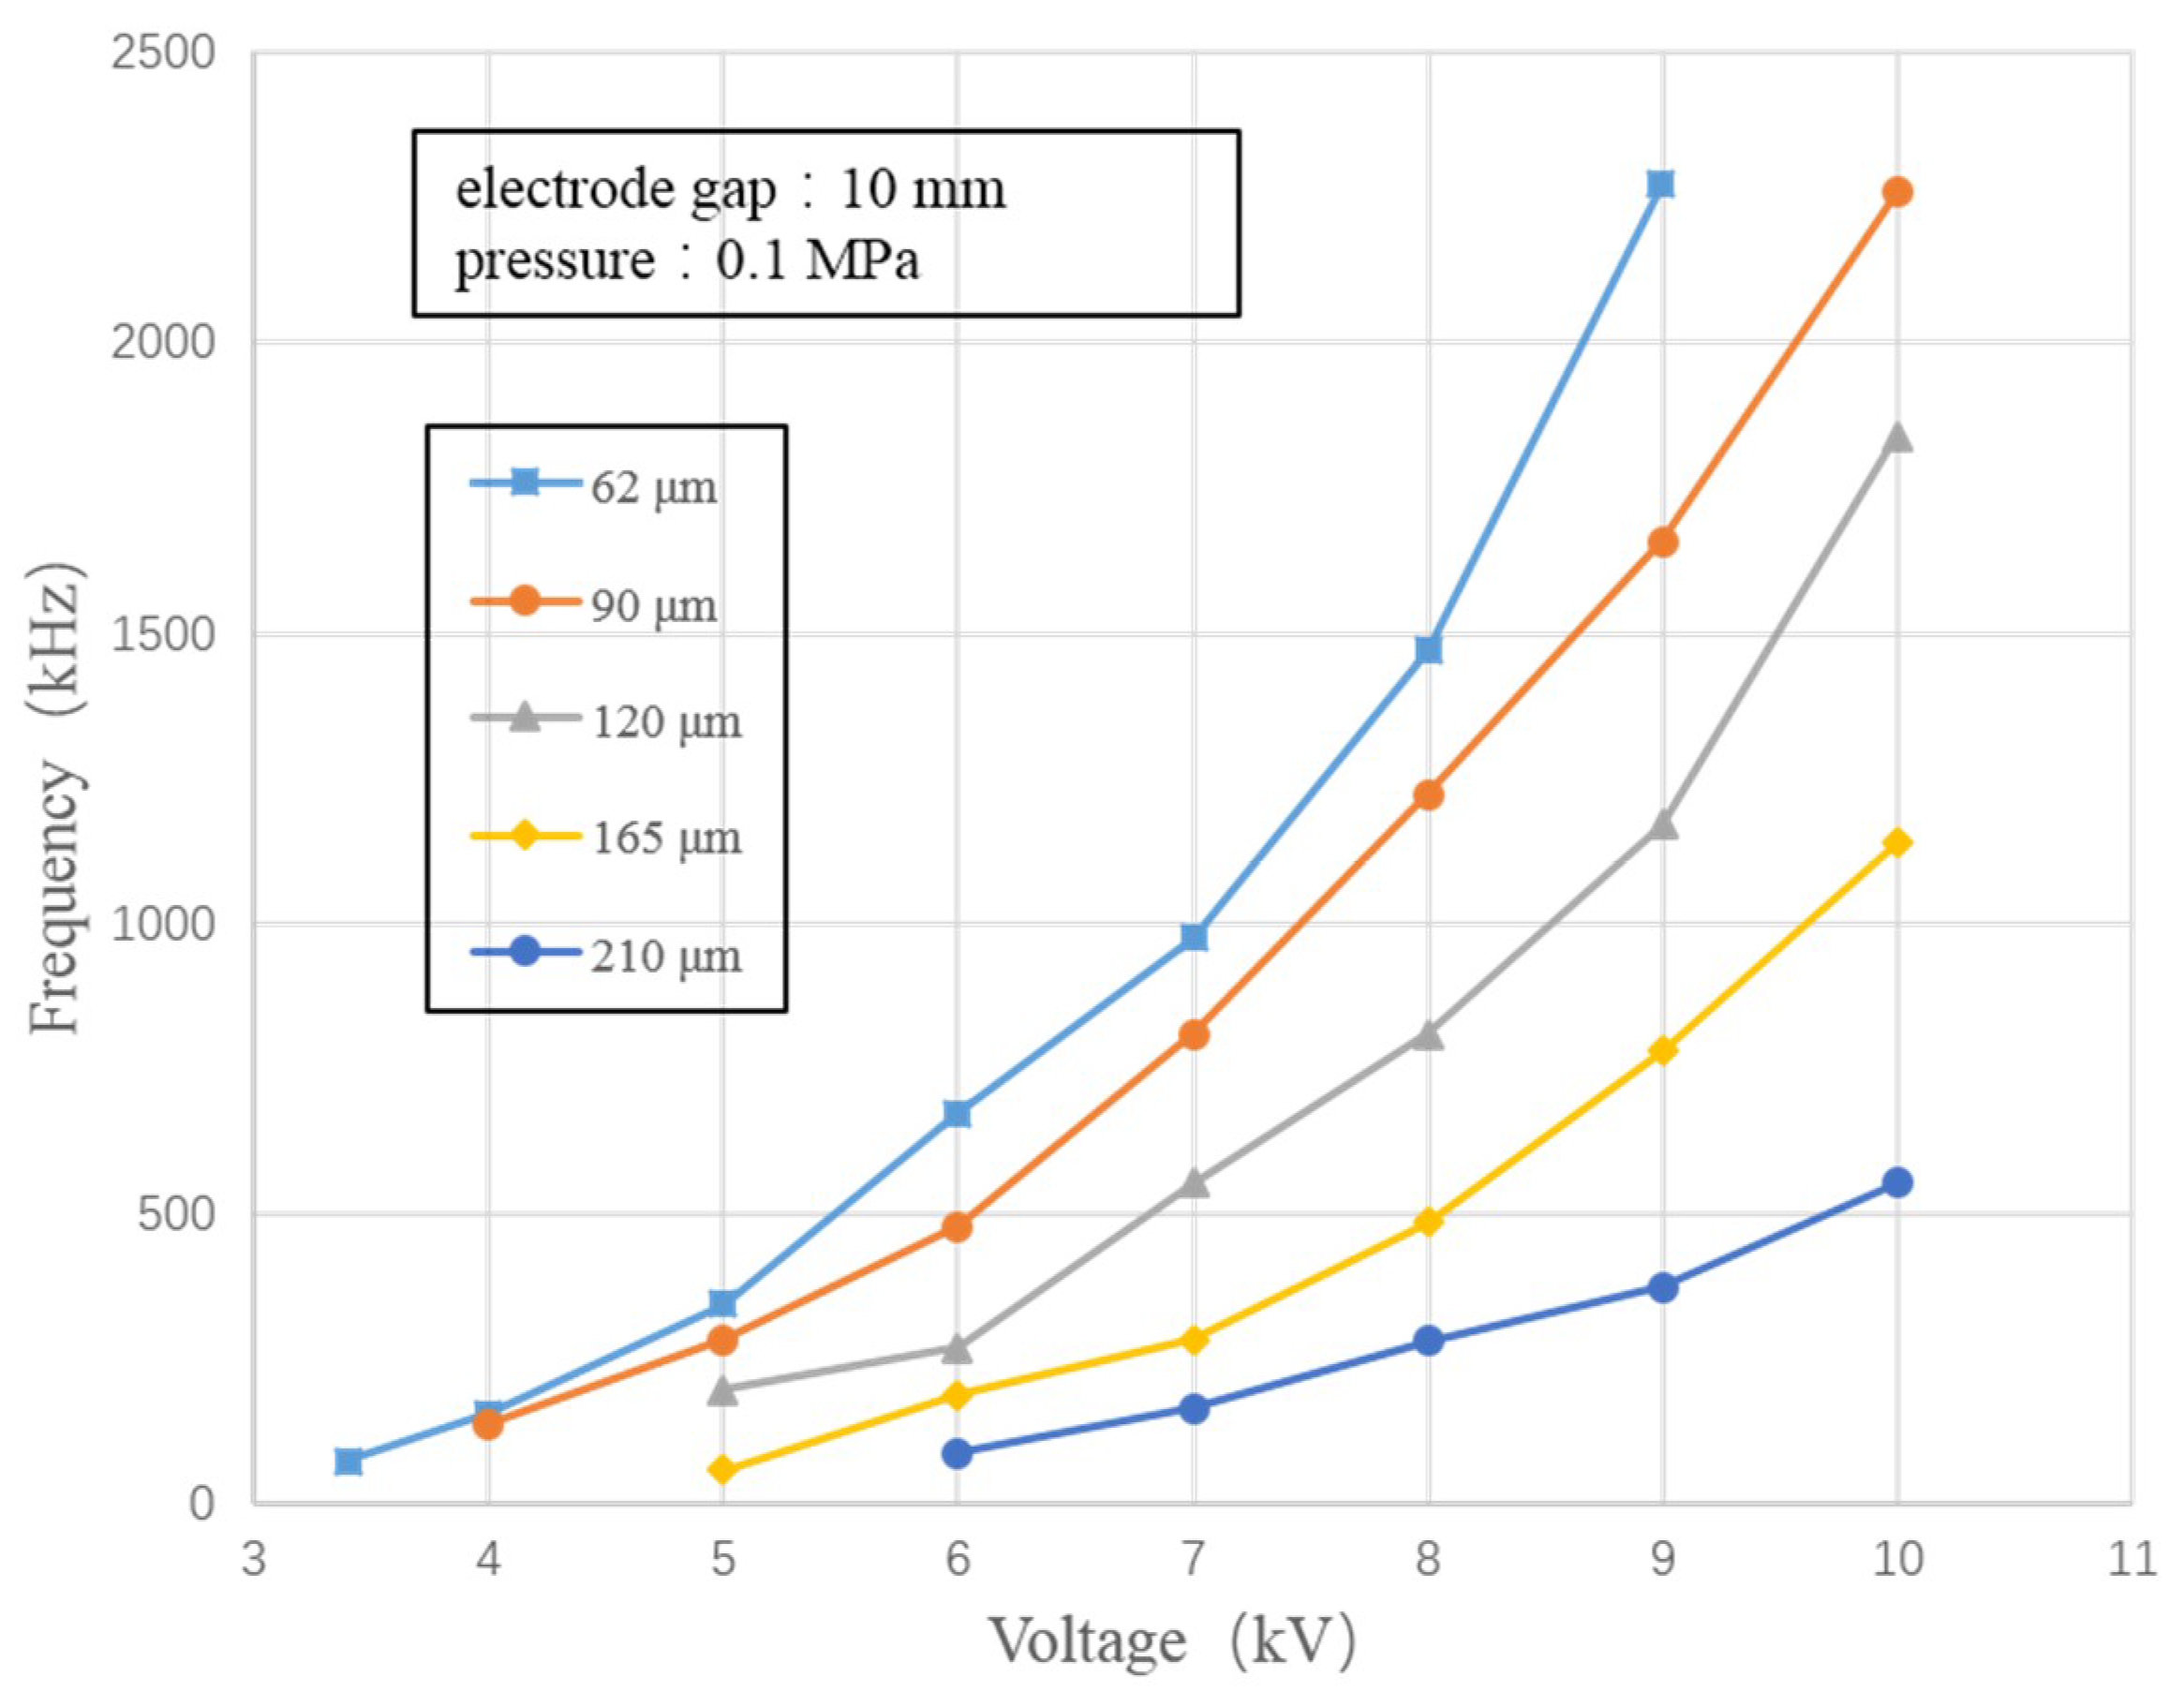
Figure 5.
Frequency spectrum of discharge radiation signal at different pulse repetition frequencies.
Figure 5.
Frequency spectrum of discharge radiation signal at different pulse repetition frequencies.
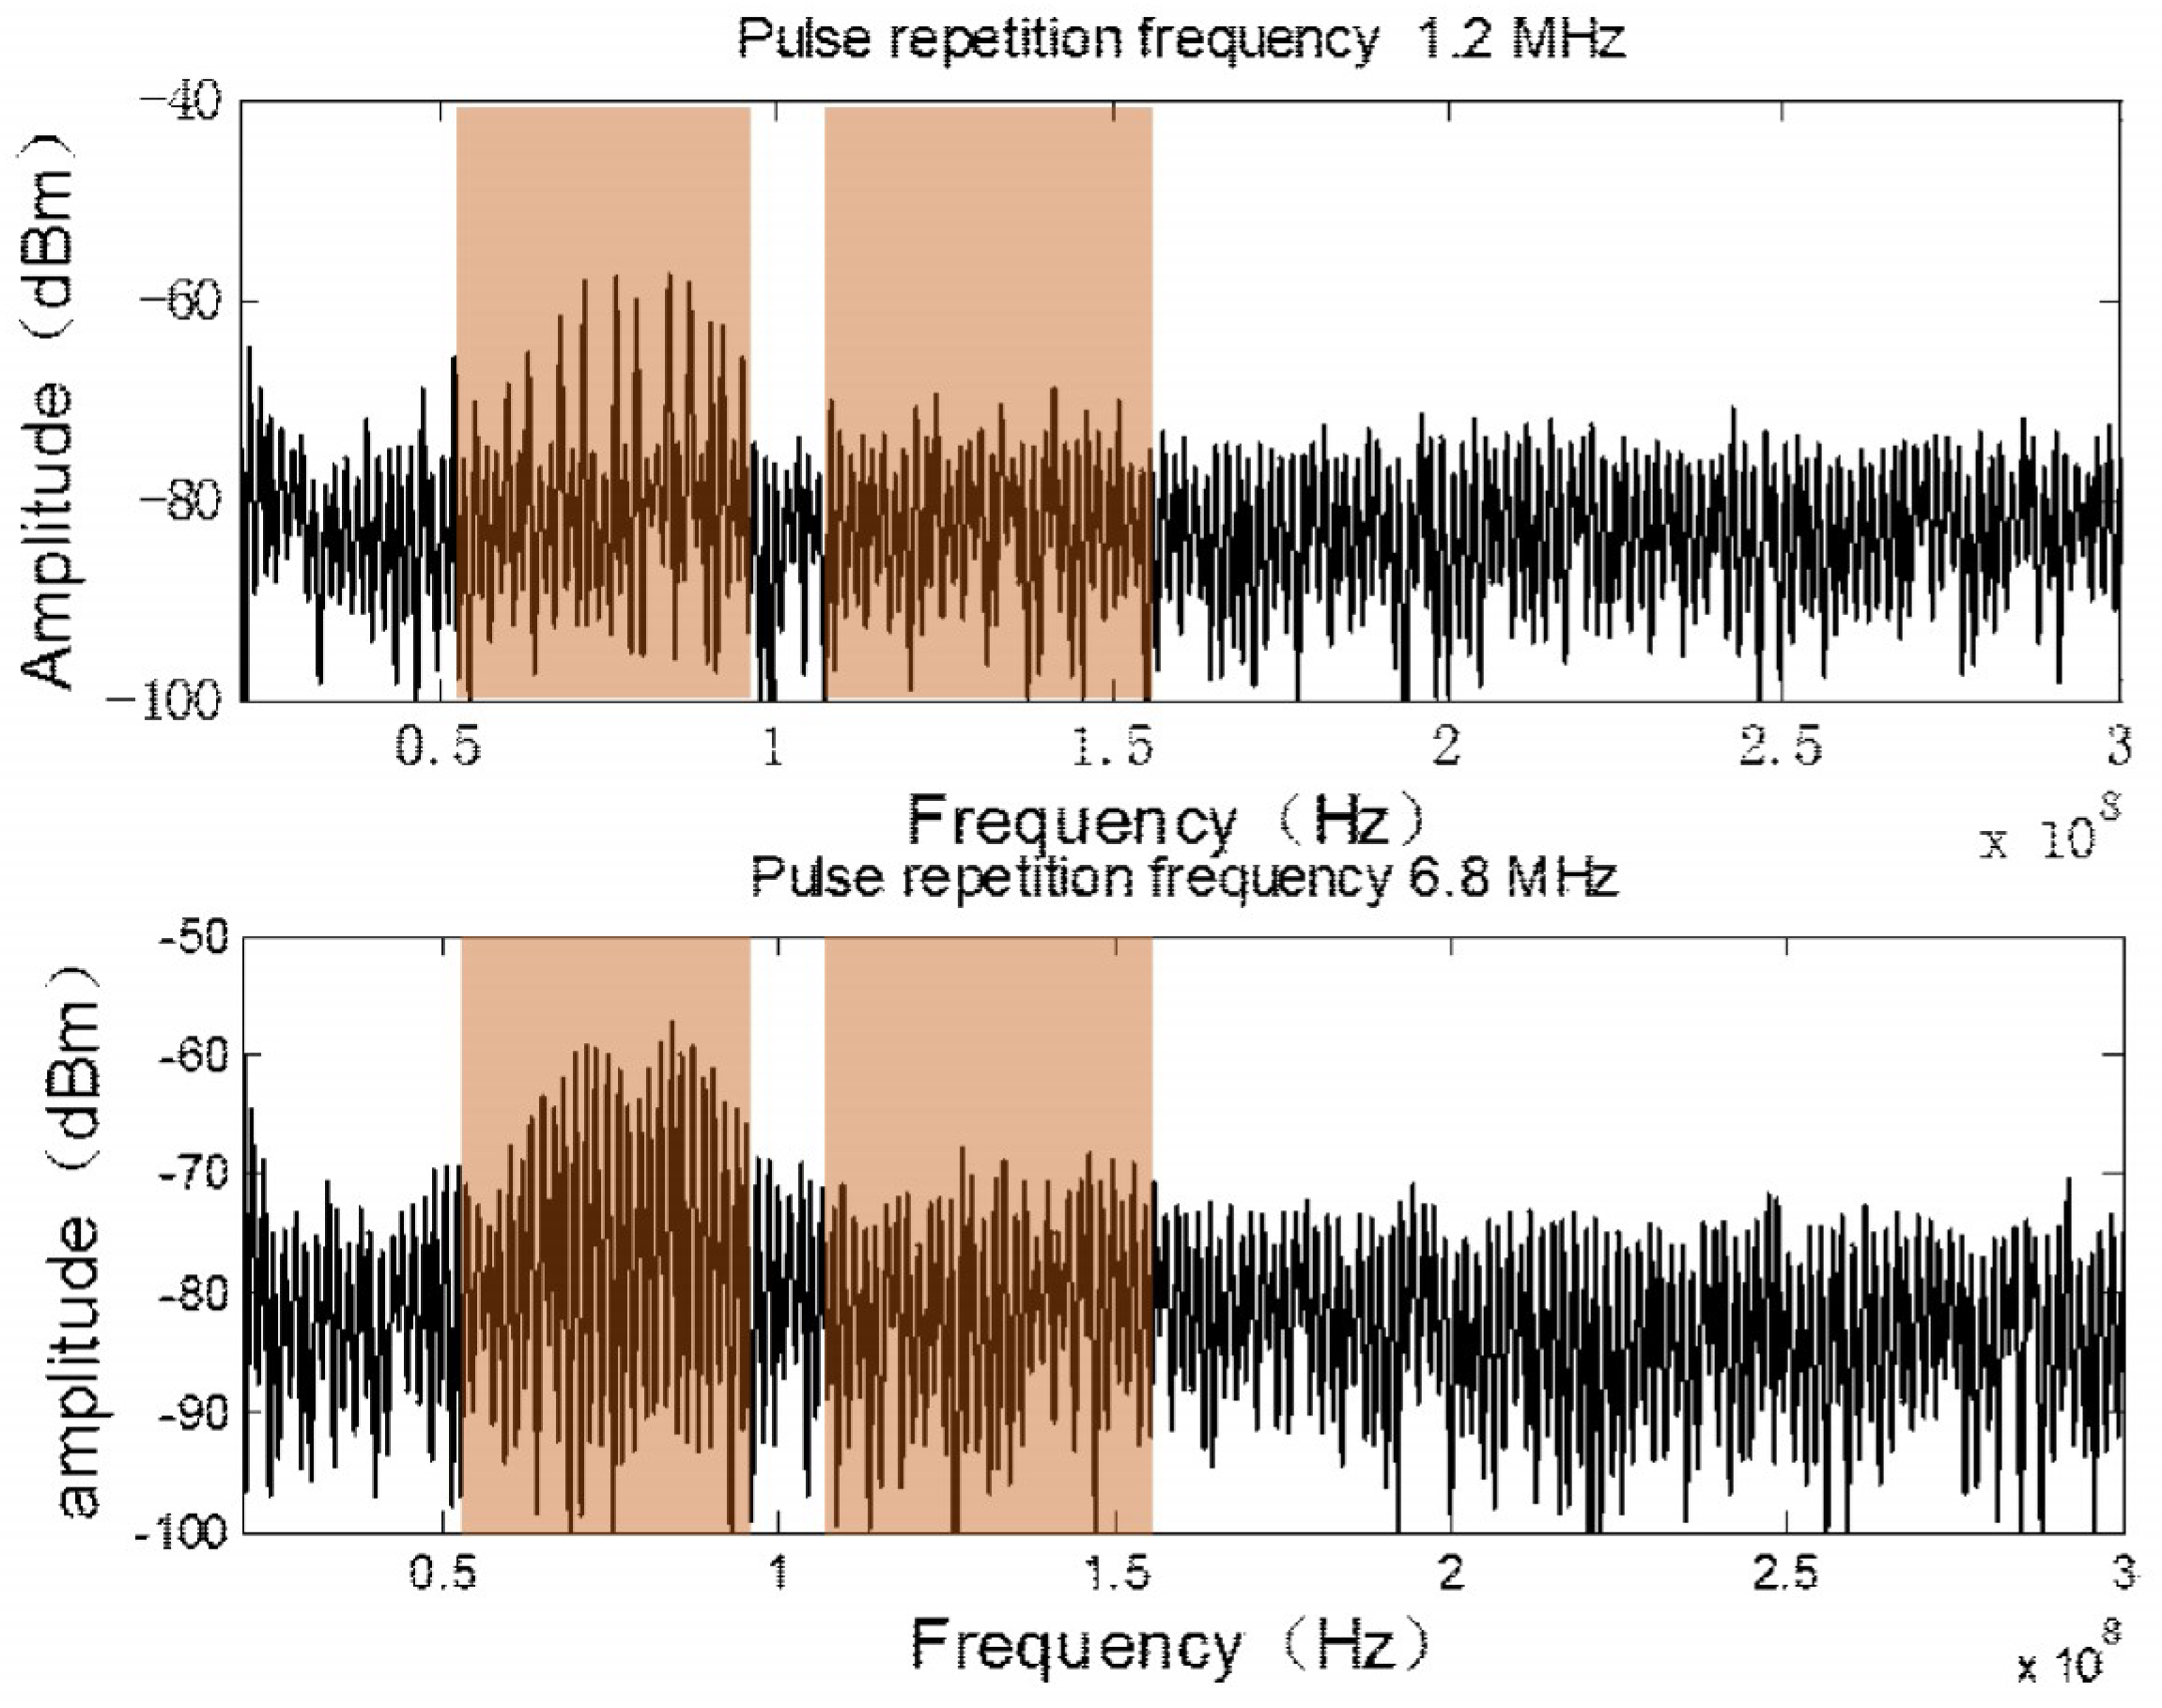
Figure 6.
Negative corona discharge current waveform under double-needle discharge structure: (a) Applied voltage of 7.4 kV; (b) Applied voltage of 8.7 kV.
Figure 6.
Negative corona discharge current waveform under double-needle discharge structure: (a) Applied voltage of 7.4 kV; (b) Applied voltage of 8.7 kV.

Figure 7.
Trichel pulse current and radiation signal of the double-needle discharge structure.
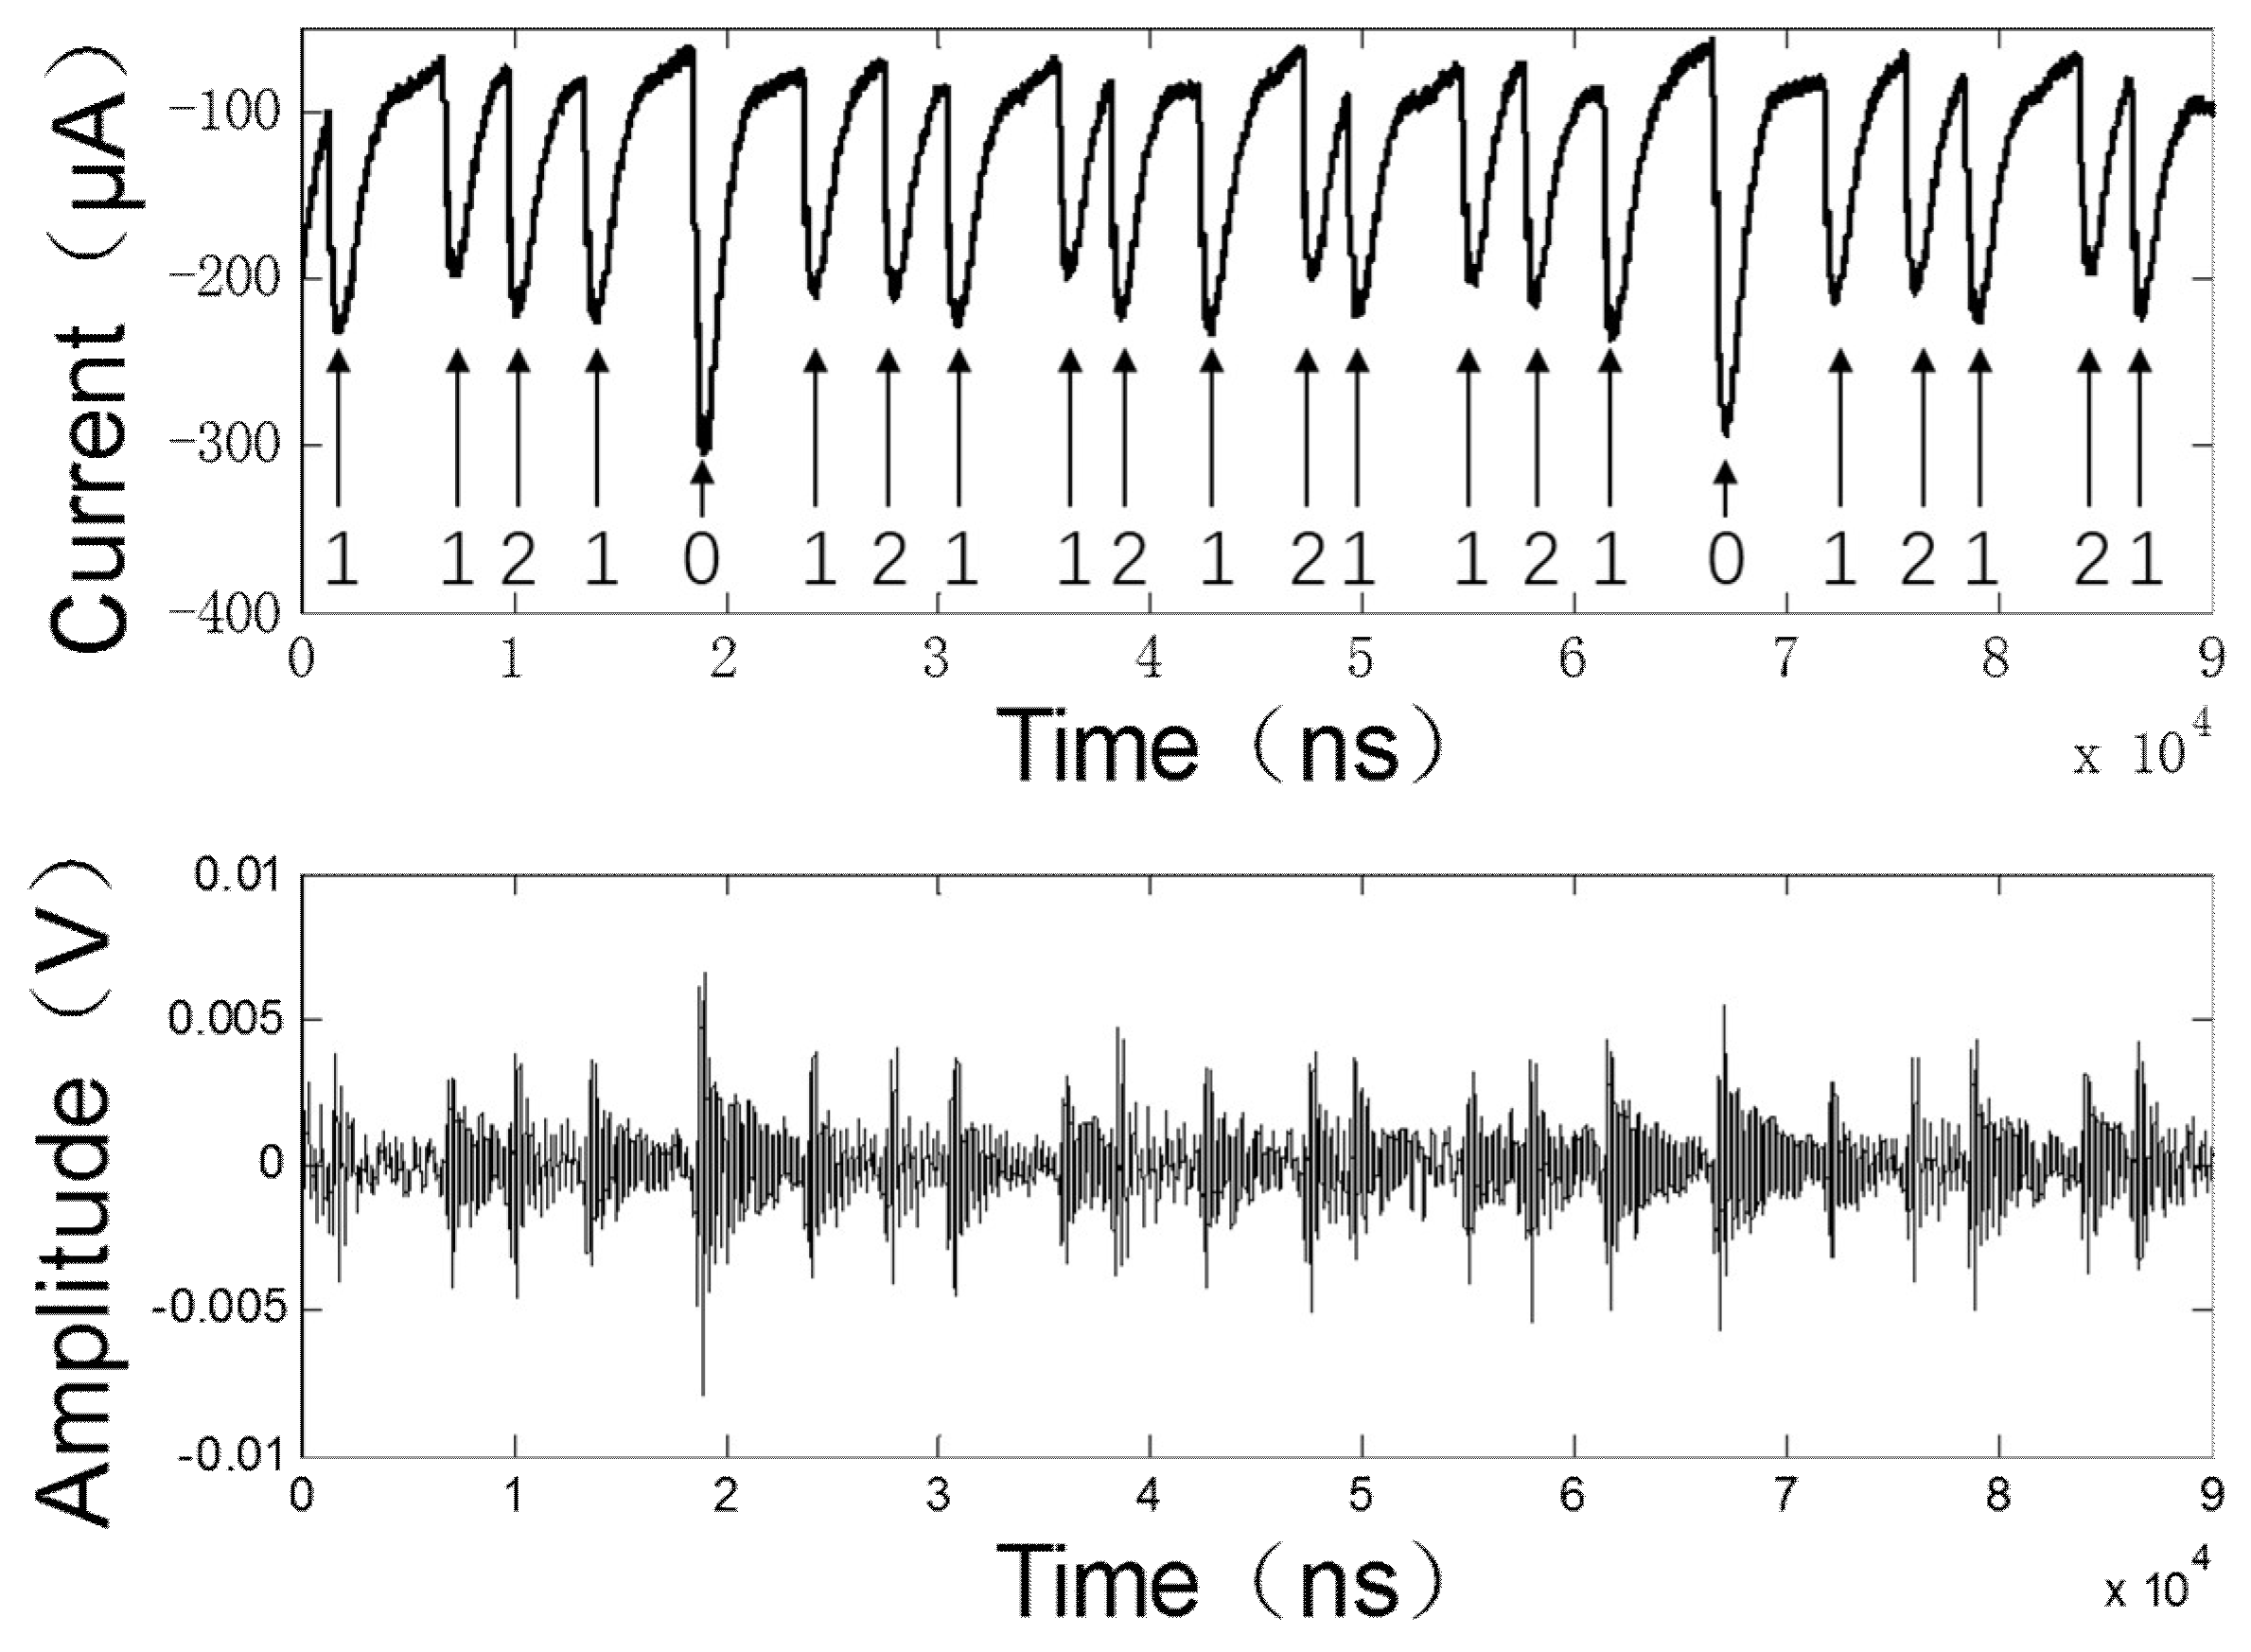
Figure 8.
Frequency spectrum of discharge radiation signal of the double-needle discharge structure.
Figure 8.
Frequency spectrum of discharge radiation signal of the double-needle discharge structure.
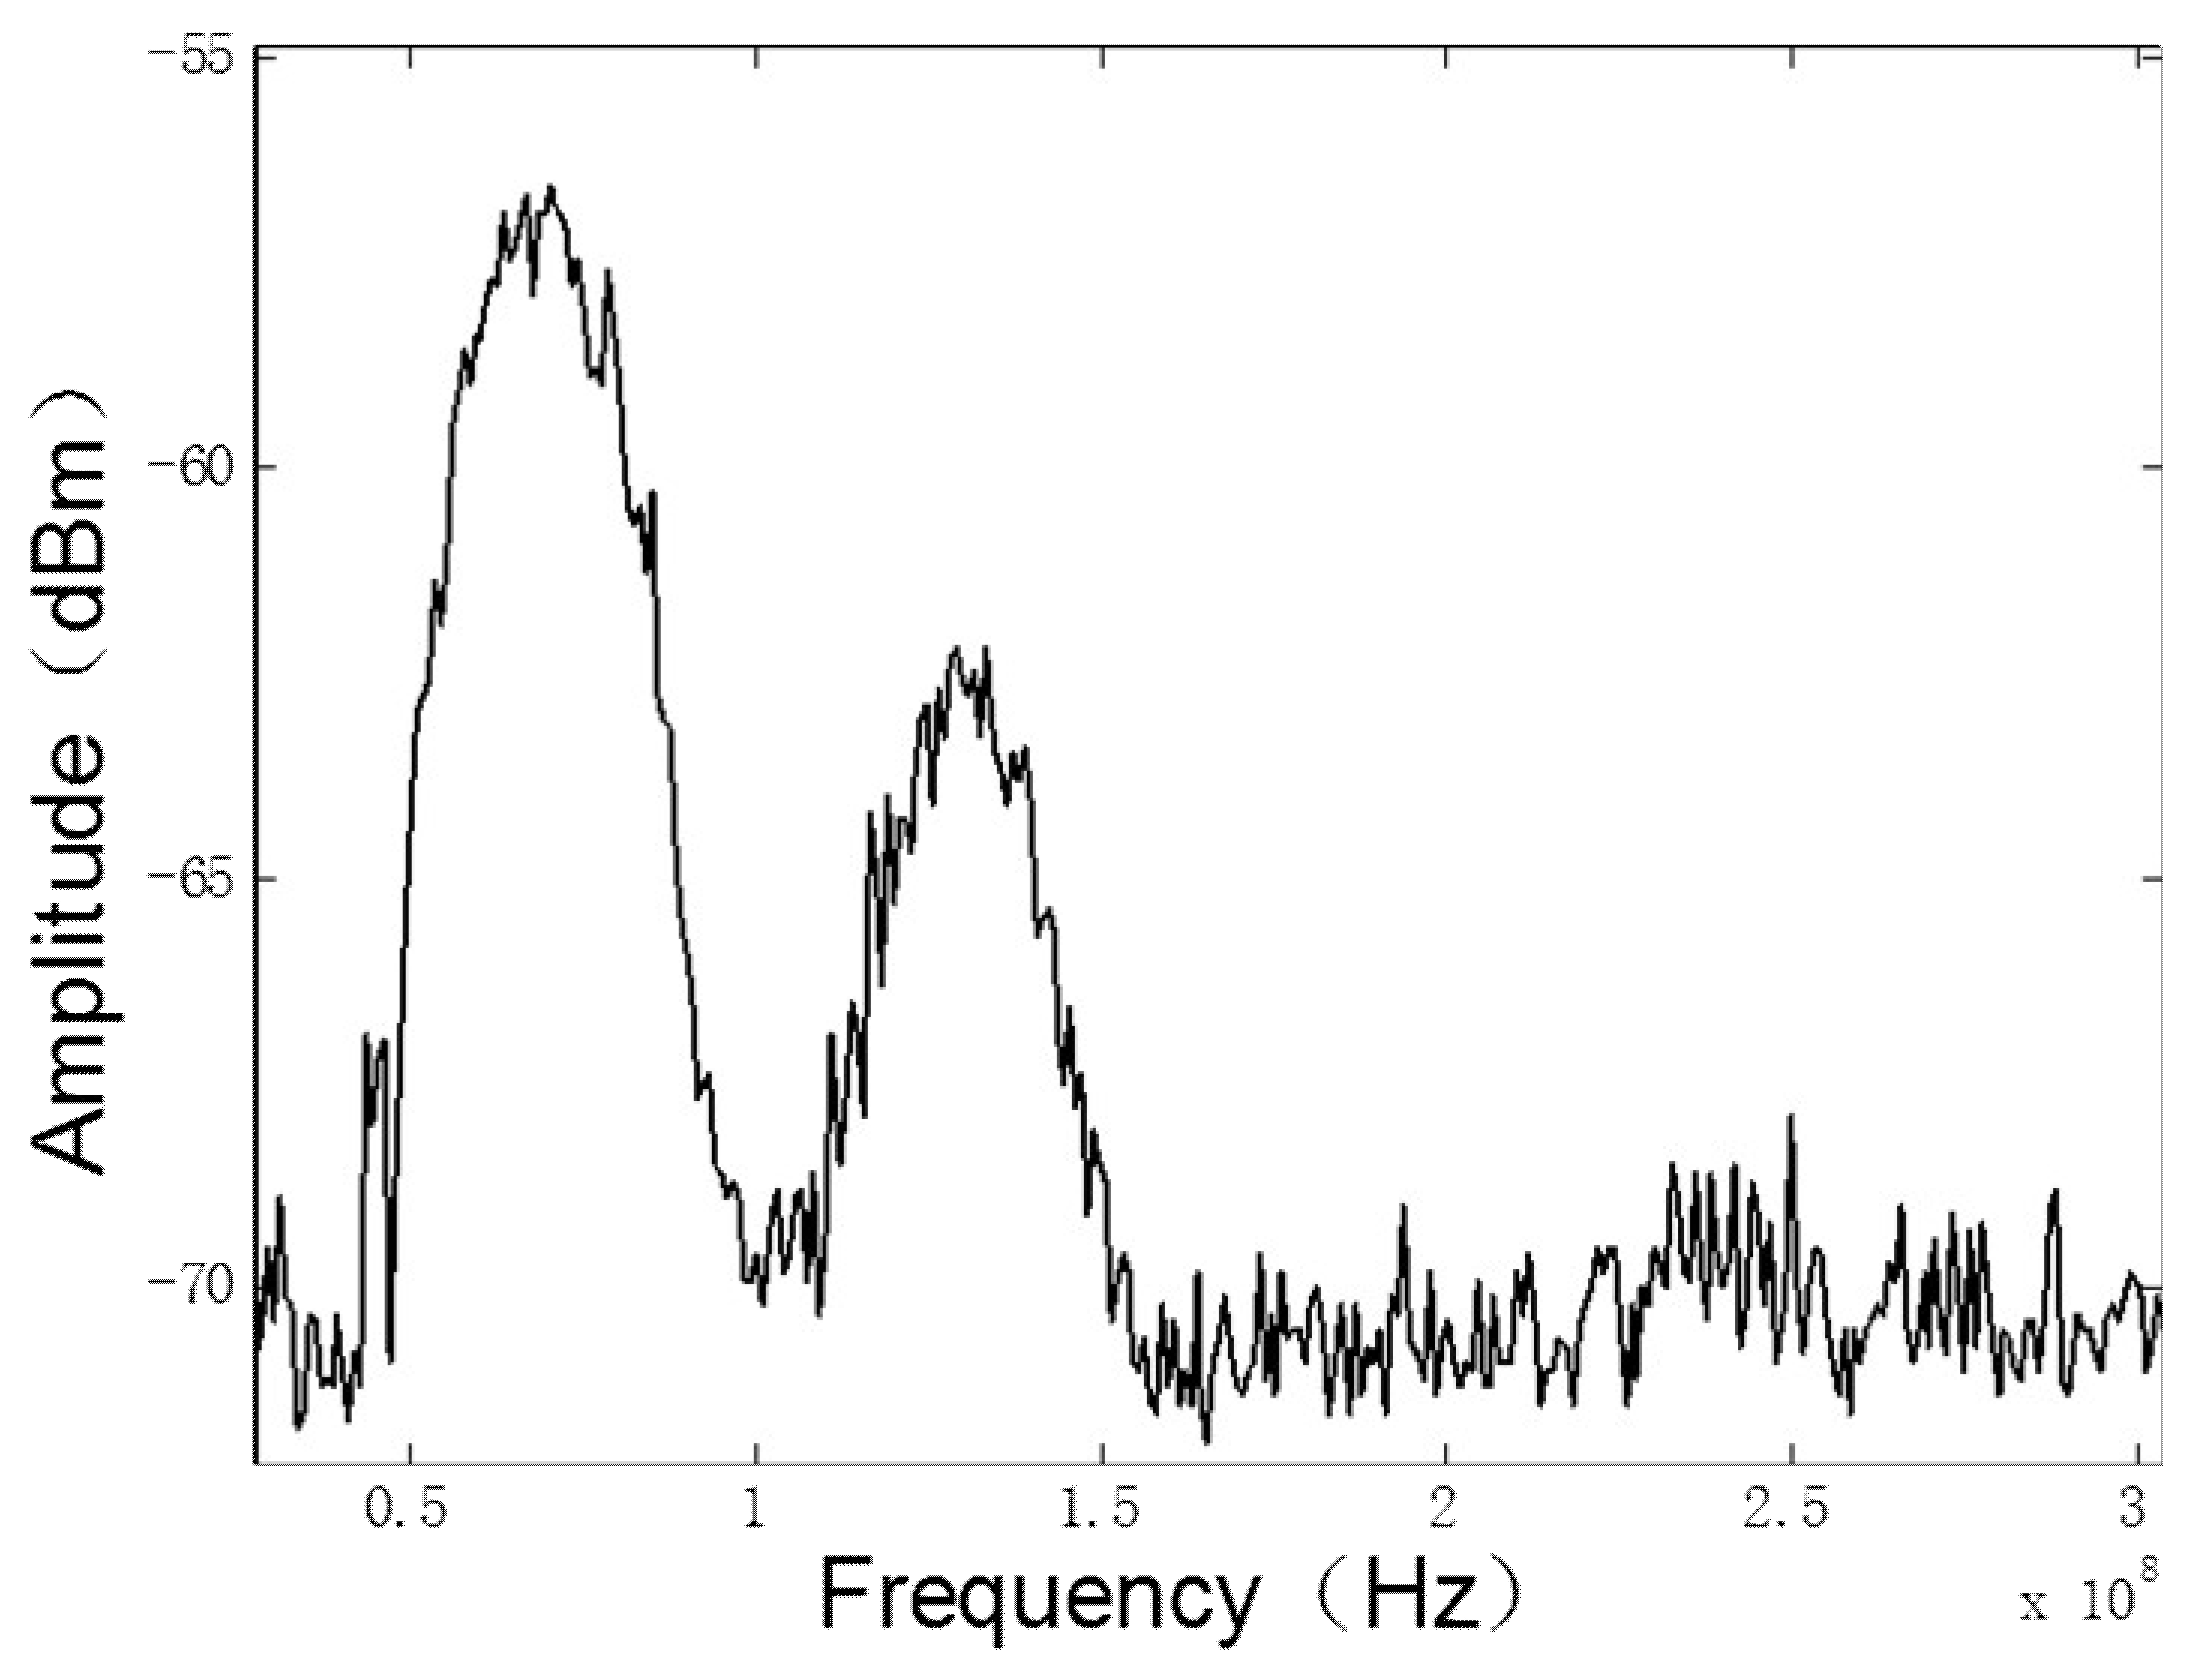
Figure 9.
Negative corona discharge region division.
Figure 10.
Negative corona discharge dipole radiation model.
Figure 11.
Single Trichel pulse current waveform.
Figure 12.
Discharge EM radiation field waveform.

Figure 13.
Theoretical calculated and experimentally tested “relationship between Trichel pulse rising edge and radiation signal amplitude”.
Figure 13.
Theoretical calculated and experimentally tested “relationship between Trichel pulse rising edge and radiation signal amplitude”.

Figure 14.
Theoretical calculated and experimentally tested “relationship between Trichel pulse amplitude and radiation signal amplitude”.
Figure 14.
Theoretical calculated and experimentally tested “relationship between Trichel pulse amplitude and radiation signal amplitude”.
Figure 15.
Double-needle Trichel pulse process: (a) Trichel pulse process under small applied voltage; (b) Trichel pulse process under large applied voltage.
Figure 15.
Double-needle Trichel pulse process: (a) Trichel pulse process under small applied voltage; (b) Trichel pulse process under large applied voltage.
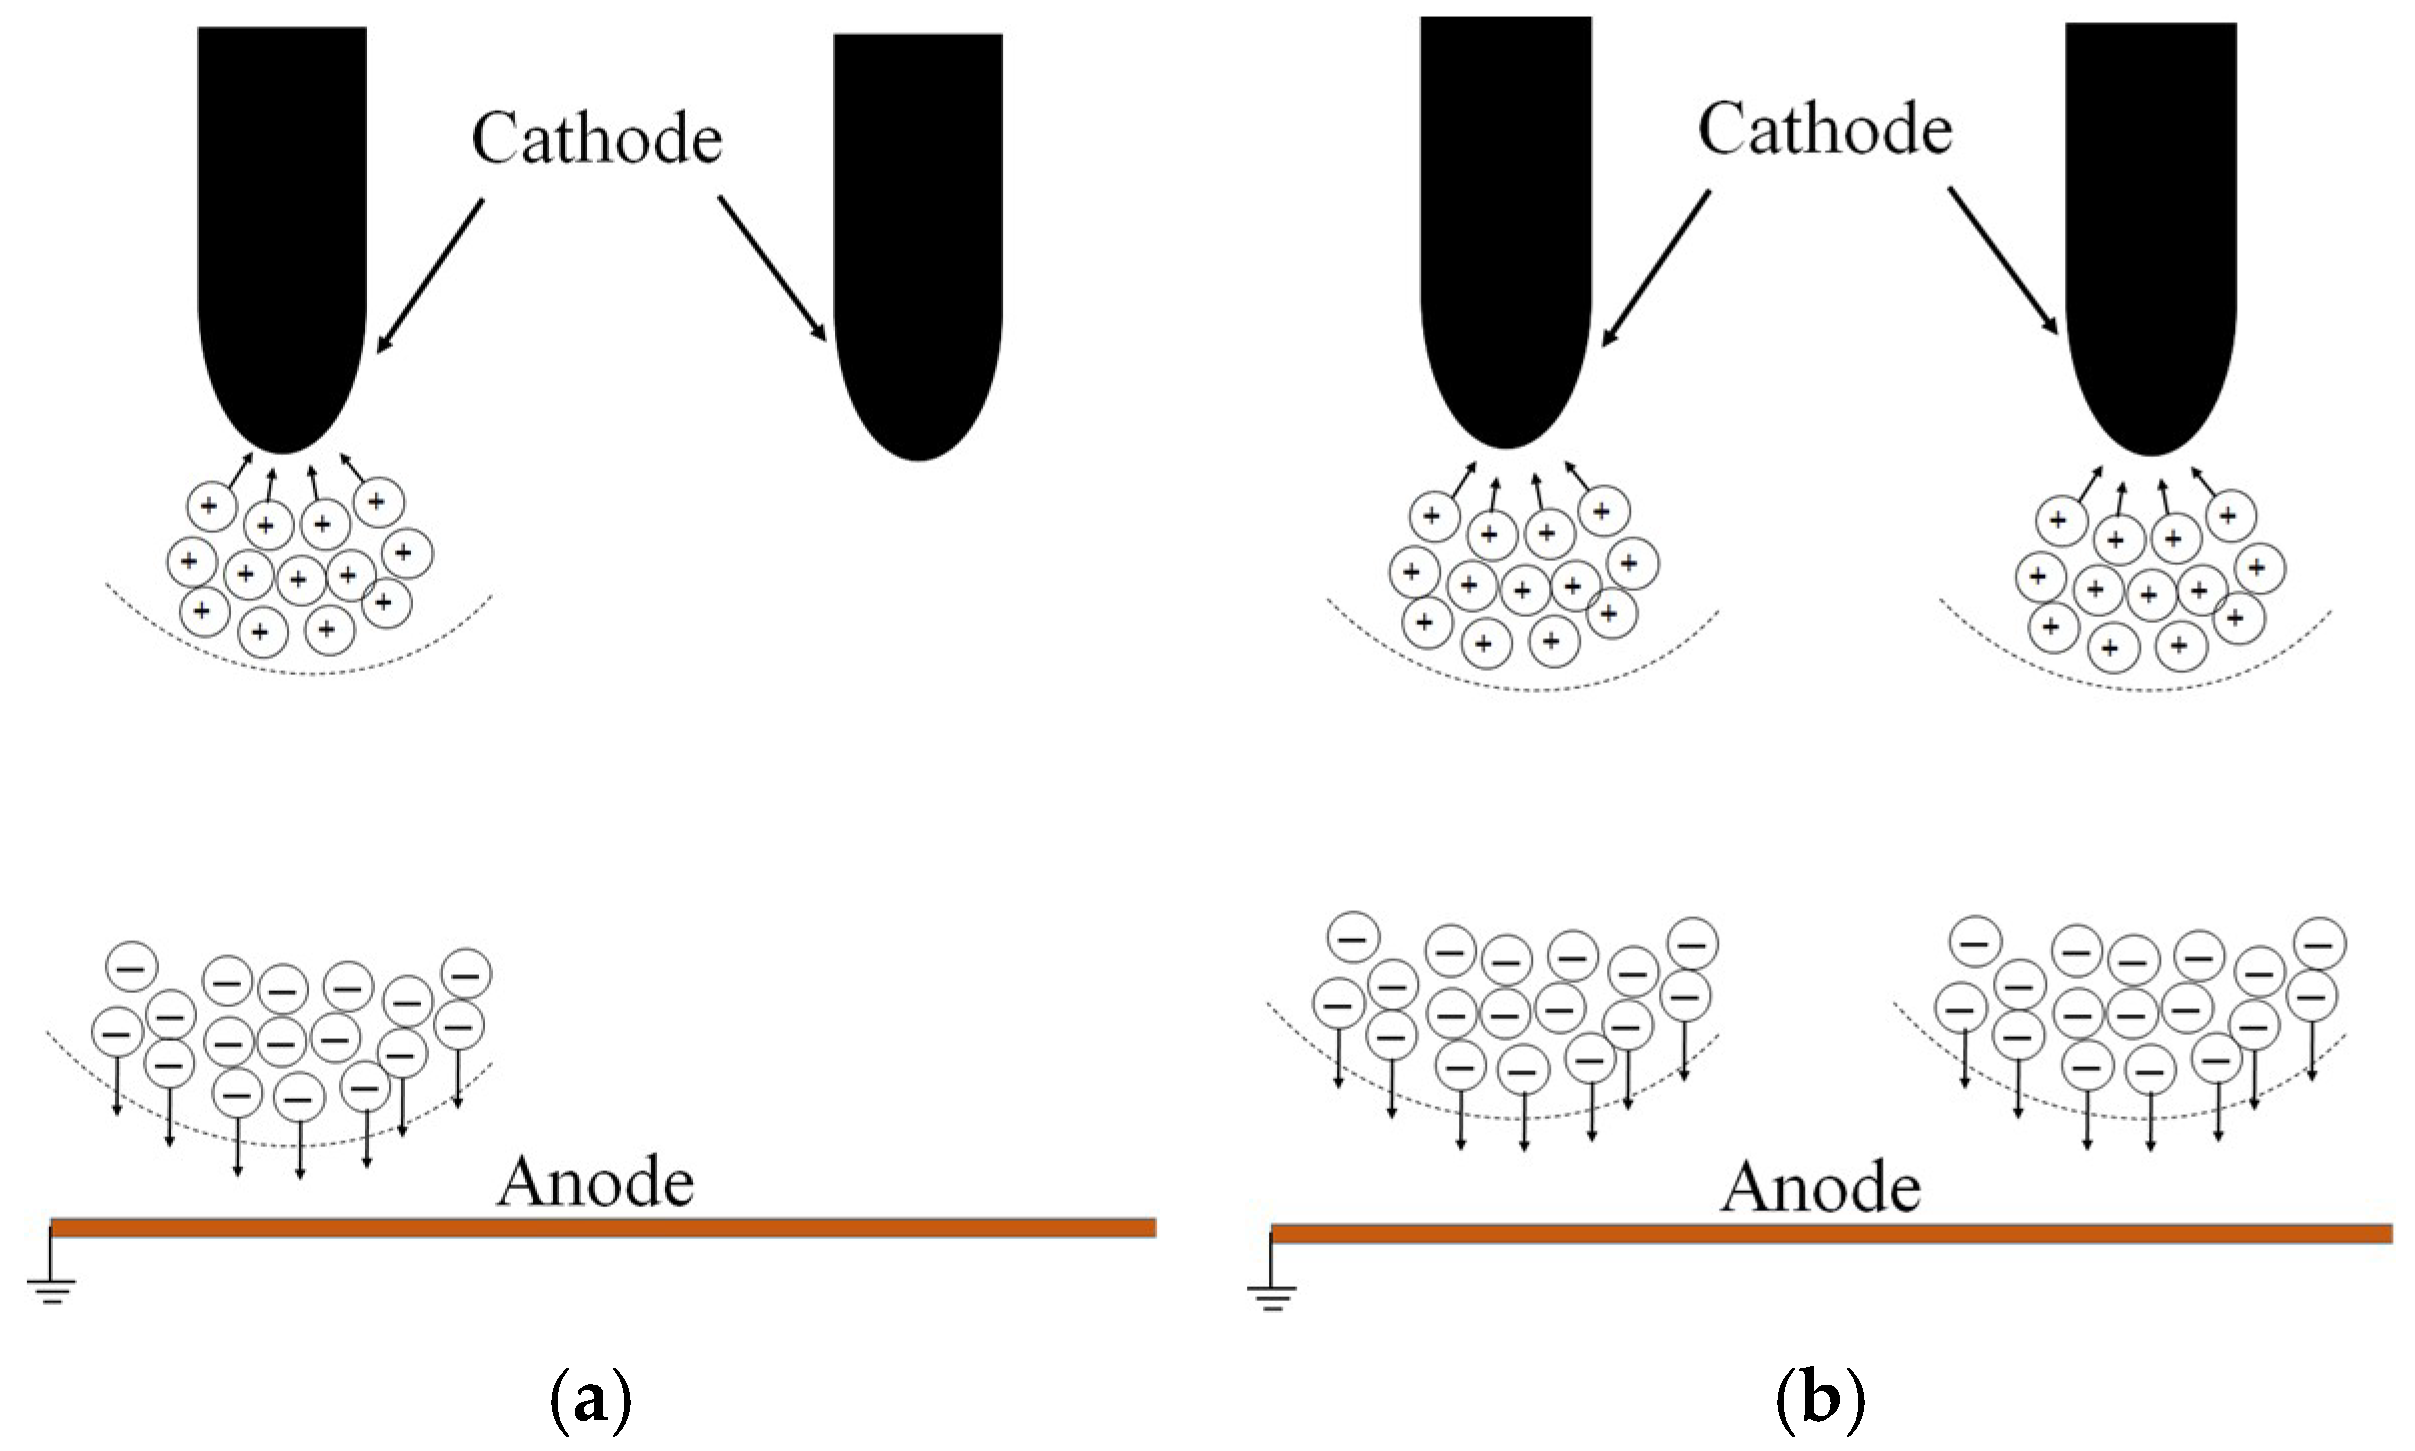
Figure 16.
Negative corona discharge Trichel pulse current waveform when loading voltage is 8.6 kV: (a) Single needle; (b) Double needles.
Figure 16.
Negative corona discharge Trichel pulse current waveform when loading voltage is 8.6 kV: (a) Single needle; (b) Double needles.

Table 1.
Negative corona discharge Trichel pulse current and its radiation characteristics under different tip radius and different air pressures.
Table 1.
Negative corona discharge Trichel pulse current and its radiation characteristics under different tip radius and different air pressures.
| Tip Radius (μm) | Air Pressure (MPa) | Pules Amplitude (μA) | Rising Time (ns) | Power of the Radiation Signal (nW) | Frequency of Radiation Signal (MHz) |
|---|---|---|---|---|---|
| 94 | 0.04 | 241 | 264 | 0.218 | 4584 |
| 94 | 0.06 | 245 | 118 | 0.697 | 52,102 |
| 94 | 0.08 | 243 | 78 | 1.0524 | 65,125 |
| 94 | 0.1 | 240 | 52 | 1.926 | 70,132 |
| 120 | 0.1 | 290 | 52 | 2.395 | 70,132 |
| 165 | 0.1 | 410 | 53 | 4.796 | 70,132 |
| 210 | 0.1 | 550 | 54 | 8.581 | 70,132 |
© 2018 by the authors. Licensee MDPI, Basel, Switzerland. This article is an open access article distributed under the terms and conditions of the Creative Commons Attribution (CC BY) license (http://creativecommons.org/licenses/by/4.0/).
Share and Cite
MDPI and ACS Style
Wang, C.; Chen, X.; Ouyang, J.; Li, T.; Fu, J. Pulse Current of Multi-Needle Negative Corona Discharge and Its Electromagnetic Radiation Characteristics. Energies 2018, 11, 3120. https://doi.org/10.3390/en11113120
AMA Style
Wang C, Chen X, Ouyang J, Li T, Fu J. Pulse Current of Multi-Needle Negative Corona Discharge and Its Electromagnetic Radiation Characteristics. Energies. 2018; 11(11):3120. https://doi.org/10.3390/en11113120
Chicago/Turabian StyleWang, Chuang, Xi Chen, Jiting Ouyang, Tie Li, and Jialu Fu. 2018. "Pulse Current of Multi-Needle Negative Corona Discharge and Its Electromagnetic Radiation Characteristics" Energies 11, no. 11: 3120. https://doi.org/10.3390/en11113120
Note that from the first issue of 2016, this journal uses article numbers instead of page numbers. See further details here.