Investigation into Off-Design Performance of a S-CO2 Turbine Based on Concentrated Solar Power

MOE Key Laboratory of Thermo-Fluid Science and Engineering, School of Energy and Power Engineering, Xi’an Jiaotong University, Xi’an 710049, China
*
Author to whom correspondence should be addressed.
Energies 2018, 11(11), 3014; https://doi.org/10.3390/en11113014
Submission received: 27 September 2018
/
Revised: 24 October 2018
/
Accepted: 29 October 2018
/
Published: 1 November 2018
(This article belongs to the Special Issue Selected Papers from the 9th Edition of the International SOLARIS Conference)
Abstract
:Research on concentrated solar power (CSP) plants has been increasing in recent years. Supercritical carbon dioxide (S-CO2) has been applied to solar power plants due to its promising physical properties. S-CO2 has a relatively low critical temperature of 31.1 °C and owns high density in the supercritical region. Hence, it is a vital working fluid in the application of low temperature heat source and miniature power equipment. Due to the fact that solar power system has a constantly changing heat source according to season and weather, a satisfactory off-design performance is necessary for the turbine in a solar power system. In this work, a S-CO2 radial-inflow turbine based on CSP is designed. A thorough numerical analysis of the turbine is then performed. To investigate the off-design performance of this turbine, three types of nozzle profiles with different leading edge diameters are adopted. Mach number, temperature and pressure distribution are covered to present the off-design effect with different nozzle profiles. Moreover, the relation of output power, mass flow rate and efficiency with different leading edge diameter (LED) are analyzed. Results show that different LED has a vital influence on the aerodynamic characteristics and off-design performance of the S-CO2 turbine based on CSP. In addition, the designed turbine with LED = 4 mm can obtain the highest mass flow rate and output power. While the turbine with LED = 10 mm provides slightly better off-design efficiency for CSP plants.
1. Introduction
Supercritical carbon dioxide (S-CO2) has a low critical temperature. Specifically, its critical temperature is 304.2 K while its critical pressure is 7.38 MPa [1]. As a working fluid in radial-inflow turbine, S-CO2 has many advantages. Its critical condition is easy to reach due to the low critical temperature and it is in favor of the environment. Hence, S-CO2 is safe for industrial use and has low cost [2]. The most useful merits of S-CO2 lie in its high density and low viscosity, which result in high efficiency and compact mechanical structure in the radial-inflow turbine [3,4]. The research on S-CO2 fluid has been increasing lately. In the last 5 years, the investigations on S-CO2 Brayton cycle and S-CO2 solar Rankine cycle have been covered [5,6,7]. Due to all these advantages, the S-CO2 power cycle has now been considered as the most popular and attractive competitor in concentrated solar power (CSP), coal power system, and bottoming cycle of fuel cells [8,9,10]. As in turbomachinery, S-CO2 also possesses many advantages for convenient use. For miniature turbomachinery, radial turbines and centrifugal compressors with compact mechanical structure and complex geometries have been designed [11]. For turbomachinery with large power, we usually adopt axial turbines and compressors [12].
One of the most important applications of S-CO2 is the usage in solar power. Recently, more and more scholars have begun to pay attention to this field. Wang X R et al. [13] studied the feasibility of a combined CO2 cycle comprising a topping S-CO2 cycle and a bottoming T-CO2 cycle. Iverson B D et al. [14] illustrated the characteristics of developmental Brayton turbomachinery in response to a fluctuating thermal input in solar environments. Binotti M et al. [15] presented a preliminary thermodynamic analysis of three different S-CO2 power cycles, which was employed in a high temperature solar tower system, working up to 800 degrees C. Kouta A et al. [16] conducted a performance analysis for a solar driven S-CO2 Brayton cycle combined with a multiple effect evaporation with thermal vapor compression. They proposed two new different supercritical Brayton cycles, which are respectively the regeneration and recompression S-CO2 cycles. Hakkarainen E et al. [17] conducted a dynamic modelling and simulation of a CSP plant based on a S-CO2 closed brayton cycle.
From the above, the application of S-CO2 in CSP has raised more and more attention. Turbines, as one of the core components in the Brayton cycle, are vital in the investigation of the S-CO2 thermal cycle. Due to the variability of solar power, the off-design performance of the turbine in CSP is important and it is affected by the nozzle profile. In this paper, three types of nozzle profiles with different LED are adopted in a turbine used in CSP. Mach number, temperature and pressure distribution are covered to present the off-design effect with different nozzle profiles. Moreover, the relation of output power, mass flow rate and efficiency with different LEDs are analyzed. The investigation is helpful for the further development of solar power technologies using S-CO2.
2. Research Object
The S-CO2 turbine investigated in this paper derives from 1D thermodynamic design, as we have discussed in Reference [18]. The design process is implemented to obtain the preliminary geometric parameters of the impeller and the nozzle. The computation is based on the mass, energy and momentum conservation and it is performed to get the best efficiency at the rotational speed of 50,000 rpm. The fluid properties of S-CO2 are referred to from NIST REFPROP.
2.1. Impeller
The designed impeller is shown in Figure 1. The working fluid S-CO2 flows into the impeller from radial direction and discharges from axial direction. In this process, S-CO2 fluid expands to apply work to the impeller. The backward bent vane is adopted in the impeller to guarantee a favorable aerodynamic performance. The detailed geometric parameters are listed in Table 1.
2.2. Three Types of Nozzle
There are three types of nozzle profiles which are investigated in this research to illustrate the off-design performance. The primary objective of this investigation is to design a S-CO2 turbine with the output power around 300 kW under design condition and to obtain a better off-design performance. As the LED increases, the mass flow rate of the turbine decreases due to the flow area reduction at the nozzle inlet, which also results in the decline of output power. Hence, we finally choose the LED between 4 mm and 10 mm to satisfy the need of output power and investigate the effect of LED on off-design performance. Figure 2 presents the nozzle profile with a different LED. In the nozzle, the pressure of S-CO2 declines and the velocity increases. The detailed geometric parameters of the nozzle are listed in Table 2.
3. Numerical Method
In this paper, the 3D viscous turbulent CFD simulation is obtained in commercial CFD software ANSYS-CFX.
3.1. Governing Equations and Boundary Conditions
The governing equations are composed of the conservation of mass, energy and momentum. A general form of the governing equations can be expressed as:
In the above equation, the terms are respectively transient, convective, diffusive and source term. In addition, corresponds to universal variable. When = 1, Equation (1) represents a continuity equation. If an energy equation is needed, we can define as temperature. If we define as the velocity upon arbitrary direction, Equation (1) now corresponds to the momentum equation. Moreover, Γ is the generalized diffusion coefficient and S is the generalized source term. In this calculation, the conservation of mass, momentum and energy is established for the viscous and compressible flow. A total energy equation including viscous term is used for energy conservation and the friction loss of the turbine mainly lies in the wall of blade, hub and shroud. Moreover, the high resolution advection scheme in CFX is adopted.
We adopt Reynolds Averaged Navier-Stokes (RANS) equations to dispose of the turbulent flow and we employ the finite volume method to discretize the steady RANS equations. SST (Shear Stress Transport) k-ω turbulence model is adopted in this research. This turbulence model was proposed by Menter [19] based on the k-ε and k-ω turbulence model. Its advantage mainly concentrates on the combination of the k-ε turbulence model and the k-ω turbulence model. It overcomes the disadvantages of the k-ε turbulence model and can simulate the low Reynolds number around the wall region. Also, it solves the problem that the k-ω turbulence model needs grids of high quality. Hence, it is accurate and appropriate to simulate the turbulent flow in radial-inflow turbines [20].
To solve the aforementioned governing equations, we need to add proper boundary conditions. In this research, boundary conditions are as follows: total pressure of inlet (15 MPa), total temperature of inlet (550 K) as designed condition and static pressure of outlet (8 MPa). The interface of the rotor and stator is coupled by a frozen rotor method. The converged result is obtained when RMS residuals of mass and momentum are below 10−4. The numerical method adopted in this research can be verified by Kim S.G. et al. [21] from Korea Advanced Institute of Science and Technology. They built an experimental system for a SCO2 centrifugal compressor and compared the CFD result with the experimental result, which appeared to conform. Meanwhile, the rotating speed is 50,000 rpm. To simulate the inlet volute, the flow angle at the nozzle inlet is 45°. In off-design conditions, based on the characteristic of CSP plants, the inlet temperature constantly changes due to the climatic variation. Hence, in the computation, the inlet temperature varies from 350 K to 650 K, with 50 K as a gradient. In other words, for off-design conditions, only the inlet total temperature varies and the value is respectively 350 K, 400 K, 450 K, 500 K, 600 K and 650 K.
3.2. Implementation of Fluid Properties
In order to simulate the fluid property of S-CO2 precisely, we use the real gas property (RGP) format table to implement the sharply variable density and specific heat capacity near the critical point. The data for RGP format table is obtained from NIST REFPROP 9.0, which is widely referred as fluid property database. In addition, the RGP table generates from MATLAB 2017a, which can acquire fluid property data from REFPROP and convert it to a RGP file in a predefined pressure and temperature range. In order to save the computation cost, the pressure range is from 7 MPa to 16 MPa, with 0.2 MPa as a gradient and the temperature range is from 250 K to 800 K, with 5 K as a gradient. The CFX solver calculates the S-CO2 property by bilinear interpolation. An input method of TASCflow RGP is used in ANSYS CFX 15.0. The accuracy of the RGP table used in the CFX code has been verified by Odabaee M et al. [22] and Kim S G et al. [21]. Figure 3 presents the phase diagram of S-CO2. In this research, the investigated region mainly lies in the supercritical fluid region.
Figure 4 shows the value variation of density along with the pressure and temperature range studied in this research. In the S-CO2 turbine, the temperature is relatively high compared to S-CO2 compressors, as the lowest temperature in this research is above 350 K. Hence, the gradient is adequate for the simulation of S-CO2.
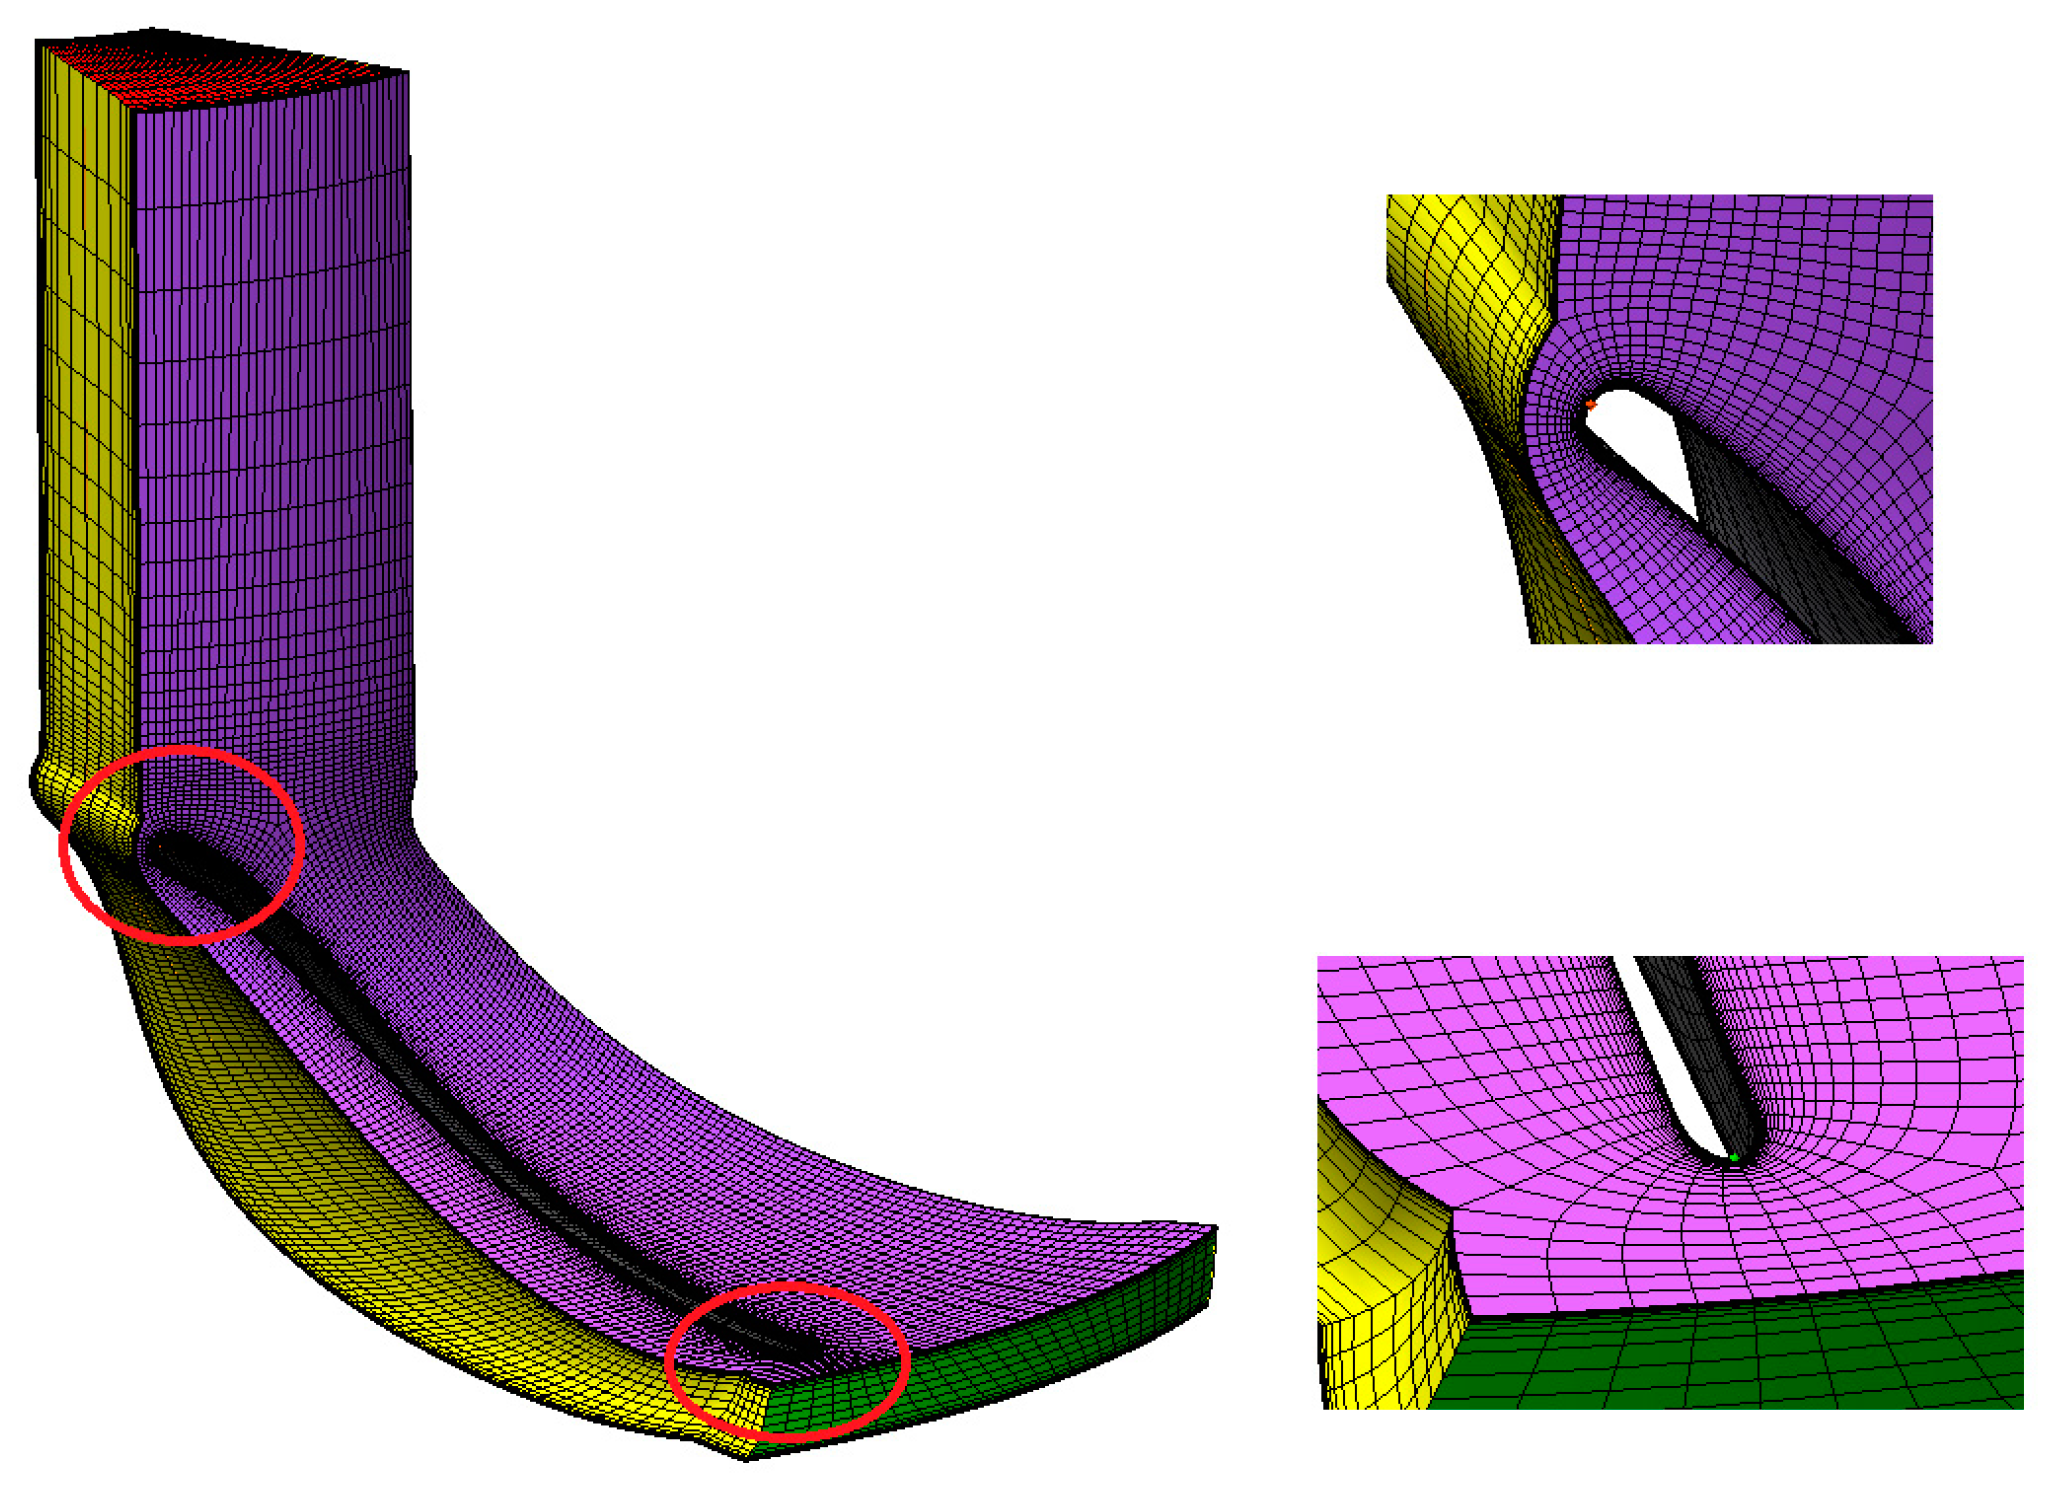
A computational mesh of high quality is necessary for this research. Therefore, we employ the hexahedral mesh in the rotor and stator fluid domains. Due to the periodicity of the impeller and the nozzle, the model of single flow channel is considered in the investigation. As shown in Figure 5 and Figure 6, O-type mesh is applied around the rotor blades and three types of nozzle blades. O-type mesh can greatly improve the mesh quality at the leading edge and the trailing edge of the blades. Besides, H-type mesh is employed inside the flow channels, which also enhances the mesh quality. The mesh of the boundary layers has been generated densely, especially for the blade surface, the hub wall and the shroud wall.
To guarantee the validation of the numerical simulation, a mesh independence test has been conducted under the designed condition with LED = 10mm. The result of the mesh independence test is presented in Table 3 as below.
As a result, when the total element number exceeds 314,000, the output power of the turbine is of small variation. Hence, based on the balance of time cost and precision, we ultimately select sequence number 3 to conduct the off-design numerical simulation for three LED types.
4. Results and Discussion
The computation results of the design condition and six off-design conditions with three different types of LED are analyzed and discussed below. The convergence of the simulation happens when the mass flow of the turbine inlet and outlet are equal and slightly fluctuate.
4.1. Off-Design Performance of Different LED
At first, the analysis of off-design performance for different LEDs is conducted. The pressure distribution of the turbine can reflect the capacity of generating power. To be exact, the differential pressure on the suction side and pressure side of the blade can generate torque and transfer to the impeller. Meanwhile, the velocity vectors on the mid-span surface can reflect the flow conditions of the turbine.
Figure 7, Figure 8 and Figure 9 give the pressure contours with velocity vectors on the surface, which is presented at the mid-span of the impeller and nozzle.
As shown in Figure 7, Figure 8 and Figure 9, when the inlet temperature is 400 K, the pressure gradient in the flow passage of nozzle is not obvious. Meanwhile, the leading edge of the impeller blade presents a distinct stagnation point, which indicates a relatively large aerodynamic loss. In the impeller, the pressure distribution is apparently nonuniform and the pressure difference between the pressure side and the suction side is relatively low, which can lead to less output torque towards the axis. Meanwhile, there is a large vortex in the middle of the rotor flow passage according to the velocity vectors. Compared to Tin = 400 K, when the inlet temperature is 450 K in Figure 7b, Figure 8b and Figure 9b, the pressure distribution is more uniform except that small stagnation points appear at the leading edge of the impeller blade and the pressure difference on both sides of the blade is larger. As for the velocity vectors, there is a distinct wake flow at the trailing edge of the nozzle, and the vortex in the middle of the rotor is relatively small compared to that of Tin = 400 K. When the inlet temperature is 550 K at the design point, the pressure distribution is most uniform and the pressure on the pressure side of the blade is apparently greater than that on the suction side, which indicates a favorable ability of power output. In addition, the vortex in the middle of the rotor passage disappears, which indicates a better flow condition. In Figure 7d, Figure 8d and Figure 9d, the inlet temperature is larger than the design condition. We obtain a similar pressure distribution with that of Tin = 550 K. Hence, the reduction of inlet temperature has a greater influence on the aerodynamic performance.
Comparing three different LEDs, when LED = 10 mm, the decrease of temperature has the lowest effect on the turbine since the stagnation point at the leading edge of the rotor blade is the smallest and the flow condition is more uniform when Tin = 450 K. Moreover, the increase of temperature has a larger impact on larger LED. Low-pressure region tends to expand as LED increases. When Tin = 650 K, a small vortex near the suction side of the rotor blade appears.
4.2. Aerodynamic Characteristics on Design Condition with Different LED
Then, we discuss the aerodynamic characteristics on design condition with different LED to illustrate the influence of LED on the turbine performance. Mach number, pressure and temperature distribution at the mid-span of the impeller and nozzle are covered.
Figure 10 shows the Mach number contours at the mid-span of the impeller and nozzle. In the Mach number contours, we employ the relative coordinate system (CS) as a reference CS. Specifically, the Mach number in the nozzle is defined as actual velocity divided by local sound speed and the Mach number in the impeller is defined as the relative velocity, which does not include rotation speed, divided by local sound speed.
As Figure 10 indicates, the working fluid S-CO2 accelerates in the nozzle flow passage. In the impeller flow passage, the velocity of S-CO2 on the pressure side is larger than that on the suction side. Comparing three LED types, when LED = 10mm in Figure 10a, the acceleration caused by the nozzle is most effective. At the outlet of the nozzle passage, the Mach number reaches almost 0.7. Moreover, the stagnation effect at the leading edge of the nozzle is most evident. As shown in Figure 10b,c, the low Mach number region at the middle of the impeller flow passage gradually decreases as LED reduces, which indicates that the wake flow effect of the nozzle blade diminishes gradually. Comparing the Mach number at the outlet of the impeller, the minimum shows when LED = 10 mm, which indicates least leaving velocity loss. To sum up, the turbine has the most efficient power capacity when LED = 10 mm.
Figure 11 shows the pressure contours at the mid-span of the impeller and nozzle. There is an area of low pressure on the suction side at the trailing edge of the impeller blade. In this area, the pressure is below critical pressure 7.38 MPa. Hence, we describe it as a trans-critical area hereafter. In Figure 11, the pressure gradually declines along the flow direction through the nozzle and the impeller. The pressure distribution is similar in three LED types. Nevertheless, it can be observed that when LED = 10 mm, the trans-critical area at the trailing edge of the impeller blade is the smallest. Small trans-critical region can guarantee the operational stability of the turbine. Hence, the turbine with nozzle LED = 10 mm owns the most stable operation characteristic under design condition.
In addition, Figure 12 shows the temperature contours at the mid-span of the impeller and nozzle.
As Figure 12 indicates, the temperature distributions of three LED types are similar. Along the flow direction, the temperature gradually decreases. Moreover, there is an evident stagnation point at the trailing edge of the nozzle. Comparing three LED types, when LED = 4 mm, the throat section is the closest to the nozzle inlet since the leading edge of the nozzle is of little effect on the inlet S-CO2 flow.
4.3. Off-Design Performance of the S-CO2 Turbine with Different LED
Finally, yet importantly, the off-design performance of the S-CO2 turbine with different LED is obtained, which illustrates the influence of LED on the varying operating conditions of the turbine used in the CSP cycle.
Figure 13 gives the correlation of inlet temperature towards isentropic efficiency. The isentropic efficiency discussed in this research is defined as Equation (2) as below:
In Equation (2), T stands for torque, r represents the rotation speed, h is enthalpy, and is mass flow rate. As for the subscripts, is stands for isentropic, in and out corresponds to the inlet and the outlet of the turbine respectively, and z represents axial direction.
In Figure 13, the variation of isentropic efficiency of all three LED types shows the same trend. When the inlet temperature of the turbine is larger than the design condition, the isentropic efficiency declines. When the inlet temperature decreases, the isentropic efficiency first increases and then rapidly descends. The highest isentropic efficiency happens when the inlet temperature is near 470 K. Due to the characteristics of S-CO2, when the inlet temperature is close to the critical temperature, the density of working fluid changes sharply. The geometry of the turbine does not fit the operation condition, which results in a rapid decline of isentropic efficiency. While the inlet temperature increases, the change of density has a relatively lower influence on the isentropic efficiency.
Comparing three LED types, when LED = 10 mm, the isentropic efficiency is the highest in almost all the conditions. In addition, when the inlet temperature decreases, the isentropic efficiency of LED = 10 mm drops more slowly. In general, the off-design performance of LED = 10 mm is slightly better at efficiency while LED = 4 mm is lower than the two others. This is because larger LED is insensitive to the change of velocity when inlet temperature increases. Hence, with larger LED, the turbine tends to maintain the same velocity triangle as in design condition, which corresponds to higher isentropic efficiency.
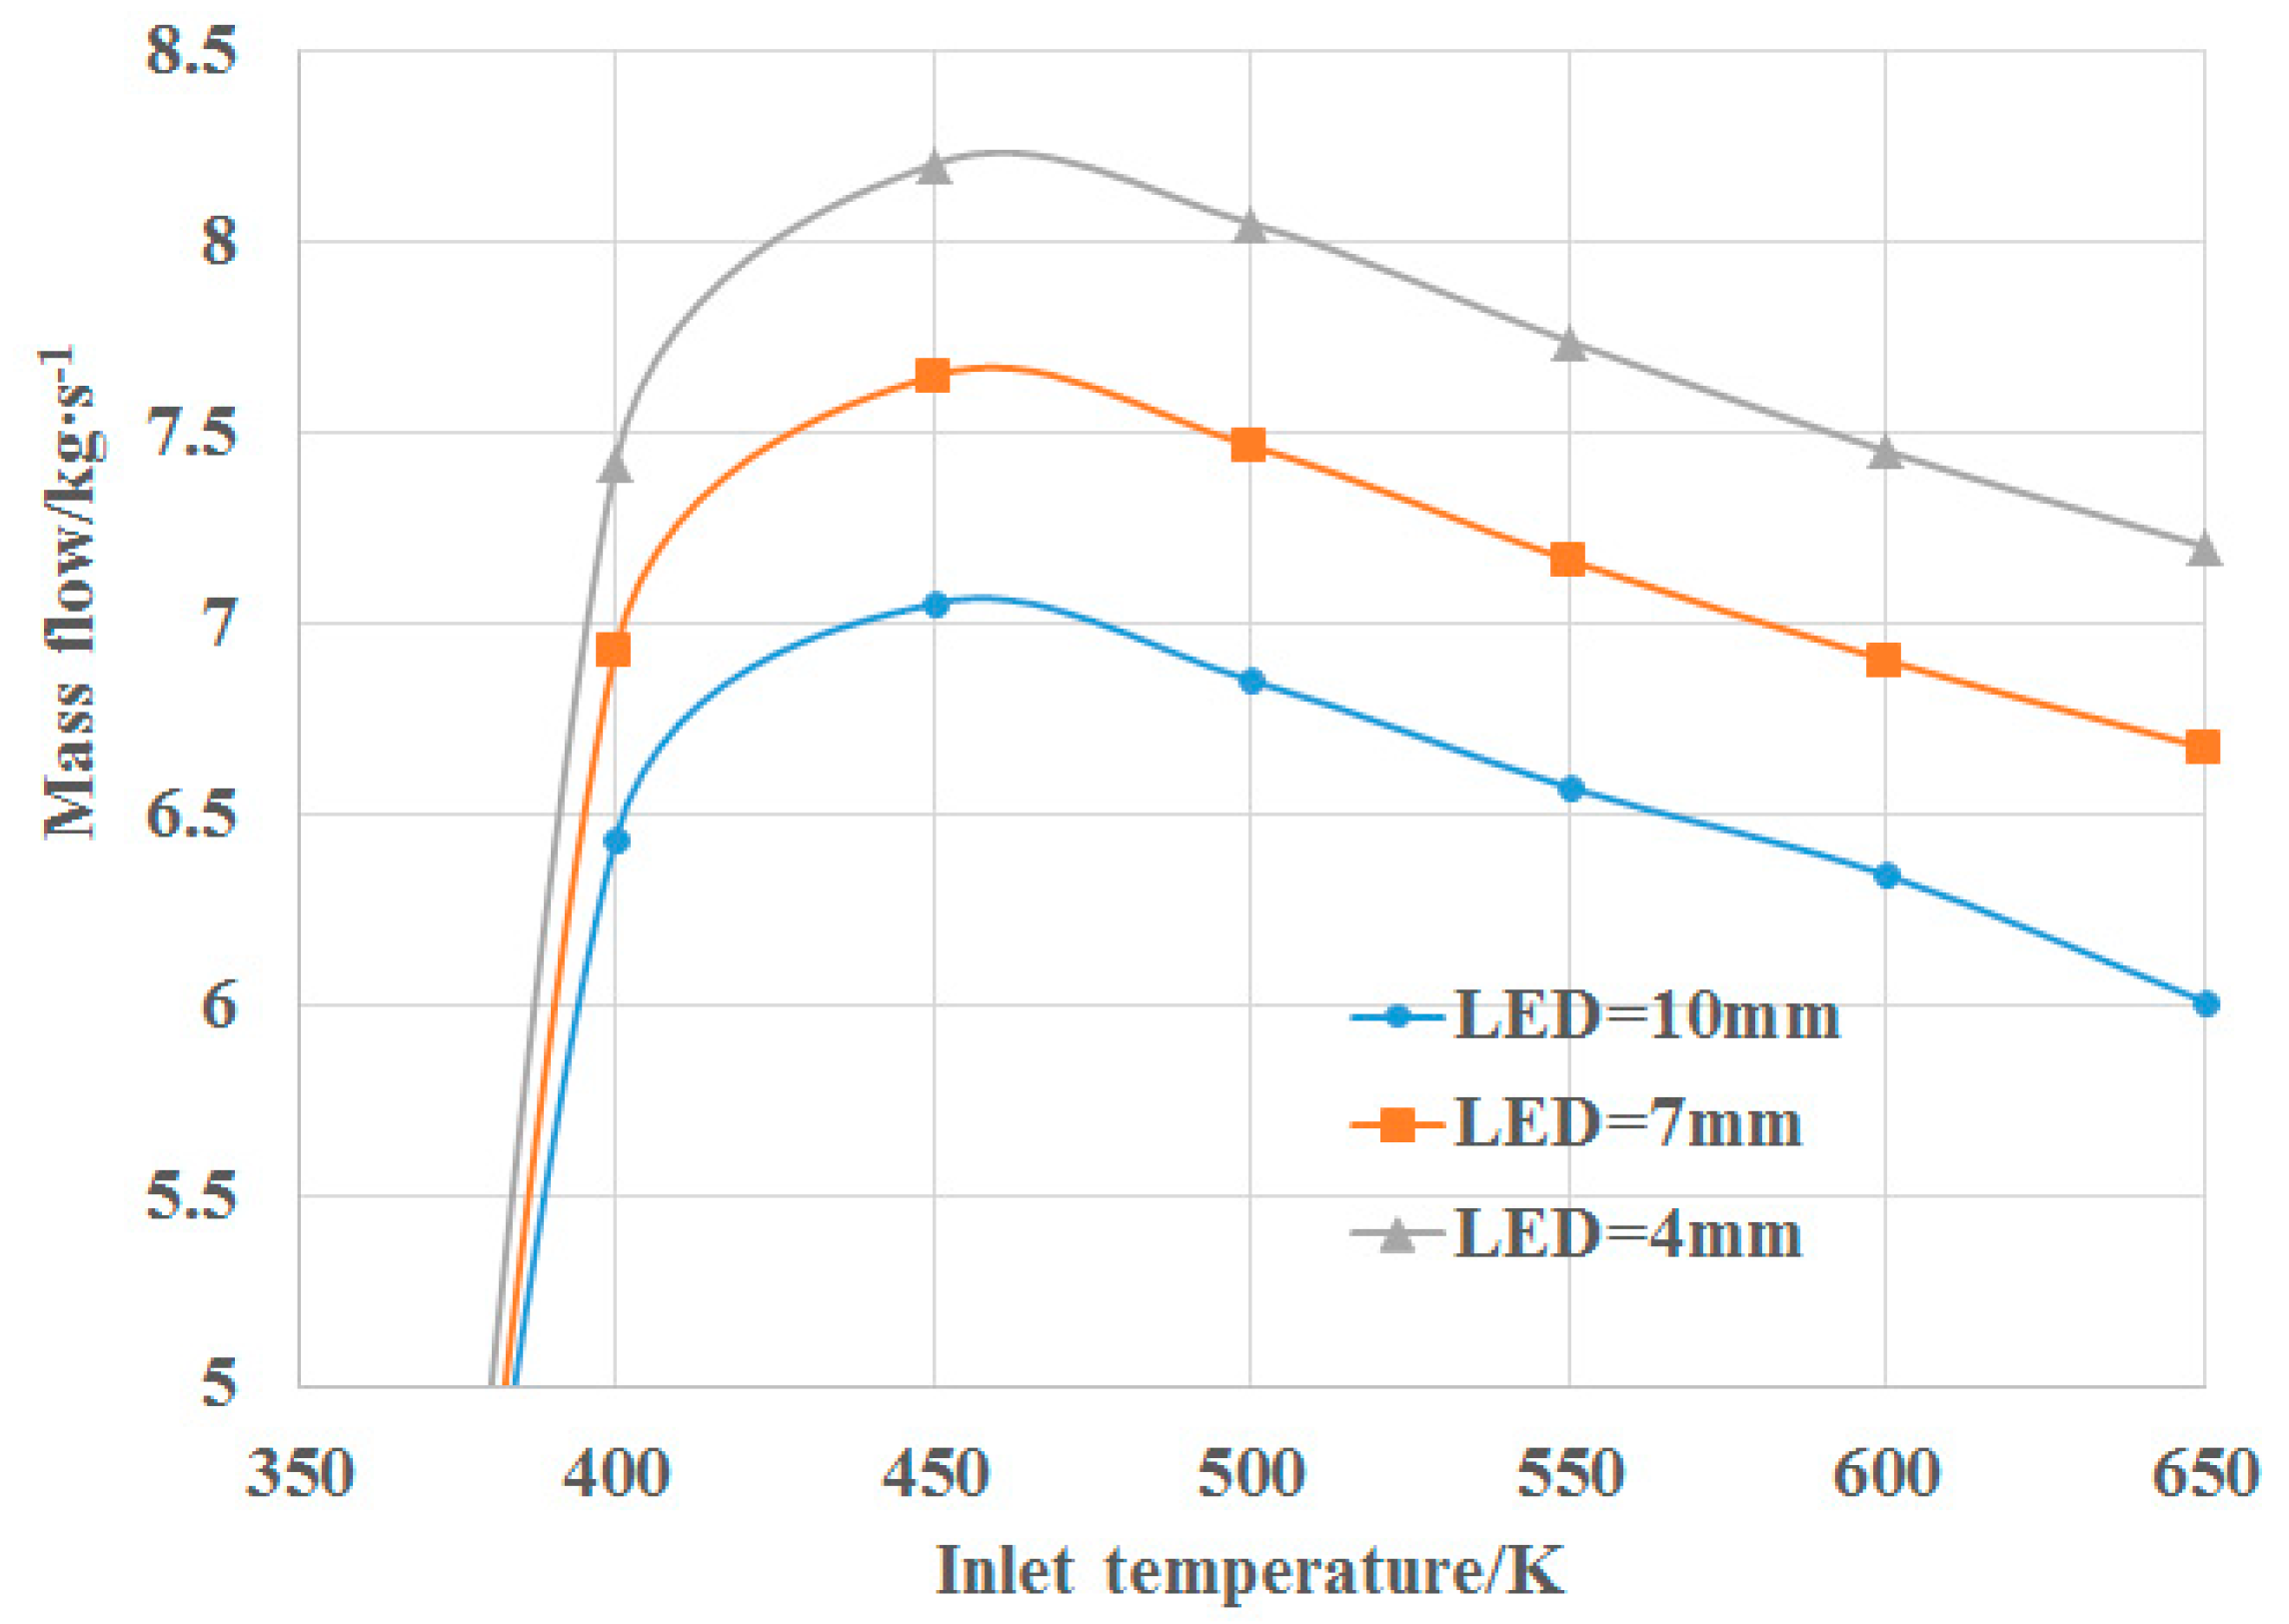
Moreover, the correlation of inlet temperature towards mass flow is shown in Figure 14.
As indicated in Figure 14, the correlation of inlet temperature towards mass flow is similar to that of inlet temperature towards isentropic efficiency. When the inlet temperature of the turbine is larger than the design condition, the mass flow declines. When the inlet temperature decreases, the mass flow first increases. Due to the characteristics of S-CO2, when the inlet temperature is close to the critical temperature, the density of working fluid changes sharply. As the inlet temperature further decreases, the phenomenon of flow congestion appears and the mass flow rapidly descends. The highest mass flow happens when the inlet temperature is near 470 K.
Comparing three LED types, the mass flow of LED = 4 mm is the largest among all. Due to the smallest LED, the nozzle flow passage obtains the largest flow area when LED = 4 mm. The trend of mass flow variation in three LED types is similar in Figure 14. When inlet temperature increases, the density of S-CO2 decreases, which results in a decline of mass flow rate. As the inlet temperature further decreases, the flow congestion arises. Hence, the mass flow of three LED types decrease rapidly and tend to be the same.
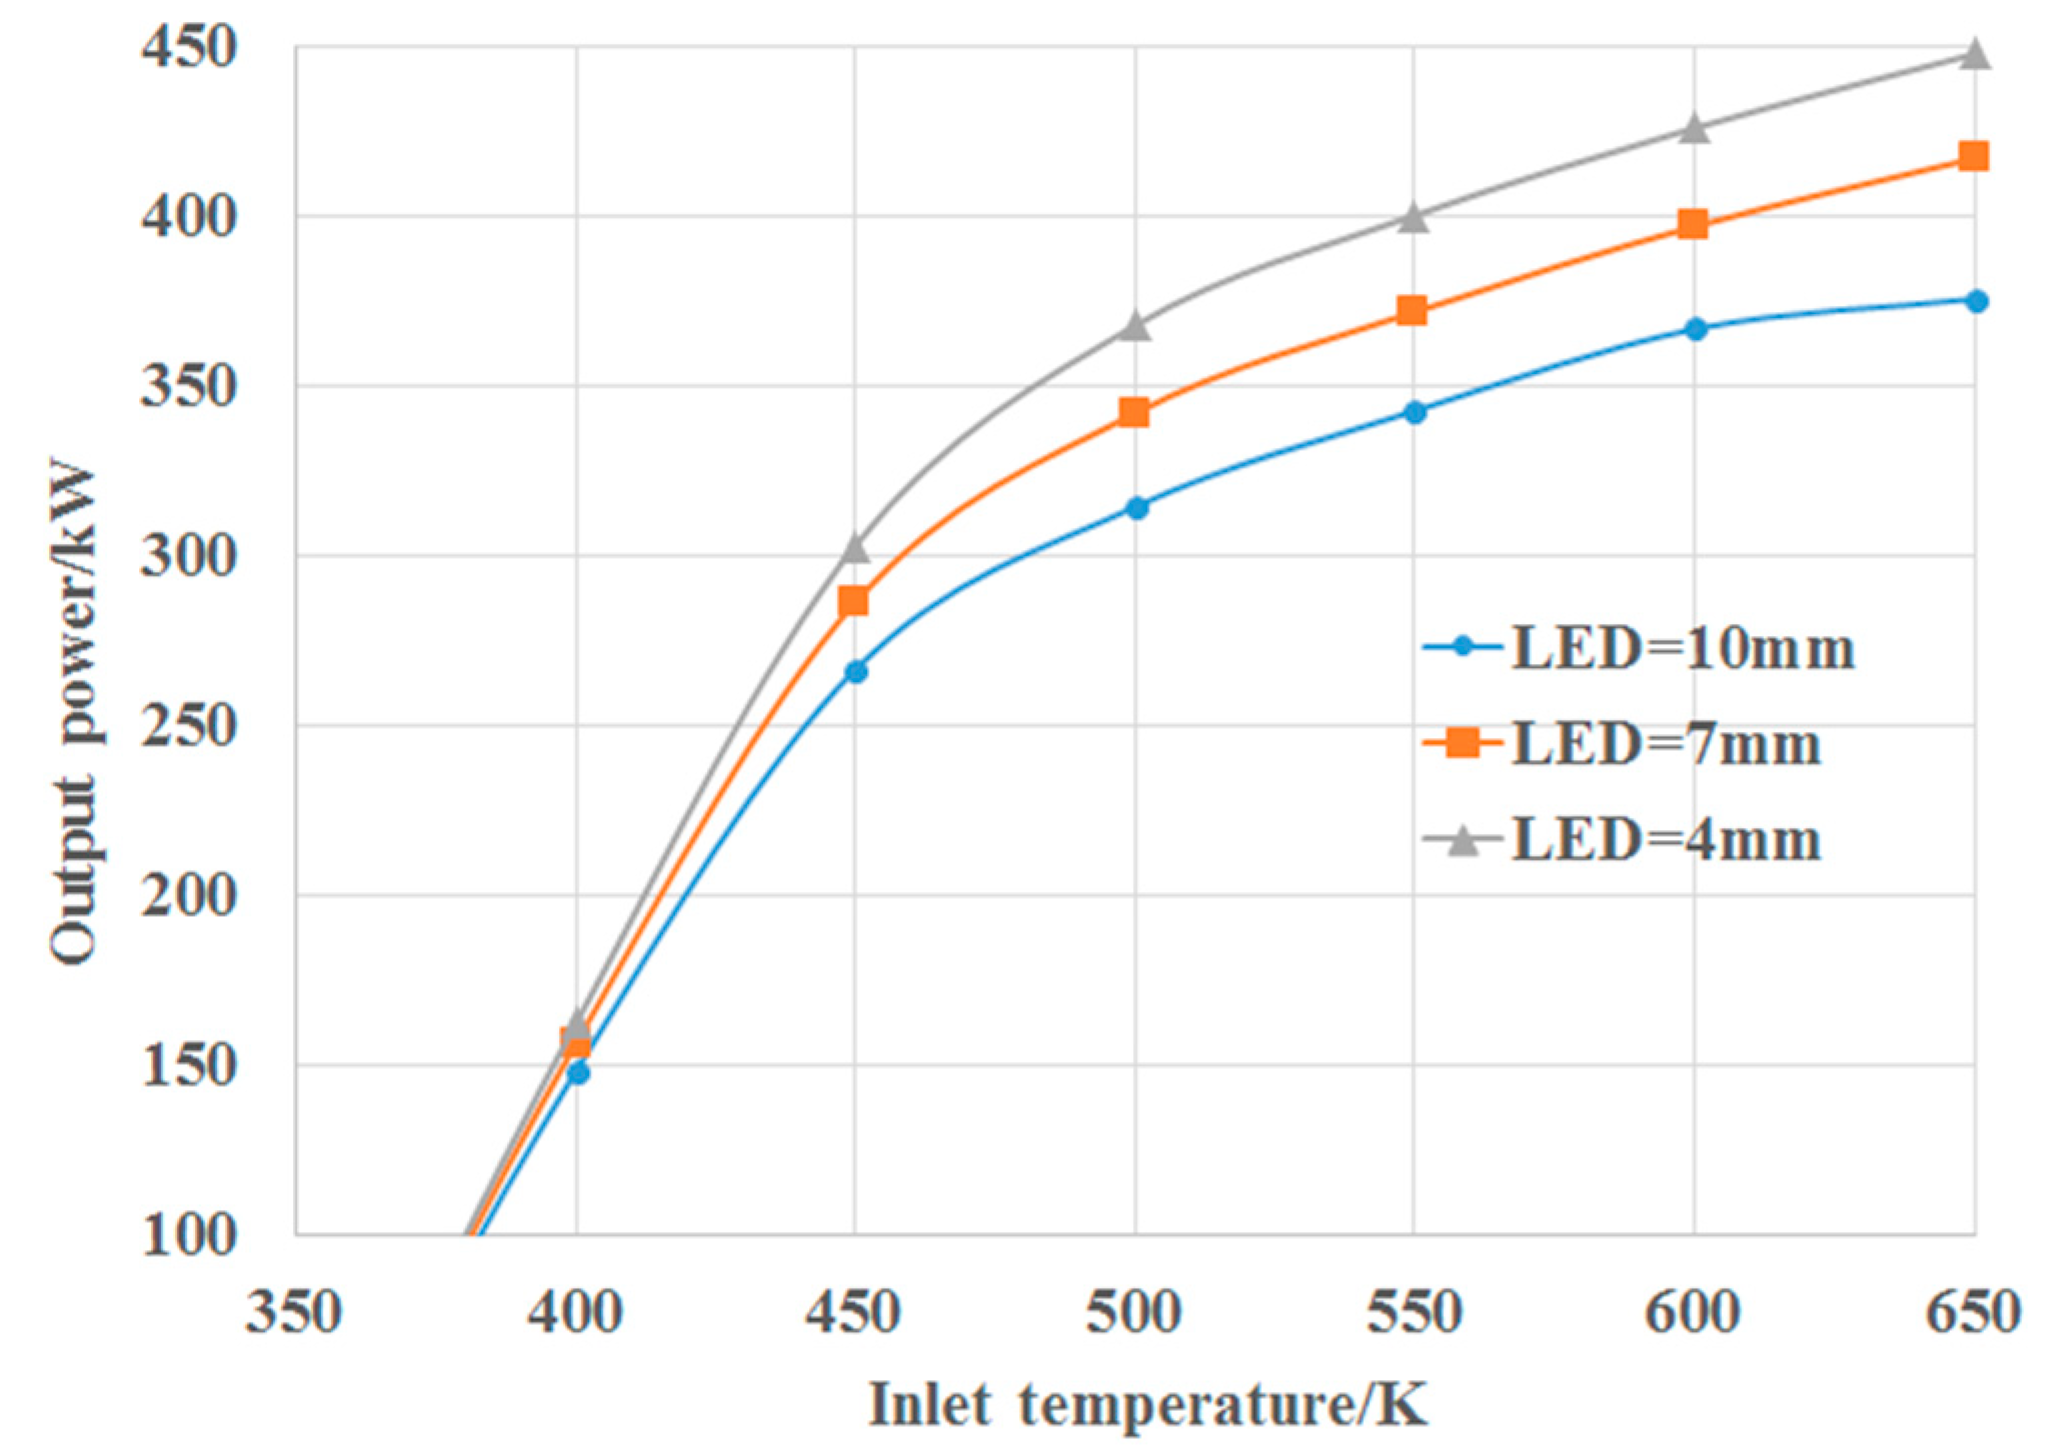
Figure 15 gives the correlation of inlet temperature towards output power.
As shown in Figure 15, the output power always increases while the inlet temperature enlarges, which is on account of the higher enthalpy drop. In the meantime, when the inlet temperature is lower than 470 K, the output power decreases rapidly with the decline of inlet temperature. The lower enthalpy drop and lower isentropic efficiency both cause this phenomenon. While the inlet temperature is larger than 470 K, the output power presents a slow growth.
Comparing three LED types, the output power of LED = 4 mm is the largest among all as it has the largest mass flow. The trend of output power variation in three LED types is similar in Figure 15. When the inlet temperature is below 400 K, the flow congestion arises and the output power of three LED types tends to be the same. While the inlet temperature passes 600 K, the absolute growing rate of LED = 10 mm is the lowest since larger LED has unfavorable flow condition with high inlet temperature.
5. Conclusions
In this paper, three types of nozzle profiles with different LED are adopted in a turbine used in CSP. Mach number, temperature and pressure distribution are covered to present the aerodynamic characteristics and the off-design effect with different nozzle profiles. Moreover, the relation of output power, mass flow rate and efficiency with different LED are analyzed. The conclusions in this research can provide a solid foundation for the usage of S-CO2 in CSP. The exact conclusions are as follows:
- (1)
- The reduction of inlet temperature has great influence on the aerodynamic performance. Taking LED = 7 mm as a representative, when the inlet temperature is below 400 K, the pressure distribution is disorderly and unsystematic, which indicates the low power capacity of the turbine.
- (2)
- Under design condition, when LED = 10 mm, the acceleration caused by the nozzle is the most effective and the turbine owns the most efficient power capacity. Meanwhile, the trans-critical area at the trailing edge of the impeller blade is the smallest. Hence, the turbine with nozzle LED = 10 mm owns the most stable operation characteristic.
- (3)
- When LED = 4 mm, the mass flow and output power is the largest since the nozzle flow passage obtains the largest flow area. For off-design conditions, when the inlet temperature further decreases below 400 K, the flow congestion arises. Comparing three different LEDs, the decrease of temperature has the lowest effect on the largest LED while the increase of temperature has the larger impact on the larger LED. When LED = 10 mm, the isentropic efficiency is slightly better while LED = 4 mm has the largest mass flow and power capacity. In a S-CO2 power system, larger mass flow rate will cause extra compression work in the compressor. Hence, for the selection of LED, one should consider both the efficiency and output power of the turbine and the compression work caused by larger mass flow rate, in order to obtain a best efficiency of the CSP power net, especially when the heat source of the net is of drastic change.
Author Contributions
D.Z. and Y.X. conceived and established the analysis method for this S-CO2 radial-inflow turbine; D.Z. performed the off-design performance investigation and obtained the conclusions. Y.W. performed the numerical experiments, analyzed the data and wrote the paper.
Funding
This research was funded by 111 project (Grant No. B16038).
Conflicts of Interest
The authors declare no conflict of interest.
References
- Gil, L.; Otin, S.F.; Embid, J.M.; Gallardo, M.A.; Blanco, S.; Artal, M.; Velasco, I. Experimental setup to measure critical properties of pure and binary mixtures and their densities at different pressures and temperatures Determination of the precision and uncertainty in the results. J. Supercrit. Fluids 2008, 44, 123–138. [Google Scholar] [CrossRef]
- Crespi, F.; Gavagnin, G.; Sanchez, D.; Martinez, G.S. Supercritical carbon dioxide cycles for power generation: A review. Appl. Energy 2017, 195, 152–183. [Google Scholar] [CrossRef]
- Mecheri, M.; Le Moullec, Y. Supercritical CO2 Brayton cycles for coal-fired power plants. Energy 2016, 103, 758–771. [Google Scholar] [CrossRef]
- Garg, P.; Kumar, P.; Srinivasan, K. Supercritical carbon dioxide Brayton cycle for concentrated solar power. J. Supercrit. Fluids 2013, 76, 54–60. [Google Scholar] [CrossRef]
- Ahn, Y.; Bae, S.J.; Kim, M.; Cho, S.K.; Baik, S.; Lee, J.I.; Cha, J.E. Review of supercritical CO2 power cycle technology and current status of research and development. Nucl. Eng. Technol. 2015, 47, 647–661. [Google Scholar] [CrossRef]
- Chen, M.-F.; Yamaguchi, H.; Zhang, X.-W.; Niu, X.-D. Performance analyses of a particularly designed turbine for a supercritical CO2-based solar Rankine cycle system. Int. J. Energy Res. 2015, 39, 1819–1827. [Google Scholar] [CrossRef]
- Osorio, J.D.; Hovsapian, R.; Ordonez, J.C. Dynamic analysis of concentrated solar supercritical CO2-based power generation closed-loop cycle. Appl. Therm. Eng. 2016, 93, 920–934. [Google Scholar] [CrossRef]
- Luu, M.T.; Milani, D.; McNaughton, R.; Abbas, A. Analysis for flexible operation of supercritical CO2 Brayton cycle integrated with solar thermal systems. Energy 2017, 124, 752–771. [Google Scholar] [CrossRef]
- Monje, B.; Sanchez, D.; Savill, M.; Pilidis, P.; Sanchez, T.; ASME. A Design Strategy for Supercritical CO2 Compressors; V03bt36a003; American Society of Mechanical Engineers: New York, NY, USA, 2014. [Google Scholar]
- Lopez, A.; Monje, B.; Sanchez, D.; Chacartegul, R.; Sanchez, T.; ASME. Effect of Turbulence and Flow Distortion on the Performance of Conical Diffusers Operating on Supercritical Carbon Dioxide; V008t34a002; American Society of Mechanical Engineers: New York, NY, USA, 2013. [Google Scholar]
- Valdes, M.; Abbas, R.; Rovira, A.; Martin-Aragon, J. Thermal efficiency of direct, inverse and sCO2 gas turbine cycles intended for small power plants. Energy 2016, 100, 66–72. [Google Scholar] [CrossRef]
- Zhang, H.Z.; Zhao, H.; Deng, Q.H.; Feng, Z.P.; ASME. Aerothermodynamic Design and Numerical Investigation of Supercritical Carbon Dioxide Turbine; UNSP v009t36a007; American Society of Mechanical Engineers: New York, NY, USA, 2015. [Google Scholar]
- Wang, X.R.; Wang, J.F.; Zhao, P.; Dai, Y.P. Thermodynamic Comparison and Optimization of Supercritical CO2 Brayton Cycles with a Bottoming Transcritical CO2 Cycle. J. Energy Eng. ASCE 2016, 142. [Google Scholar] [CrossRef]
- Iverson, B.D.; Conboy, T.M.; Pasch, J.J.; Kruizenga, A.M. Supercritical CO2 Brayton cycles for solar-thermal energy. Appl. Energy 2013, 111, 957–970. [Google Scholar] [CrossRef]
- Binotti, M.; Astolfi, M.; Campanari, S.; Manzolini, G.; Silva, P. Preliminary assessment of sCO2 power cycles for application to CSP Solar Tower plants. In Proceedings of the 8th International Conference on Applied Energy, Beijing, China, 8–11 October 2016; Yan, J., Sun, F., Chou, S.K., Desideri, U., Li, H., Campana, P., Xiong, R., Eds.; Elsevier Science BV: Amsterdam, The Netherlands, 2016; Volume 105, pp. 1116–1122. [Google Scholar]
- Kouta, A.; Al-Sulaiman, F.A.; Atif, M. Energy analysis of a solar driven cogeneration system using supercritical CO2 power cycle and MEE-TVC desalination system. Energy 2017, 119, 996–1009. [Google Scholar] [CrossRef]
- Hakkarainen, E.; Sihvonen, T.; Lappalainen, J. Dynamic Modelling and Simulation of CSP Plant Based on Supercritical Carbon Dioxide Closed Brayton Cycle. In International Conference on Concentrating Solar Power and Chemical Energy Systems; AlObaidli, A., Calvet, N., Richter, C., Eds.; American Institute of Physics: Melville, NY, USA, 2017; Volume 1850. [Google Scholar]
- Shi, D.B.; Li, L.L.; Zhang, Y.Y.; Xie, Y.H. Thermodynamic Design and Aerodynamic Analysis of Supercritical Carbon Dioxide Turbine. In Proceedings of the 2015 International Conference on Electromechanical Control Technology and Transportation, Zhuhai, China, 31 October–1 November 2015; Shyu, Y.H., Zhang, Y., Eds.; Atlantis Press: Paris, France, 2015; Volume 41, pp. 41–44. [Google Scholar]
- Menter, F.R. 2-Equation eddy-viscosity turbulence models for engineering applications. AIAA J. 1994, 32, 1598–1605. [Google Scholar] [CrossRef]
- Daabo, A.M.; Al Jubori, A.; Mahmoud, S.; Al-Dadah, R.K. Development of three-dimensional optimization of a small-scale radial turbine for solar powered Brayton cycle application. Appl. Therm. Eng. 2017, 111, 718–733. [Google Scholar] [CrossRef]
- Kim, S.G.; Lee, J.; Ahn, Y.; Lee, J.I.; Addad, Y.; Ko, B. CFD investigation of a centrifugal compressor derived from pump technology for supercritical carbon dioxide as a working fluid. J. Supercrit. Fluids 2014, 86, 160–171. [Google Scholar] [CrossRef]
- Odabaee, M.; Sauret, E.; Hooman, K. CFD Simulation of a Supercritical Carbon Dioxide Radial-Inflow Turbine, Comparing the Results of Using Real Gas Equation of Estate and Real Gas Property File. Appl. Mech. Mater. 2016, 846, 85–90. [Google Scholar] [CrossRef]
Figure 1.
Structure of impeller.
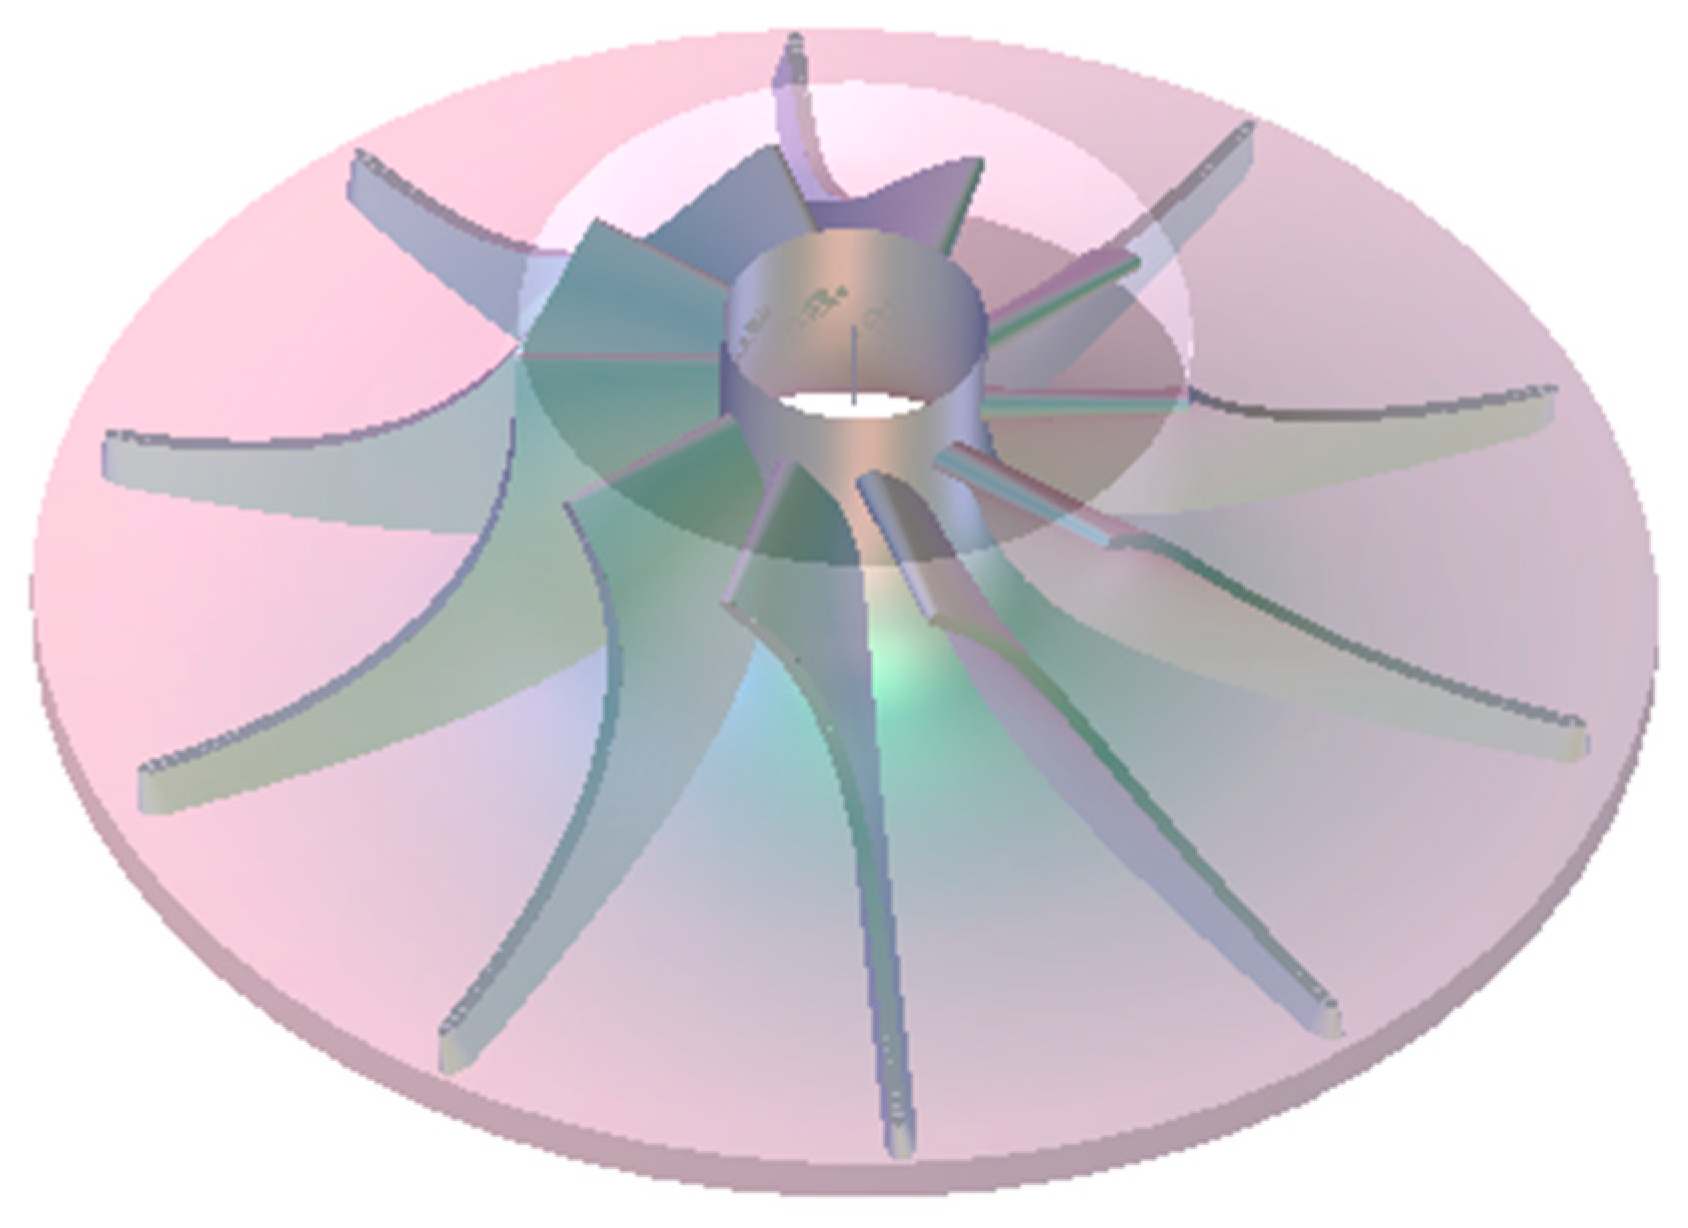
Figure 2.
Nozzle profile: (a) LED = 10 mm; (b) LED = 7 mm; (c) LED = 4 mm.

Figure 3.
Phase diagram of CO2.
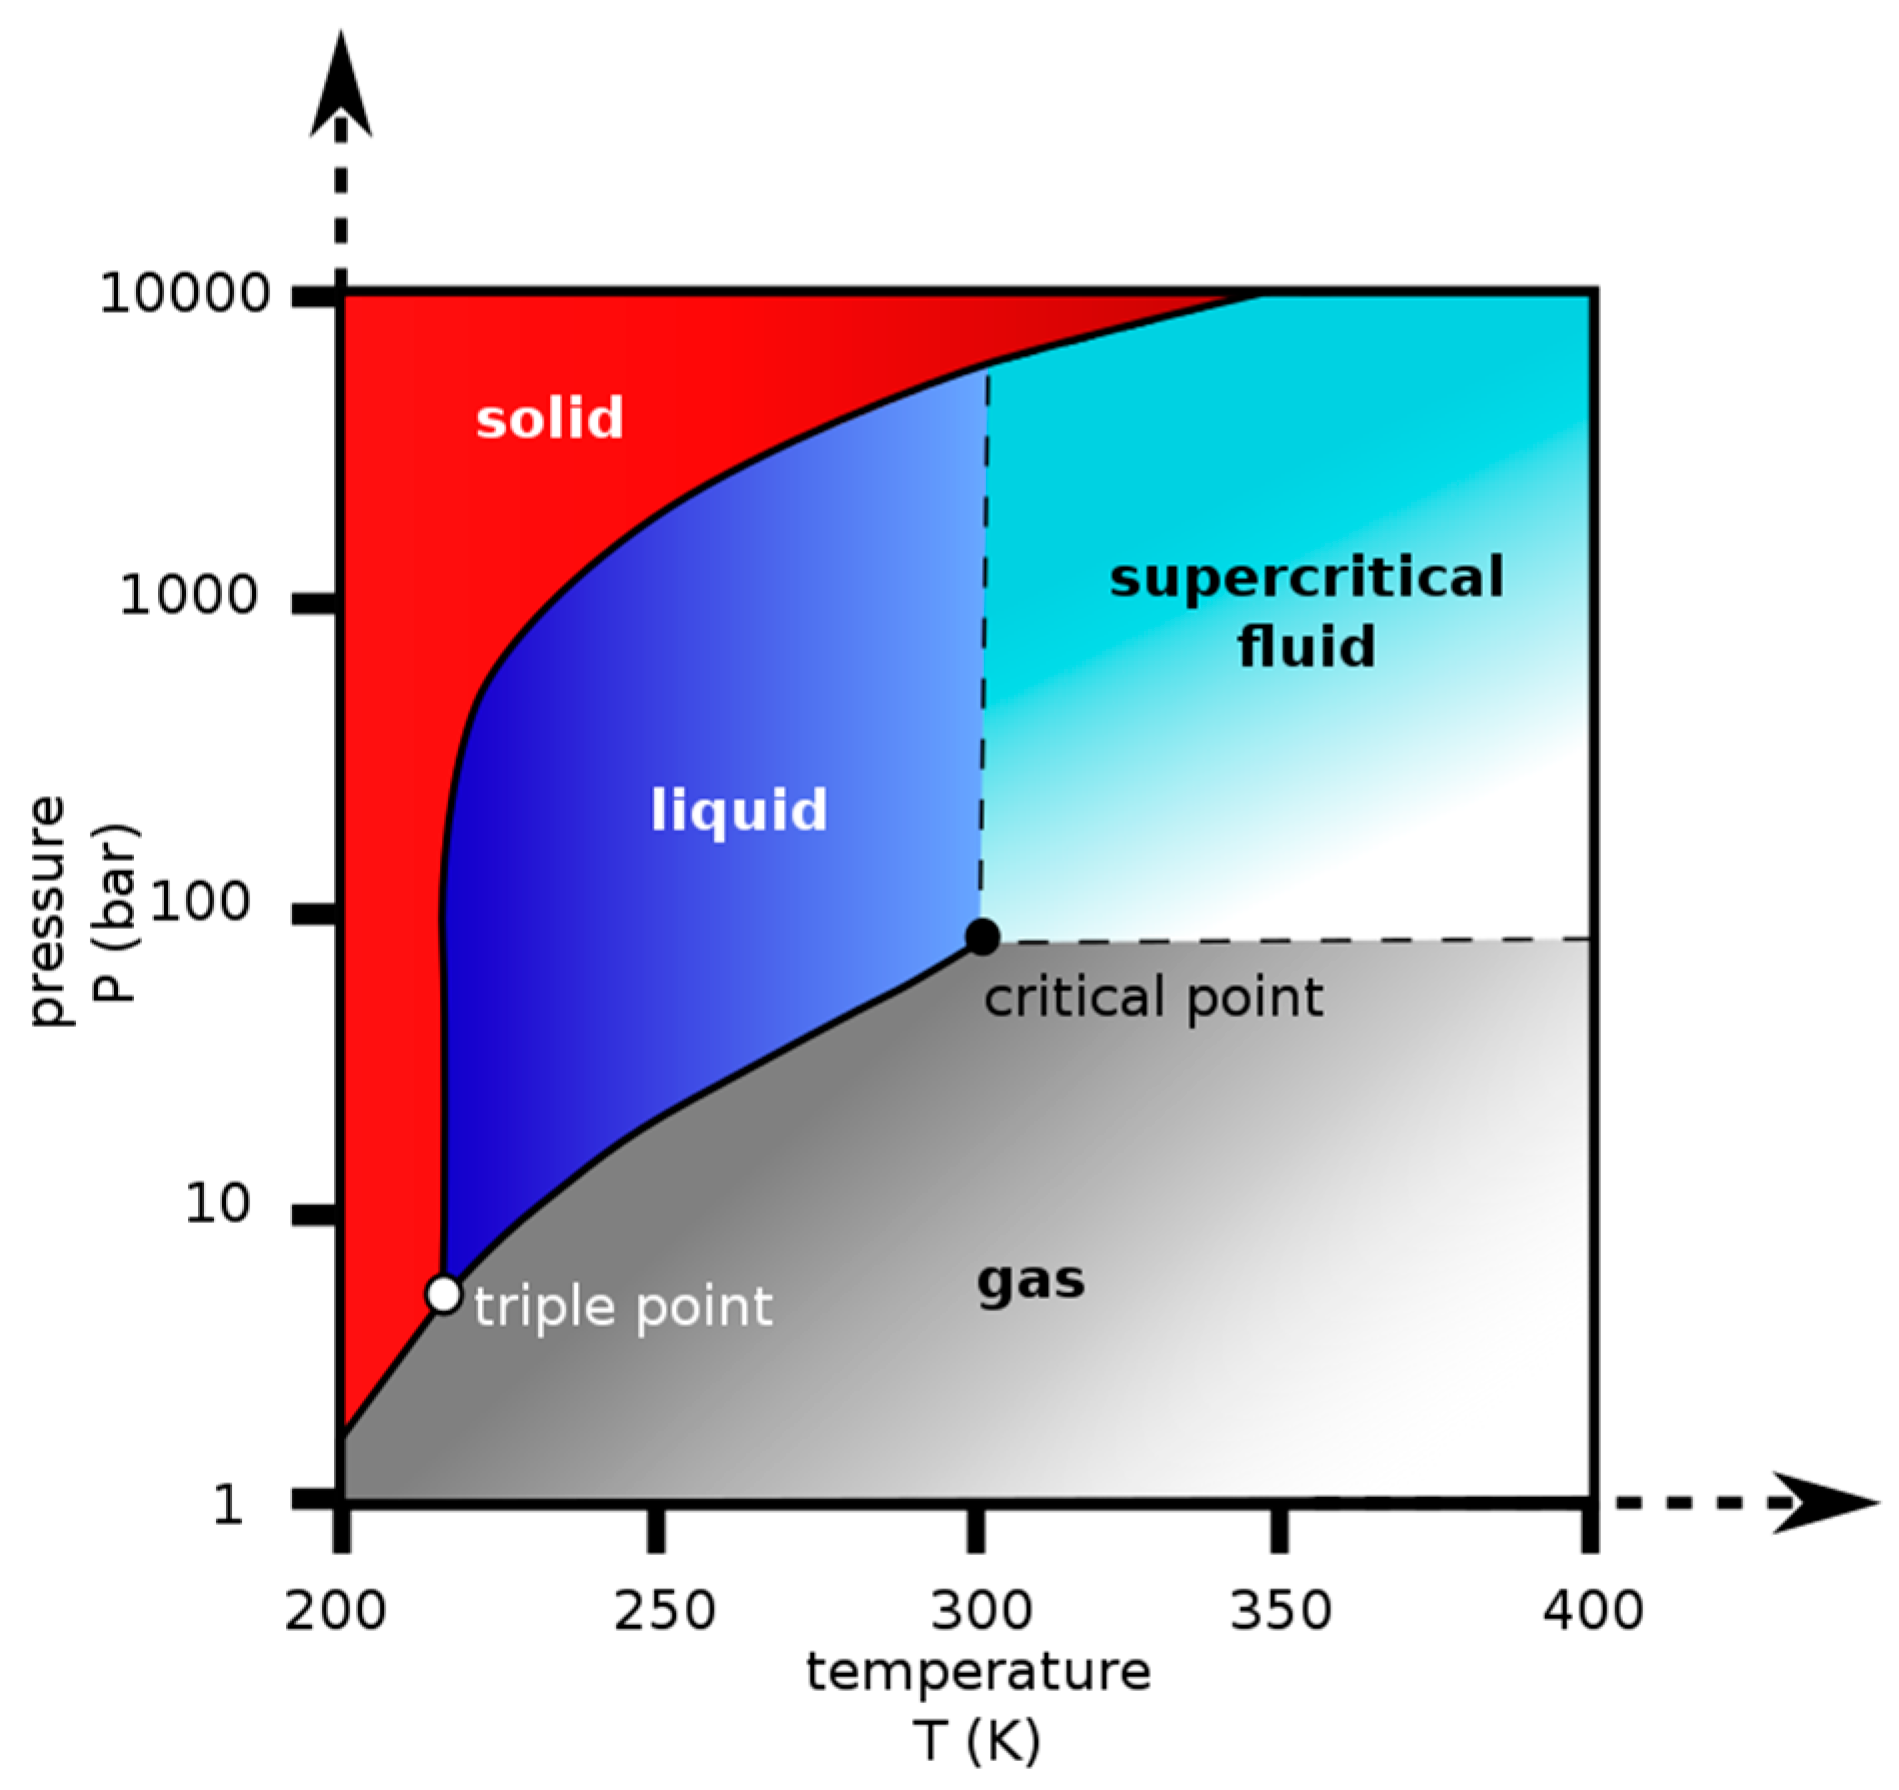
Figure 4.
Density variation with temperature and pressure 3.3. Numerical validation.
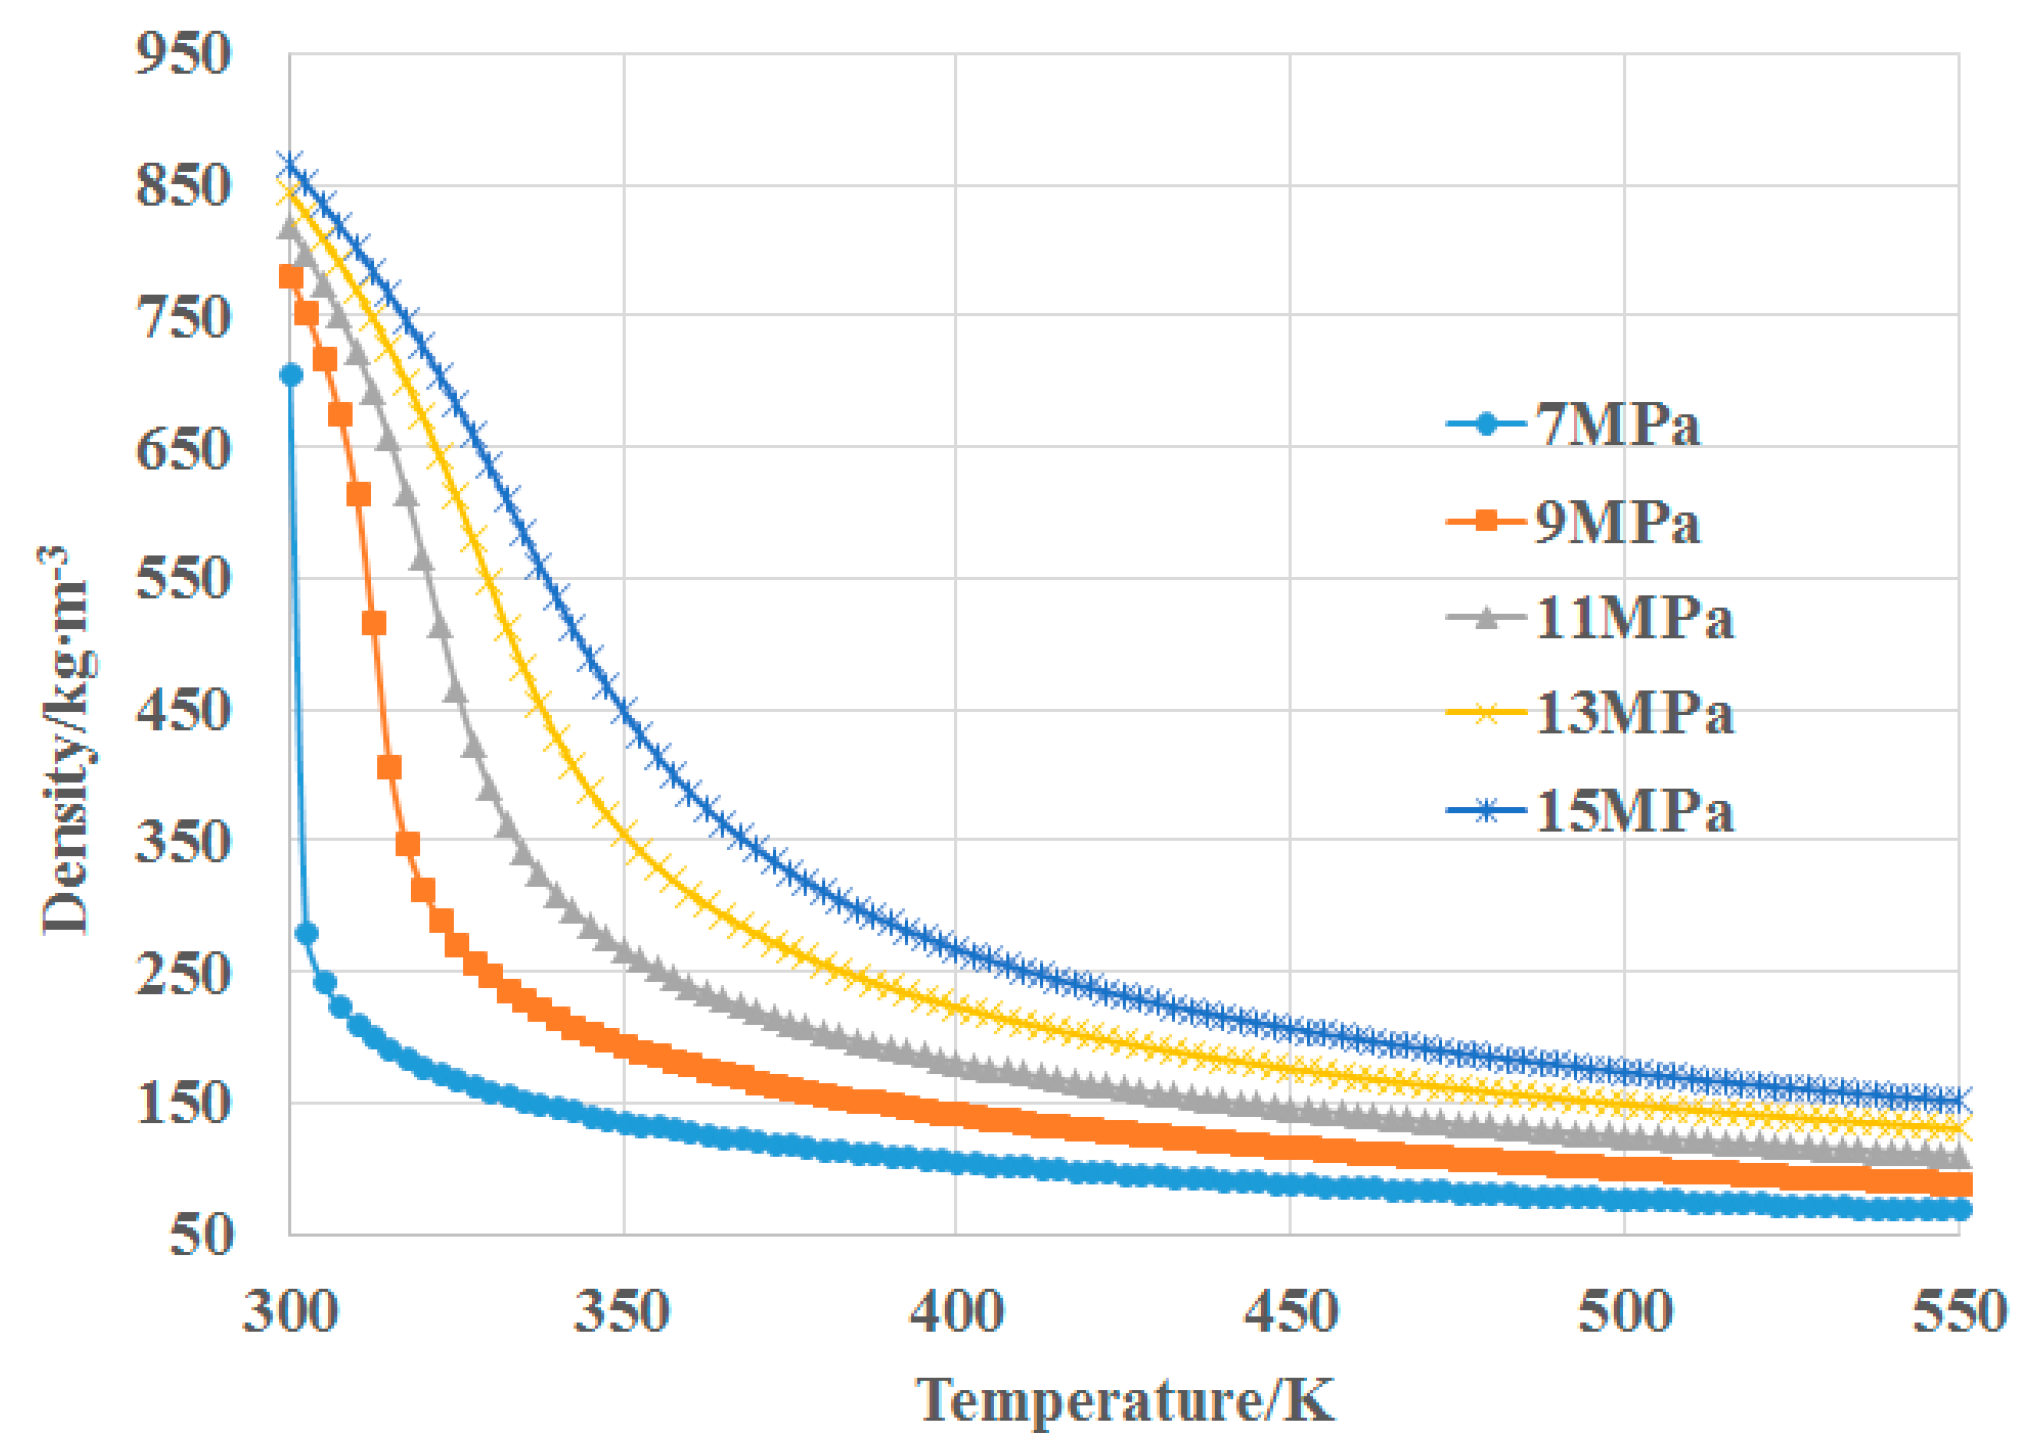
Figure 5.
Mesh of impeller.

Figure 6.
Mesh of three types of nozzle: (a) LED = 10 mm; (b) LED = 7 mm; (c) LED = 4 mm.

Figure 7.
Pressure contours with vectors at the mid-span when LED = 4 mm: (a) Tin = 400 K; (b) Tin = 450 K; (c) Tin = 550 K; (d) Tin = 650 K.
Figure 7.
Pressure contours with vectors at the mid-span when LED = 4 mm: (a) Tin = 400 K; (b) Tin = 450 K; (c) Tin = 550 K; (d) Tin = 650 K.
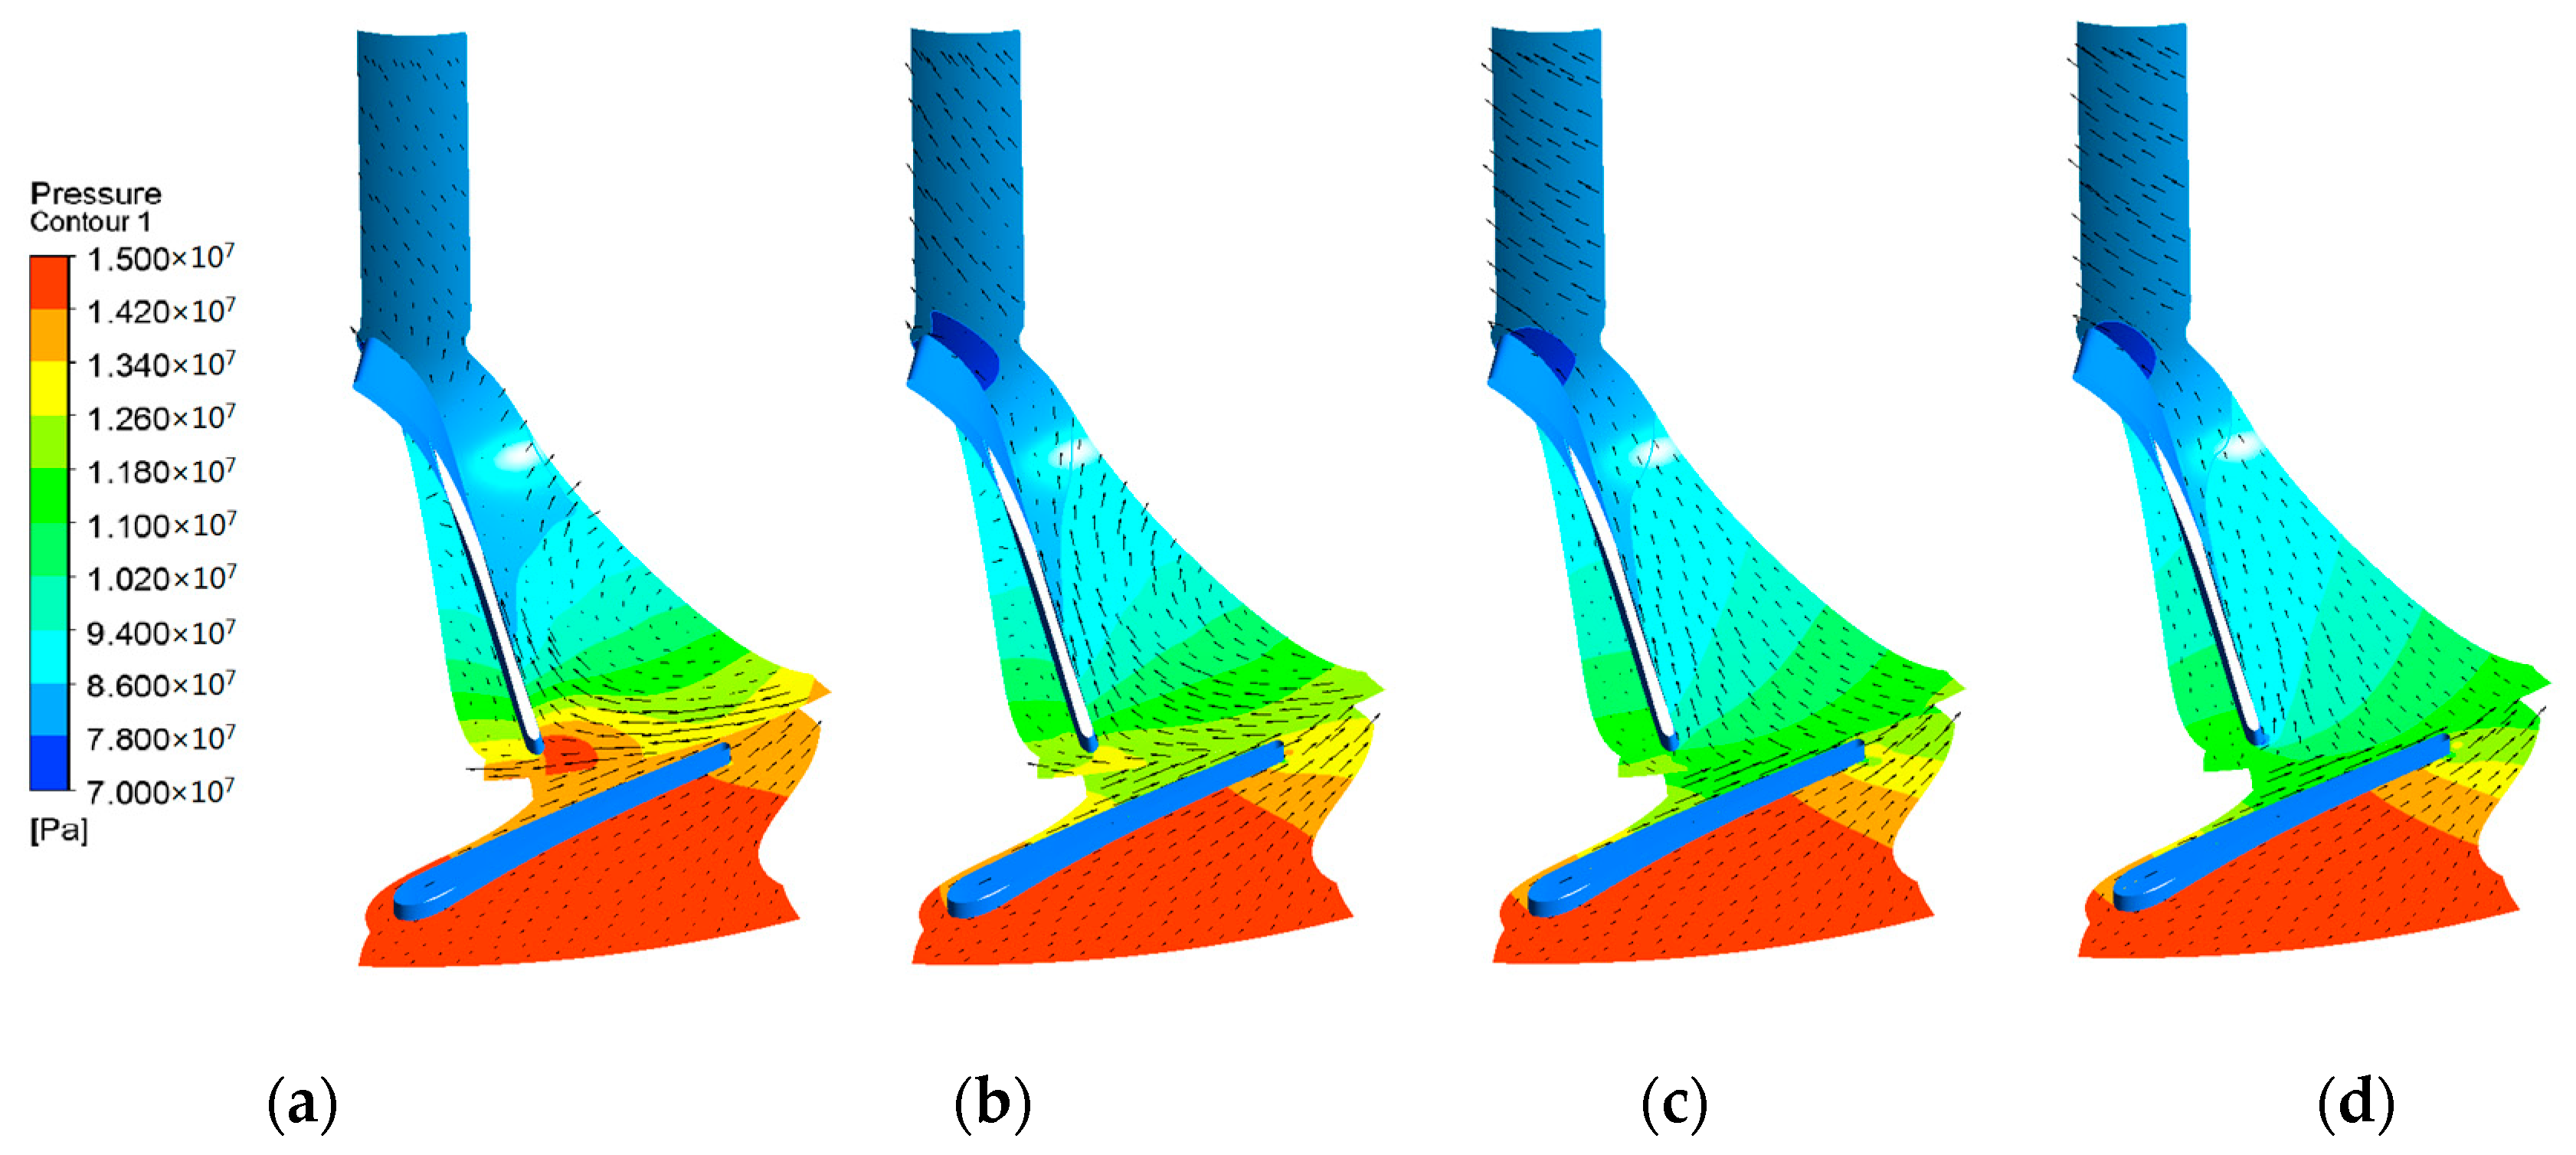
Figure 8.
Pressure contours with vectors at the mid-span when LED = 7 mm: (a) Tin = 400 K; (b) Tin = 450 K; (c) Tin = 550 K; (d) Tin = 650K.
Figure 8.
Pressure contours with vectors at the mid-span when LED = 7 mm: (a) Tin = 400 K; (b) Tin = 450 K; (c) Tin = 550 K; (d) Tin = 650K.
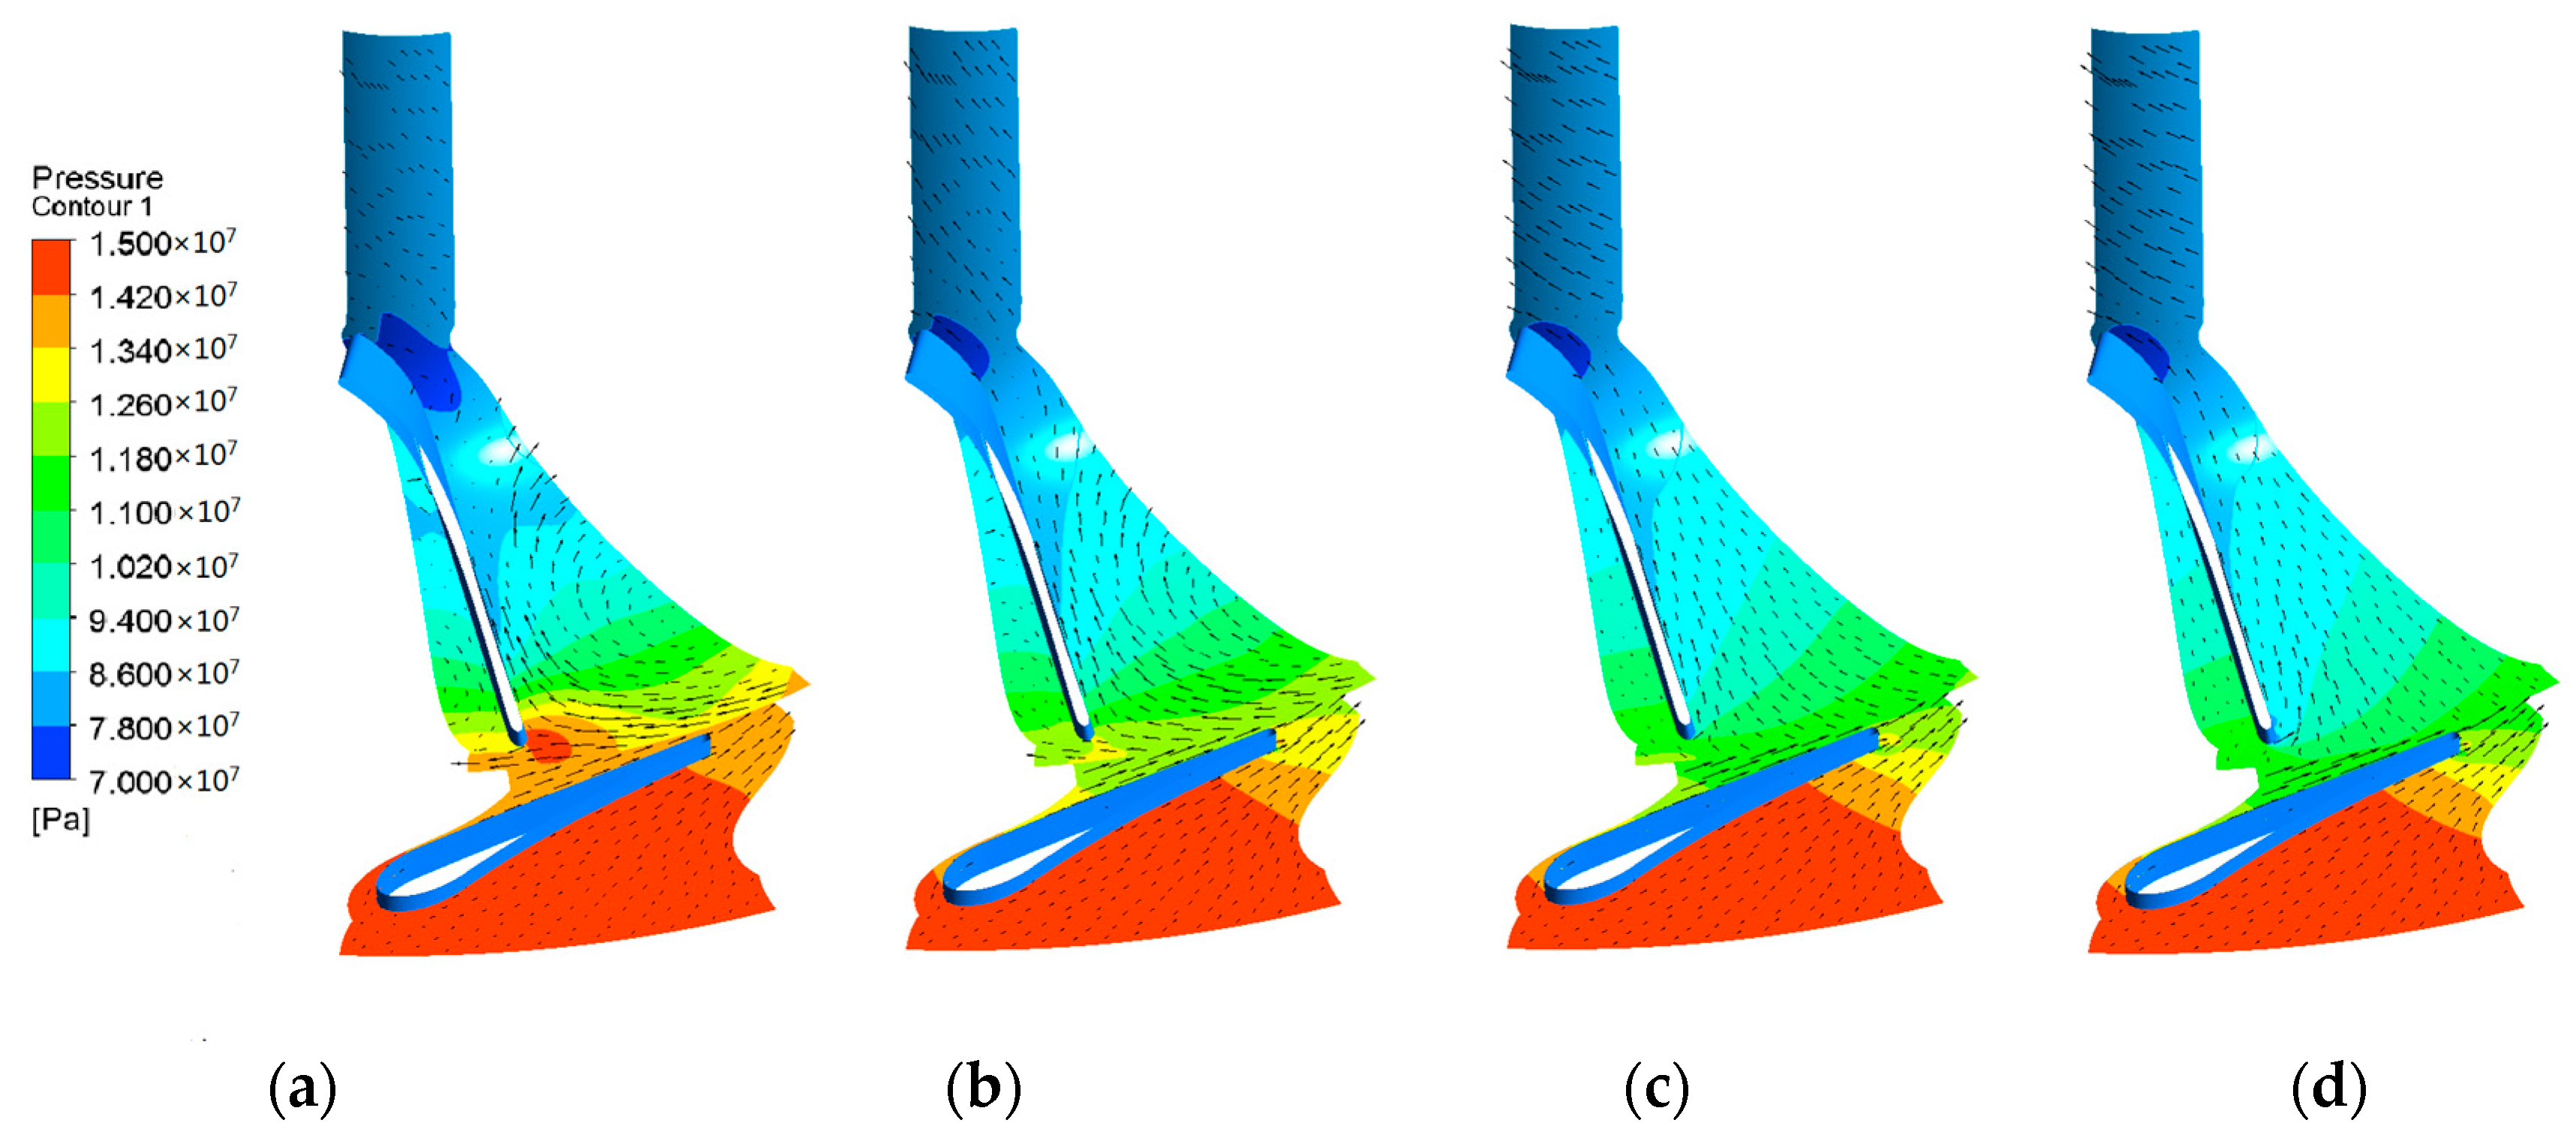
Figure 9.
Pressure contours with vectors at the mid-span when LED = 10 mm: (a) Tin = 400 K; (b) Tin = 450 K; (c) Tin = 550 K; (d) Tin = 650 K.
Figure 9.
Pressure contours with vectors at the mid-span when LED = 10 mm: (a) Tin = 400 K; (b) Tin = 450 K; (c) Tin = 550 K; (d) Tin = 650 K.
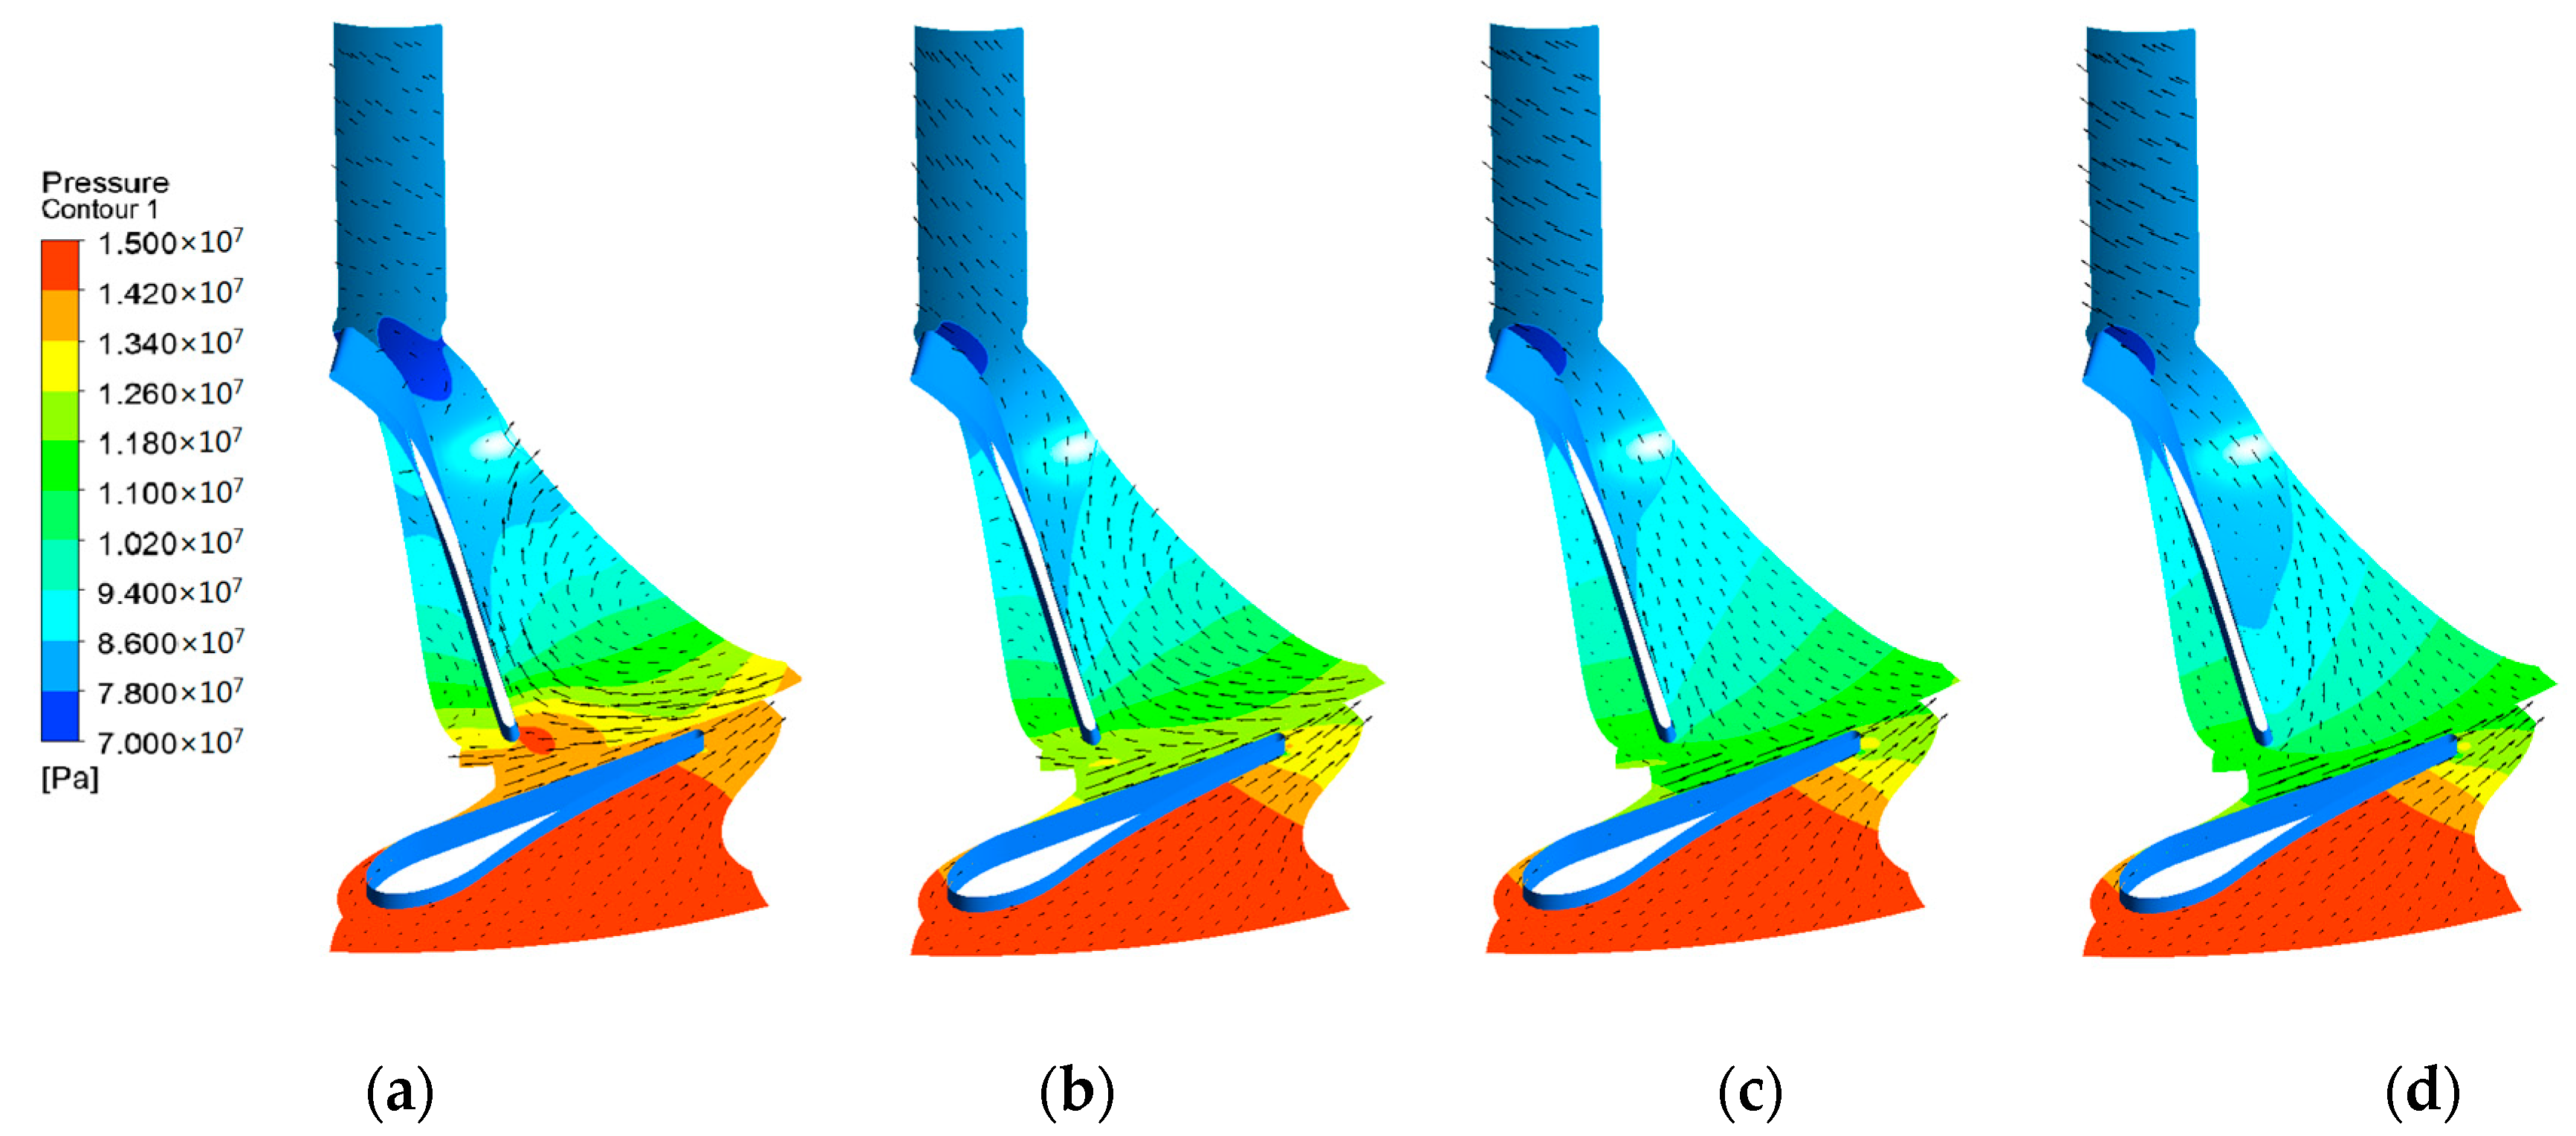
Figure 10.
Mach number contours at the mid-span of impeller and nozzle: (a) LED = 10 mm; (b) LED = 7 mm; (c) LED = 4 mm.
Figure 10.
Mach number contours at the mid-span of impeller and nozzle: (a) LED = 10 mm; (b) LED = 7 mm; (c) LED = 4 mm.
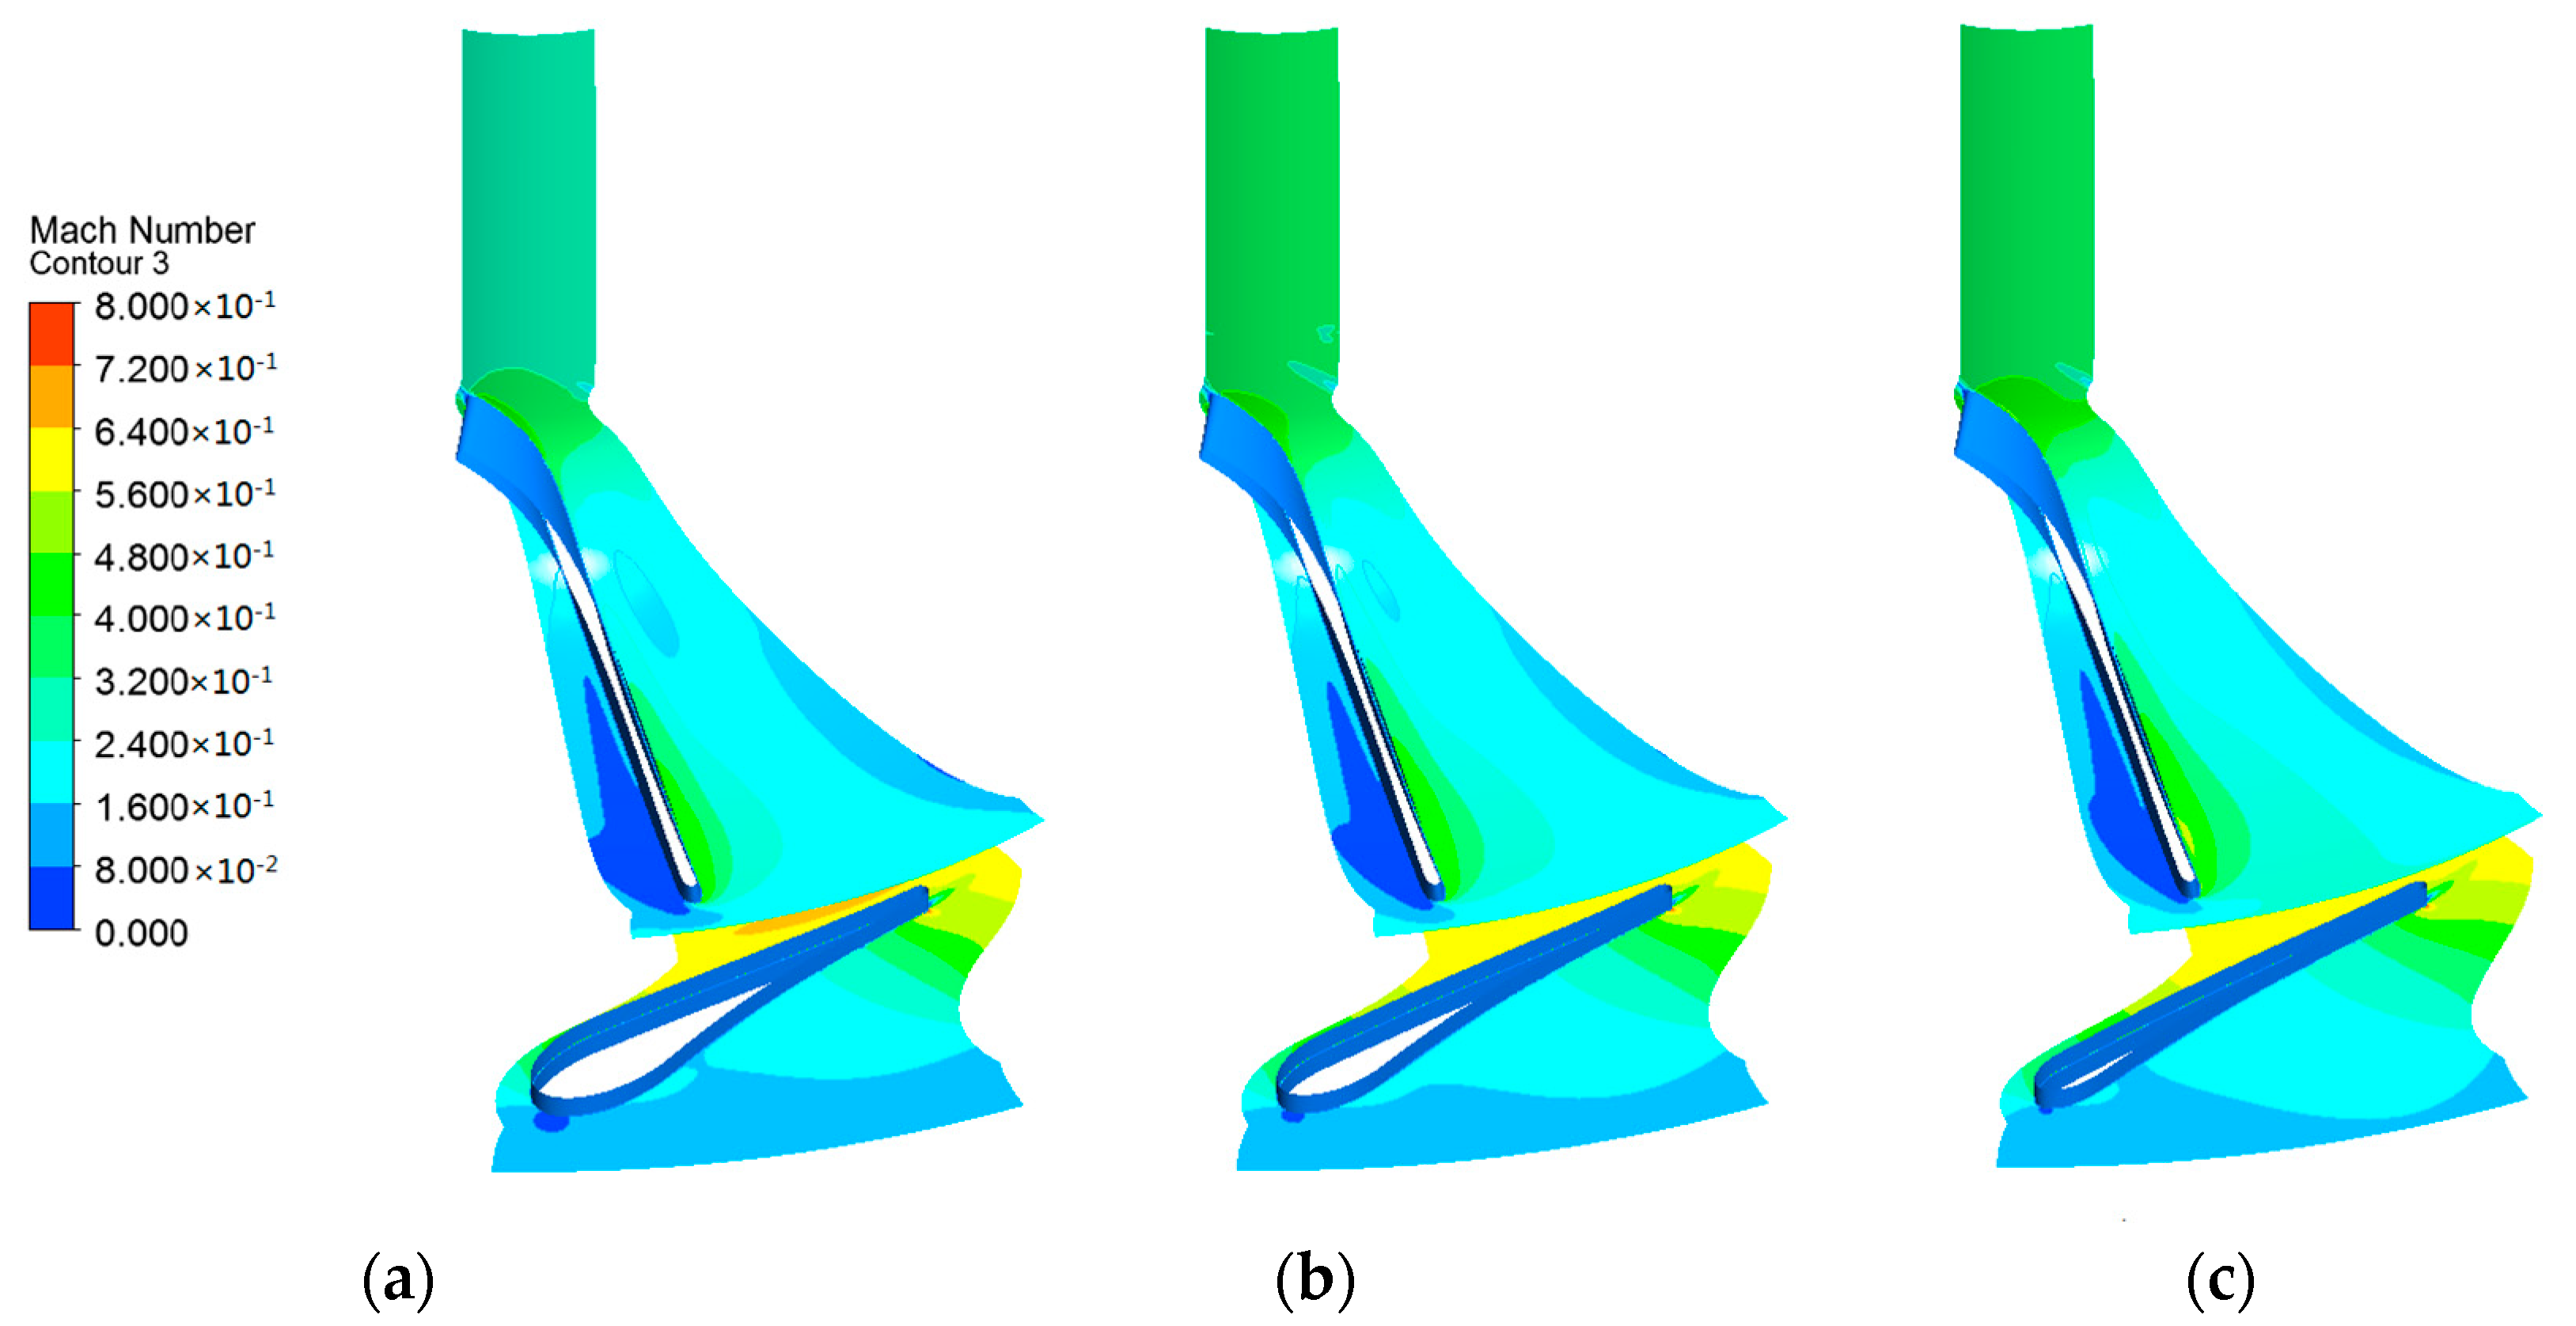
Figure 11.
Pressure contours at the mid-span of the impeller and nozzle: (a) LED = 10 mm; (b) LED = 7 mm; (c) LED = 4 mm.
Figure 11.
Pressure contours at the mid-span of the impeller and nozzle: (a) LED = 10 mm; (b) LED = 7 mm; (c) LED = 4 mm.
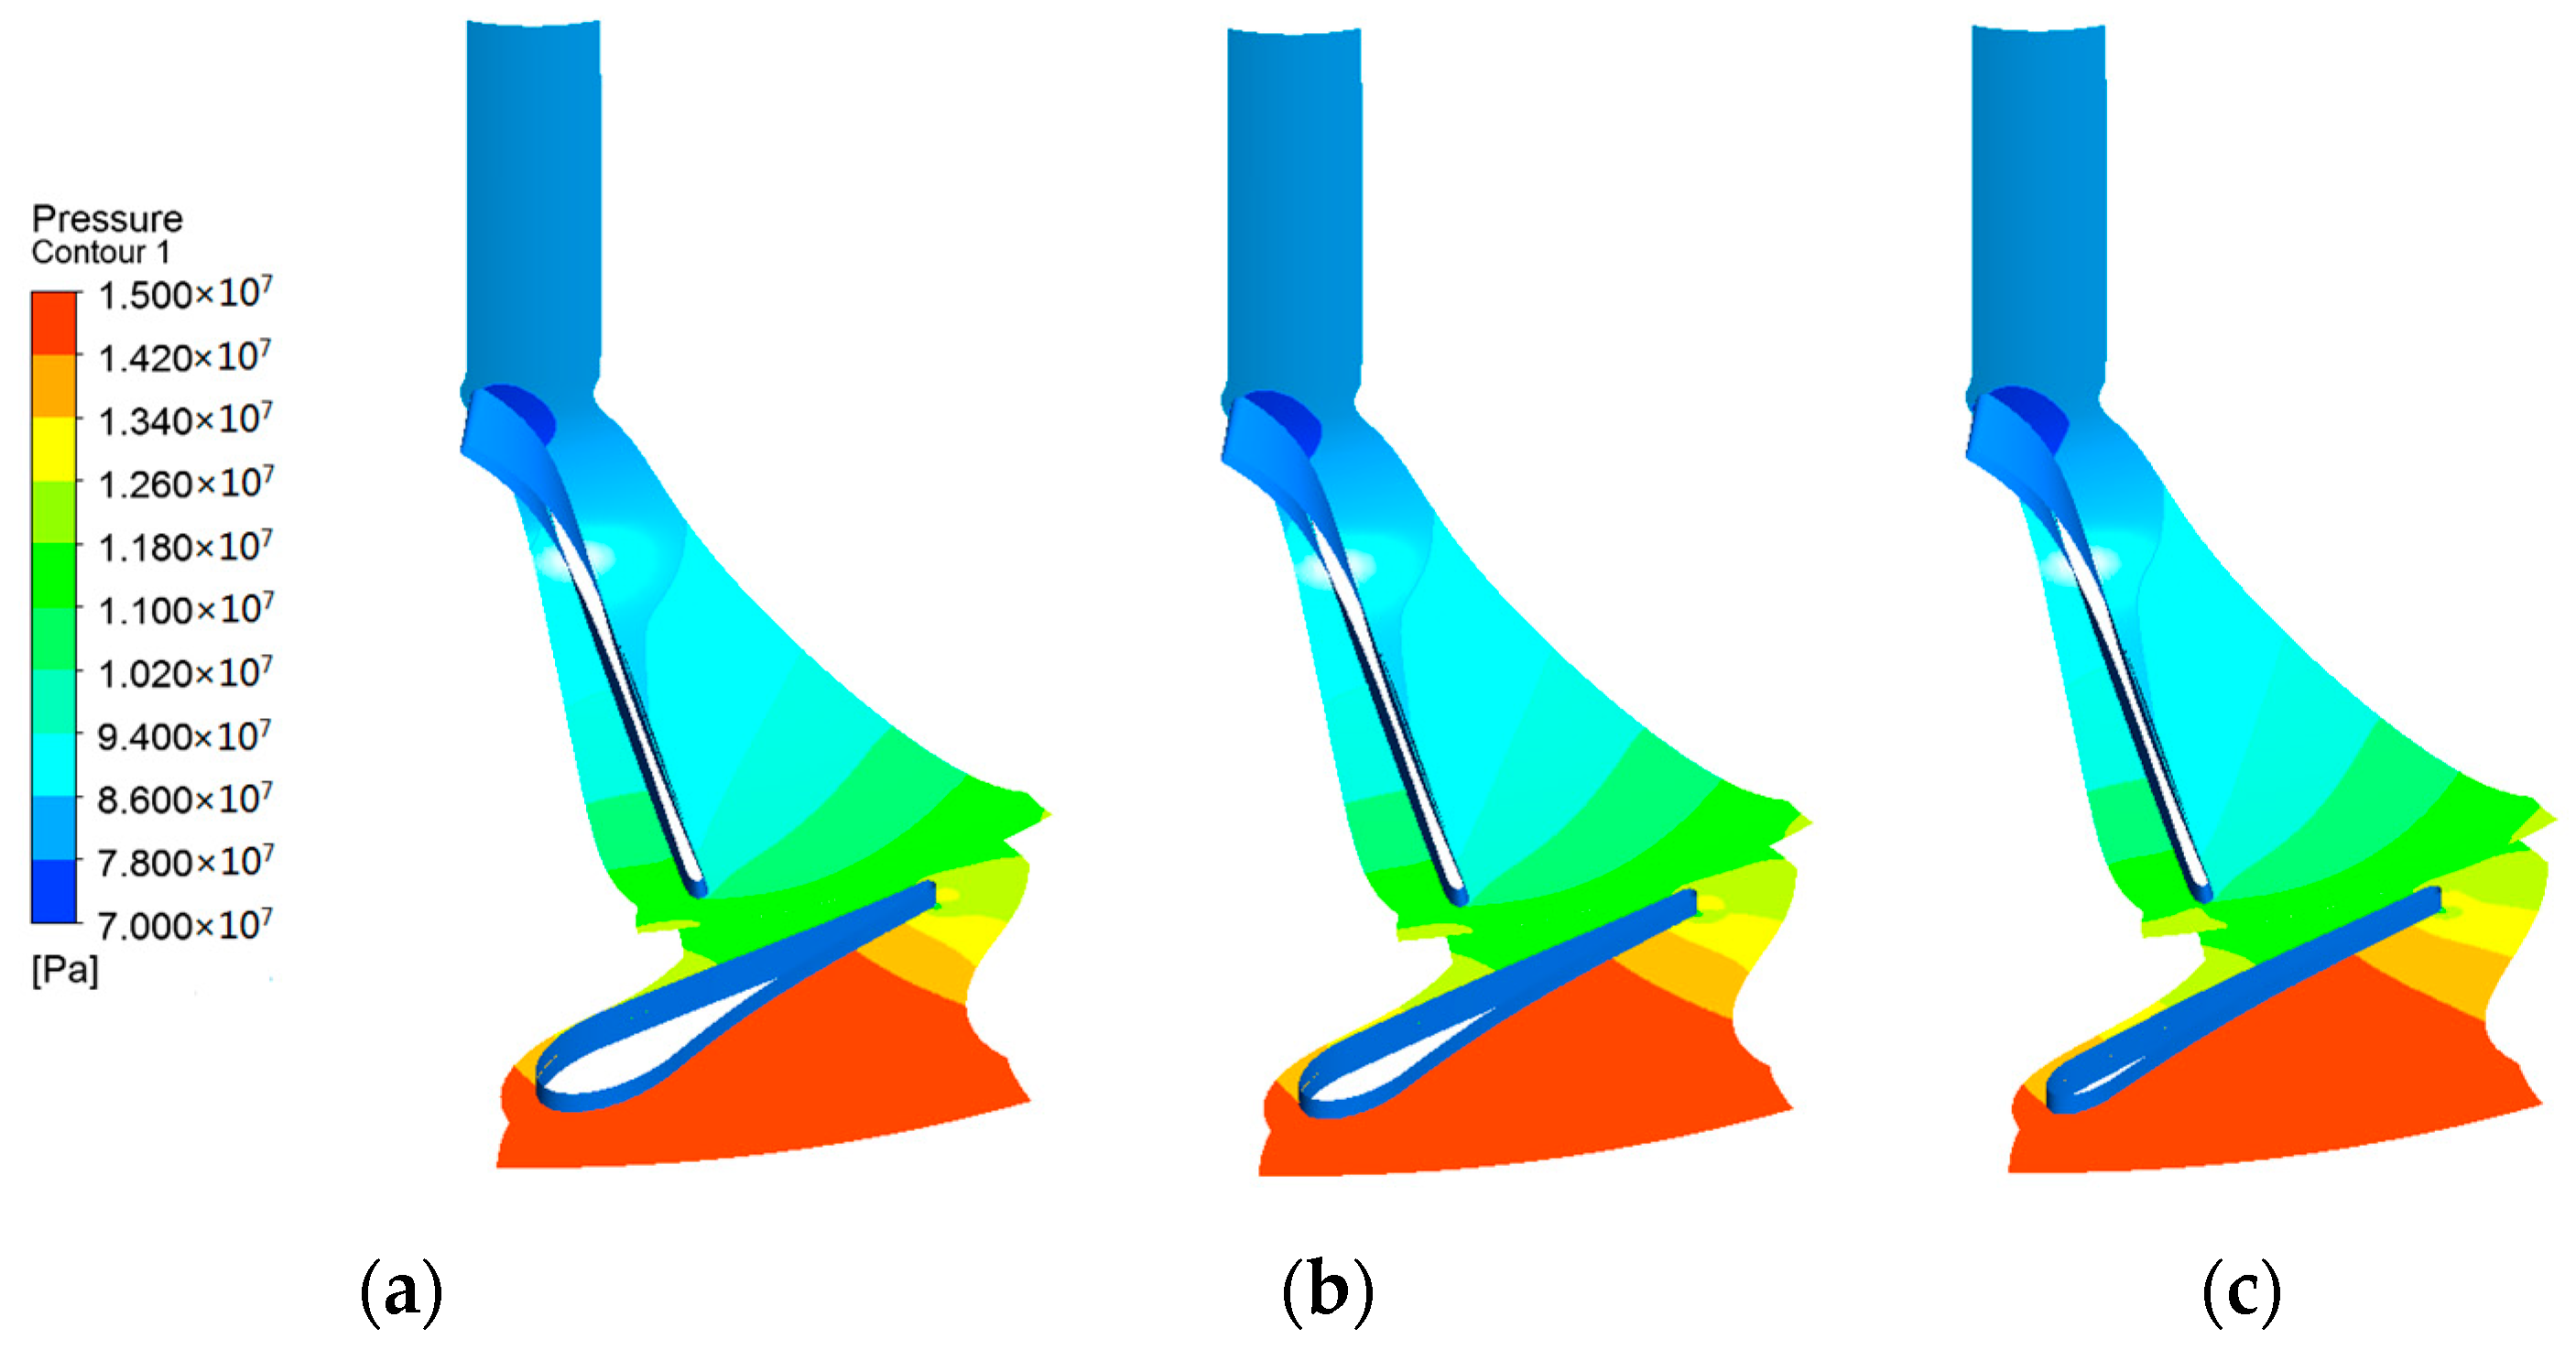
Figure 12.
Temperature contours at the mid-span of the impeller and nozzle: (a) LED = 10 mm; (b) LED = 7 mm; (c) LED = 4 mm.
Figure 12.
Temperature contours at the mid-span of the impeller and nozzle: (a) LED = 10 mm; (b) LED = 7 mm; (c) LED = 4 mm.
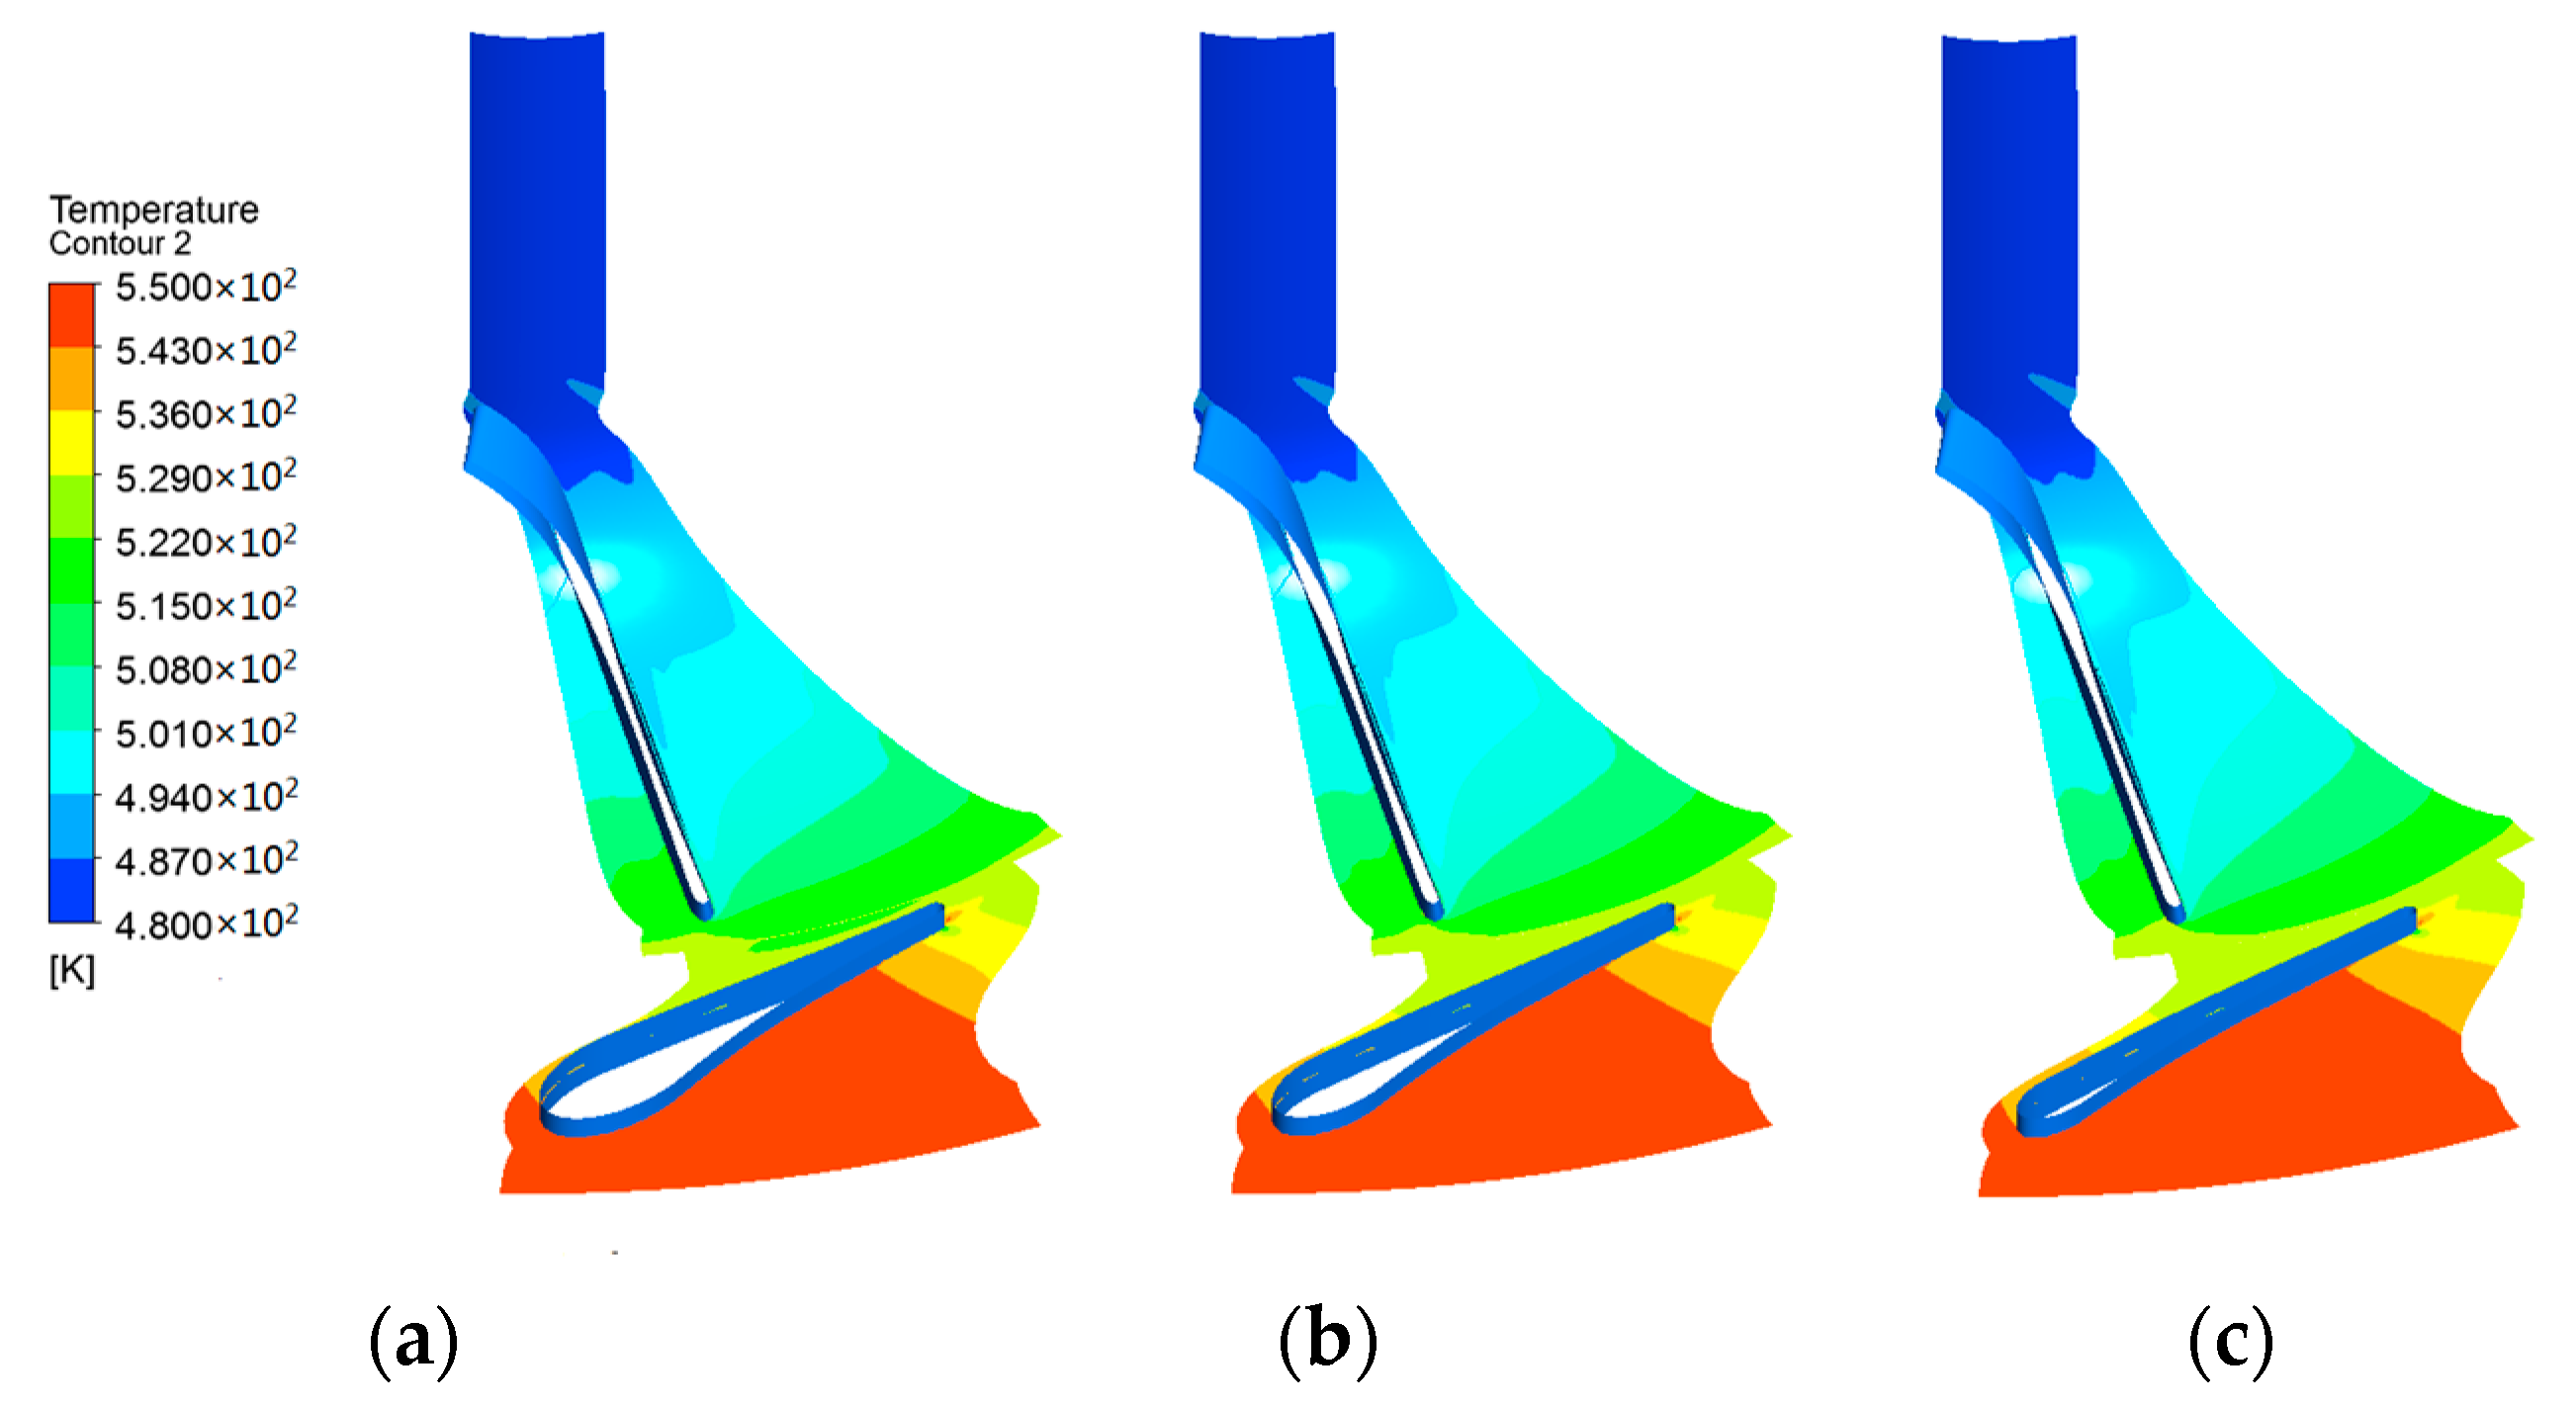
Figure 13.
Correlation of inlet temperature towards isentropic efficiency.
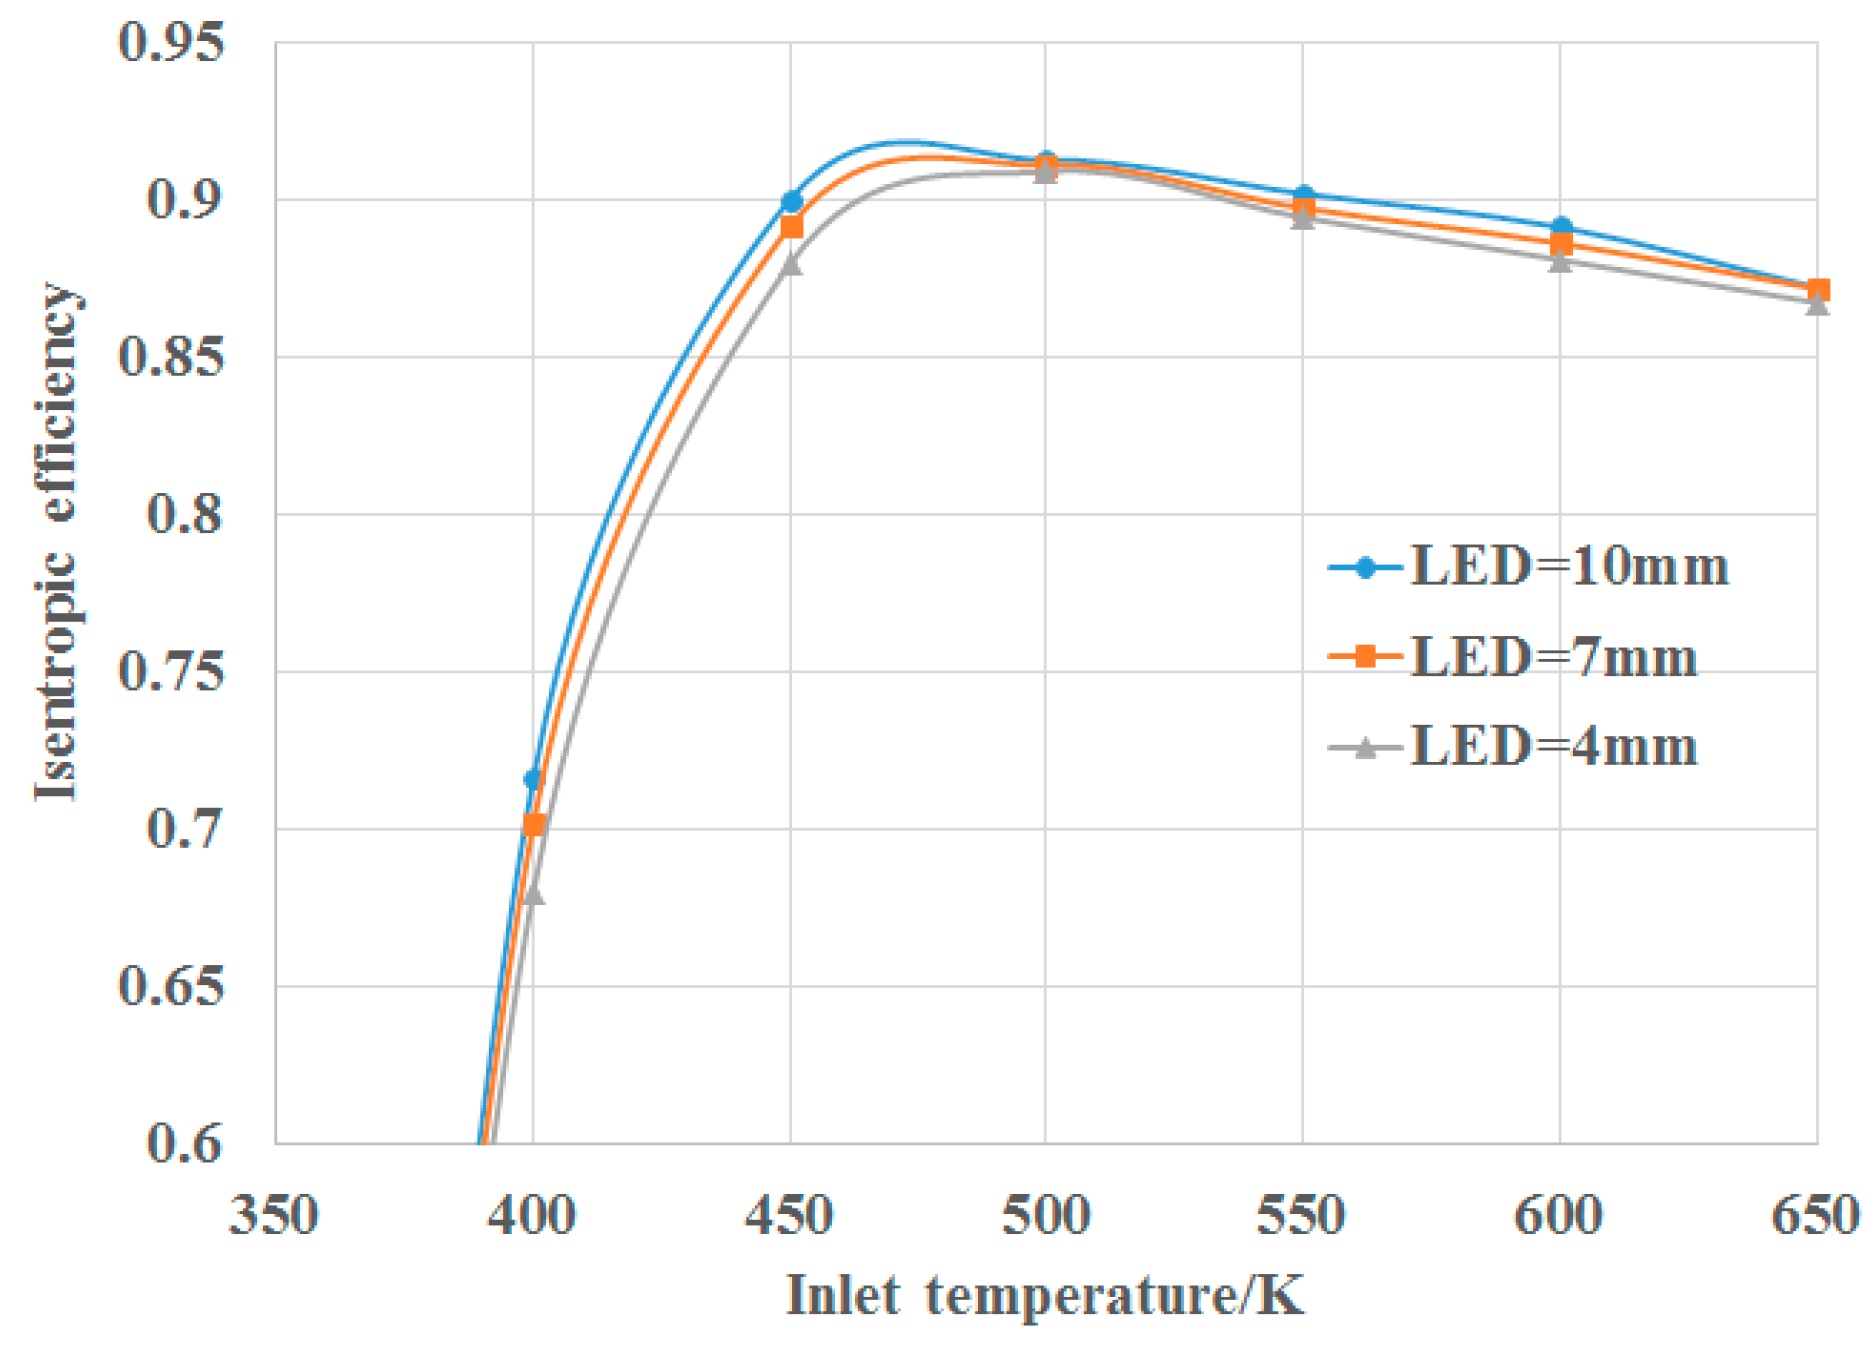
Figure 14.
Correlation of inlet temperature towards mass flow.

Figure 15.
Correlation of inlet temperature towards output power.


Table 1.
Detailed geometric parameters of impeller.
| Parameter | Value |
|---|---|
| Blade number | 10 |
| Diameter of impeller (mm) | 92.2 |
| Inlet blade height (mm) | 2.97 |
| External diameter of outlet (mm) | 40.6 |
| Inner Diameter of outlet (mm) | 16 |
| Outlet blade angle (°) | 27 |
| Axial length (mm) | 20 |
| Impeller type | shrouded |
Table 2.
Detailed geometric parameters of nozzle.
| Parameter | Value |
|---|---|
| Blade number | 13 |
| Outlet diameter (mm) | 136.2 |
| Inlet diameter (mm) | 104.2 |
| Blade height (mm) | 2.97 |
| Inlet blade angle (°) | 45 |
| Outlet blade angle (°) | 10 |
Table 3.
Result of mesh independence test.
| Sequence Number | Total Element Number/104 | Output Power/kW | Relative Error/% |
|---|---|---|---|
| 1 | 4.2 | 324.5 | / |
| 2 | 16.9 | 339.2 | 4.33 |
| 3 | 31.4 | 342.7 | 1.02 |
| 4 | 48.6 | 341.6 | −0.32 |
© 2018 by the authors. Licensee MDPI, Basel, Switzerland. This article is an open access article distributed under the terms and conditions of the Creative Commons Attribution (CC BY) license (http://creativecommons.org/licenses/by/4.0/).
Share and Cite
MDPI and ACS Style
Zhang, D.; Wang, Y.; Xie, Y. Investigation into Off-Design Performance of a S-CO2 Turbine Based on Concentrated Solar Power. Energies 2018, 11, 3014. https://doi.org/10.3390/en11113014
AMA Style
Zhang D, Wang Y, Xie Y. Investigation into Off-Design Performance of a S-CO2 Turbine Based on Concentrated Solar Power. Energies. 2018; 11(11):3014. https://doi.org/10.3390/en11113014
Chicago/Turabian StyleZhang, Di, Yuqi Wang, and Yonghui Xie. 2018. "Investigation into Off-Design Performance of a S-CO2 Turbine Based on Concentrated Solar Power" Energies 11, no. 11: 3014. https://doi.org/10.3390/en11113014
Note that from the first issue of 2016, this journal uses article numbers instead of page numbers. See further details here.