1. Introduction
Academic research and real world practice indicate that the influence of climate change on consumers’ behavior is far-reaching. Scientific studies show that consumers, especially those with consciousness of social responsibility, have low-carbon preferences. A Gallup report [
1] shows that 80% of European respondents consider the environmental effects of products as a crucial factor in their purchasing decisions. Zhao et al. [
2] indicated that attitudes significantly influence green purchasing behavior, according to the data collected in Qingdao (China). Regarding public willingness to pay (WTP) for the benefits of low-carbon farming, Kragt et al. [
3] indicated that Australian respondents have a positive WTP for native vegetation. Mostafa [
4] showed that consumers in Egypt are willing to pay seventy Egyptian pounds more for carbon-labeled products.
Understanding the preferences of consumers for low carbon products, in general firms commit themselves to voluntarily reduce carbon emissions. For example, UK top retailers, including Tesco and John-Lewis, have pledged to cut absolute carbon emissions from retail operations by 25% in 2020 [
5]. Carbon emissions are caused by the actions of multiple parties, and thus a collective approach is required to tackle carbon reduction, particularly among firms in a supply chain. Siemens encourages its suppliers to contribute to a green supply chain by reducing energy consumption and greenhouse gas emissions [
6]. A total of seventy real estate companies in China, representing sales revenue of 163 billion US dollars in 2015, joined the “Green supply chain in real estate industry in China” program and engaged more than 2000 upstream suppliers of cement, steel and iron ([
7]) and a green index was launched to manage their suppliers ([
8]). In addition, the positive link between the environmental enhancement and competitiveness within supply chains in South Asia is identified [
9].
However, the extant supply chain-related literature [
10,
11,
12,
13] considers that companies addressing carbon emissions often equate the business of carbon reduction with their regular business areas, such as R&D, manufacturing and marketing, matters that traditionally firms are skilled in handling, whereas in fact, the business of carbon reduction involves many specialized professional techniques such as industrial energy saving, gas separation, carbon capture, etc., in which neither the manufacturer nor the retailer may be an expert. As a result, only focusing on the original way of implementing carbon reduction projects has its limitations. Meanwhile, there now exist many professional carbon reduction firms that are known for their low cost, highly efficient and effective carbon reduction processes. For example, China already has more than 3000 companies focusing on providing excellent service of carbon reduction and industrial energy saving or Energy Performance Contracting (EPC) since 2013 [
14].
Moreover, a mature business model for the carbon reduction (or energy saving) performance exists, wherein the contractor bears the corresponding investment and shares part of the returns from the investment with its customer. IBM reports that successful firms will locate the best balance of consolidating core business within the company and allocating non-core business [
15]. Hence, a rational manufacturer will distribute non-core businesses such as carbon reduction to external specialists. Nestlé outsourced its carbon reduction business to Quantis that is devoted to help organizations to move toward sustainability through the life cycle approach to cut the carbon footprint of a cup of Nespresso coffee by 20% in 2008 [
16]. Fashion retailer H&M and the retail giant Wal-Mart distributed the business of establishing and implementing their low carbon strategy and their vendors’ participation program, respectively, to the firm Reset Carbon [
17]. One Siemens CEO in China said that the company adopted the “Energy Saving Performance Contracting” to implement its low carbon strategy [
18].
Therefore, analyzing the consequences of incorporating a carbon reduction contractor within a supply chain is valuable. A contractor skilled in carbon reduction could increase the efficiency of carbon reduction as well as the profits for the supply chain. However, other (possibly detrimental) consequences of outsourcing to a contractor may occur, given the effect of multi-marginalization, thus, we will explore the conditions under which a manufacturer-retailer supply chain would choose an external contractor for carbon reduction. Furthermore, when the supply chain chooses the route of external contractor for carbon reduction, investigating whether both supply chain members share the carbon reduction service fee when the contractor reduces carbon emissions from the supply chain is important. However, cases in which the manufacturer or retailer dominates the contractor should also be investigated, considering the interests resulting from dominating the contractor. We then examine the effects on supply chain performance of leaving the manufacturer or the retailer to cooperatively or separately set the carbon reduction fee, given that paying the contractor means that it could induce the contractor’s carbon reduction decision in its own interest. To sum up, we will investigate the following questions. (1) Should the carbon reduction contractor be added to the supply chain? (2) What are the effects of the three diverse payment contracts on supply chain performance? (3) What are the underlying operation mechanism and managerial implications?
Within a supply chain consisting of a manufacturer and a retailer with low carbon preference of consumers, we study the condition in which a carbon reduction contractor could be added to the supply chain, and the effects of low carbon preference on the supply chain performance. With the contractor embedded in the supply chain, we present the “joint undertaking”, “manufacturer undertaking” and “retailer undertaking” contracts, and explore the effects of these contracts on the contractor’s decision and supply chain performance.
Our contributions to the literature lie in the explicit incorporation of a carbon reduction contractor into the supply chain and the investigation of the effects of different payment contracts on supply chain performance. We propose that when a contractor’s efficiency of carbon reduction is two times more efficient than the supply chain itself, it makes sense to choose a contractor to reduce carbon emissions. The computation result shows that the manufacturer chooses to be a free-rider in the case of independent decision-making in the joint payment contract as it pays the contractor nothing. Compared with other contracts, the manufacturer payment contract is the worst about the profit and the carbon reduction level. Moreover, the joint payment contract does not seem “tactical”, as it results in a low payment level to an efficient contractor while a high payment level to a less efficient one. By contrast, the retailer payment seems fairly “tactical”, as it positively motivates the contractor.
The rest of the paper is organized as follows: in
Section 2, we review the relevant literature.
Section 3 presents the basic model and derives conditions for choosing an external contractor for carbon reduction. We analyze different payment contracts in
Section 4 and explore the effect of different contracts on supply chain performance in
Section 5.
Section 6 provides our concluding remarks.
2. Literature Review
Although there is an increasing body of literature referring to sustainable operation management and green supply chains, we here follow closely two main streams of literature, i.e., carbon efficient supply chain and supply chain outsourcing, which are highly related to our study.
For a time long scholars and policy makers have paid attention to the topic of carbon efficient supply chains as the threat of global warming has become a consensus for society. For a comprehensive review on modeling and analysis of sustainable operations management, one can refer to Gunasekaran et al. [
19]. The literature modeling the low-carbon supply chain can be divided into threads as follows. One strand of interests focuses on the optimal supply chain network optimization considering carbon emissions. Cruz and Wakolbinger [
20] presented a multi-criteria decision-making framework including an objective of minimizing emissions in a multi-period supply chain. Elhedhli and Merrick [
21] argue that considering the costs of carbon emissions may alter the optimum configuration of a supply chain. Similarly, Chaabane et al. [
13] introduced an example of supply chain design considering carbon emissions from production and transportation. Cachon [
22] studied the optimal formulation of retail outlets in supply chains to minimize operational and environmental costs incurred by carbon emissions.
The other thread concentrates on the analysis of operations and coordination mechanisms in low-carbon supply chains. Benjaafar et al. [
10] introduced a series of simple models to incorporate carbon emissions into supply chain operations management. Du et al. [
11] studied a supply chain with an emission-dependent manufacturer and an emission permit supplier (a forest farm) under a cap and trade policy. Caro et al. [
23] have presented a simple but general model on joint production of GHG emissions in general supply chains. Chen et al. [
24] and Hua et al. [
25] use the EOQ model in analyzing how firms manage carbon footprints in inventory management under the carbon emission trading mechanism scenario. Lukas and Welling [
26] demonstrated that economic and ecological efficiency continue to be mutually exclusive under uncertainty in emission allowance prices. The problem worsens when the carbon reduction project hinges upon investing in the whole supply chain. Xu et al. [
27,
28] analyzed the carbon reduction and production decisions of a supply chain under the cap and trade policy and show that both wholesale price and cost-sharing contracts can coordinate the supply chain. The above literature does not analyze the low carbon preference of consumers. In the next section, we review the literature focusing on voluntary carbon reduction problems in a supply chain.
There is also some pertinent literature examining low-carbon strategies in supply chains in the presence of consumer preference. Liu et al. [
29] explored the impact of consumers’ environmental awareness and their competition on supply chain members. Supply chain coordination considering consumers’ low carbon preference has also drawn the interest of scholars. Du et al. [
12] compared the respective effects of wholesale-price, revenue-sharing and quantity-discount contracts on the emission-concerned supply chain facing consumers’ low-carbon preference. Similarly, Giri and Bardhan [
30] studied the supply chain coordination with the wholesale-price and wholesale-price discount contracts considering consumers’ environmental perception. Ji et al. [
31] addressed the emission reduction strategy in retail-channel and dual-channel cases using Stackelberg game theory.
Although we also realize the importance of consumers’ low-carbon preference for supply chain operations, distinct from existing literature, we separate the carbon reduction task from the tranditional supply chain and focus on improving the efficiency of the carbon reduction contractor. A feature of this paper is that we consider the carbon-reduction contractor as an integral part of the extended supply chain, which could shift the carbon reduction function from the manufacturer and retailer to the contractor and thus change the supply chain structure. We propose the conditions in which the contractor can be added to the supply chain and examine effects of different payment contracts on supply chain performance.
Another stream of literature related to our work is about outsourcing in supply chains. Most relevant literature has focused on information asymmetry and market risk, and on how these issues affect the decision making between in-house production and the outsourcing. Regarding market risk, Liu and Nagurney [
32] studied the effect of foreign exchange risk and competition intensity on supply chain companies involved in off-shore outsourcing activities. Yu et al. [
33] evaluated the effects of supply disruption risks on the choice between the well-known single and dual sourcing methods in a two-stage supply chain. Given the information asymmetry in worker productivity, Hasija et al. [
34] examined different combinations of contract features that enable firms to better manage contractors. Li et al. [
35] addressed the transportation outsourcing and production issues of a supply chain under cap and trade and carbon tax policies, respectively. Kaya [
36] investigated the effort and pricing decisions in a two-facility supply chain with outsourcing and in-house production. The author found that the power difference between the manufacturer and the supplier affects the effects of coordination contracts. Ding et al. [
37,
38] studied the motivation mechanism of coal power plants to turn to a environmental service contractor for reducing pollutant and carbon emissions. Specifically, Wang and He [
39] performed a study on the impact of managing risk aversion in low-carbon supply chains on system performance and emission control in the presence of emission abatement outsourcing.
Kaya’s [
36] is the research most closely related to ours. It examines an R&D outsourcing problem with a linear motivation scheme under asymmetric information scenario. Specifically, they commit the contractor to leak its true information, whereas our work explores efficient payment contracts to improve supply chain performance.
Different from the abovementioned literature, we design different payment contracts including the joint, retailer and manufacturer undertaking contracts and examine the effect of payment contracts on supply chain performance, thereby exploring the underlying operation mechanism and managerial implications. We find that the joint payment contract, notwithstanding being viewed as the most reasonable contract, turns out to be the least efficient among the various contracts discussed.
3. Preliminaries and Basic Model
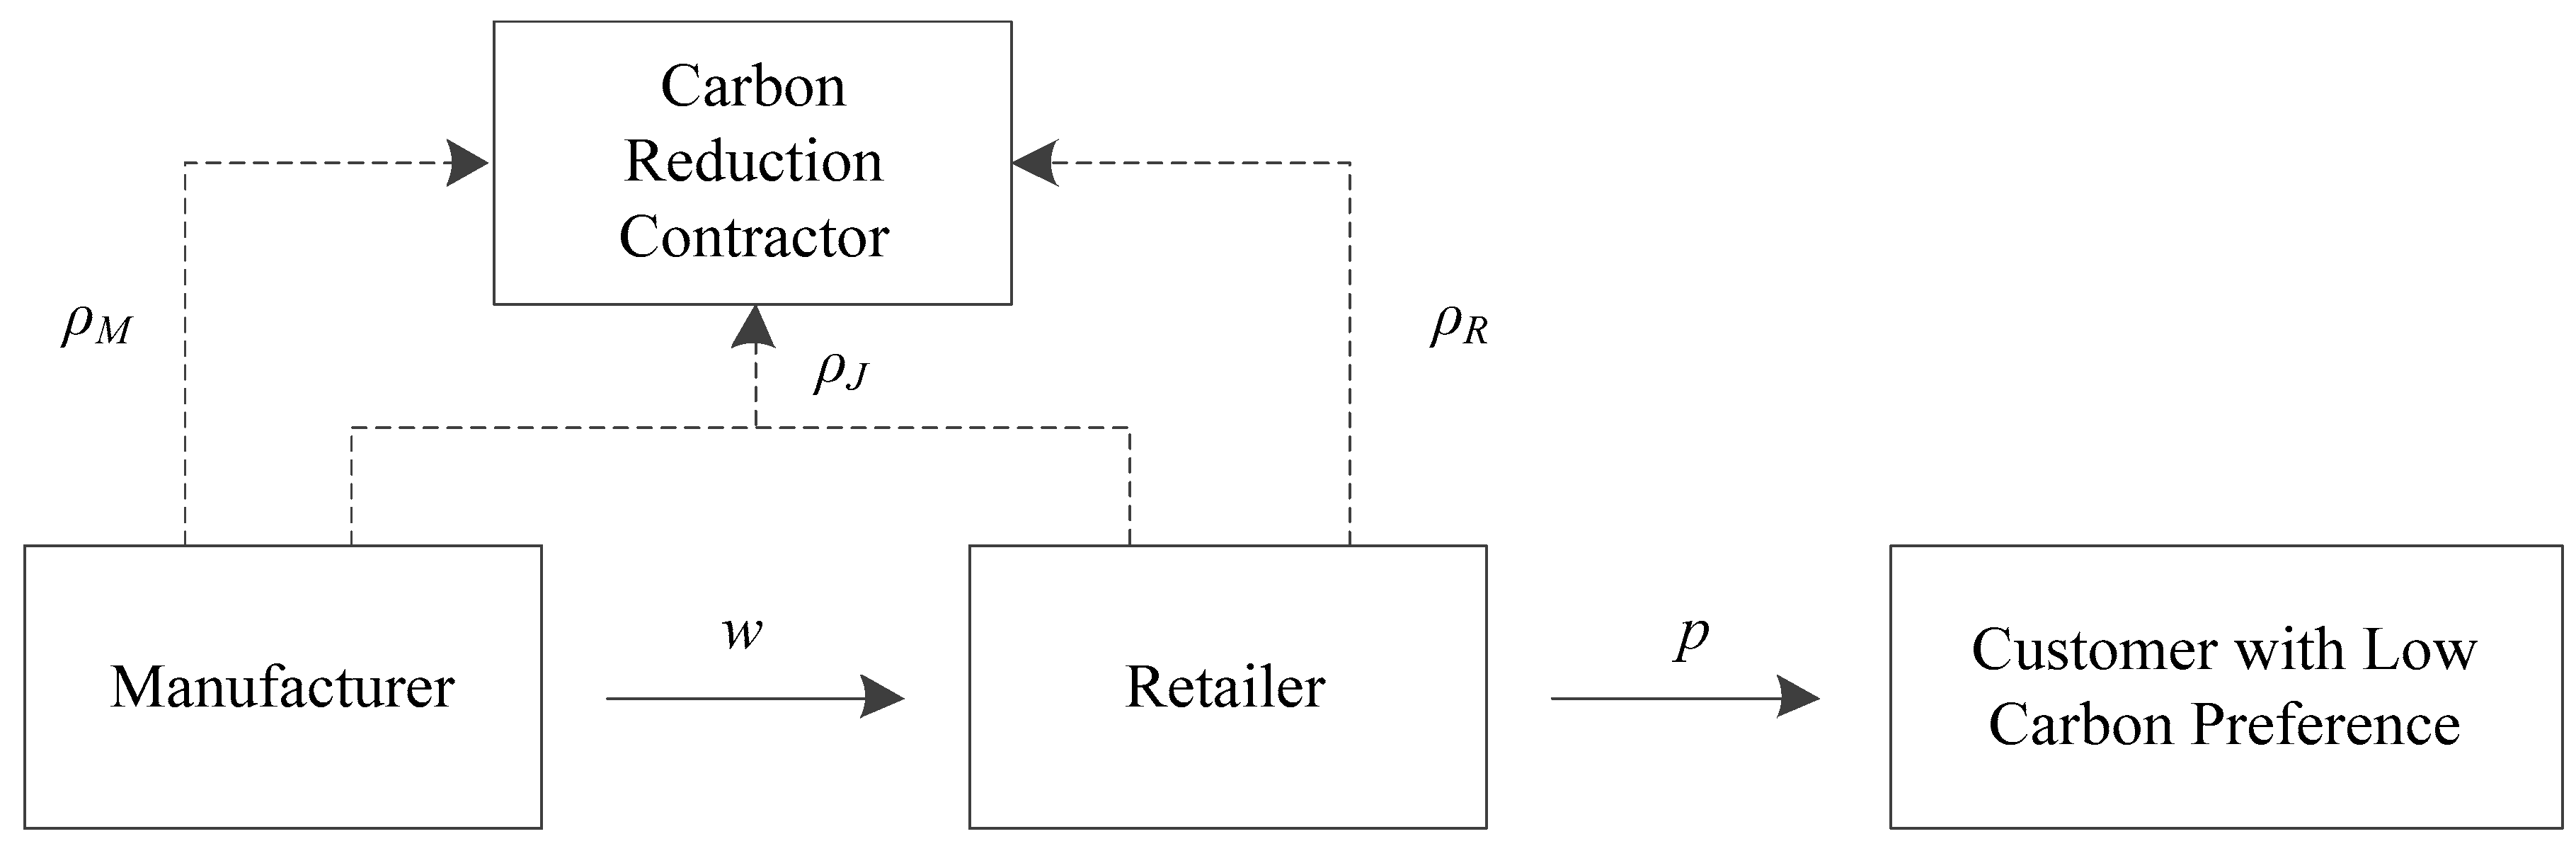
The term “low-carbon products” is used to identify goods that generate less carbon emissions through the whole life cycle (including manufacturing, distribution, retailing and consumption) than other similar products with relatively high carbon emission. Suppose that consumers with the sense of social responsibility have a low-carbon preference and thus contribute to the growth of market share for supply chains reducing carbon emissions. As is shown in
Figure 1, the focused supply chain consists of one retailer (
R) and one manufacturer (
M), both of whom are risk-neutral and emit carbon dioxide. Besides, we will also assume that there exists a risk neutral contractor of carbon reduction
C who has advantage of technology and cost in terms of carbon reduction. Assume the supply chain is already voluntarily reducing carbon emission in the low-carbon context or spurred by external forces like the pressure of Non-Governmental Organizations (NGO). For example, some companies, such as Nestlé and IKEA, have already implemented the low-carbon strategies in their supply chains. Hence our model does not involve the issue of deciding whether or not to reduce carbon emission, which is notwithstanding discussed in some existing literature.
Let p denote the retail price of a low carbon product, w the wholesale price and c the marginal cost of product production for the manufacturer (we assume that marginal sales cost of the retailer is negligible). In order that the manufacturer and retailer both have positive profits, we let p > w > c.
Considering the findings in the literature [
1,
40], we assume that the market demand for low carbon products is influenced by “carbon emission reduction level”
. Suppose that the market demand is an additive function of retail price
p and carbon reduction level
e.
Specifically, the supply chain demand is defined as:
where
is the initial market potential,
is the level of low carbon preference or the sensitivity coefficient of the carbon reduction level and
is the slope of the demand function. The linear demand function is commonly used in the literature of supply chain management and economics [
41,
42].
Assume that the investment in emission reduction is a disposable input and an increasing convex function of
e and denoted by
. Considering the effect of diminishing returns for carbon reduction, we let the quadratic function of the reduction rate denote the carbon reduction investment, that is
, where
is the carbon reduction investment coefficient representing the cost factor. Note that the quadratic function used in this paper have also been considered by researchers like Du et al. [
12], Dong et al. [
43], Giri and Bardhan [
30] and Savaskan and Van Wassenhove [
44]. Using the quadratic function to denote costs, which are progressively more difficult to achieve (i.e., carbon reduction requires more capital, technology and other resources to invest per additional decrement of carbon emissions), is a common practice (we refer to Nordhaus [
45], Harnisch et al. [
46] and Yang et al. [
47] for further literature sources using the quadratic function form). Given the contractor is responsible for the manufacturer and retailer’s carbon reduction business,
k will not change with the payers. We list the notations used through the text in
Appendix A.
3.1. No Emission-Reduction Outsourcing with the Centralized Supply Chain
This section determines the conditions in which a centralized supply chain might choose to amend its structure and possibly outsource its carbon reduction business. Therefore, as a benchmark, we first study the centralized supply chain in which a manufacturer and a retailer are concerned with producing products with low carbon emissions, the supply chain objectives are to determine the carbon reduction level and retail price. Let denote the investment coefficient of carbon reduction within a centralized supply chain.
The profit function of the centralized supply chain of a firm can be expressed as follows:
Lemma 1. The optimal solution for the centralized supply chain are given as follows only when
It is easy to show that both the carbon reduction level and profit decrease in the investment coefficient of carbon reduction k, but increasing in the consumer preference level, therefore, increasing its carbon reduction efficiency can increase its profit and the carbon reduction level. Considering that many firms do not have sufficient knowledge, experience, or resources to take on a carbon reduction project, and that improving its own carbon reduction technology is time-consuming and costly, outsourcing the carbon reduction business may be a good option. The low carbon preference of consumers significantly affects the profit. Thus, expanding the population of consumers with low-carbon preference through advertising is necessary.
3.2. Emission-Reduction Outsourcing Added to the Centralized Supply Chain
The centralized supply chain outsources its carbon reduction business to a contractor who is an expert in reducing carbon reduction reflected in its high efficiency (), i.e., the contractor of carbon reduction with a low investment coefficient in carbon reduction is efficient.
The supply chain S, as a centralized agent, and the contractor C sign a “carbon-reduction performance contract” and agree that the contractor helps the manufacturer to reduce the carbon reduction to level e and bears the corresponding cost of carbon reduction . The supply chain S enjoys the benefits of carbon reduction (the demand increase) and shares part of the profits caused by carbon reduction with the contractor (i.e., paying ρe to the contractor based on the carbon reduction level e (it is a common practice to apply a linear scheme to stimulate the contractor to reduce the emissions of carbon. For example, the customer pays the contractor a constant payment per year for the next few years for this service. As our problem is of a static nature, we use a linear scheme to represent the cost for the carbon reduction in a single period).
The decision sequence is that the manufacturer first sets its payment level ρ and retail price p to maximize its profit. The contractor then determines the level of carbon reduction e.
Thus, the contractor’s profit from the carbon emission reduction service is as follows:
where the first and second terms are the revenue and the carbon reduction investment for the centralized supply chain, respectively. Such a linear payment scheme is assumed for the tractability of our model, a similar payment scheme can be found in the existing literature (see Kaya and Özalp [
48] and Kaya [
36]). The problem regarding fairness is left to future research. The first order partial derivative of Equation (4) with respect to
e is as follows:
and then:
Equation (6) indicates that the carbon reduction level decreases in and increases with . Obviously, this agrees with common sense. When the manufacturer pays the contractor more for the carbon reduction, increases (i.e., the contractor should reduce carbon emissions further for optimal profit). In the same manner, when the investment coefficient of carbon reduction decreases, or in another word the contractor’s technology for reducing carbon emissions improves, will also increase (i.e., again, the contractor should reduce carbon emissions further for optimal profit).
The profit of the centralized supply chain with the manufacturer and retailer is:
where the first term is the revenue of the supply chain from selling products, and the second term is the cost for purchasing the carbon reduction service.
Lemma 2. In the carbon-reduction outsourcing case, the Stackelberg equilibrium ( ,
,
) for the contracter and the original supply chain exists as follows only when holds
Lemma 2 shows that the retailing price is the sum of the marginal cost of the manufacturer and times the payment level , i.e., .
Result 1:
Table 1 summarizes the results in the cases of carbon reduction within a centralized supply chain and of outsourcing the carbon reduction.
Theorem 1. Only when the contractor’s efficiency of carbon reduction is two times more efficient than the supply chain itself, it makes sense for the contractor to reduce carbon emissions, i.e.,
When , i.e., the contractor’s investment coefficient of carbon emission reduction must be less than half of that of the manufacturer. Otherwise, the manufacturer will reduce carbon emissions on his own instead of through the service of the contractor.
When the firm stops its business of emission reduction and outsources it to an external specialized firm, the firm’s profit normally falls. To avoid a reduction in aggregate profit, the specialized contractor must have a higher capability of reducing carbon emission than that of a centralized supply chain. Thus, the contractor must be sufficiently efficient to be accepted as a member of the supply chain. Otherwise, the contractor will not be chosen, and the manufacturer will select to reduce carbon emissions by itself.
4. Diverse Undertaking Contracts
We have shown that when , outsourcing the carbon reduction business to a carbon reduction contractor is beneficial for the supply chain. Therefore, we assume that a carbon reduction contractor subject to the efficiency requirement is introduced to the supply chain resulting in the structure with the manufacturer, retailer and contractor. The extended supply chain is denoted by . As carbon emissions are produced within manufacturer and retailer processes, both should bear the carbon reduction service fee of the contractor at first thought.
In this section, we intend to comprise three cost pooling schemes, i.e., joint undertaking contract, manufacturer undertaking contract and retailer undertaking contract. Therefore, we first analyze the “joint undertaking contract”. From
Section 3.2, we learn that the level of carbon reduction is directly affected by the undertaking level or the payer. Various payers may set different undertaking levels to maximize individual profits. Thus, influences of these different undertaking levels on the supply chain performance may differ slightly. For this reason, we will also explore the effects when the payer is the manufacturer or retailer (i.e., the “manufacturer undertaking contract” as well as the “retailer undertaking contract”, with a contractor embedded in the supply chain).
used below are all assumed to be under the constraint
unless otherwise specified, and thus we will not repeatedly state this. We will let the superscript denote the type of undertaking contract and the subscript denote the member of the supply chain of interest at a given point.
4.1. Joint Undertaking Contract (J)
When the manufacturer and retailer bear the cost of carbon reduction, they pay and , respectively. Depending on whether the manufacturer and retailer cooperate in determining their undertaking levels, the joint undertaking contract can be divided into two cases (namely “cooperative” or “independent” decision-making). In the cooperative decision-making case, the manufacturer and retailer codetermine the sum of and , while in the independent decision-making case, they independently set its own level of carbon reduction.
We first investigate the cooperative decision-making case, wherein the manufacturer and retailer announce and collectively, and then the manufacturer reveals the wholesale price, and the retailer, and sets the retailing price based on the information obtained about the wholesale price. Finally, the contractor determines the carbon reduction level.
The respective profits of the contractor, retailer and manufacturer are as follows:
Lemma 3. Under the joint undertaking contract, the Stackelberg equilibrium (
,
,
,
,
) of chain members exists as follows only when the condition holds
We do not determine the specific individual values of and (only their sum), because they mainly depend on a level of bargaining between the manufacturer and retailer as the sum is set, which deviates from our main line of reasoning
4.2. Retailer Undertaking Contract (R) (Independent Decision Making)
We study the case when the retailer and manufacturer independently determine their undertaking levels. The decision order is that the manufacturer first set the wholesale price w and its undertaking level . The retailer then determines the retail price p and its undertaking level . After the manufacturer and retailer present their undertaking levels, the contractor sets the level of carbon reduction e for supply chain.
The profits of the contractor, retailer and manufacturer are the same as that in
Section 4.1. The primary difference between the cases of cooperative and independent decision making is the sequence of the levels of undertaking. We can obtain Lemma 4 through backward induction.
Lemma 4. Under retailer undertaking contract, the Stackelberg equilibrium (
,
,
,
) exists as follows only when the condition holds,
,
,
,
and
As , it shows that the “independent decision-making” case degenerates into the “retailer undertaking contract” (R), in which the manufacturer voluntarily gives up the opportunity of guiding the contractor to maximize its profit and expects to be a free-rider, thus, only the retailer independently bears the carbon reduction service fee. We let upper superscript R to denote the case of independent decision making. Lemma 4 indicates that the manufacturer does not care about carbon reduction in an RP contract and sets the wholesale price based on and . Naturally, the manufacturer is a free-rider, and thus, its wholesale price is unaffected by the carbon reduction business.
4.3. Manufacturer Undertaking Contract (M)
The manufacturer pays the contractor for its carbon reduction service and announces the wholesale price w and the undertaking level first to maximize its profit. After knowing the wholesale price and the undertaking level, the retailer decides on the retail price p. Finally, the contractor determines the level of carbon reduction e.
The profits of the contractor, manufacturer and retailer are stated as follows, respectively:
Lemma 5. Under manufacturer undertaking contract, the Stackelberg equilibrium ( ,
,
,
) exists as follows only when the condition holds,
,
,
and
Result 2:
Table 2 shows the optimal prices, carbon reduction level, as well as profits in the joint, retailer and manufacturer undertaking contracts.
5. Comparison and Analysis
In this section, we compare the equilibrium results among the three different contracts and present the underlying managerial implications. For ease of discussion, we use the subscripts and to denote the retailer and manufacturer, respectively. For example, denotes the aggregate profit of the manufacturer and the retailer in the retailer undertaking profit.
5.1. Decision Variables
Observation 1. For the retail price, when ,
we have ;
when ,
we have ;
when ,
we have .
(We refer to Appendix A.1 in the Appendix A for the proof).
When the investment coefficient is too high, the retail price is the highest under the J contract and is the lowest in the R contract among the three contracts. This situation implies that as the contractor is less efficient, the retailer should bear a high cost of carbon reduction, and thus a low retail price facilitates the retailer to expand the market to relieve its carbon reduction burden. When
k is intermediate, the retail price is the lowest in an M contract, and is also the highest in the JP contract. When
k is low, the retailing price is also the lowest in the M contract, which is caused by the retailer not directly bearing the outsourcing cost. Thus, the retailer could set a low retailing price, and is the highest in the R contract, which stems the fact that as the contractor is efficient, carbon reduction burden of the retailer is relatively light. Thus, the retailer sets a high retail price to maximize its profit.
Observation 2. For the payment and carbon reduction levels, when ,
we have ,
;
and when ,
we have ,
.
(We refer to Appendix A.2 in the Appendix A for the proof).
The payment level is the lowest in the P contract. In other words, the P contract is the least beneficial to investment in reducing carbon emissions reflected by the payment level, which can be explained by the fact that the manufacturer is farther from the consumer market than the retailer. Therefore, the manufacturer is less acquainted with consumer preferences for the low carbon product. Hence, the M contract offers the lowest payment level to the contractor for the service of carbon emissions reduction. This partly explains why many manufacturing companies (for example, Foxconn) are in a disadvantaged position in the current relationship with suppliers and retailers like the Apple company.
When the contractor is efficient, the payment level is higher in the RP contract than that in the JP contract. When the contractor is less efficient, the result is reversed. Thus, only when the investment coefficient is high, does the JP contract display its advantage of considering the concerns of the manufacturer and retailer in facilitating the contractor to reduce carbon emissions. Otherwise, the R contract has an advantage in facilitating carbon reduction.
Owing to the linear relationship between the carbon reduction and the payment levels, we could also obtain the quantitative relationships of the carbon reduction level under different payment contracts.
Observation 3. For the wholesale price, we have .
(We refer to Appendix A.3 in the Appendix A for the proof).
The wholesale price is lowest in the R contract among the three contracts, which is consistent with our expectation. Given that the manufacturer bears the cost of carbon reduction paid to the carbon reduction the contractor, this cost must be transmitted to the retailer in the downstream along the supply chain, which increases the wholesale price. In the R contract, the manufacturer does not bear the service fee of carbon reduction. Consequently, the wholesale price is lowest in the R contract.
The wholesale price is higher in the JP contract than that of the M contract, which may not seem regular in the sense that the manufacturer merely shoulders part of carbon reduction cost in JP contract whereas it bears all related cost in the M contract, because the payment level in the JP contract is higher than that in the M contract.
5.2. Profits of Supply Chain Members
Observation 4. For the profit of the contractor, when ,
we have ;
and when ,
we have .
For the profit of the manufacturer, we have .
For the profit of the retailer, we have .
(We refer to Appendix A.4, Appendix A.5 and Appendix A.6 in the Appendix A for the proof).
In line with Observation 2, the profit of the contractor is lowest in the M contract owing to the lowest support from the manufacturer in the M contract. The less efficient contractor gets the highest profit in the J contract and the efficient contractor obtains the highest profit in the R contract, which is generally consistent with the payment relationship among the three contracts. The difference is the demarcation point determining when the contractor is efficient or less efficient. It has a higher requirement to be an efficient contractor in the payment level. However, only a low requirement is necessary in this case. Therefore, when a contractor needs to select between the GM-led supply chain and Wal-Mart-led supply chain, selecting the latter may be sensible.
Considering the JP contract, the specific profit of the retailer or manufacturer depends on the payment level it takes, we simply compare the profit in the R and M contacts for the retailer and manufacturer.
People generally tend to assume that the retailer has a high profit in the M contract whereas the manufacturer in the R contract obtains a high profit as each of them plays a free-rider role. However, Observation 4 shows that this hypothesis only explains part of the truth (that is, it only suits the manufacturer). The profit of the manufacturer is higher in the RP contract than that in the M contract. Like the analysis of the wholesale price, the manufacturer does not bear any cost paid to the contractor in the R contract, whereas bearing all the cost in the M contract. As a result, the profit of the manufacturer is high in the R contract.
For the retailer, its profit is larger in the R contract than that in the M contract, which suggests that the profit increment of the retailer due to the added demand surpasses the contracting cost born in the RP contract. This shows the superiority of the RP contract.
Observation 5. For the aggregate profit of the manufacturer and retailer, we have ,
which are the sums of manufacturer’s and retailer’s profits under M, J and R scenarios, respectively. For the supply chain profit of the three members of the supply chain, we have .
(Readers can refer to Appendix A.7 and Appendix A.8 in the Appendix A for the proof).
The aggregate profit in the M contract is at the bottom among the three contracts, which results from the point that in the M, the manufacturer does not attach sufficient importance to consumers’ preference for low carbon products. Therefore, the contractor does not have any incentive to cut carbon emissions due to low payments from the manufacturer. The aggregate profit of the manufacturer and retailer is the highest amount in the R contract rather than in the JP contract. This is because the R contract is always “tactical” as it pays the highest only when the contractor is efficient. However, the J contract is not, who offers the highest payment level when the contractor is inefficient. From some point of view, the J contract does not make a “right” decision.
The lowest supply chain profit can be obtained from Observation 4. We can also get Observation 5 when the contractor is highly efficient from Observation 4. When the contractor has low efficiency, the supply chain profit in the R contract is higher than in the J contract. Therefore, the profit increment of the contractor in the R contract compared with that in JP contract is less than the decrement of the aggregate profit in the J contract compared with that in the RP contract, i.e., .
6. Concluding Remarks
Confronting the anxiety of global climate change around the world, we consider the supply chain operations by capturing consumers’ low-carbon preference due to the sense of social responsibility and existence of carbon-reduction contractor in the market. We initially present the conditions where the supply chain should add a contractor to the supply chain, and conclude that only when the efficiency of carbon reduction contractor compensates the loss due to the multi-marginalization effect, does the supply chain benefit from extending itself by adding a contractor. In the extended supply chain, we design three different payment contracts including the joint, retailer and manufacturer undertaking contracts. The effects of the three payment contracts on supply chain performance are then analyzed.
We find that the profit of the extended supply chain can be generated most in the retailer undertaking contract, and the least in the manufacturer undertaking contract. The result reveals that the retailer payment contract presents a Pareto improvement compared with the manufacturer undertaking contract. The reason is that the retailer payment contract offers a higher profit for the three members in the extended supply chain, a lower wholesale price, and a high carbon reduction level. This finding also conveys that the contracting payment decision should consider the downstream of the supply chain. In terms of the retailer undertaking contract and the joint undertaking contract, the profits of the extended supply chain, the manufacturer and the retailer are higher in the retailer payment contract, while the contractor’s profit, the level of payment or the level of carbon reduction in the retailer payment contract surpass those of the joint payment contract only when the carbon reduction technology of the contractor is efficient. In addition, the joint undertaking contract presents an advantage in terms of carbon reduction when the contractor is not too competent in carbon reduction compared with the retailer undertaking contract.
This study can be extended in at least two possible directions for future research. First, we assumed that only one carbon reduction expert exists, and thus, the supply chain with the manufacturer and retailer has only one choice if the supply chain needs carbon reduction service of the contractor. If there are other contractors in the market, it will be more realistic. Second, we supposed that the information is complete, and that there is no moral risk and adverse selection. An extension would allow members in supply chain to access their own private information.


