Article

Development of Demand Response Energy Management Optimization at Building and District Levels Using Genetic Algorithm and Artificial Neural Network Modelling Power Predictions

1
Energy Management in the Built Environment Research Lab, Environmental Engineering School, Technical University of Crete, Technical University Campus, Kounoupidiana, GR 73100 Chania, Greece
2
Electric Circuits and Renewable Energy Sources Laboratory, Technical University of Crete, GR 73100 Chania, Greece
3
Research for Innovation, AEA srl. via Fiume 16, IT 60030 Angeli di Rosora, Marche, Italy
*
Author to whom correspondence should be addressed.
Energies 2018, 11(11), 3012; https://doi.org/10.3390/en11113012
Submission received: 25 September 2018 / Revised: 20 October 2018 / Accepted: 26 October 2018 / Published: 1 November 2018
(This article belongs to the Special Issue Demand-Response in Smart Buildings)

Abstract

:
Demand Response (DR) is a fundamental aspect of the smart grid concept, as it refers to the necessary open and transparent market framework linking energy costs to the actual grid operations. DR allows consumers to directly or indirectly participate in the markets where energy is being exchanged. One of the main challenges for engaging in DR is associated with the initial assessment of the potential rewards and risks under a given pricing scheme. In this paper, a Genetic Algorithm (GA) optimisation model, using Artificial Neural Network (ANN) power predictions for day-ahead energy management at the building and district levels, is proposed. Individual building and building group analysis is conducted to evaluate ANN predictions and GA-generated solutions. ANN-based short term electric power forecasting is exploited in predicting day-ahead demand, and form a baseline scenario. GA optimisation is conducted to provide balanced load shifting and cost-of-energy solutions based on two alternate pricing schemes. Results demonstrate the effectiveness of this approach for assessing DR load shifting options based on a Time of Use pricing scheme. Through the analysis of the results, the practical benefits and limitations of the proposed approach are addressed.

1. Introduction

Preparation for the transition from conventional power grids to next generation, so-called “smart” grids, is a worldwide trend nowadays. The goal for stakeholders in the domains of operations, generation, transmission, distribution, and service provision [1] is to offer more and higher quality services while improving operational capabilities, flexibility, and energy efficiency. In this context, a higher-level utilisation of smart grid resources is targeted by grid modernisation and enhanced dispersed dynamic measurements at local, regional, and wider levels. Various forms of communication equipment and protocols allow smart metering, monitoring, and controls in an interoperable unified system often described as Advanced Metering Infrastructure (AMI).
Smart metering and AMI are widely recognized as a necessity for the reliable and fast exchange of data in smart grids [2]. It is expected that nodal analysis of power measurements in the power grid will provide valuable information for utilities to control multi-directional flows of energy and improve dispatching, addressing vulnerabilities and constraints. In this sense, it is foreseen that a variety of technological solutions will emerge to balance the high volatility and power quality issues of the miscellaneous intermittent loads and renewable energy sources.
On the market side, reforms are required to leverage innovation in services and new business models which will upgrade existing operations. In this context, Demand Response constitutes a variety of services which have transformed the electric grid and energy markets operations during the past decades. Significant progress has been made in the US, where DR programs have been designed and implemented for years, and span across the full range of dispatchable (reliability, economic) and non-dispatchable (time sensitive pricing; ToU, CPP, RTP) demand side management options [3]. Demand side management is a valuable prospect for consumers and utilities—if used properly—for the use of assets and to decrease losses in transmission and distribution, as well as reducing avoidable costs. In this context, DR, along with the demand-side management of distributed energy resources, expand the boundaries for near future scientific and technological advances.
In the European Union, the Energy Efficiency Directive (EED), 2012/27/EU foresees the elimination of barriers for Demand Response (DR) in balancing and ancillary services markets [4]. Among the EU Member States (MS), considering the progress in DR, Belgium, France, Ireland, and UK, are in the leading group. Significant steps have also been taken in this direction by Germany, the Nordic countries, the Netherlands, and Austria. Generally, DR programs are differentiated (a) explicitly, i.e., where DR participants transact directly in the energy market, and (b) implicitly, i.e., where participation through a third party is facilitated [5].
Furthermore, Open Automated Demand Response (OpenADR) is a well-established protocol defining various deployment scenarios for facilitating DR programs and measures [6]. The overall framework of smart grids with regards to DR is presented and analyzed by Siano in [7]. Important aspects are defined, and a description of the possibilities created by DR for utilities and customers are analyzed. Load curtailment, shifting energy consumption, and using onsite energy generation, thus reducing the dependence on the main grid, are the main mechanisms for customers to participate in DR. Customer participation in wholesale markets via intermediaries, such as curtailment service providers (CSP), aggregators, or retail customers (ARC), demand response providers (DRPs), or local distribution companies, is documented in [7]. Moreover, a review of DR and smart grids with respect to the potential benefits and enabling technologies is provided. Considering system operation, contingency issues can be dealt with through DR implementation, resulting in a reduction of electrical consumption at critical hours, and avoiding serious impacts due to failure of power services provision. Considering energy efficiency, it is ascertained that effective management of aggregated loads can lead to a reduction of the overall cost of energy, due to the reduction and operating-time-shortening of conventional power generation equipment. Avoiding network upgrades at the local level, or postponing investments in new capacity, reserves or peaking units at system level, is another important potential benefit linked to high level implementation of DR. Modelling of incentive-based DR focusing on interruptible/curtailable service and capacity market programs is investigated by Aalami et al. in [8]. Price elasticity of demand, and a customer benefit function, are used to develop an economic model. Several scenarios are simulated and evaluated based on their value according to different strategies and performance with respect to improvement of the load curve (peak reduction, load factor, peak to valley), benefit of customers, and reduction of energy consumption.
Wholesale electricity market design considerations with regards to major challenges, aiming at increasing renewable energy penetration, are explored in [9]. Various dynamic energy pricing models have been proposed to compensate for market uncertainty and risks [10,11]. A residential DR based on adaptive consumption pricing is proposed by Haider [12], allowing utilities to manage aggregate load, and customers to lower their energy consumption. The proposed pricing scheme adapts energy costs to customers’ consumption levels, thus encouraging active enrolment in the DR program. Cost and comfort optimisation of load scheduling under different pricing schemes has been investigated using various techniques including linear, convex, PSO, MINLP [13]. Furthermore, technology readiness, opportunities, and requirements for the deployment of DR in buildings and blocks of buildings is addressed by Crosbie et al. in [14,15].
On the other hand, buildings worldwide are responsible for over 40% of total energy consumption, gas emissions, and global warming [16]. The role of smart grids for near- and zero-energy building communities is investigated by researchers to test new approaches, identify critical aspects, and tackle challenges emerging when dealing with design and operational problems [17,18]. On the demand side, a wide variety of developed scientific tools influence the dynamics of advances in energy performance and energy management in buildings [19,20,21,22]. Such tools are embedded in data monitoring applications, such as innovative web-based energy management platforms [23,24] to enable improved analysis, decision making, and dynamic controls. Moving from Building Energy Management Systems (BEMS) [25,26] to District Energy Management Systems (DEMS) [27] entails the dynamic exchange and hierarchical processing of data streams between various components and systems, as in the Internet of Things (IoT) paradigm [28,29]. Various techniques and tools have been investigated for dealing with challenges in various fields pertaining to smart grids: smart metering data analysis and dynamic processing [30], power demand forecasting [31,32], Distributed Energy Resources (DER) management optimisation [33], users’ engagement [34], etc.
In addition, Hybrid Renewable Energy Systems (HRES) have been implemented in various configurations to combine two or more renewable and non-renewable sources in order to deal with the intermittency of renewable energy sources, such as solar or wind. HRES have important attributes which make them increasingly attractive as alternatives to conventional fossil fuel energy sources in numerous applications [35,36,37,38]. Aligned with HRES, the concept of the microgrid as a semi-autonomous system of increased flexibility and manageable energy resources, such as renewable energy generation, storage, backup systems and flexible demand, is of particular importance when it comes to supporting grid stability and decentralized control [39]. A comprehensive critical review on the energy management systems of microgrids is conducted by Zia et al. in [40], with reference to the level of maturity of real world applications. Communication issues, control technologies and architectures, deployment costs, energy management strategies, optimisation, objectives and limitations, are addressed. An auto-configuration function using a multi-agent approach is proposed in [41] to establish automatic connection or disconnection of DER at microgrid level, capable of dealing with system faults and re-optimising the new configuration as necessary. Unsymmetrical and ground faults analysis in microgrids distribution systems is proposed by Ou in [42,43]. Hirsch et al. in [44] surveyed technologies and key drivers of microgrid implementation and research, at international level. Reported drivers in this context include extreme weather related concerns, cascading outages, cyber and physical attacks, deferral of infrastructure expansion costs, reduced line losses, efficiency improvements, savings, responsiveness, balancing loads, RE generation, etc. In [45], the authors present a residential microgrid day-ahead planning approach to accommodate appliance scheduling by modelling, among other things, inter-phase delay duration and time preference, in order to take advantage of shiftable loads and energy storage charging/discharging time. In [46], multi-microgrid configurations are presented and analyzed by means of the power line technology (AC, DC), layout (series, parallel, mixed), and interconnection technology (transformer, converter). A comparison of architectures based on cost, scalability, protection, reliability, stability, communications and business models is performed. Energy management and DR of multi-microgrids based on hierarchical multi-agent approach by introducing adjustable power is proposed by Bui et al. in [47]. Different operation modes are evaluated according to a two-level management cooperative multi-microgrid MILP-based model for day-ahead scheduling. Towards the application of state of the art, a microgrid energy management a Genetic Algorithm (GA) approach is applied in [48] to optimize cost strategies for scheduling distributed energy resources. The Quasi-static Artificial Bee Colony approach is used to optimize a multi-objective DR problem, based on the cost of energy and peak demand at the building level [49], including PV, Combined Heat and Power (CHP), batteries, electrical energy from the grid, and natural gas. Particle Swarm Optimisation is used in [50] to solve a bi-level problem modelling the interaction between the retailer and consumers. The energy hub is explored in [51] to develop a multi-carrier Demand-Side Management Time of Use (DSM ToU) optimization balancing energy import, conversion, and storage. Furthermore, a GA approach using present and day-ahead data was tested by Ferrari et al. [52] with respect to the management of loads of an experimental plant case study in Italy. The analysis involves PV, wind generation, a micro-CHP with a gas boiler, and an absorption chiller coupled with thermal storage.
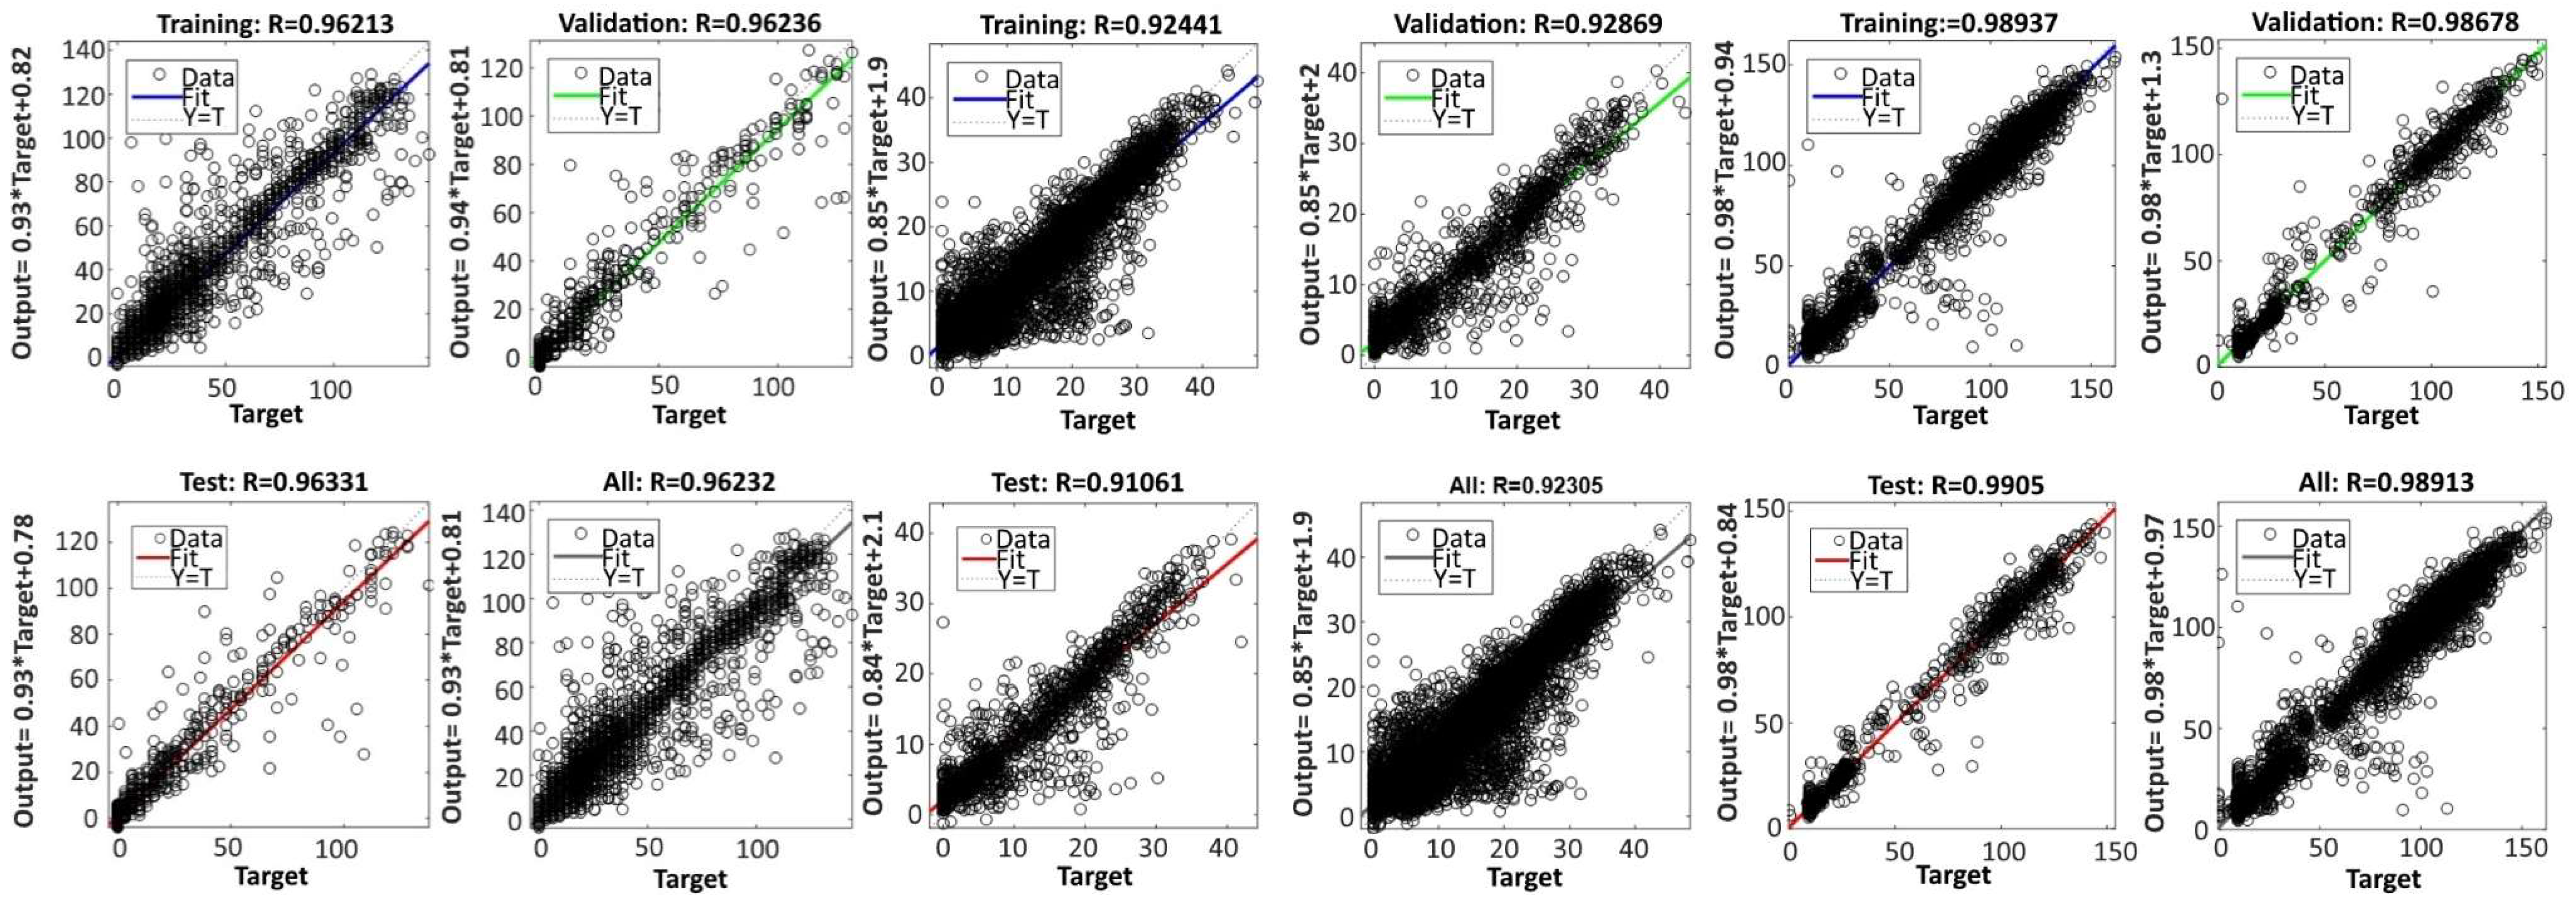
In addition, Artificial Neural Networks (ANN)-based short term power forecasting is practiced to estimate day-ahead loads and renewable energy production. ANN models are designed to imitate biological nervous system information processing and evolution. They have been used for years in different areas of engineering, science, and business to deal with highly complex and nonlinear data sets. The ANN models assimilate the natural bonds of neurons and their high level interconnection to model complex systems. In the case of short-term predictions, the ANN models can be more effective compared to statistical, linear, or non-linear programming techniques. They encompass capabilities such as adaptive learning, self-organization, real time operation, fault tolerance, and the approximation of complex nonlinear functions. Kalaitzakis et al. in [53] tested advanced neural network short-term load forecasting using data from the electric power grid of the island of Crete in Greece. Various structures and configurations were assessed, and a parallel processing approach for a 24 h-ahead prediction was demonstrated. ANN architectures for forecasting demand in electric power systems are presented in [54] by Tsekouras et al. A case study of the Greek electric power grid is used to explore the performance of different ANN configurations and factors, including period length and inputs for training, confidence interval, and more. Moreover, short term power forecasting is of particular value for prosumers to model, understand, and predict their consumption profiles, as well as to apply effective scheduling and control. A framework for district-level energy management and ANN forecasting at the building level was investigated by Hu et al. in [55], evaluating the performance for 6 buildings of different occupancy routines. Hybrid Short Term Load Forecasting ANN combined with techniques such as Fuzzy Logic, GA, and Particle Swarm Optimisation are briefly discussed in [31]. Furthermore, a 24 h-ahead prediction of excess power at microgrid level is proposed by Mavrigiannaki et al. [56], testing 3 different configurations with respect to possible exploitation potentials from an energy management perspective. Finally, an overview of load forecasting, dynamic pricing, and demand side management techniques in smart grid research applications reveals the potential for operational cost reductions between 5–25% [57].
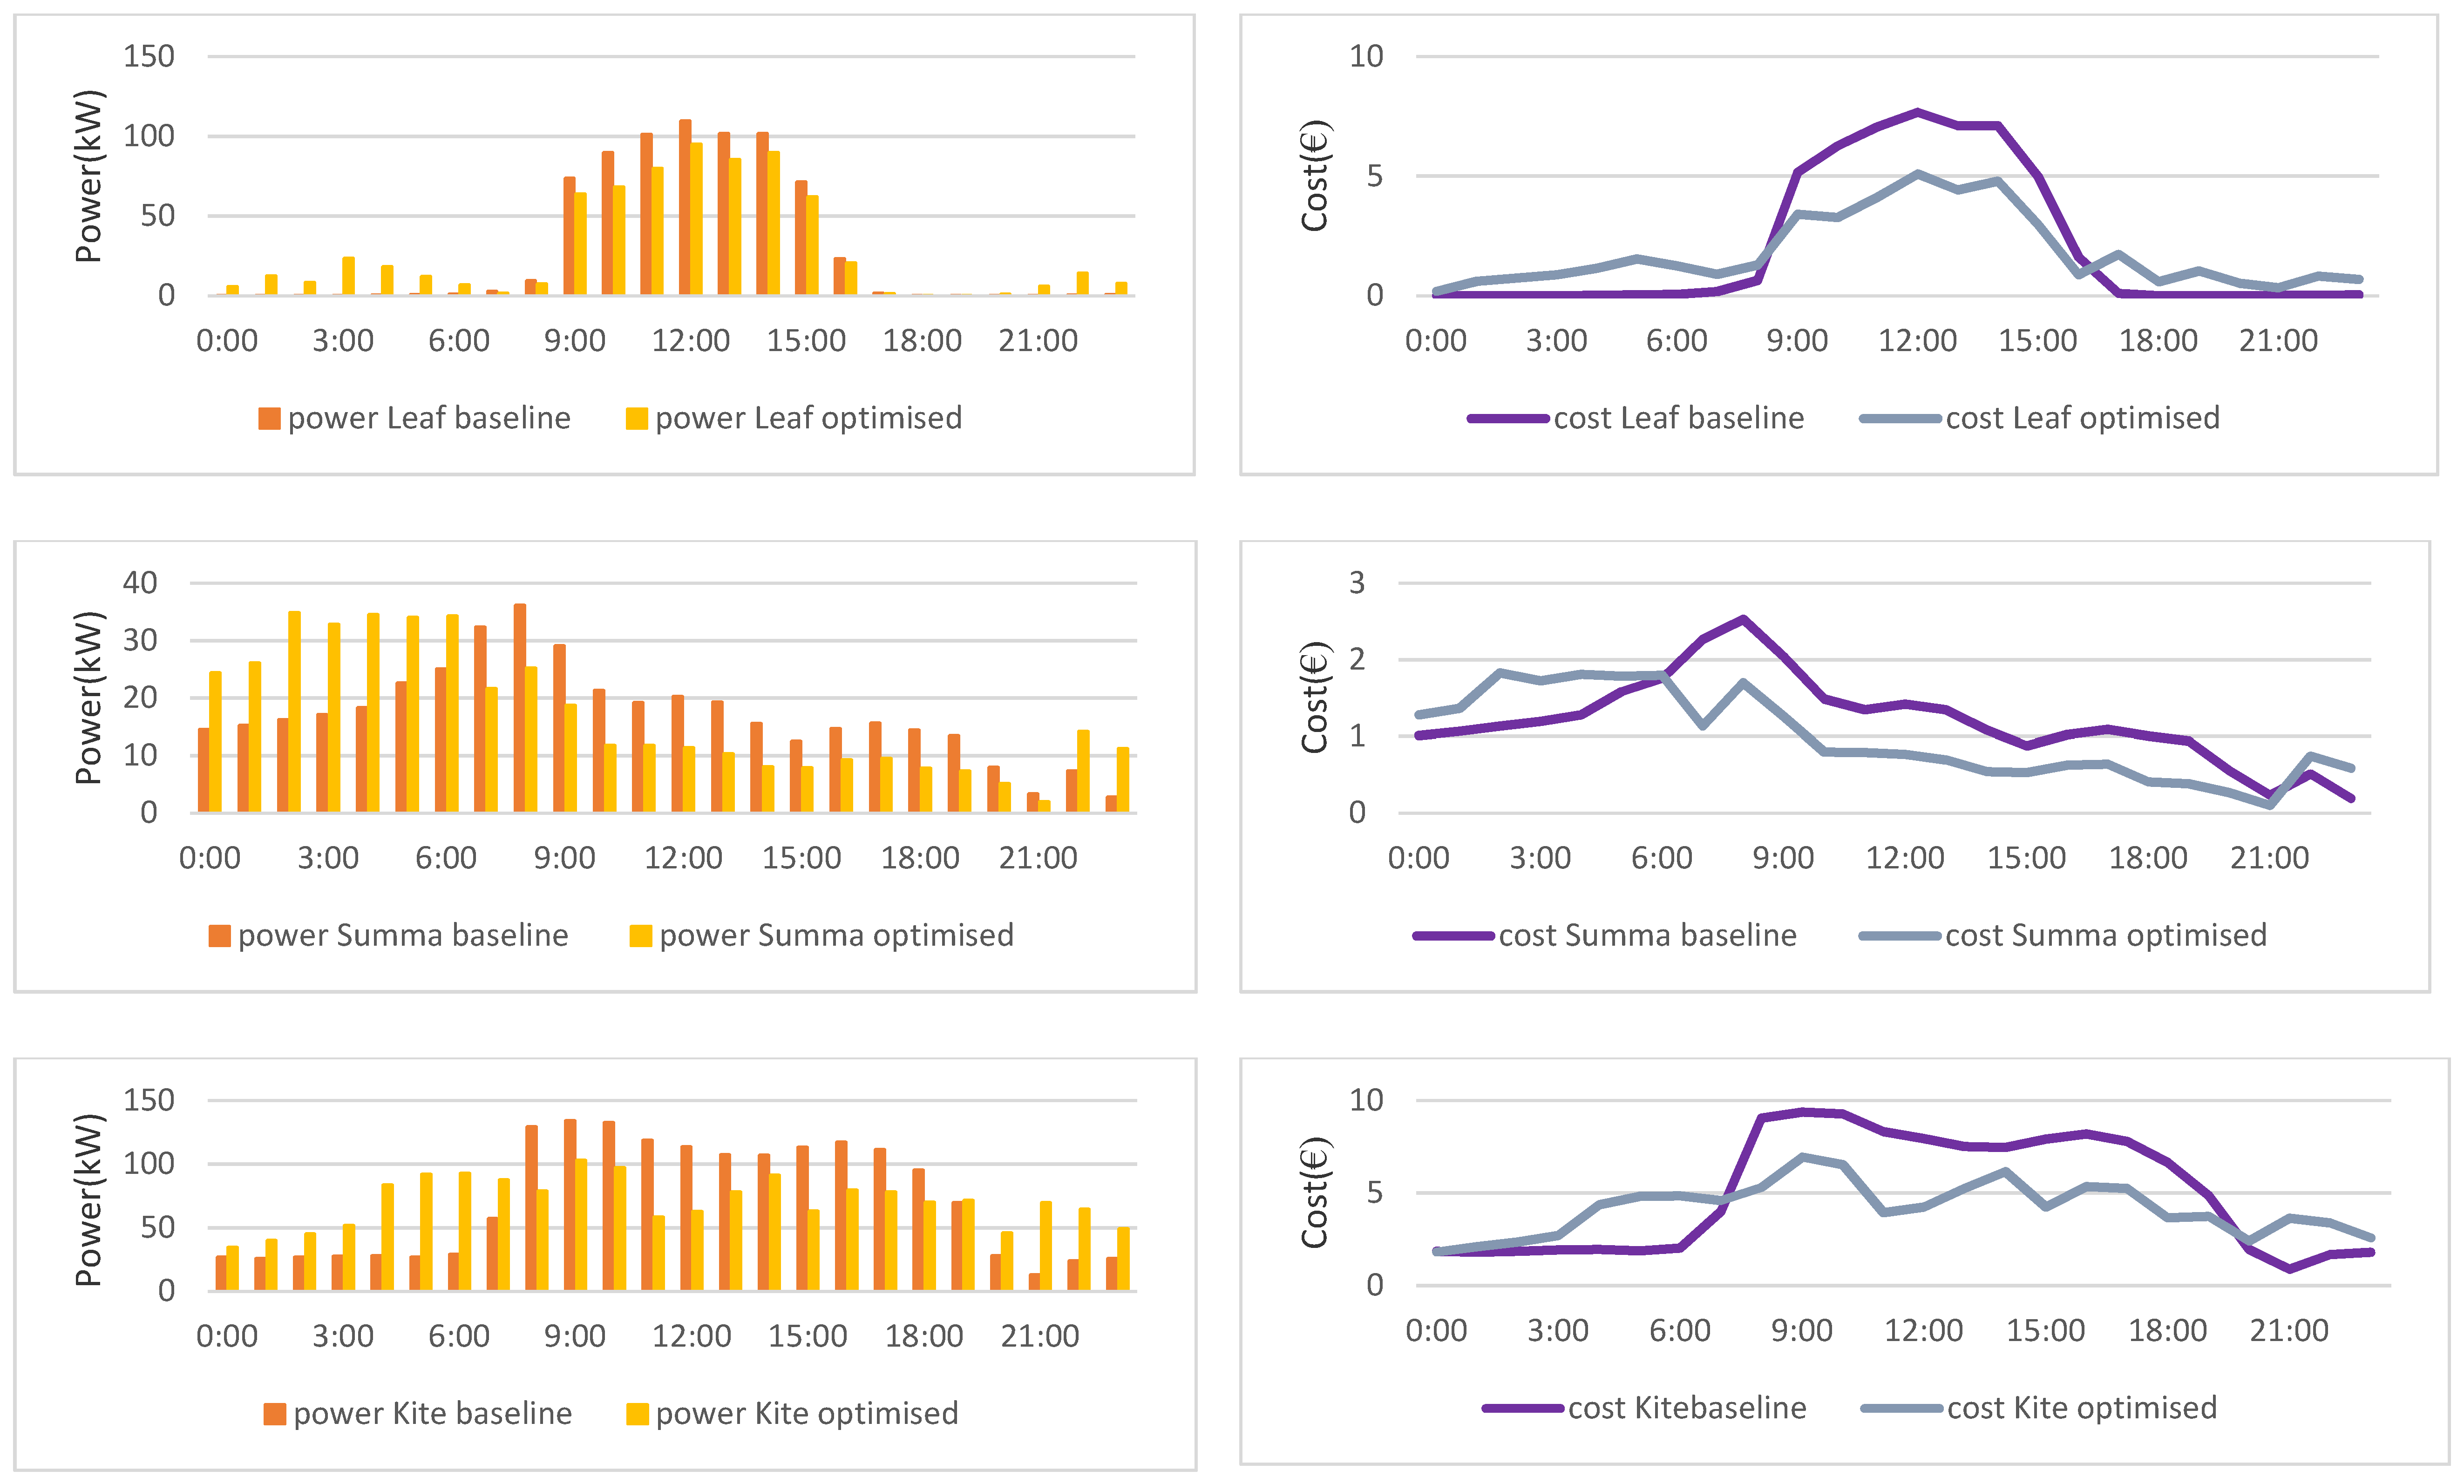
The aim of the research work presented here is the development and testing of a DR energy management GA-based optimisation approach based on day ahead ANN generated prediction models. The developed GA algorithm incorporates load shifting for the day ahead (24 h period), and evaluates possible alternatives based on cost and assumptions related to the practicality of the obtained solutions. The practical benefits of the proposed approach are linked to the development of a valuable tool for the evaluation of the potential rewards and risks of engagement in DR. In the case study that follows, a Time of Use pricing scheme is compared to a flat tariff.
The paper is organised as follows. In 
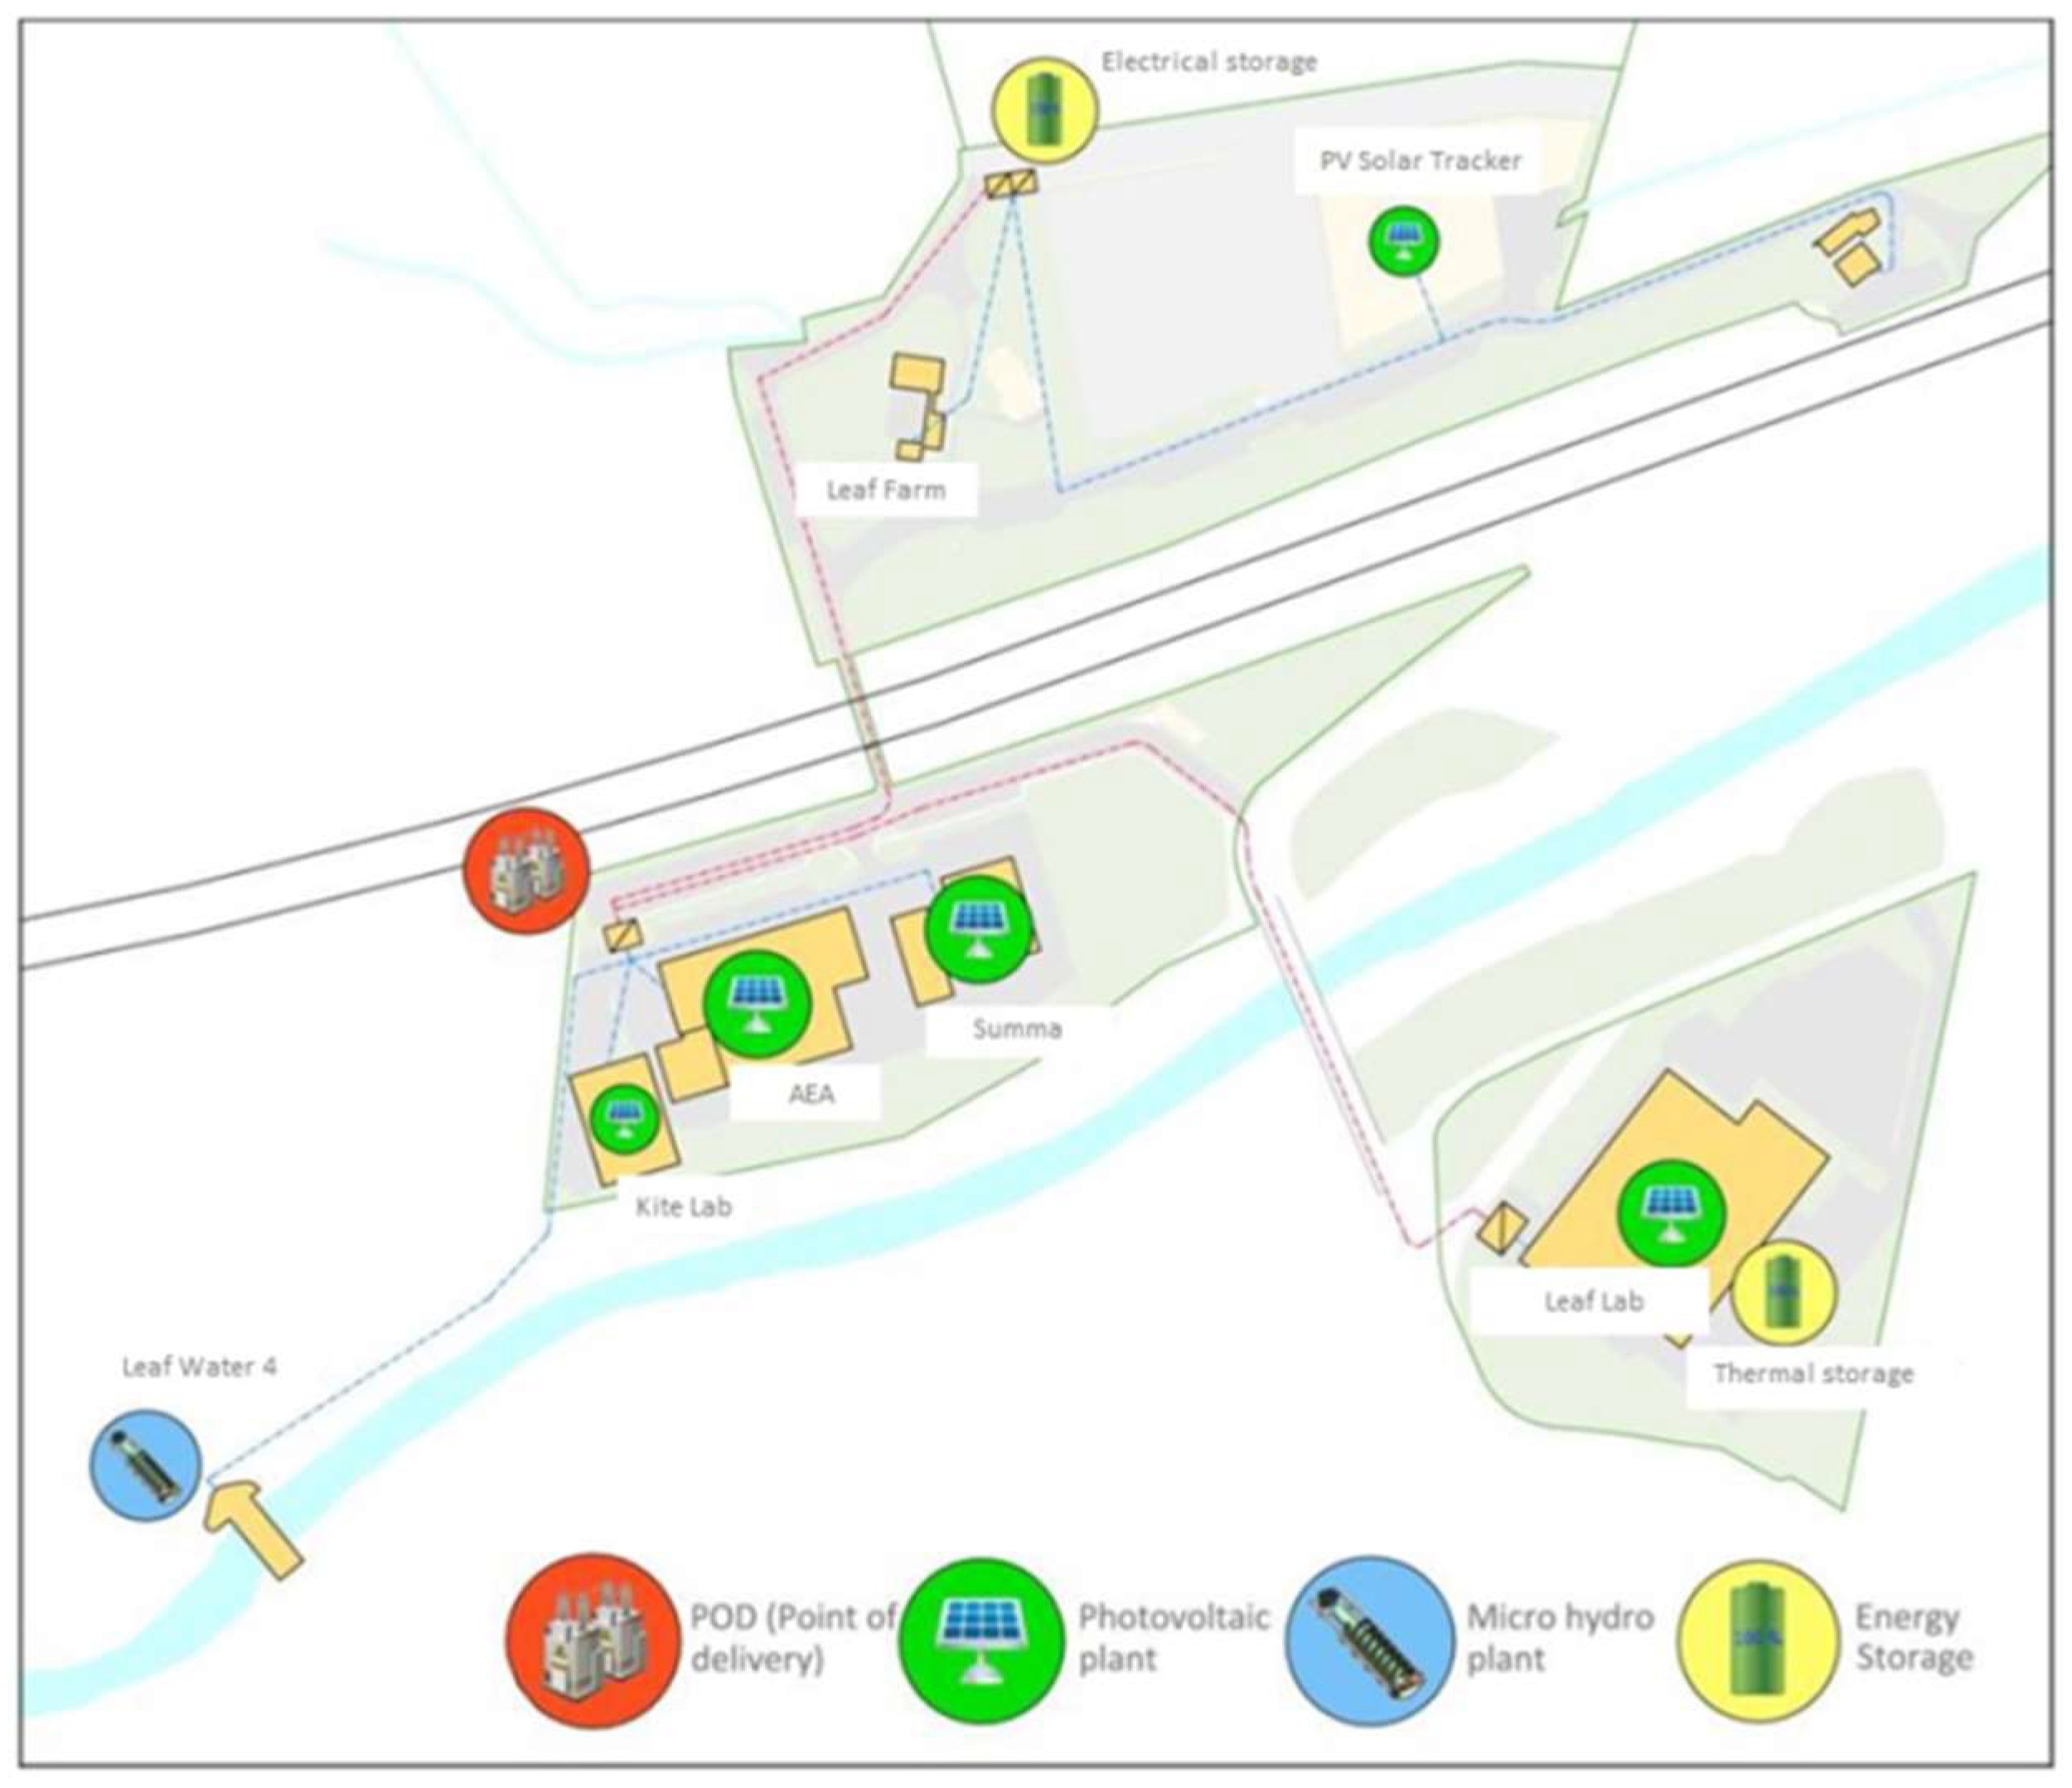
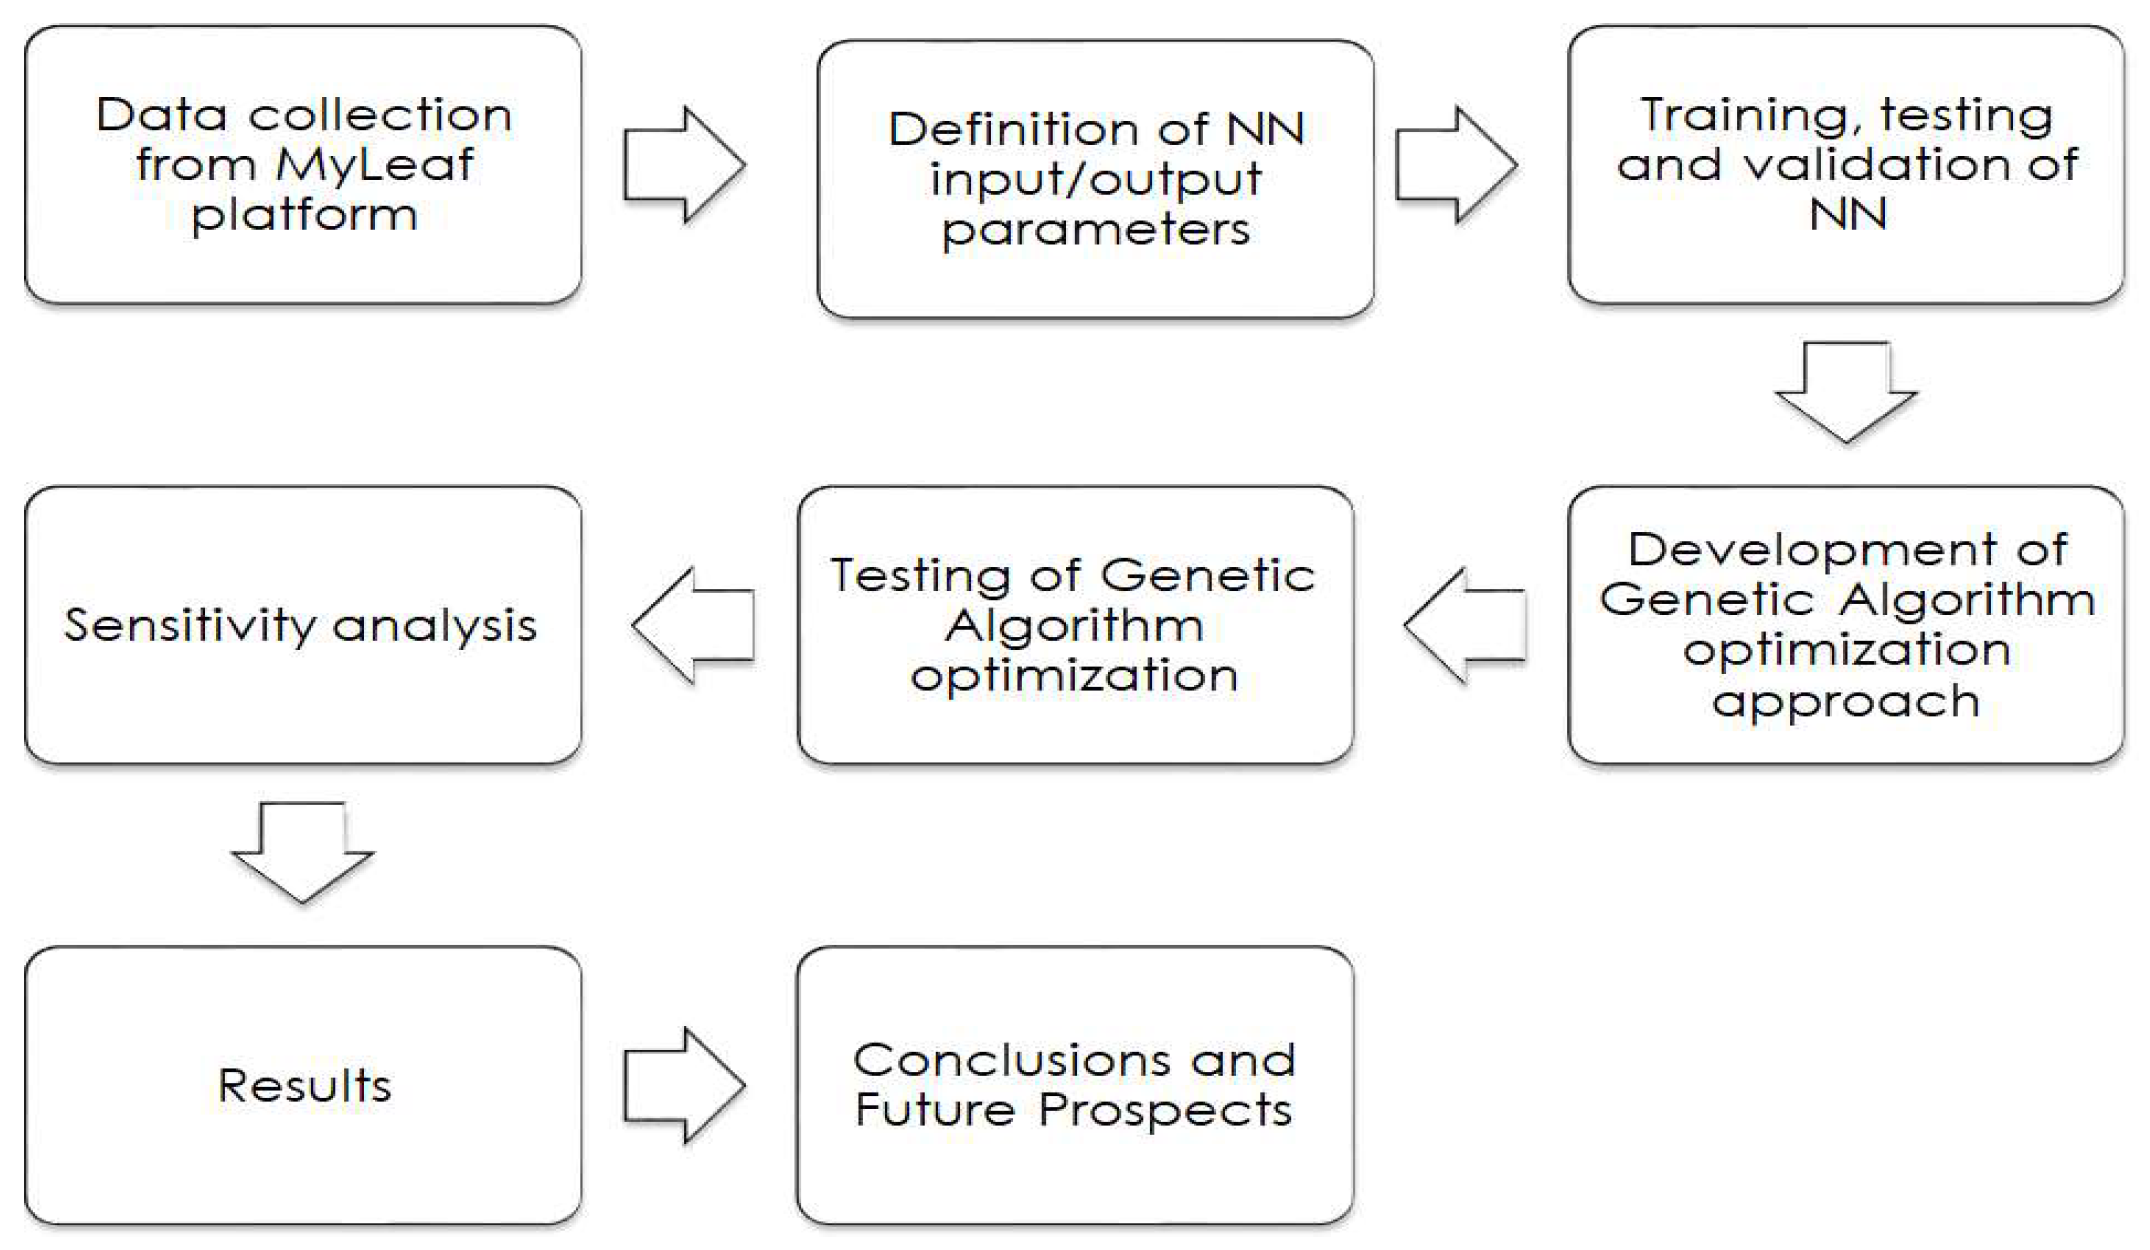
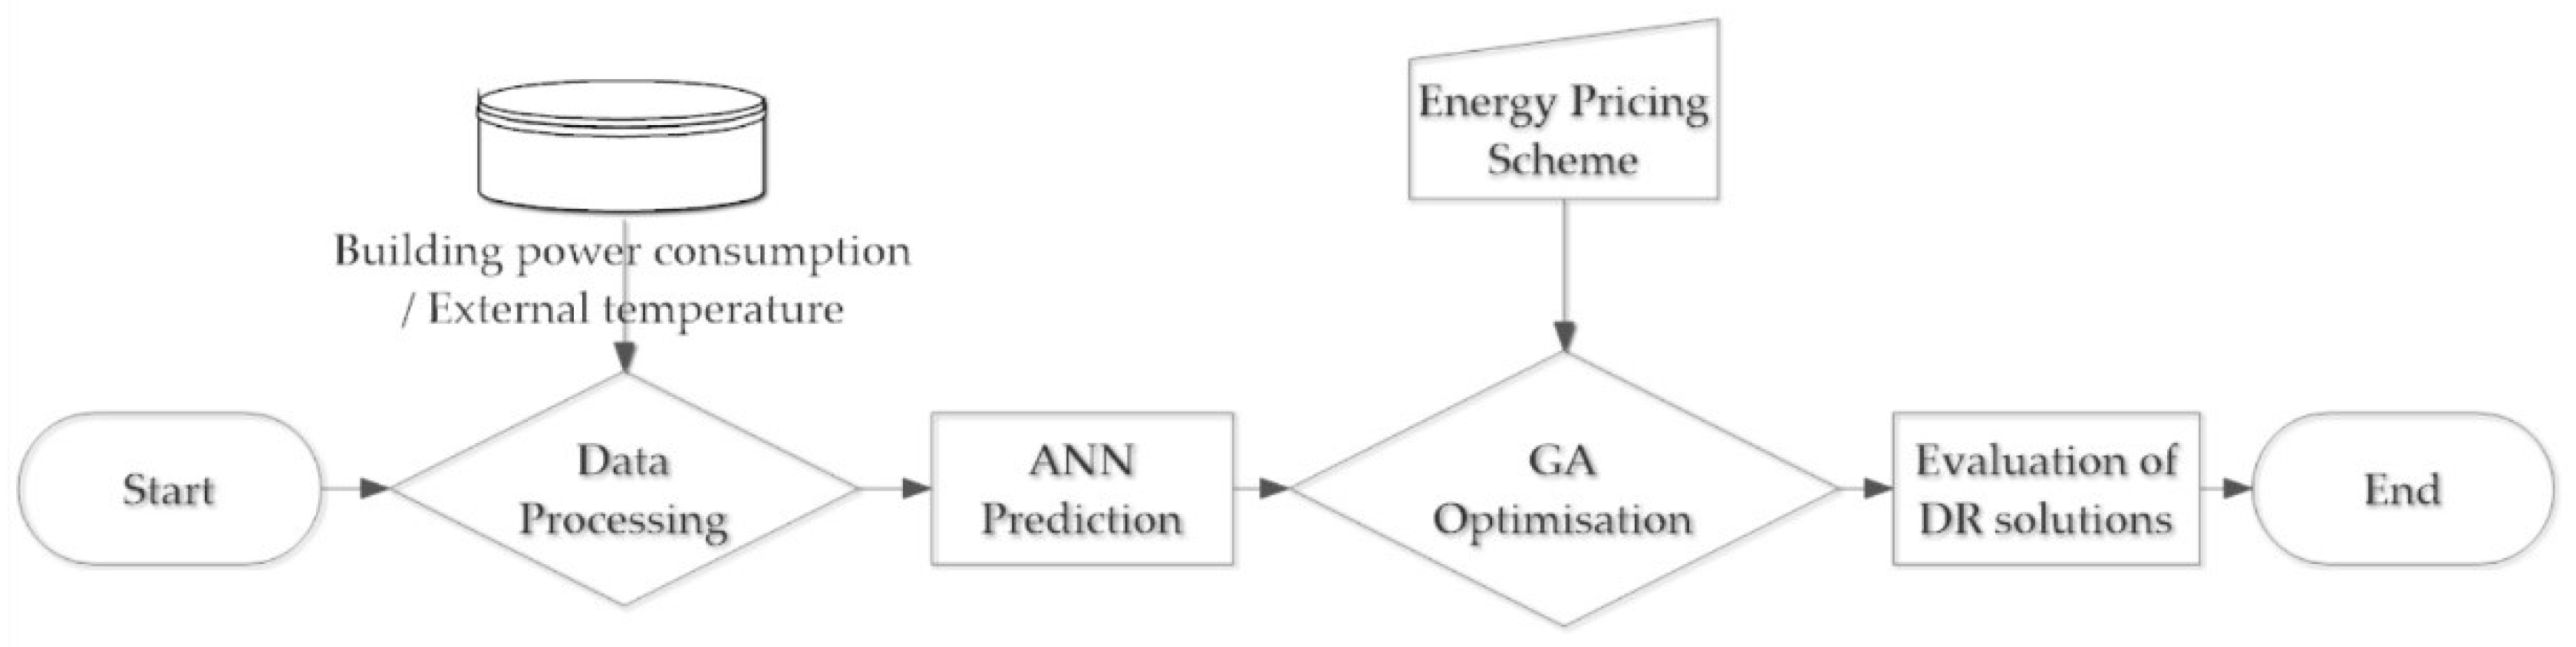
Section 2, the infrastructure and the applied methodology are presented. The proposed day-ahead GA approach for cost of energy and load shifting optimization based on ANN hourly power predictions is analyzed in 
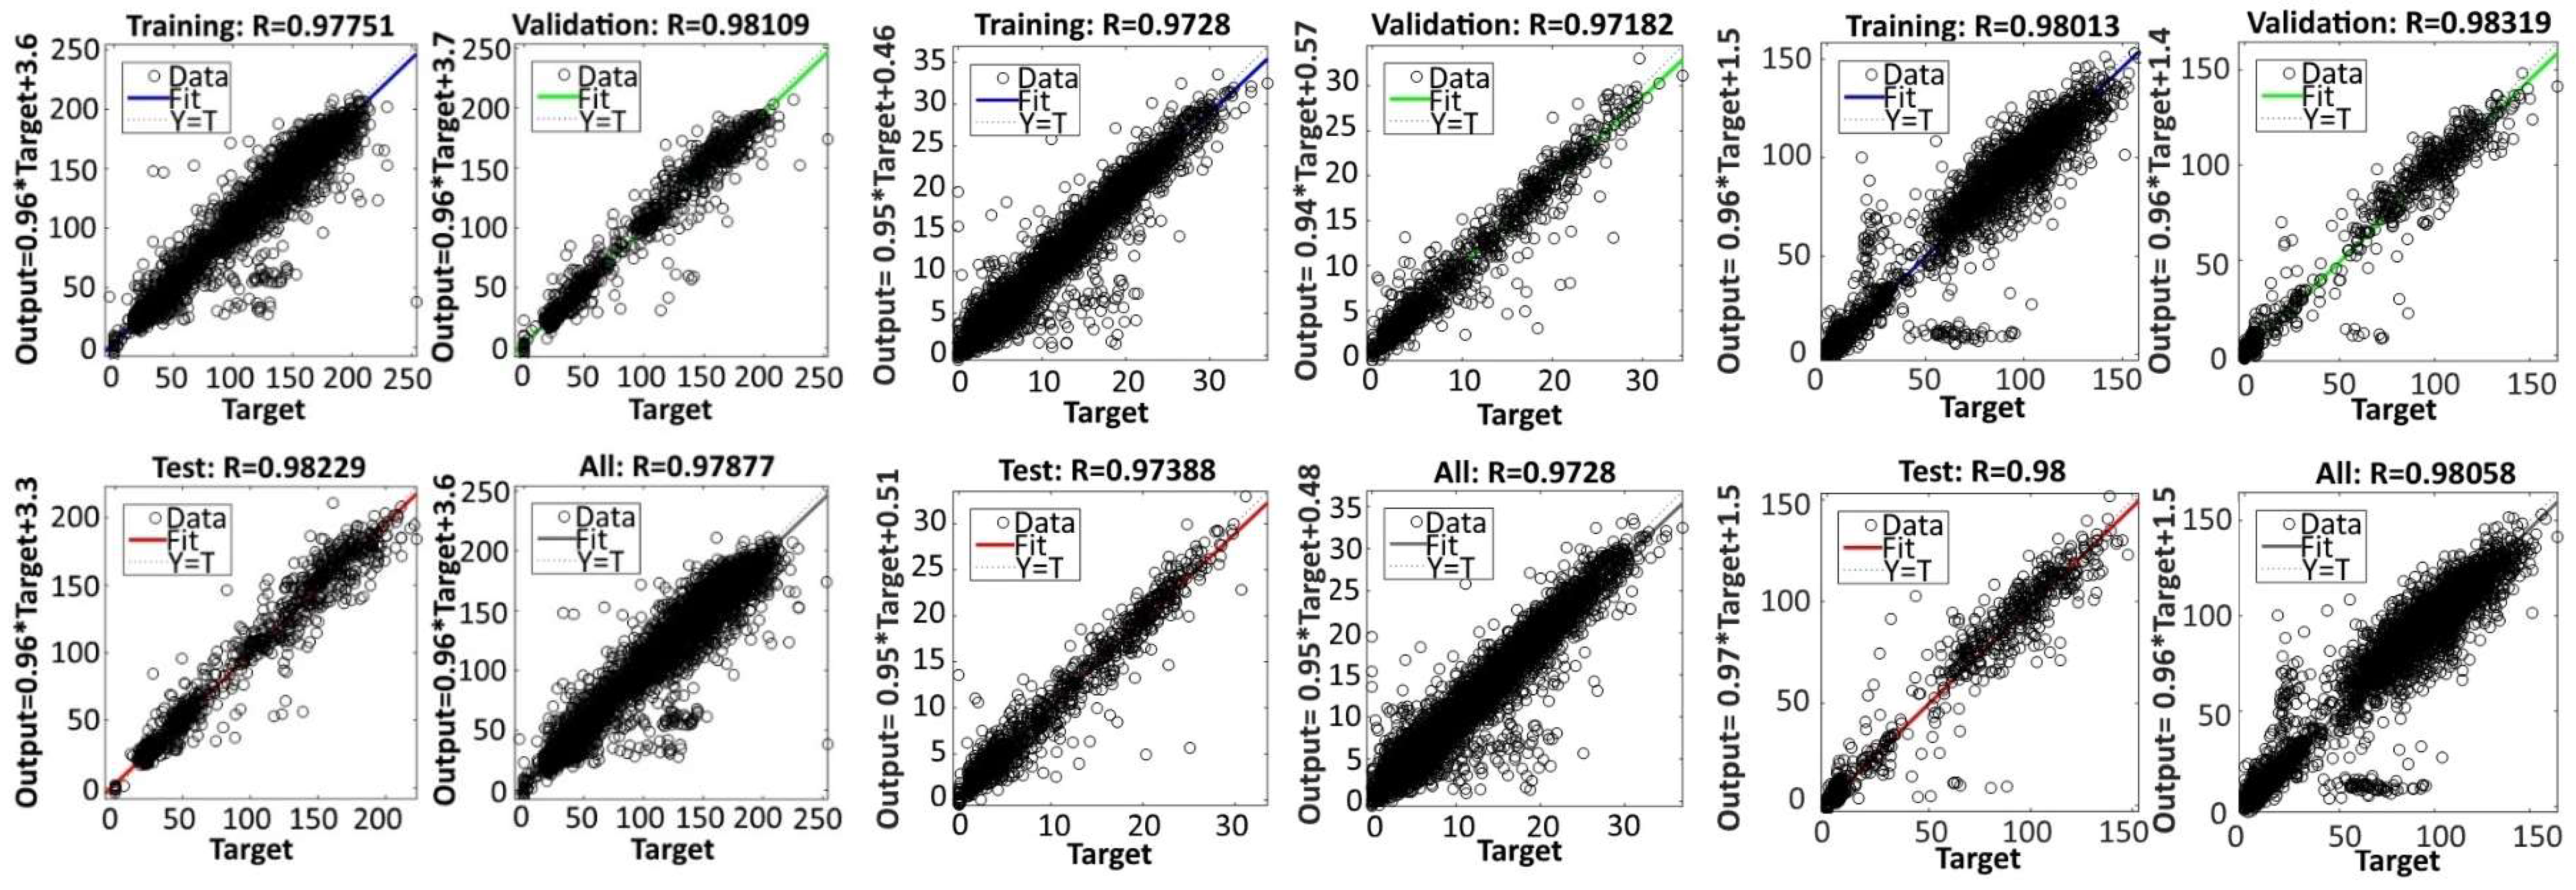
Section 3. Results and considerations on ANN power predictions and GA optimisation solutions are provided in Section 4. Finally, in Section 5, conclusions and recommendations for future work are summarised.

2. Infrastructure and Methods

The proposed novel approach was developed and tested on the basis of data available from the MyLeaf platform, which monitors and controls the Leaf Community buildings. The Leaf Community is located in Angeli di Rosora, a small rural area in Marche region of Italy. It hosts industrial facilities of the Loccioni Group, a firm leading research and innovation activities in energy, environment, automotive, aviation, and other sectors. The Leaf community (Figure 1) consists of 5 industrial buildings (L3-AEA, L4-Leaf Lab, L5-Kite Lab, L6), one office building (L2-Summa), and a building used mainly for business meetings (Leaf Farm). All buildings (except the Leaf Farm) are equipped with rooftop photovoltaics (PV) of total power 629.2 kWp, and ground water heat pumps. In addition, a 2-axis solar tracker of 18 kWp, a 48 kWp micro-hydro plant, a 224 kWh battery storage, and a 523.25 kWh/K thermal storage are connected to the microgrid, which also features electric vehicle charging stations. Buildings, renewable energy systems (PVs, micro-hydro), and storage systems are all coupled and connected to the main power grid via a single interconnection line (point of delivery).
The buildings in the Leaf Community are highly thermally-insulated, and are equipped with automations for controlling the HVAC systems, as well as the natural and artificial lighting by means of adjustable external louvers and luminance sensors. The primary annual energy consumption for the Leaf Lab, is rated at 35.4 kWh/m2 (including the PV power production and subtracting industrial consumption) [22], based on year-round measurements, while the L6 (new building, not fully operated yet), is estimated at 46.85 kWh/m2. These ratings prove to be a factual determinant of their near zero energy performance. Table 1 summarizes the basic components of the building envelopes and systems installed at the Leaf Community buildings under consideration.
The elaborated methodology comprises several steps, as shown in Figure 2.
  • Collection of data: All data from measuring equipment, sensors, and actuators in the Leaf Community is collected, organized, and made remotely available through the MyLeaf platform [33]. In this case, the MyLeaf platform is used to collect data on the power demand of the buildings considered in the analysis.
  • Development and testing of ANN models: ANN models are developed and exploited to perform day-ahead predictions of consumption power using Matlab. For the 24 h-ahead prediction of power consumption, the day of week, the time, and the external temperature are used as inputs, while the 24 h-ahead electrical power is used as a target. Trials of various combinations for the ANN model parameterization are performed, considering the structure, algorithm, the number of hidden layers, and the delays. A Lavemberg-Marquardt algorithm was deployed in a Nonlinear Autoregressive ANN structure with Exogenous Input (NARX), with 3 hidden layers and a delay of 1.
  • GA approach: A genetic algorithm (GA) optimization scheme was developed and tested in Matlab, in order to provide alternative solutions for load shifting. The GA optimization scheme is based on the mathematical model analyzed in Section 3. The objective function encounters of the criteria of energy and load shifting. Market information is used to construct the hourly pricing profiles used in the optimization process. Weighting coefficients are applied to both normalized criteria to enable consideration of several alternatives, depending on several priorities, and energy management capabilities. Weighting coefficients are used to provide a trade-off between cost and load shift. The role of weighting coefficients is to allow a decision maker to investigate a set of solutions and obtain solutions which better match his/her preferences. Preferences differ based on the decision maker’s knowledge and understanding, but may also be influenced by other factor priorities during the various time periods. For example, cost savings could be considered to be the “default” priority, but during certain periods, the minimization of load shifting could be upgraded to become the dominant factor in the optimization process.
  • Sensitivity analysis and evaluation of results: Sensitivity analysis is performed by changing the GA parameters, such as crossover, population size, mutation rate, tolerance etc. Furthermore, since load shifting is related to changes in the operation of building systems (HVAC, lighting, etc.) and operations (industrial, office), it also needs to be minimized in order to avoid significant intervention in the buildings’ use. On the other hand, the cost of energy is minimized when load shifting occurs from hours of high prices to hours of low prices. The solutions are hence evaluated considering the hourly/daily cost of energy and load shifting preferences.
The developed approach is illustrated with the aid of the flowchart of Figure 3.

3. The Proposed Day-Ahead GA Approach for Cost of Energy/Load Shifting Optimization Based on ANN Hourly Power Predictions

The GA optimisation scheme is based on the developed mathematical model presented hereafter. The two criteria, namely the normalised cost of energy and load shifting, form the objective function as shown in Equation (1):
f = min ( w 1 C o s t E C o s t E m a x + w 2 L o a d S h i f t L o a d S h i f t _ m a x )
At building group level, the cost and load shift terms of the objective function in Equation (1), are given by Equations (2) and (6) which are further specified by Equations (3)–(5) and (7)–(9), respectively.
C o s t E = C o s t E _ L a b + C o s t E _ S u m m a + C o s t E _ _ K i t e
Terms in Equation (2) are calculated based on Equations (3)–(5), as shown below:
C o s t E _ L a b = h = 1 24 X E _ _ L a b h C E _ u n i t h
C o s t E _ Summa = h = 1 24 X E Summa h C E _ u n i t h
C o s t E _ K i t e = h = 1 24 X E _ K i t e h C E u n i t h
L o a d S h i f t = L o a d S h i f t _ L a b + L o a d S h i f t _ S u m m a + L o a d S h i f t _ K i t e
where:
L o a d S h i f t _ L a b = h = 1 24 a b s ( X E L a b h X E L a b b a s e l i n e h )
L o a d S h i f t S u m m a = h = 1 24 a b s ( X E Summa h X E Summa b a s e l i n e h )
L o a d S h i f t _ K i t e = h = 1 24 a b s ( X E K i t e h X E K i t e b a s e l i n e h )
The following constraints in Equations (10)–(12) are applied to ensure that there is no deviation between the total daily energy consumed between baseline and the optimized solutions for each building:
h = 1 24 X E L a b h h = 1 24 X E L a b b a s e l i n e h = 0
h = 1 24 X E Summa h h = 1 24 X E Summa b a s e l i n e h = 0
h = 1 24 X E K i t e h h = 1 24 X E K i t e b a s e l i n e h = 0
Whether the optimization concerns a building or a building group analysis, for the evaluation of the GA based results, a comparison to baseline consumption, as obtained by the Artificial Neural Network day-ahead prediction, is conducted. The total cost linked to the genetic algorithm optimized solution is compared to the total cost of the baseline scenario, as evaluated by Equations (13) and (14) respectively:
C o s t E _ o p t = h = 1 24 X E o p t h C E u n i t h
C o s t E _ b a s e l i n e = h = 1 24 X E b a s e l i n e h C E u n i t h

4. Results and Discussion

4.1. ANN Based Predictions

The results of ANN-based predictions for the period from 1 May 2017 to 1 August 2017 and from 1 December 2017 to 1 March 2018, for each building, are presented in Figure 4 and Figure 5, respectively. Day-ahead predicted values for Leaf Lab, Summa, and Kite Lab appear to be, in most cases, very close to real values, featuring a Pearson’s correlation coefficient R in the range 0.96–0.98 for training, validation, testing, and overall. Lower R values are observed for Summa during the winter period.
At the left column of Figure 6, predicted versus real values of consumption power for the 3 buildings under study, are presented. At the right column of Figure 6, predicted versus real values of power are presented for the period from 12 February 2018 to 16 February 2018. Mean Bias Error (MBE) and Mean Average Percentage Error (MAPE) values, for the ANN predicted versus actual values on 21 July 2017 and 16 February 2018 for Leaf Lab, Summa, and Kite Lab, are presented in Table 2.

4.2. Genetic Algorithm Optimization Results

In this section, the GA optimization results for 21 July 2017 and 16 February 2018 are presented and analyzed for the weighting coefficient values w 1 = w 2 = 0.5 . For the baseline scenario, a flat tariff at 0.07 €/kWh is used. The optimized scenario is calculated taking into account a 2-zone tariff pricing scheme of 0.0675 €/kWh from 8 a.m. to 6 p.m., and 0.0525 €/kWh from 6 p.m. to 8 a.m. (Figure 7).
In Figure 8 and Figure 9, the results of the developed GA optimization approach are presented. The charts on the left columns of these figures illustrate the ANN-based power forecast as a baseline scenario. In the same charts, the GA optimized power profiles demonstrate load-shifting solutions. The related costs are depicted in the right columns of the Figures. The baseline costs are calculated based on the flat tariff of Figure 7, while the GA optimized costs are based on the 2-zone tariff of the same figure.
With respect to the Leaf Lab, it is observed in Figure 8 that load shifting occurs from the high-price to low-price hours. This is also reflected, in terms of the cost profile, on the day which accounts for a reduction of 15.77% from €174.97 to €147.37. Likewise, the load in Summa is shifted outside the high price region, with the baseline daily cost of €20.55 being decreased down to €17.80, a relevant reduction of 13.38%. Similarly, the load shifting in Kite Lab occurs from the high tariff zone towards the morning and the evening hours, without a reduction in total power consumption. In this case, the baseline cost is €101.89, and the optimized total cost is €87.40, achieving a reduction percentage of 14.22%.
The analysis of the winter results is displayed in Figure 9. The shift for the Leaf Lab power profile leads to a cost reduction of 10.23% from €48.21 in the baseline scenario down to €43.27.
Load shifting throughout the 24 h occurs in Summa in a way that changes the overall power profile to the early hours of the day. This transition of loads corresponds to 18.59% of costs savings, reflecting also the differences between the flat and the 2-zone tariff pricing scheme.
With respect to the daily power in Kite Lab during the winter, changes between baseline and optimized scenarios appear to take place in a harmonic way from high to low price hours. In this case, a 14.97% cost saving is achieved, since the baseline daily cost is €118.1, compared to the optimized daily cost of €100.42.
In Figure 10, the total power consumption of the 3 buildings is illustrated. In the first case, the high power consumption according to the baseline power is shifted from working hours towards early morning and late evening hours. In terms of cost, the total baseline cost at district level is 293.95 €, and the total optimized cost is €251.30, corresponding to a 14.51% reduction.
With respect to the winter period, the hourly-district level GA-optimized power values for equal weighting coefficients undergo a smooth differentiation to the left of the graph with respect to the baseline. The district-level total baseline cost is €195.27, and the total optimized cost is €167, achieving a reduction percentage of 14.47%.
According to Table 3, regarding the Leaf Lab, the results for each case prove that the optimization is successful, bearing in mind that the baseline cost is €174.90 and the optimized values range from €142.24 to €153.97, a maximum operational costs percentage reduction of 18.67%. For Summa, as for the Leaf Lab, the optimized cost for each pair of weights is lower than the baseline cost of €20, and varies between €17.80 and €17.12. The percentage reduction in this case reaches 14.4% Furthermore, the optimization for the Kite Lab revealed that the GA produces better results compared to the baseline cost of €101.9 for all pairs of weights ranging from €87.62 down to €85.78. The percentage reduction in this case is up to 15.82%. The last column of the table represents the optimized cost for the group of buildings, which is lower than the baseline cost of €293 for all pairs of weighting coefficients varying from €253.91 to €247.89. The maximum percentage reduction in this case is 15.39%.
Table 4 includes the results of optimization for each pair of weighting coefficients at both the building and district levels for the winter period. The results for the Leaf Lab depict the optimized cost for all weights combinations. As shown, in all cases, the optimized cost varies between €43.48 to €42.81, which is lower than the baseline cost of €48 in this case, and accounts for a percentage reduction of up to 10.81%. Moreover, the optimization for the Summa building revealed genetic algorithm solutions with costs from €23.58 to €23.27, a percentage reduction of 16.89% compared to the baseline cost of €28 in this building. Subsequently, in the Kite Lab, the optimized cost is from €102.06 down to €99.85, equal to a percentage reduction of up to 15.38% lower than the baseline cost of €118. The last column represents the optimized cost in the group of buildings during the winter, varying from €168.19 to €166.53, leading to a percentage reduction of 14.6% compared to the baseline cost of €195.

4.3. Limitations of the Adopted Two-Level Model

The proposed approach entails some level of abstraction with respect to the load shift which is achievable within the capacity of individual systems and components. Evaluating load shift in conjunction with a pricing scheme requires deep knowledge, and depends on the specificities of each case study. In this respect, load shift is determined by technical factors, i.e., installed systems technical characteristics, control scheme, etc., as well as organisational factors, i.e., the potential shift of the industrial operations within each building. A detailed knowledge of the operation of each system in a building, along with data, i.e., power consumption profile, is not available in most cases. This logic can be applied to some extent by using constraints to ensure that a specific percentage of the power at any time remains unchanged. Consequently, optimisation can be conducted based on the flexible share of the consumption power for every hour.
Also, the proposed approach is linked to the accuracy of the prediction, which may vary according to the building under study, and other factors, e.g., type of loads, industrial operations, season, etc. Therefore, it is important to evaluate the risk associated with different prediction error levels according to the examined pricing scheme. Although this risk is low in a two zone pricing scheme, it may become significant when considering dynamic pricing profiles.

5. Conclusions

The main contribution of this work is related to linking ANN short-term electric forecasting and GA multi-objective optimization as a tool for generating and evaluating alternative day-ahead load shifting solutions. The first step of the proposed approach is exploiting Artificial Neural Network modelling for the prediction of the power consumption in a period of 24 h ahead. Predictions of hourly-consumption power levels using day of week, time of day, and external temperature as inputs were obtained for each of the 3 buildings of the Leaf Community (Leaf Lab, Summa, and Kite Lab). The results proved that a close correlation between predicted and actual values exists during the studied summer and winter periods, as evaluated based on correlation coefficient R for the whole period, as well as Mean Bias Error (MBE) and Mean Average Predicted Error (MAPE) for the specific days used in the optimization process.
The second step was to create an optimization function to include energy cost and load shifting using appropriate variables and constraints. The objective function was minimized using a Genetic Algorithm to obtain solutions at individual building and building group levels. Results demonstrated the effectiveness of this approach in considering alternative pricing schemes and load shifting possibilities as a way to examine cost savings. Cost savings of between 10.81% and 18.67% at the building level were associated with significant load shifting solutions obtained by the GA scheme in the considered two-zone ToU pricing scheme. At the district level, cost savings in the range of 13.34% and 15.39% were obtained.
Future steps in this work may involve: (i) extending research activities to include renewable energy generation and storage capabilities, (ii) reforming the GA obtained solutions so as to take into consideration actual loads (base, fixed, flexible), renewable energy production, and storage, and (iii) exploiting the potential for improvements in power predictions using ANN models.

Author Contributions

Conceptualization, N.K. and D.K.; methodology, N.K., E.T. and D.K.; software, N.K. and E.T.; validation, N.K., E.T. and D.K.; formal analysis, N.K.; investigation, N.K., D.K. and E.T.; resources, D.K., C.C. and D.I.; data curation, N.K. and E.T.; writing—original draft preparation, N.K. and E.T.; writing—review and editing, N.K., E.T., D.K. and K.K.; visualization, N.K., D.K. and E.T.; supervision, D.K. and K.K.; project administration, D.K. and C.C.; funding acquisition, D.K., N.K. and C.C.

Funding

This project has received funding from the European Union’s Horizon 2020 research and innovation programme under the Marie Skłodowska-Curie grant agreement No 645677.

Conflicts of Interest

The authors declare no conflict of interest.

Abbreviations

ACAlternated Current
ADRAutomated Demand Response
AMIAdvanced Metering Infrastructure
ANNArtificial Neural Network
ARCAggregators or Retail Customers
BEMsBuilding Energy Management Systems
CHPCogeneration of Heat and Power
CPPCritical Peak Pricing
CSPCurtailment Service Providers
DCDirect Current
DEMsDistrict Energy Management Systems
DERDistributed Energy Resources
DRDemand Response
DRPDemand Response Provider
DSMDemand Side Management
EEDEnergy Efficiency Directive
GAGenetic Algorithm
HVACHeating, Ventilation, Air Conditioning
HRESHybrid Renewable Energy Systems
IoTInternet of Things
MINLPMixed Integer Non Linear Programming
PVPhotovoltaic
PSOParticle Swarm Optimisation
RTPReal Time Pricing
ToUTime of Use

Nomenclature

Cos t E district daily energy operating costs (€)
Cos t E max normalisation factor of cost criterion (€)
Cos t E _ Lab daily energy operating costs of Leaf Lab (L4) building (€)
Cos t E _ Summa daily energy operating costs of Summa (L2) building (€)
Cos t E _ Kite daily energy operating costs of Kite (L5) building (€)
C E _ unit h day-ahead hourly unit cost of energy in each building (€/kWh)
Cos t E _ baseline total cost of the baseline scenario
Cos t E _ opt total cost of the genetic algorithm optimised solution
Load Shift daily load shift (kWh)
Load Shift _ max normalisation factor of load shift criterion (kWh)
Load Shift _ Lab daily load shift of Leaf Lab (L4) building (kWh)
Load Shift _ Summa daily load shift of Summa (L2) building (kWh)
Load Shift _ Kite daily load shift of Kite (L5) building (kWh)
w 1 Weighting coefficient of cost criterion [0–1]
w 2 Weighting coefficient of load shift criterion [0–1]
X E h hourly value of total energy consumption in each building (kWh)
X E Lab h hourly value of total energy consumption in Leaf Lab (L4) building (kWh)
X E Lab baseline h Baseline (predicted) hourly value of total energy consumption in Leaf Lab (L4) building (kWh)
X E Summa h hourly value of total energy consumption in Summa (L2) building (kWh)
X E Summa baseline h baseline (predicted) hourly value of total energy consumption in Summa (L2) building (kWh)
X E _ Kite h hourly value of total energy consumption in Kite (L5) building (kWh)
X E Kite baseline h baseline (predicted) hourly value of total energy consumption in Kite (L5) building (kWh)
X E opt h GA optimised hourly electrical energy (kWh) at building or building group level
X E baseline h baseline hourly electrical energy (kWh) based on day-ahead Neural Network predictions

References

  1. Greer, C.; Wollman, D.A.; Prochaska, D.E.; Boynton, P.A.; Mazer, J.A.; Nguyen, C.T.; FitzPatrick, G.J.; Nelson, T.L.; Koepke, G.H.; Hefner, A.R., Jr.; et al. NIST Framework and Roadmap for Smart Grid Interoperability Standards, Release 3.0; Special Publication (NIST SP): Gaithersburg, MD, USA, 2014. [Google Scholar]
  2. Rietveld, G.; Clarkson, P.; Wright, P.S.; Pogliano, U.; Braun, J.-P.; Kokalj, M.; Lapuh, R.; Zisky, N. Measurement infrastructure for observing and controlling smart electrical grids. In Proceedings of the 2012 3rd IEEE PES International Conference and Exhibition on Innovative Smart Grid Technologies (ISGT Europe), Berlin, Germany, 14–17 October 2012. [Google Scholar]
  3. NERC. Demand Response Availability Data System (DADS): Phase I & II Final Report; North American Electric Reliability Corporation: Atlanta, GA, USA, 2011. [Google Scholar]
  4. European Parliament. Directive 2012/27/EU of the European Parliament and of the Council of 25 October 2012 on Energy Efficiency; European Parliament: Brussels, Belgium, 2012; pp. 1–56. [Google Scholar]
  5. Bertoldi, P.; Zancanella, P.; Boza-Kiss, B. Demand Response Status in EU Member States; EUR 27998 EN; Joint Research Centre: Ispra, Italy, 2016. [Google Scholar]
  6. OpenADR Alliance. OpenADR 2.0 Demand Response Program Implementation Guide; OpenADR Alliance: San Ramon, CA, USA, 2014. [Google Scholar]
  7. Siano, P. Demand response and smart grids—A survey. Renew. Sustain. Energy Rev. 2014, 30, 461–478. [Google Scholar] [CrossRef]
  8. Aalami, H.A.; Moghaddam, M.P.; Yousefi, G.R. Demand response modeling considering Interruptible/Curtailable loads and capacity market programs. Appl. Energy 2010, 87, 243–250. [Google Scholar] [CrossRef]
  9. Kusiak, A.; Tang, F.; Xu, G. Multi-objective optimization of HVAC system with an evolutionary computation algorithm. Energy 2011, 36, 2440–2449. [Google Scholar] [CrossRef]
  10. Ghazvini, M.A.F.; Soares, J.; Morais, H.; Castro, R.; Vale, Z. Dynamic pricing for demand response considering market price uncertainty. Energies 2017, 10, 1–20. [Google Scholar]
  11. Triki, C.; Violi, A. Dynamic pricing of electricity in retail markets. 4OR 2009, 7, 21–36. [Google Scholar] [CrossRef]
  12. Haider, H.T.; See, O.H.; Elmenreich, W. Residential demand response scheme based on adaptive consumption level pricing. Energy 2016, 113, 301–308. [Google Scholar] [CrossRef]
  13. Tsui, K.M.; Chan, S.C. Demand Response Optimization for Smart Home Scheduling under Real-Time Pricing. IEEE Trans. Smart Grid 2012, 3, 1812–1821. [Google Scholar] [CrossRef]
  14. Crosbie, T.; Broderick, J.; Short, M.; Charlesworth, R.; Dawood, M. Demand Response Technology Readiness Levels for Energy Management in Blocks of Buildings. Buildings 2018, 8, 13. [Google Scholar] [CrossRef]
  15. Crosbie, T.; Short, M.; Dawood, M.; Charlesworth, R. Demand response in blocks of buildings: Opportunities and requirements. Entrep. Sustain. Issues 2017, 4, 271–281. [Google Scholar] [CrossRef]
  16. Attia, M.; Haidar, N.; Senouci, S.M.; Aglzim, E.H. Towards an efficient energy management to reduce CO2emissions and billing cost in smart buildings. In Proceedings of the 2018 15th IEEE Annual Consumer Communications & Networking Conference (CCNC), Las Vegas, NV, USA, 12–15 January 2018; pp. 1–6. [Google Scholar]
  17. Kolokotsa, D. The role of smart grids in the building sector. Energy Build. 2016, 116, 703–708. [Google Scholar] [CrossRef]
  18. Karlessi, T. The Concept of Smart and NZEB Buildings and the Integrated Design Approach. Procedia Eng. 2017, 180, 1316–1325. [Google Scholar] [CrossRef]
  19. Diakaki, C.; Grigoroudis, E.; Kolokotsa, D. Towards a multi-objective optimization approach for improving energy efficiency in buildings. Energy Build. 2008, 40, 1747–1754. [Google Scholar] [CrossRef]
  20. Kolokotsa, D.; Diakaki, C.; Grigoroudis, E.; Stavrakakis, G.; Kalaitzakis, K. Decision support methodologies on the energy efficiency and energy management in buildings. Adv. Build. Energy Res. 2009, 3, 121–146. [Google Scholar] [CrossRef]
  21. Diakaki, C.; Grigoroudis, E.; Kabelis, N.; Kolokotsa, D.; Kalaitzakis, K.; Stavrakakis, G. A multi-objective decision model for the improvement of energy efficiency in buildings. Energy 2010, 35, 5483–5496. [Google Scholar] [CrossRef]
  22. Kampelis, N.; Gobakis, K.; Vagias, V.; Kolokotsa, D.; Standardi, L.; Isidori, D.; Cristalli, C.; Montagnino, F.M.; Paredes, F.; Muratore, P.; et al. Evaluation of the performance gap in industrial, residential & tertiary near-Zero energy buildings. Energy Build. 2017, 148, 58–73. [Google Scholar]
  23. Gobakis, K.; Mavrigiannaki, A.; Kalaitzakis, K.; Kolokotsa, D.-D. Design and development of a Web based GIS platform for zero energy settlements monitoring. Energy Procedia 2017, 134, 48–60. [Google Scholar] [CrossRef]
  24. Kolokotsa, D.; Gobakis, K.; Papantoniou, S.; Georgatou, C.; Kampelis, N.; Kalaitzakis, K.; Vasilakopoulou, K.; Santamouris, M. Development of a web based energy management system for University Campuses: The CAMP-IT platform. Energy Build. 2016, 123, 119–135. [Google Scholar] [CrossRef]
  25. Zhou, B.; Li, W.; Chan, K.W.; Cao, Y.; Kuang, Y.; Liu, X.; Wang, X. Smart home energy management systems: Concept, configurations, and scheduling strategies. Renew. Sustain. Energy Rev. 2016, 61, 30–40. [Google Scholar] [CrossRef]
  26. Shakeri, M.; Shayestegan, M.; Abunima, H.; Reza, S.M.S.; Akhtaruzzaman, M.; Alamoud, A.R.M.; Sopian, K.; Amin, N. An intelligent system architecture in home energy management systems (HEMS) for efficient demand response in smart grid. Energy Build. 2017, 138, 154–164. [Google Scholar] [CrossRef]
  27. Fanti, M.P.; Mangini, A.M.; Roccotelli, M.; Ukovich, W.; Pizzuti, S. A Control Strategy for District Energy Management. In Proceedings of the 2015 IEEE International Conference on Automation Science and Engineering (CASE), Gothenburg, Sweden, 24–28 August 2015; pp. 432–437. [Google Scholar]
  28. Marinakis, V.; Doukas, H. An advanced IoT-based system for intelligent energy management in buildings. Sensors (Switzerland) 2018, 18, 610. [Google Scholar] [CrossRef] [PubMed]
  29. Brusco, G.; Burgio, A.; Menniti, D.; Pinnarelli, A.; Sorrentino, N.; Scarcello, L. An Energy Box in a Cloud-Based Architecture for Autonomous Demand Response of Prosumers and Prosumages. Electronics 2017, 6, 98. [Google Scholar] [CrossRef]
  30. Lu, N.; Du, P.; Guo, X.; Greitzer, F.L. Smart meter data analysis. In Proceedings of the Pes T&D, Orlando, FL, USA, 7–10 May 2012; pp. 1–6. [Google Scholar]
  31. Baliyan, A.; Gaurav, K.; Mishra, S.K. A review of short term load forecasting using artificial neural network models. Procedia Comput. Sci. 2015, 48, 121–125. [Google Scholar] [CrossRef]
  32. Raza, M.Q.; Khosravi, A. A review on artificial intelligence based load demand forecasting techniques for smart grid and buildings. Renew. Sustain. Energy Rev. 2015, 50, 1352–1372. [Google Scholar] [CrossRef]
  33. Shinkhede, S.; Joshi, S.K. Hybrid Optimization Algorithm for Distributed Energy Resource. In Proceedings of the 2014 Innovative Applications of Computational Intelligence on Power, Energy and Controls with their impact on Humanity (CIPECH), Ghaziabad, India, 28–29 November 2014. [Google Scholar]
  34. Goulden, M.; Bedwell, B.; Rennick-Egglestone, S.; Rodden, T.; Spence, A. Smart grids, smart users? the role of the user in demand side management. Energy Res. Soc. Sci. 2014, 2, 21–29. [Google Scholar] [CrossRef]
  35. Guo, S.; Liu, Q.; Sun, J.; Jin, H. A review on the utilization of hybrid renewable energy. Renew. Sustain. Energy Rev. 2018, 91, 1121–1147. [Google Scholar] [CrossRef]
  36. Dawoud, S.M.; Lin, X.; Okba, M.I. Hybrid renewable microgrid optimization techniques: A review. Renew. Sustain. Energy Rev. 2018, 82, 2039–2052. [Google Scholar] [CrossRef]
  37. Ou, T.-C.; Lu, K.-H.; Huang, C.-J. Improvement of Transient Stability in a Hybrid Power Multi-System Using a Designed NIDC (Novel Intelligent Damping Controller). Energies 2017, 10, 488. [Google Scholar] [CrossRef]
  38. Ou, T.-C.; Hong, C.-M. Dynamic operation and control of microgrid hybrid power systems. Energy 2014, 66, 314–323. [Google Scholar] [CrossRef]
  39. Hatziargyriou, N.; Asano, H.; Iravani, R.; Marnay, C. Microgrids. IEEE Power Energy Mag. 2007, 5, 78–94. [Google Scholar] [CrossRef]
  40. Zia, M.F.; Elbouchikhi, E.; Benbouzid, M. Microgrids energy management systems: A critical review on methods, solutions, and prospects. Appl. Energy 2018, 222, 1033–1055. [Google Scholar] [CrossRef]
  41. Bui, V.-H.; Hussain, A.; Kim, H.-M.; Bui, V.-H.; Hussain, A.; Kim, H.-M. Optimal Operation of Microgrids Considering Auto-Configuration Function Using Multiagent System. Energies 2017, 10, 1484. [Google Scholar] [CrossRef]
  42. Ou, T.-C. A novel unsymmetrical faults analysis for microgrid distribution systems. Int. J. Electr. Power Energy Syst. 2012, 43, 1017–1024. [Google Scholar] [CrossRef]
  43. Ou, T.-C. Ground fault current analysis with a direct building algorithm for microgrid distribution. Int. J. Electr. Power Energy Syst. 2013, 53, 867–875. [Google Scholar] [CrossRef]
  44. Hirsch, A.; Parag, Y.; Guerrero, J. Microgrids: A review of technologies, key drivers, and outstanding issues. Renew. Sustain. Energy Rev. 2018, 90, 402–411. [Google Scholar] [CrossRef]
  45. Mohseni, A.; Mortazavi, S.S.; Ghasemi, A.; Nahavandi, A.; Abdi, M.T. The application of household appliances’ flexibility by set of sequential uninterruptible energy phases model in the day-ahead planning of a residential microgrid. Energy 2017, 139, 315–328. [Google Scholar] [CrossRef]
  46. Bullich-Massagué, E.; Díaz-González, F.; Aragüés-Peñalba, M.; Girbau-Llistuella, F.; Olivella-Rosell, P.; Sumper, A. Microgrid clustering architectures. Appl. Energy 2018, 212, 340–361. [Google Scholar] [CrossRef]
  47. Bui, V.-H.; Hussain, A.; Kim, H.-M. A Multiagent-Based Hierarchical Energy Management Strategy for Multi-Microgrids Considering Adjustable Power and Demand Response. IEEE Trans. Smart Grid 2018, 9, 1323–1333. [Google Scholar] [CrossRef]
  48. Wang, Y.; Huang, Y.; Wang, Y.; Zeng, M.; Li, F.; Wang, Y.; Zhang, Y. Energy management of smart micro-grid with response loads and distributed generation considering demand response. J. Clean. Prod. 2018, 197, 1069–1083. [Google Scholar] [CrossRef]
  49. Safamehr, H.; Rahimi-Kian, A. A cost-efficient and reliable energy management of a micro-grid using intelligent demand-response program. Energy 2015, 91, 283–293. [Google Scholar] [CrossRef]
  50. Carrasqueira, P.; Alves, M.J.; Antunes, C.H. Bi-level particle swarm optimization and evolutionary algorithm approaches for residential demand response with different user profiles. Inf. Sci. 2017, 418–419, 405–420. [Google Scholar] [CrossRef]
  51. Batić, M.; Tomašević, N.; Beccuti, G.; Demiray, T.; Vraneš, S. Combined energy hub optimisation and demand side management for buildings. Energy Build. 2016, 127, 229–241. [Google Scholar] [CrossRef]
  52. Ferrari, L.; Esposito, F.; Becciani, M.; Ferrara, G.; Magnani, S.; Andreini, M.; Bellissima, A.; Cantù, M.; Petretto, G.; Pentolini, M. Development of an optimization algorithm for the energy management of an industrial Smart User. Appl. Energy 2017, 208, 1468–1486. [Google Scholar] [CrossRef]
  53. Kalaitzakis, K.; Stavrakakis, G.S.; Anagnostakis, E.M. Short-term load forecasting based on artificial neural networks parallel implementation. Electr. Power Syst. Res. 2002, 63, 185–196. [Google Scholar] [CrossRef]
  54. Tsekouras, G.J.; Kanellos, F.D.; Mastorakis, N. Chapter 2 Short Term Load Forecasting in Electric Power Systems with Artificial Neural Networks. In Computational Problems in Science and Engineering; Springer International Publishing: Cham, Switzerland, 2015; Volume 343. [Google Scholar]
  55. Hu, J.; Leung, V.C.M.; Coulson, G.; Ferrari, D. Smart Grid Inspired Future Technologies; Springer: Berlin, Germany, 2017; Volume 203. [Google Scholar]
  56. Mavrigiannaki, A.; Kampelis, N.; Kolokotsa, D.; Marchegiani, D.; Standardi, L.; Isidori, D.; Christalli, C. Development and testing of a micro-grid excess power production forecasting algorithms. Energy Procedia 2017, 134, 654–663. [Google Scholar] [CrossRef]
  57. Khan, A.R.; Mahmood, A.; Safdar, A.; Khan, Z.A.; Khan, N.A. Load forecasting, dynamic pricing and DSM in smart grid: A review. Renew. Sustain. Energy Rev. 2016, 54, 1311–1322. [Google Scholar] [CrossRef]
Figure 1. The Leaf Community map.
Energies 11 03012 g001
Figure 2. Methodological framework.
Energies 11 03012 g002
Figure 3. Flowchart of the developed approach.
Energies 11 03012 g003
Figure 4. Prediction of electrical consumption power for Leaf Lab, Summa and Kite Lab from 1 May 2017 to 1 August 2017.
Energies 11 03012 g004
Figure 5. Prediction of electrical consumption power for the Leaf Lab, the Summa and the Kite Lab from 1 December 2017 to 1 March 2018.
Energies 11 03012 g005
Figure 6. Prediction of electrical consumption power for the Leaf Lab, the Summa and the Kite Lab from 17 July 2017 to 21 July 2017 (left) and from 12 February 2018 to 16 February 2018 (right).
Energies 11 03012 g006
Figure 7. Energy pricing profiles used in the baseline and optimised scenarios.
Energies 11 03012 g007
Figure 8. GA optimisation power and cost results for the Leaf Lab, the Summa and the Kite Lab on 21 July 2017.
Energies 11 03012 g008
Figure 9. GA optimisation power and cost results for the Leaf Lab, the Summa and the Kite Lab during 16 February 2018.
Energies 11 03012 g009
Figure 10. GA optimisation power and cost results for the total power on 21 July 2017 (up) and 16 February 2018 (down).
Energies 11 03012 g010
Table 1. Pilot buildings in the Leaf Community.
Pilot Case StudiesSky WindowsAutomatic ShadingIlluminance/Presence Light ControlsLEDGround Water Heat PumpsbiPVThermal StorageElectrical Storage
Leaf Lab—Industrial (6000 m2)
Summa—Offices/Warehouse (1037 m2)
Kite Lab (3514 m2)—Offices, Laboratories
Table 2. MBE and MAPE for ANN predictions on 21 July 2017 and 16 February 2018.
ANN Prediction21 July 201716 February 2018
MBEMAPE (%)MBEMAPE (%)
Leaf Lab1.435−1.7522.7
Summa−0.018.47−0.4012
Kite Lab−1.5217.5−1.424.96
Table 3. Results of the optimization on 21 July 2017 during the summer period.
w1w2Leaf Lab Cost (€)Summa Cost (€)Kite Lab Cost (€)District Level Cost (€)
01153.9717.4086.48252.09
0.10.9149.8017.46787.07250.76
0.20.8152.1517.74286.76253.91
0.30.7145.7117.51787.60251.91
0.40.6148.4417.2187.34253.70
0.50.5147.3717.8087.46251.30
0.60.4151.5117.78487.62252.24
0.70.3152.2117.3987.23251.38
0.80.2149.6917.45786.92247.89
0.90.1144.4017.46685.78251.77
10142.2417.1286.62251.78
Table 4. Results of the optimization on 16 February 2018 during the winter period.
w1w2Leaf Lab Cost (€)Summa Cost (€)Kite Lab Cost (€)District Level Cost (€)
0142.8723.34101.04167.40
0.10.942.8123.36101.04167.33
0.20.842.9423.4399.85167.97
0.30.743.4823.40101.19167.66
0.40.643.1823.56102.06168.19
0.50.543.2823.58100.42167.01
0.60.443.0523.52101.25166.53
0.70.343.2923.39101.81167.94
0.80.243.0723.33100.43167.45
0.90.143.0423.49100.49167.43
1042.9223.27101.07166.67

