Article

Numerical Study of Fracture Network Evolution during Nitrogen Fracturing Processes in Shale Reservoirs

1
School of Mechanics and Civil Engineering, China University of Mining and Technology, Xuzhou 221116, China
2
School of Engineering, University of Tasmania, Hobart, TAS 7005, Australia
3
State Key Laboratory for Geomechanics and Deep Underground Engineering, China University of Mining and Technology, Xuzhou 221116, China
*
Author to whom correspondence should be addressed.
Energies 2018, 11(10), 2503; https://doi.org/10.3390/en11102503
Submission received: 3 August 2018 / Revised: 6 September 2018 / Accepted: 18 September 2018 / Published: 20 September 2018

Abstract

:
This paper develops a numerical model to study fracture network evolution during the nitrogen fracturing process in shale reservoirs. This model considers the differences of incompressible and compressible fluids, shear and tensile failure modes, shale heterogeneity, and the strength and permeability of both shale matrix and bedding planes through the coupling of mechanical-seepage-damage during fracturing fluid injection. The results show that nitrogen fracturing has a lower breakdown pressure and larger seepage zone than hydraulic fracturing under the same injection pressure. Tensile failure was identified as the major reason for the initiation and propagation of fractures. Ignoring the effect of bedding planes, the fracture initiation pressure, breakdown pressure, and fracturing effectiveness reached their maxima when the stress ratio is 1. Under the same strength ratio, the propagation path of the fractures was controlled by the stronger effect that was casused by the bedding angle and stress ratio. With increasing the strength ratio, the fracture number and shearing of the bedding plane increased significantly and the failure pattern changed from tensile-only mode to tensile-shear mode. These analyses indicated that the fracture network of bedding shale was typically induced by the combined impacts of stress ratio, bedding angle and strength ratio.

1. Introduction

Hydraulic fracturing is a widely applied technology in the extraction of shale gas [1,2,3]. This technology improves the permeability of shale reservoirs by pumping a high-pressure fracturing fluid into the borehole and fracturing the tight formation [2,3,4]. Water is the main fracturing fluid used, and the effects of water-based fluids on fracture behaviors have been well investigated [5,6,7,8,9,10,11]. However, this traditional technology requires huge quantities of water and causes serious water wastage. After a fracturing operation, the flowback rate of water-based fluids is low. Thus the irreducible water swells the clay in shale reservoirs [12]. This clay swelling decreases the permeability and hence the productivity of the shale gas well is reduced [13,14]. To enhance the fracturing penetration and prevent these fractures from closing, proppants and chemicals are usually added to the fracturing fluids. This may result in a serious environmental problem [3,15]. Therefore, waterless fluids including N2 and CO2 are proposed to replace the water-based fluids [13,16,17,18,19,20,21,22,23]. Several studies have been conducted on nitrogen fracturing [24,25,26,27]. When N2 is used as the fracturing fluid, the water waste is effectively reduced and the flow back rate is significantly increased. The fracture network performs more effective if N2 is applied for the hydraulic fracturing [22,23]. Different fracturing fluids lead to the different pore pressure distributions during fluid flow due to the various properties such as viscosity and compressibility. According to the principle of effective stress, the difference in pore pressure distribution induces the difference in the stress distribution in rocks, which plays an important role in fracturing behavior during the fracturing process [24,25,26,27]. Lower breakdown pressure, larger seepage zone and more complex fracture network were observed during nitrogen fracturing [24,25,26,27]. However, these studies were performed on simple rock samples and the influence of other factors during nitrogen fracturing has not been well evaluated. It is essential to investigate fracture network evolution during the nitrogen fracturing process.
Several numerical models have been developed to investigate fracture behaviors during the hydraulic fracturing process. These models include the boundary element method [28], finite element method [29,30,31], and discrete element method [32,33]. Wang et al. [29] applied a new mathematical model to investigate fracture network evolution of multi-stranded fractures with pre-existing natural fractures. Shalev and Lyakhovsky [31] studied the damage evolution and seismicity phenomenon in hydraulic fracturing using an improved damage model based on the finite element method. However, there are still only a few studies on a numerical model for nitrogen fracturing and the comparison between water fracturing and nitrogen fracturing. On the other hand, shale reservoirs occur at different depths and are subject to different tectonic stress patterns. The in-situ stress state has important effects on hydraulic fracturing, which has been investigated since 1961 [28,34,35]. The breakdown pressure increases with confining pressure [36], and decreases with deviatoric stress during hydraulic fracturing [4]. Furthermore, vertical and horizontal geostresses vary with the stratum depth [37]. The concept of stress ratio is introduced to define the ratio of vertical geostress to horizontal geostress, which gradually decreases with the stratum depth [38]. It is found that the stress ratio plays an important role in fracture behavior during hydraulic fracturing [34,39,40]. Fractures generally initiate and propagate normal to the maximal principal stress. Thus, the evolution and effectiveness of fracture networks are related to the changing stress ratio [29,41]. However, most of these studies focused on the hydraulic fracturing and the impact of stress ratio on nitrogen fracturing has not been well studied.
Furthermore, anisotropy is one of the most distinctive characteristics of the shale due to the existence of bedding planes [42,43]. Compared to the shale matrix, the bedding plane has weak cementing force and high compressibility, which affects the mechanical deformation, fracture parameters, failure strength, and fracture behavior in bedding shales [21,27,39,40,44,45,46]. The relative properties between the matrix and the bedding plane play an important role in fracture propagation [44]. For different types of bedding shales, the bedding plane extends at different bedding angles. Using micro-CT uniaxial compression experiments, Zhou et al. [47] showed that the complexity and surface of fractures are related to the shale bedding angle. Based on hydraulic fracturing tests on shale, Lin et al. [4] found that the bedding angle had significant effect on the pattern of fracture networks. The breakdown pressure was also affected by the shale bedding angle according to the hydraulic fracturing and SCO2 fracturing experiments by He et al. [21]. From the above, the stress ratio, bedding angle and bedding strength showed significant impacts on hydraulic fracturing. Thus, the fracture network was associated with the combined impact of all these factors. However, most of the research was conducted on the individual factor alone. The interactions among stress ratio, bedding angle and bedding strength are still not clear. Therefore, it is necessary to investigate the combined impact of these factors during the nitrogen fracturing process.
In this work, a numerical model was proposed to study fracture network evolution during the nitrogen fracturing process in shale reservoirs with consideration of the shale heterogeneity, the relative properties between shale matrix and bedding plane, and shear and tensile failure modes through the coupling of mechanical-seepage-damage. A nitrogen fracturing experiment of bedding shale was used to verify the proposed model. The fracture networks from water fracturing and nitrogen fracturing were compared. Then, the verified model was applied to investigate the impacts of stress ratio, bedding angle and strength ratio on the fracture network evolution during the nitrogen fracturing process. This paper is composed of four parts: Section 2 shows the mathematic model for each physical process and the constitutive laws of permeability and damage evolution. Verification of the proposed model is conducted in Section 3. Section 4 numerically investigates fracture network evolution during the nitrogen fracturing process. Finally, the understandings and conclusions are drawn in Section 5.

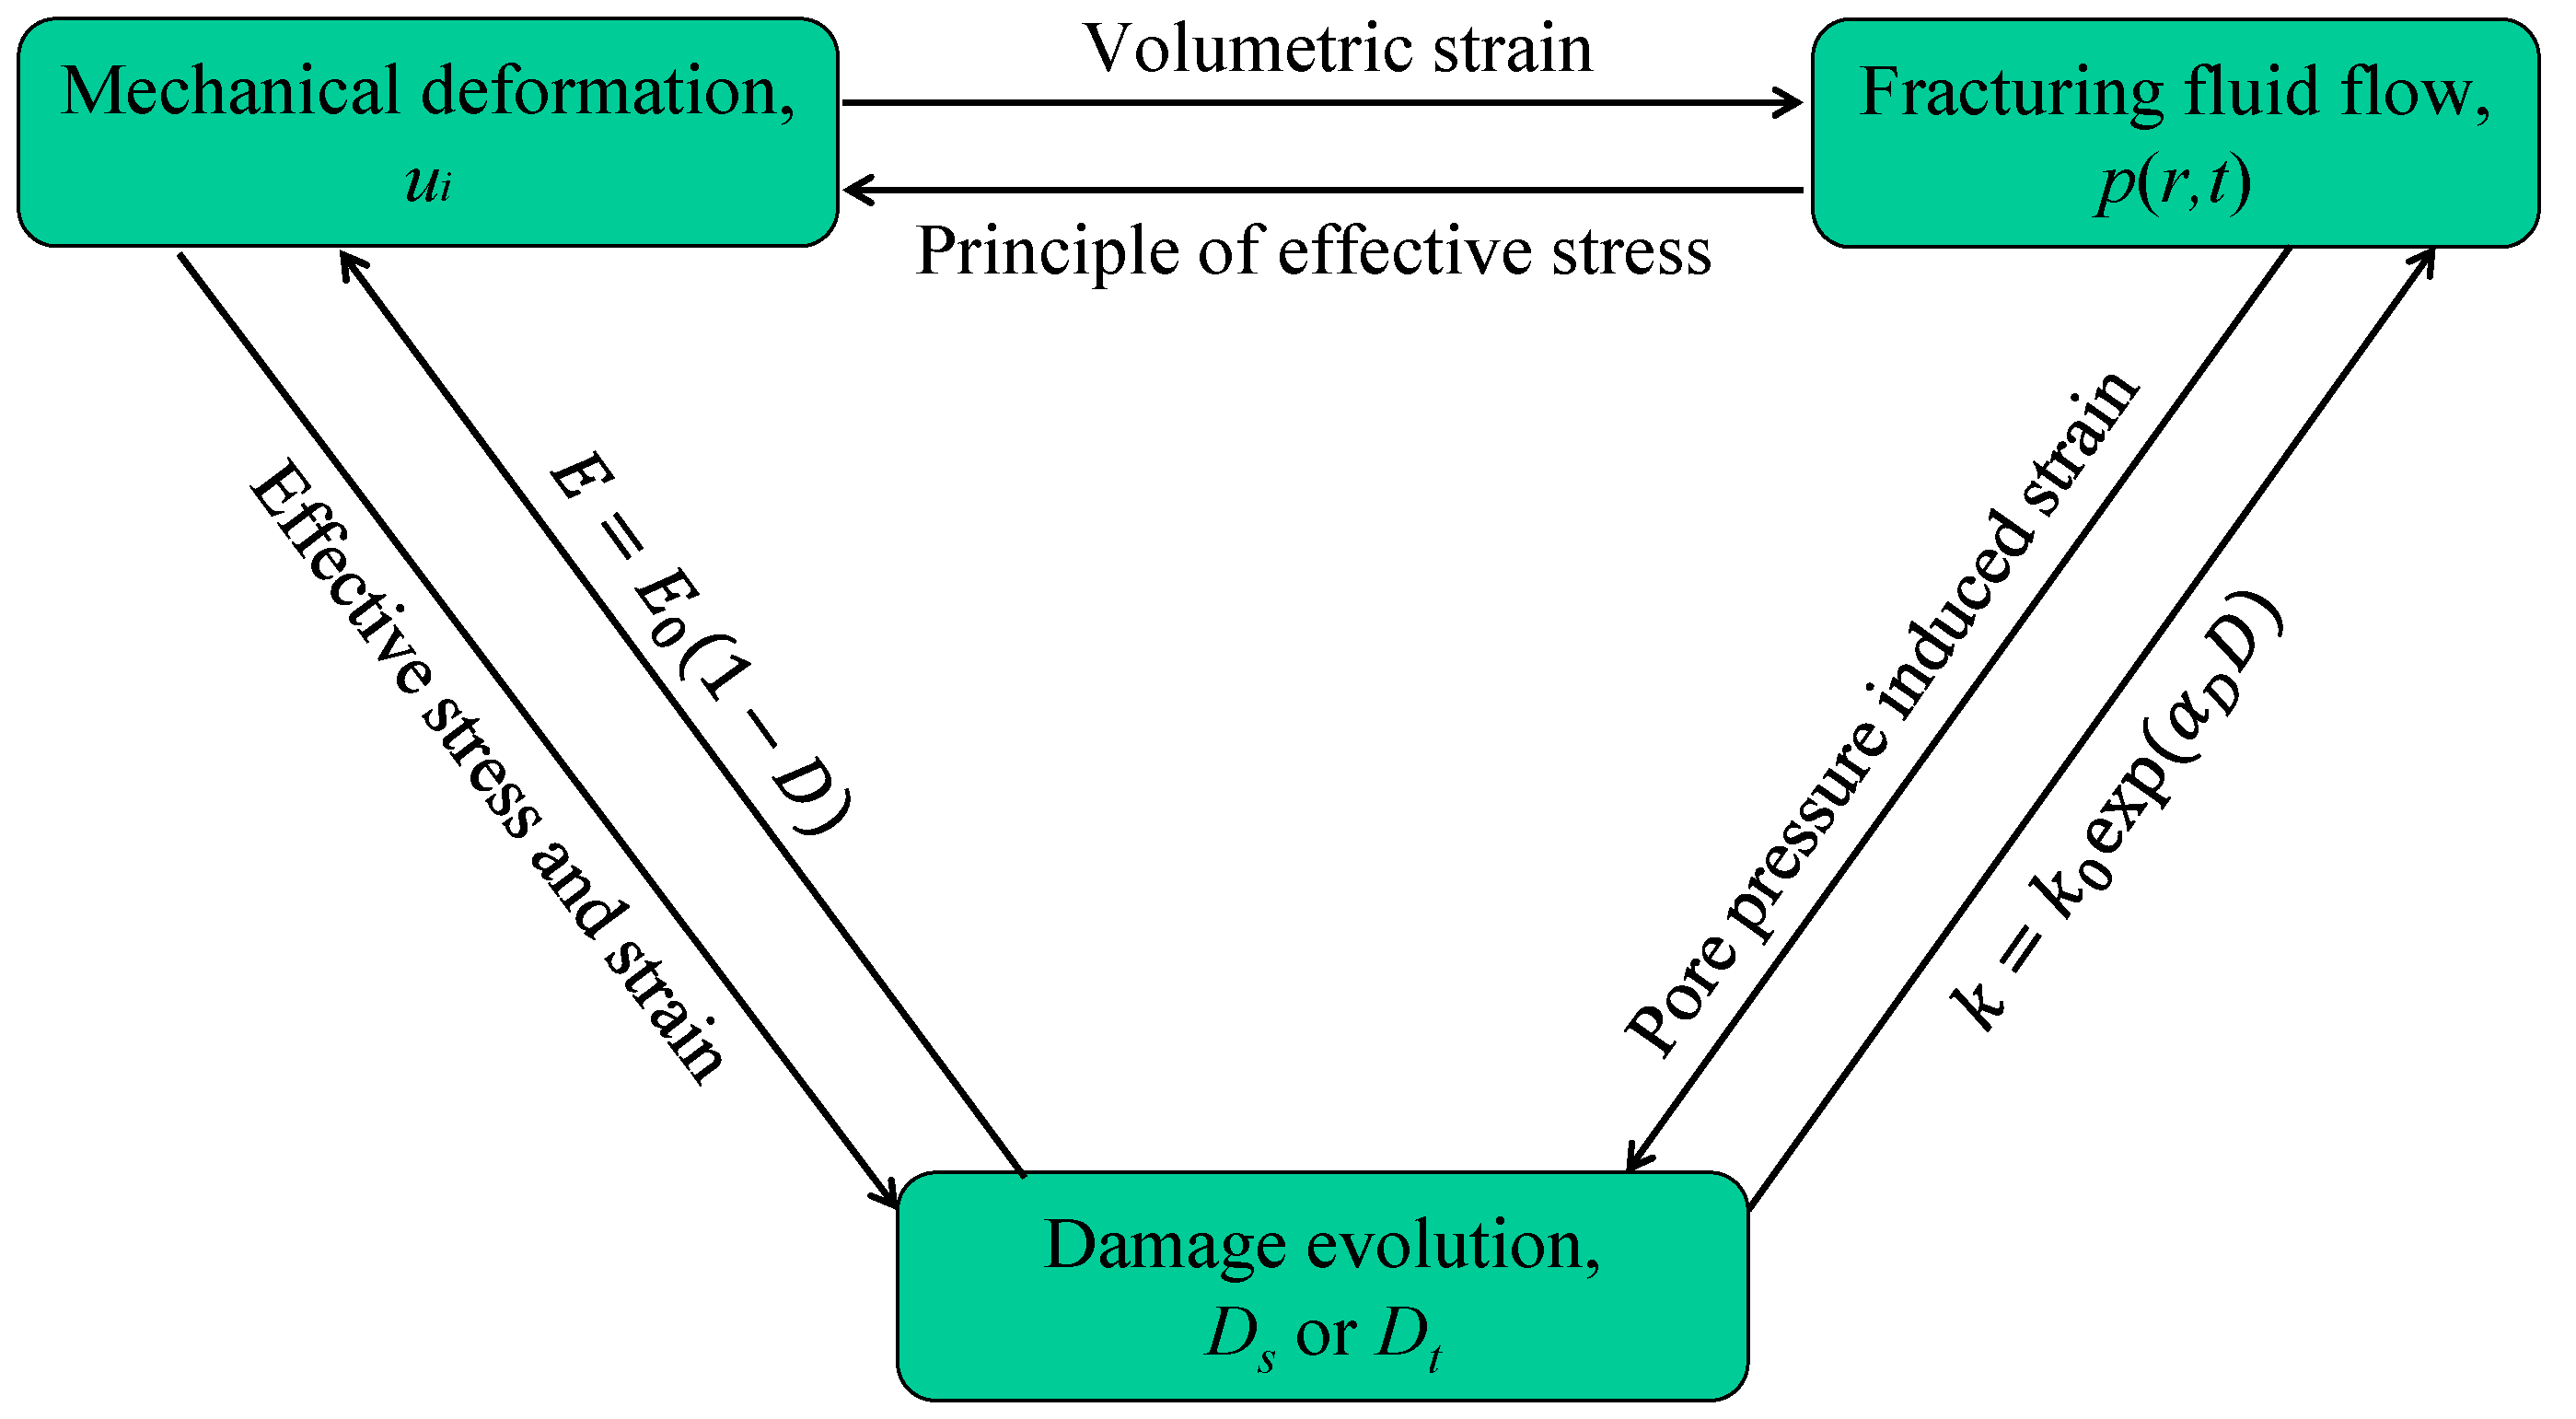
2. Governing Equations for Each Physical Process

During the fracturing process, injection fluid penetrates into the shale reservoirs around the borehole. Thus, the initiation and propagation of fractures is a physical coupling problem associated with mechanical deformation, fluid flow and damage evolution. This study is based on the following assumptions: (1) Strain is infinitesimal and shale is a type of porous media, continuous and heterogeneous; (2) The effect of sorption is ignored as the duration of the injection process is short; (3) The flow of water and nitrogen in the shale obeys Darcy’s law; (4) Chemical effects between injection fluid and shale are disregarded; (5) All processes proceed under isothermal conditions.

2.1. Governing Equations for the Mechanical Deformation

The relationship between strain and displacement is obtained as:
ε i j = 1 2 ( u i , j + u j , i )  
where ε i j represents the strain; u i represents the component of displacement.
For saturated porous media, the motion equation of the pseudo-static deformation process is:
σ i j , j + f i = 0
where f i represents the body force per unit volume in the ith direction; σ i j represents the component of the total stress.
According to the principle of effective stress, the effective stress is:
σ i j e = σ i j + α p δ i j  
where p and δ i j are the pore pressure and Kronecker delta; α is the Biot’s coefficient and α = 1 K / K s ; K and K s are the bulk modulus of shale and shale grains, respectively.
On the basis of poroelasticity [48], the constitutive relation can be obtained as:
ε i j = 1 2 G σ i j ( 1 6 G 1 9 K ) σ k k δ i j + α 3 K p δ i j  
where G is the shear modulus and G = E / 2 ( 1 + ν ) ; E and ν represent Young’s modulus and the Poisson’s ratio, respectively.
Substituting Equations (1)–(3) into Equation (4), the Navier equation is obtained as:
G u i , k k + G 1 2 ν u k , k i = α p , i f i  

2.2. A General Model for Porosity and Permeability

The porosity of the porous media can be described as [49]:
ϕ ϕ 0 = 1 + ( 1 R ) Δ ε e  
where R = α / ϕ 0 ; ϕ 0 and ϕ represent the initial and current porosity, respectively. In Equation (6), Δ ε e is obtained as:
Δ ε e = S 0 S 1 + S  
Ignoring the effect of sorption, the current and initial effective volumetric strains are:
S = ε V + p K s , S 0 = ε V 0 + p 0 K s  
where ε V and ε V 0 represent the current and initial volumetric strain, respectively; p 0 represents the initial pore pressure.
Based on the cubic law, the permeability can be obtained as:
k k 0 = ( ϕ ϕ 0 ) 3  
where k and k 0 are the current and initial permeability, respectively.
Substituting Equations (7) and (8) into Equation (6), the time derivative of ϕ is obtained as:
ϕ t = α ϕ 1 + S ( ε v t + 1 K s p t )  

2.3. Governing Equation for Fracturing Fluid Flow

The mass conservation law of fluid flow yields [50]:
m t + ( ρ v ) = Q s  
where m and Q s are the fluid mass content and the fluid source in the flow system, respectively; ρ and v represent the fluid density and the fluid velocity vector, respectively.
Ignoring the sorption effect, m is obtained as:
m = ρ ϕ
According to Darcy’s law, the fluid velocity vector is expressed as (without gravity effect):
v = k μ p  
where μ is the dynamic viscosity of the injection fluid.
Without considering the fluid source, Equation (8) is obtained as:
ϕ ρ t + ρ ϕ t ( ρ k μ p ) = 0  
Substituting Equations (10), (12) and (13) into Equation (14) yields [28]:
c ρ [ ϕ p t k μ ( p ) 2 ] + α ϕ K s ( 1 + S ) p t ( k μ p ) = ϕ α 1 + S ε V t  
where c ρ represents the isothermal coefficient of compressibility. It is:
c ρ = 1 ρ ρ p  
For nitrogen, the density is controlled by the temperature and pressure. It is:
ρ g = M g Z R T p  
where M g and R represent the molar mass of nitrogen and the universal gas constant, respectively; Z is the compressibility factor; T is the temperature. Applying Equation (17) to Equation (16) yields [51]:
c ρ = 1 ρ g ρ g p = 1 p 1 Z Z p  
For water, Equation (16) becomes:
c ρ = 1 ρ w ρ w p = 1 K f  
where K f represents the bulk modulus of water.

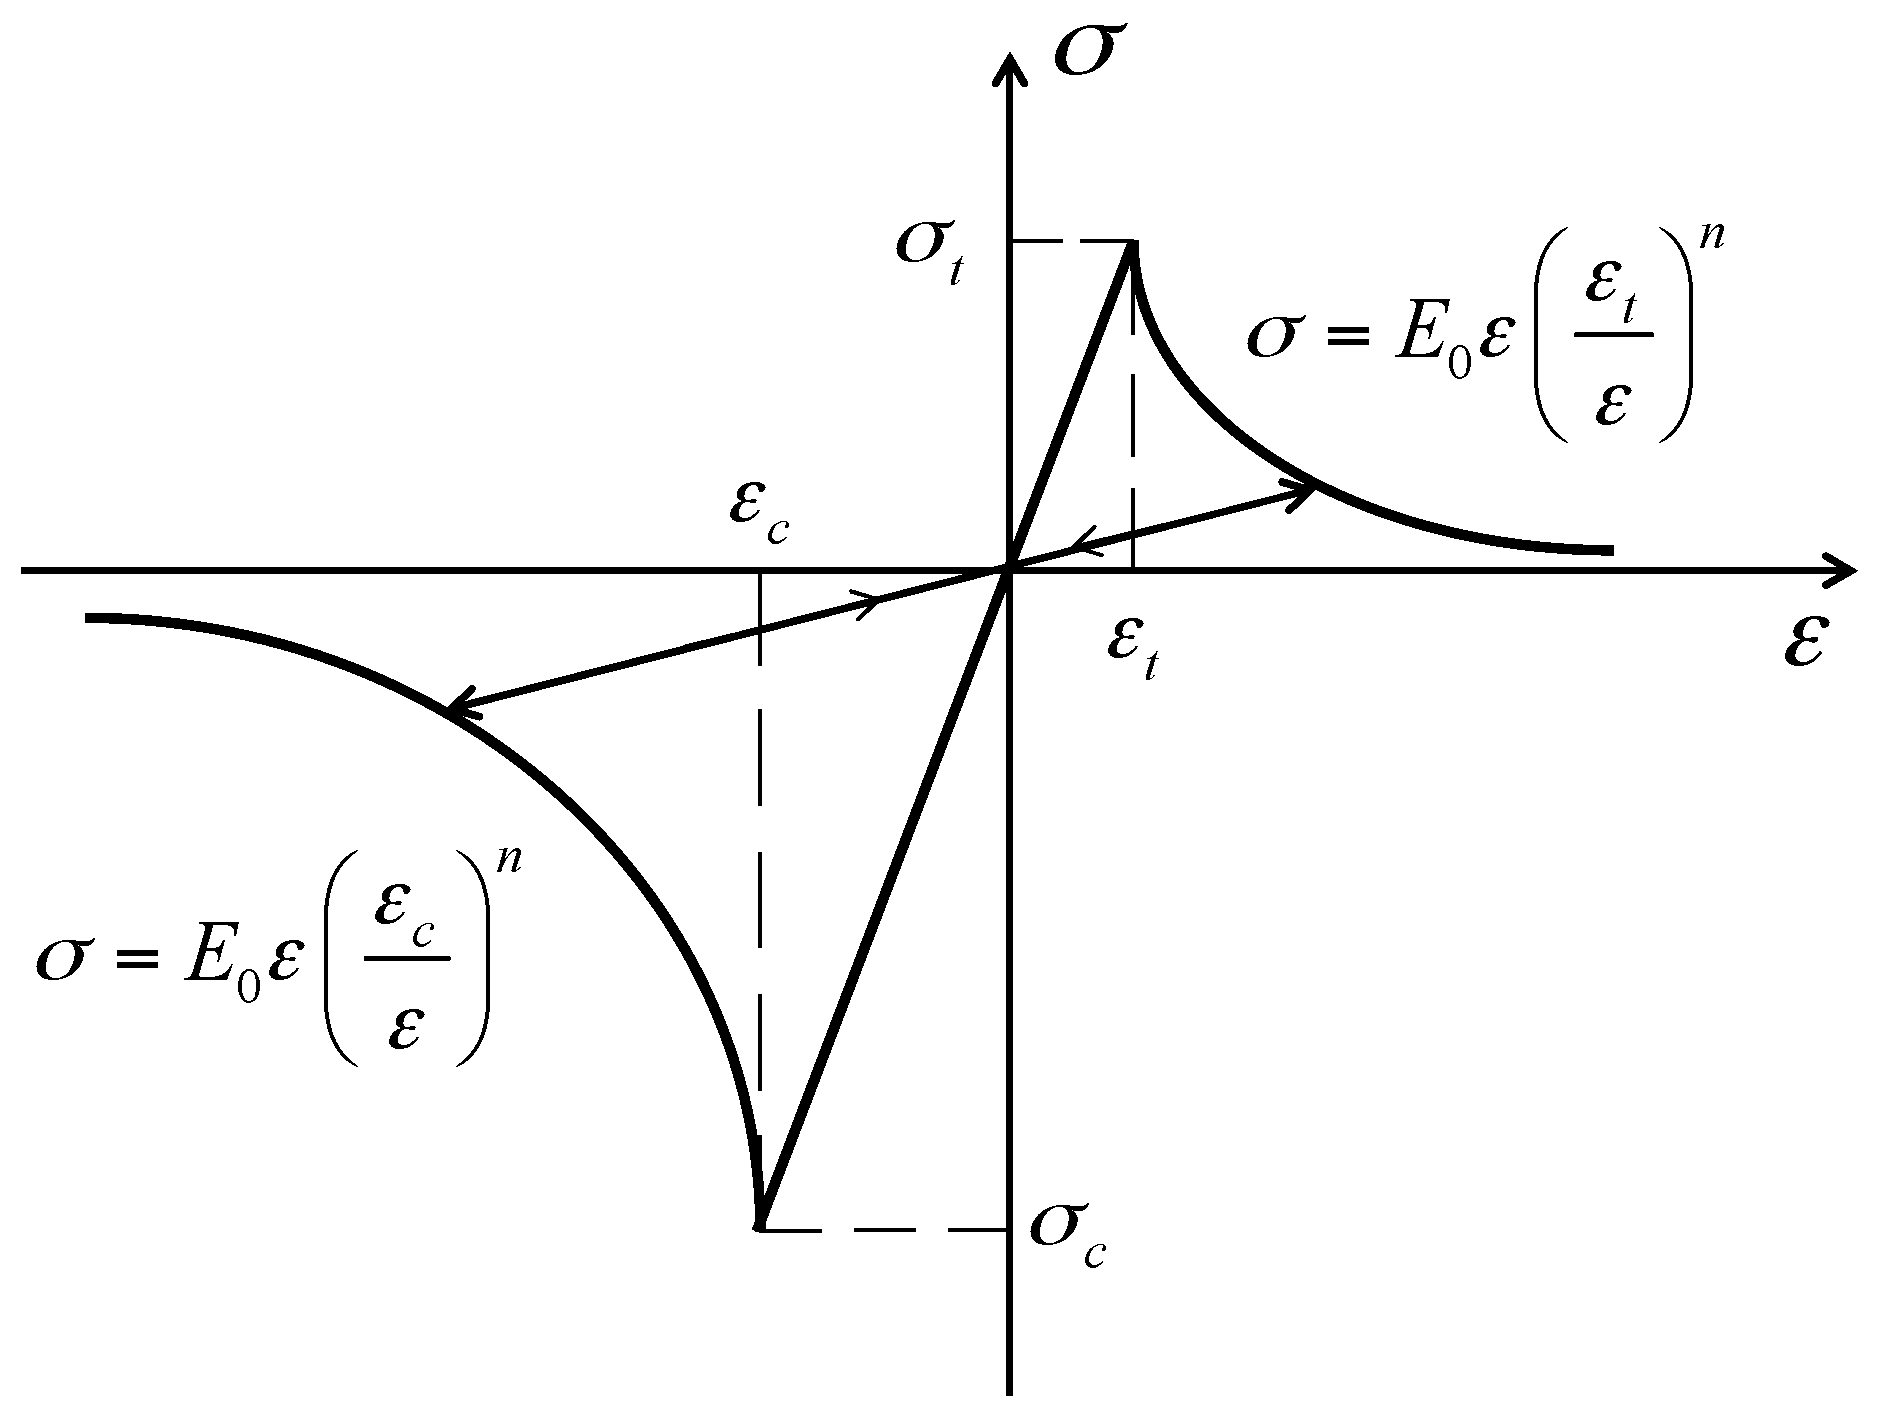
2.4. Damage Variables and Their Evolution

During rock failure, heterogeneity has a considerable effect on evolution of the fracture network [52,53]. In order to describe the rock heterogeneity, the domain is discretized into finite nodes. The mechanical parameter at each node is assumed to obey a Weibull distribution as [52]:
f ( x ) = b x 0 ( x x 0 ) b 1 exp ( x x 0 ) b  
where x represents the mechanical parameter at this node, which refers to strength or Young’s modulus; x 0 and b represent the scale parameter and the shape parameter, which are related to the average value of the parameter and the shape of the distribution function, respectively. Based on Equation (20), heterogeneous parameter for each node is obtained by a Monte-Carlo simulation.
During the hydraulic fracturing process, both tensile damage and shear damage are observed. Based on the elastic damage theory, Figure 1 shows the typical constitutive law for rock under uniaxial stress. During damage analysis, the tensile failure for each node is firstly judged by tensile damage criterion. The shear damage criterion is applied to judge the node failure when the tensile damage criterion is not satisfied. These two criteria are defined below (tensile stress is considered positive).

2.4.1. Tensile Damage Criterion

The principle of maximum tensile stress is introduced here to determine the tensile failure at each node [52]. This criterion is expressed as:
F 1 = σ 1 e σ t = 0  
where σ 1 e and σ t represent the first principal effective stress and the tensile strength, respectively.
From Figure 1, the tensile damage variable is expressed as:
D t = { 0 ; 0 < ε 1 < ε t | ε t ε 1 | n 1 ; ε 1 ε t  
where ε 1 represents the first principal strain; ε t represents the tensile peak strain, under which the tensile failure occurs.

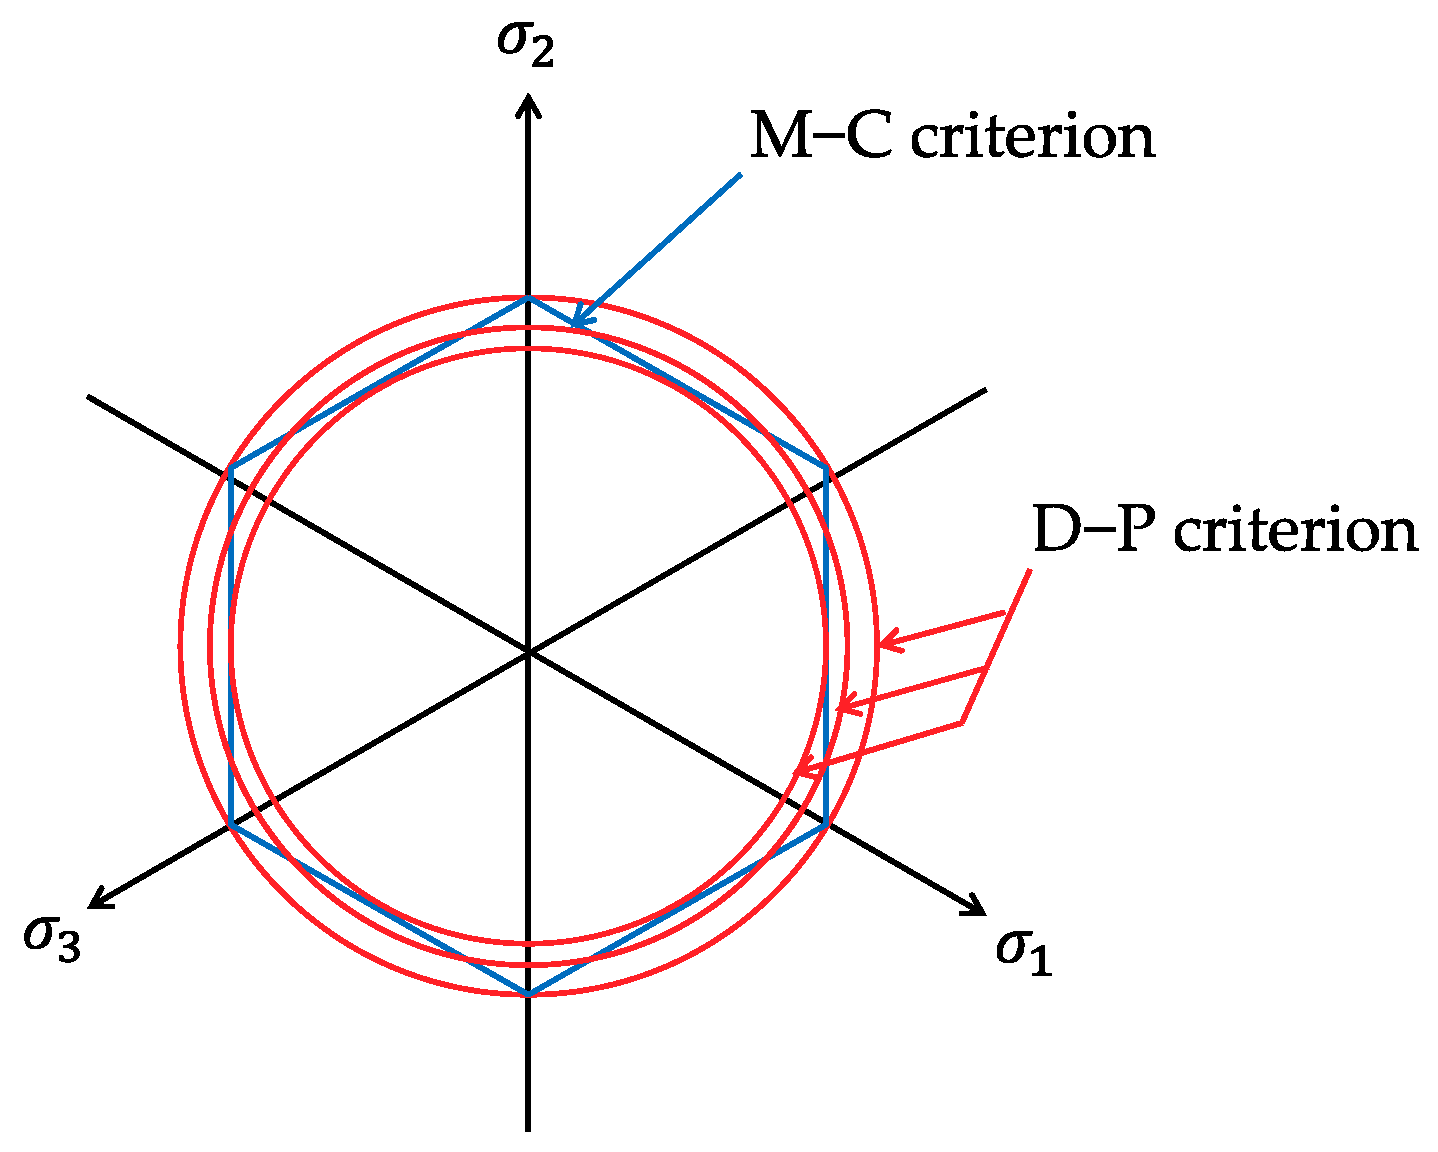
2.4.2. Shear Damage Criterion

Since the Mohr–Coulomb criterion ignores the impact of the second principal stress on rock failure, the Drucker–Prager criterion is used in this study:
F 2 = α d p I 1 + J 2 K 3 = 0  
where I 1 represents the first invariant of effective stress tensor and I 1 = σ 1 e + σ 2 e + σ 3 e ; J 2 represents the second invariant of effective stress and J 2 = 1 6 [ ( σ 1 e σ 2 e ) 2 + ( σ 2 e σ 3 e ) 2 + ( σ 1 e σ 3 e ) 2 ] ; σ 2 e and σ 3 e are the second and third principal effective stresses; α d p and K 3 are the parameters to describe the yield and potential plastic functions, respectively:
{ α d p = sin φ 3 ( cos θ σ 1 3 sin θ σ sin φ ) K 3 = c cos φ cos θ σ 1 3 sin θ σ sin φ  
where α d p is the Lode angle and α d p = 2 σ 2 e σ 1 e σ 3 e 3 ( σ 1 e σ 3 e ) ; φ and c represent the internal friction angle and the cohesion, respectively. In comparison with the Mohr–Coulomb criterion, the Lode angle considers the impact of the second principal stress and influences the parameters of α d p and K 3 . Figure 2 compares the yield surfaces of the Drucker–Prager and Mohr–Coulomb criteria on the deviatoric plane. It shows that these two criteria can be adjusted to the same one by defining α d p and K 3 as certain functions [54].
Based on Figure 1, the shear damage variable is expressed as:
D s = { 0 ; ε c < ε 3 < 0 1 | ε c ε 3 | n ; ε 3 ε c  
where ε c is the compressive peak strain, under which the compressive failure occurs; ε 3 is the third principal strain. From Equations (22) and (25), the tensile damage variable is negative and the shear damage variable is positive. Therefore, the damage variables can reflect the damage degree and the failure mode of each node.

2.4.3. Relationship between Damage and Permeability

Material degradation is a common phenomenon and affects its mechanical parameters [55,56]. Before node failure, the damage variable remains zero and Young’s modulus stays constant. After a node failure, Young’s modulus reduces linearly with the damage variable abs. That is:
E = E 0 ( 1 D )  
where D is the abs of the damage variable and D = | D t |   or   D = | D s | .
Also, the permeability increases significantly with damage evolution. Because of the complex relationship between damage and permeability, an amplification factor is used to characterize the impact of the damage on permeability [53]. Therefore, Equation (9) is revised as:
k k 0 = ( ϕ ϕ 0 ) 3 exp ( α D D )  
where α D is the amplification factor, which describes the damage-induced enhancement of permeability.

3. Verification of This Numerical Model

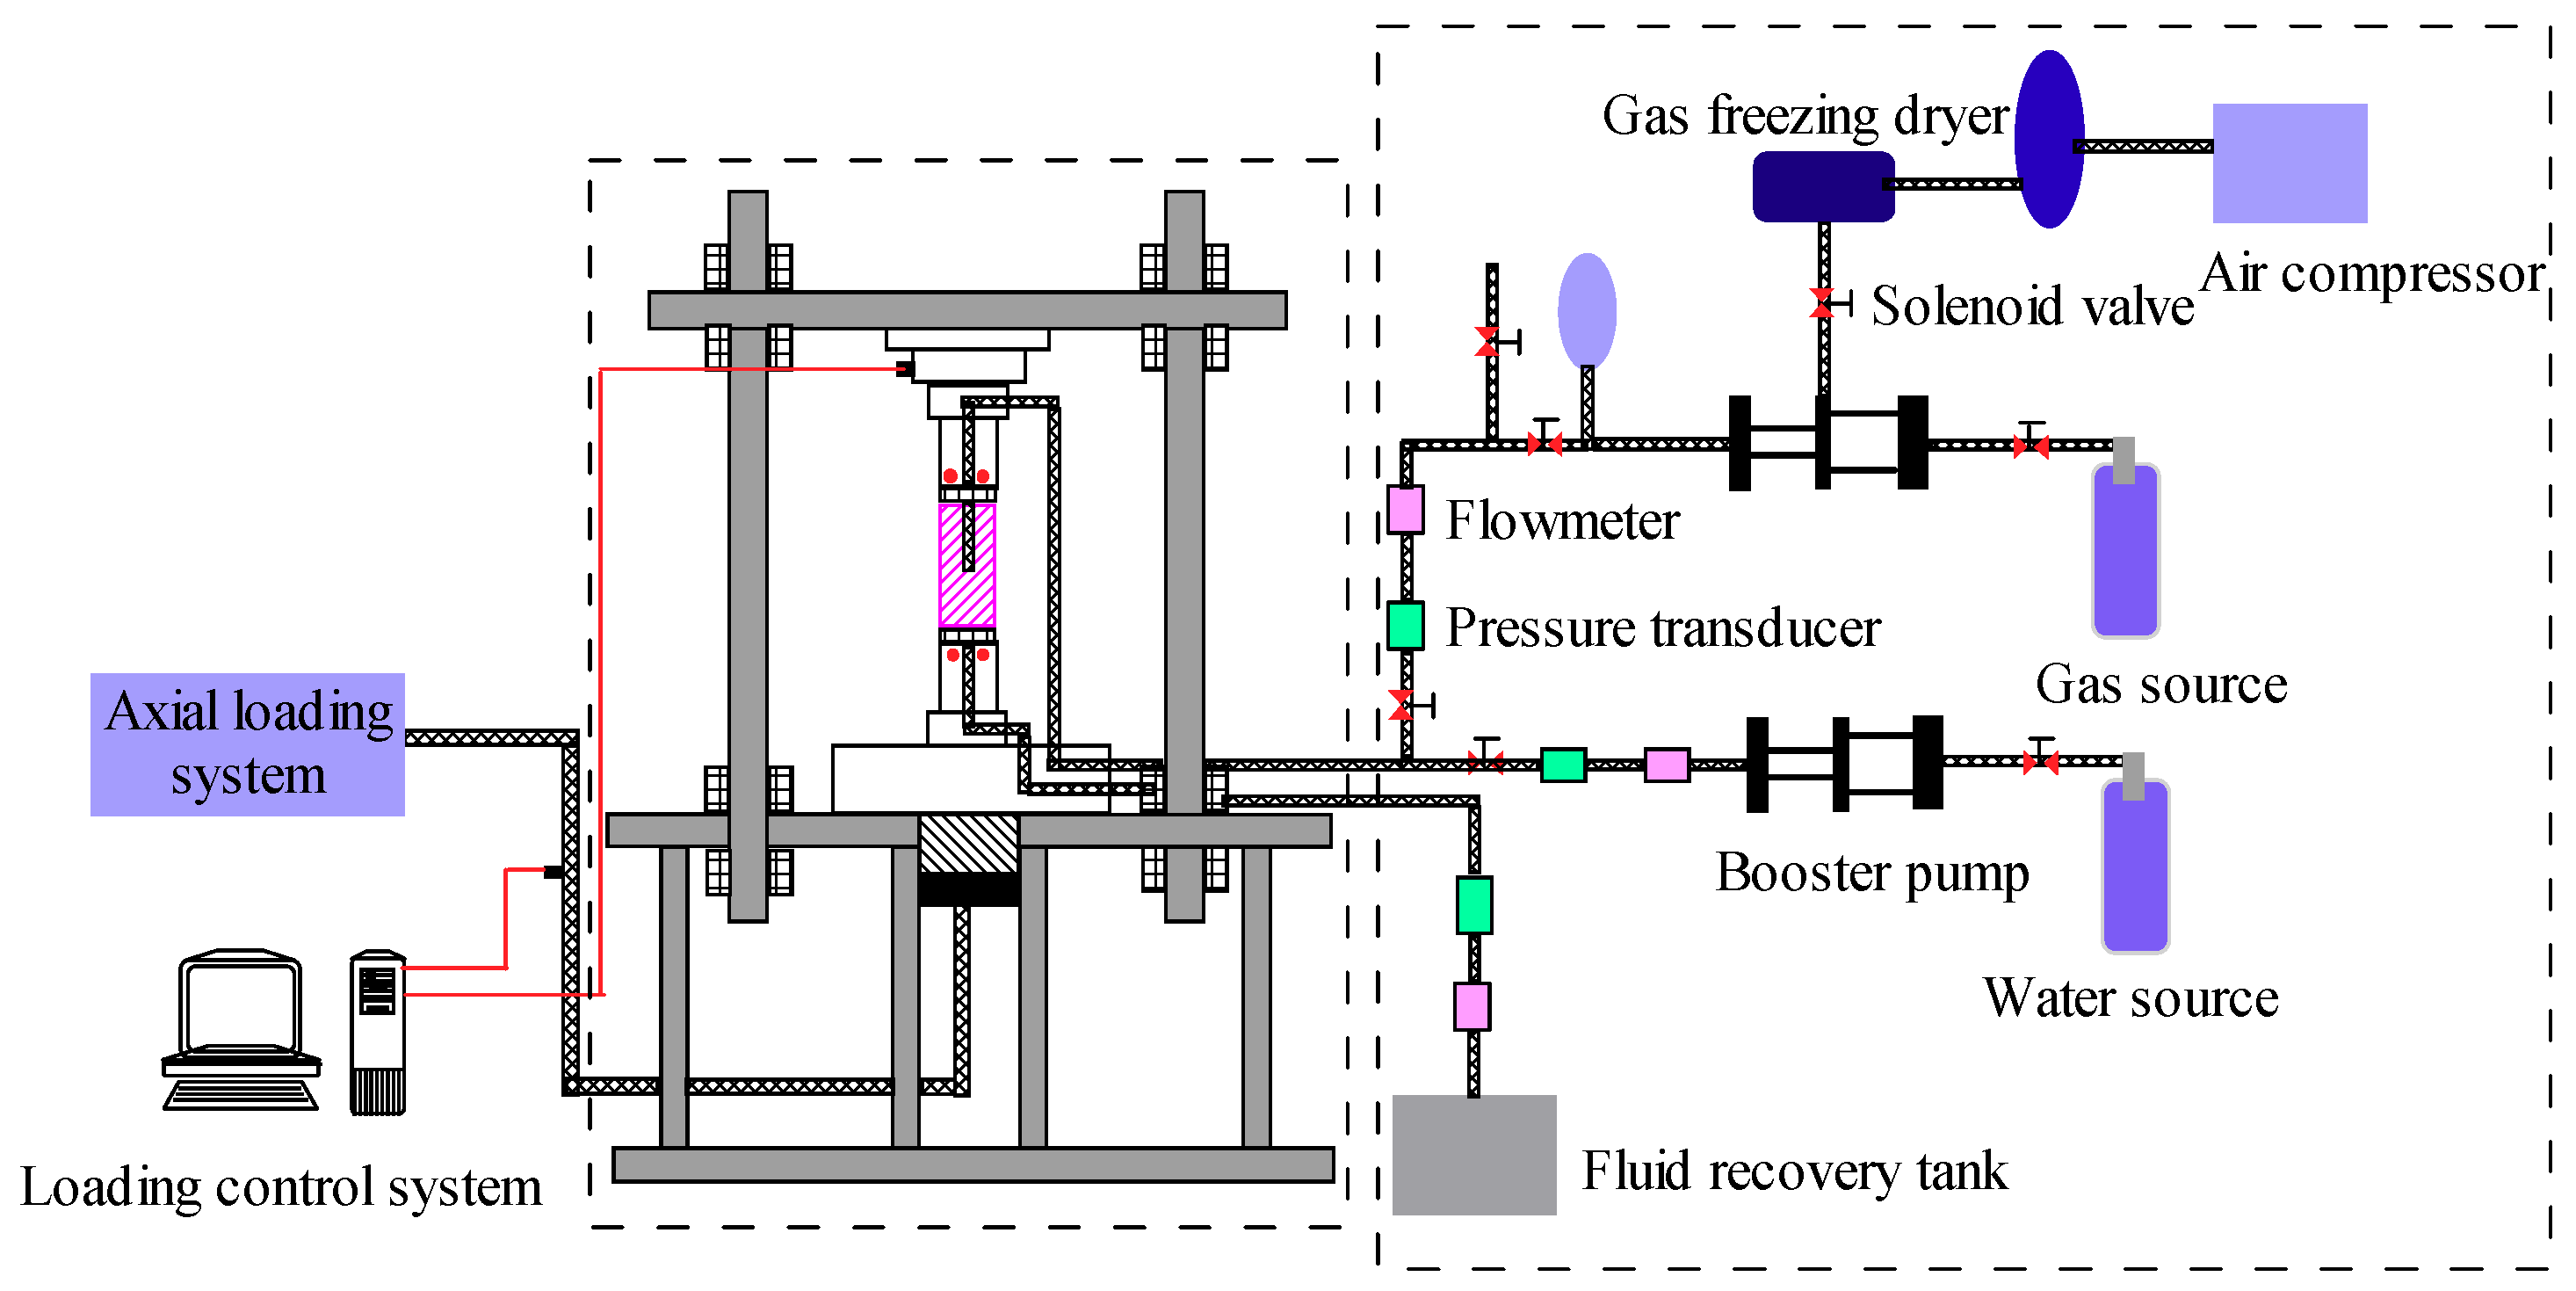
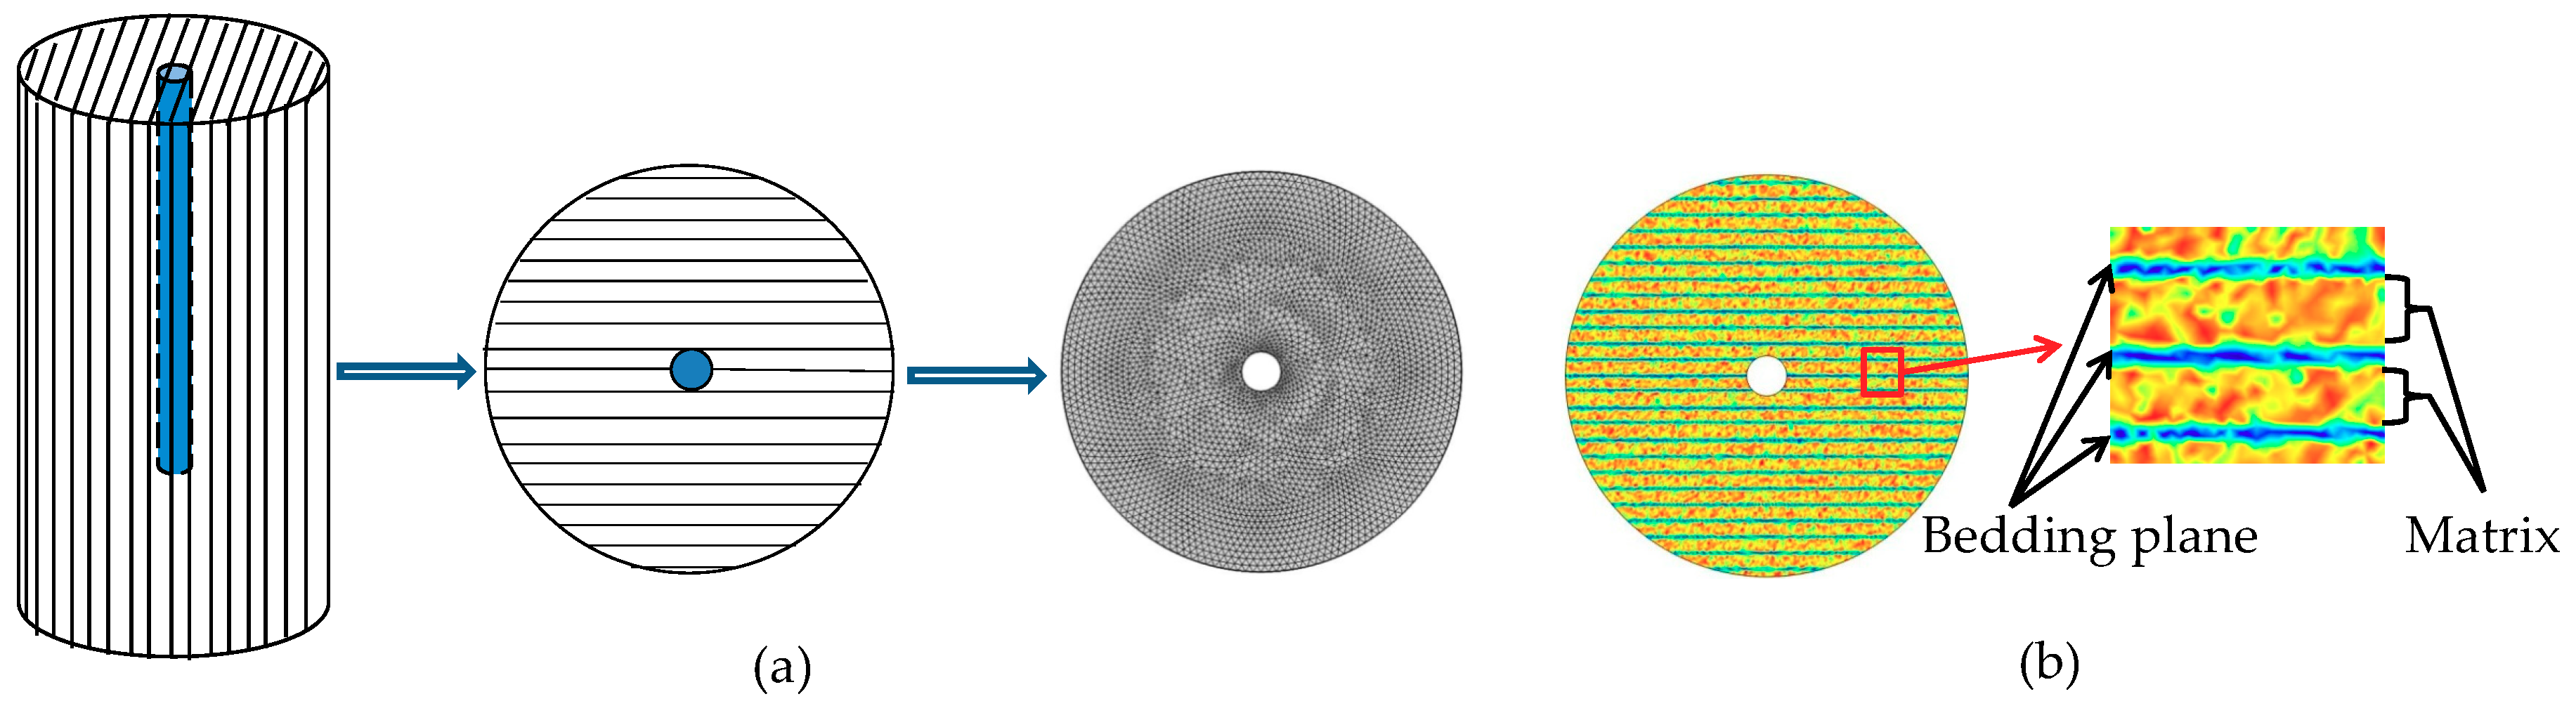
3.1. Experimental Observations in the Nitrogen Fracturing Process

The nitrogen fracturing experiment was performed under laboratory conditions on a shale sample with a bedding angle of 90 [27]. A sealant was used to seal the shale sample and the loading axial compression force was 8 kN. The axial hole (5 mm in diameter) was injected with nitrogen to fracture the shale sample. The nitrogen fracturing test system is presented in Figure 3.
The history curve of injection pressure versus time is shown in Figure 4a. The injection pressure increases almost linearly before the shale failure and the pressurization rate reaches 12.6 kPa/s. After the shale failure, the injection pressure decreases rapidly from the maximum injection pressure of 5.7 MPa. This indicates that fractures propagate through the shale section only a short time after cracking is initiated inducing the abrupt failure of the shale. Figure 4b presents the failure mode and fracture pattern after nitrogen fracturing. A split failure mode of shale was observed during the experiment, indicating that the tensile failure was the main failure mode during nitrogen fracturing. Fracture initiation occurred from the borehole wall and the fracture propagated along the bedding plane.

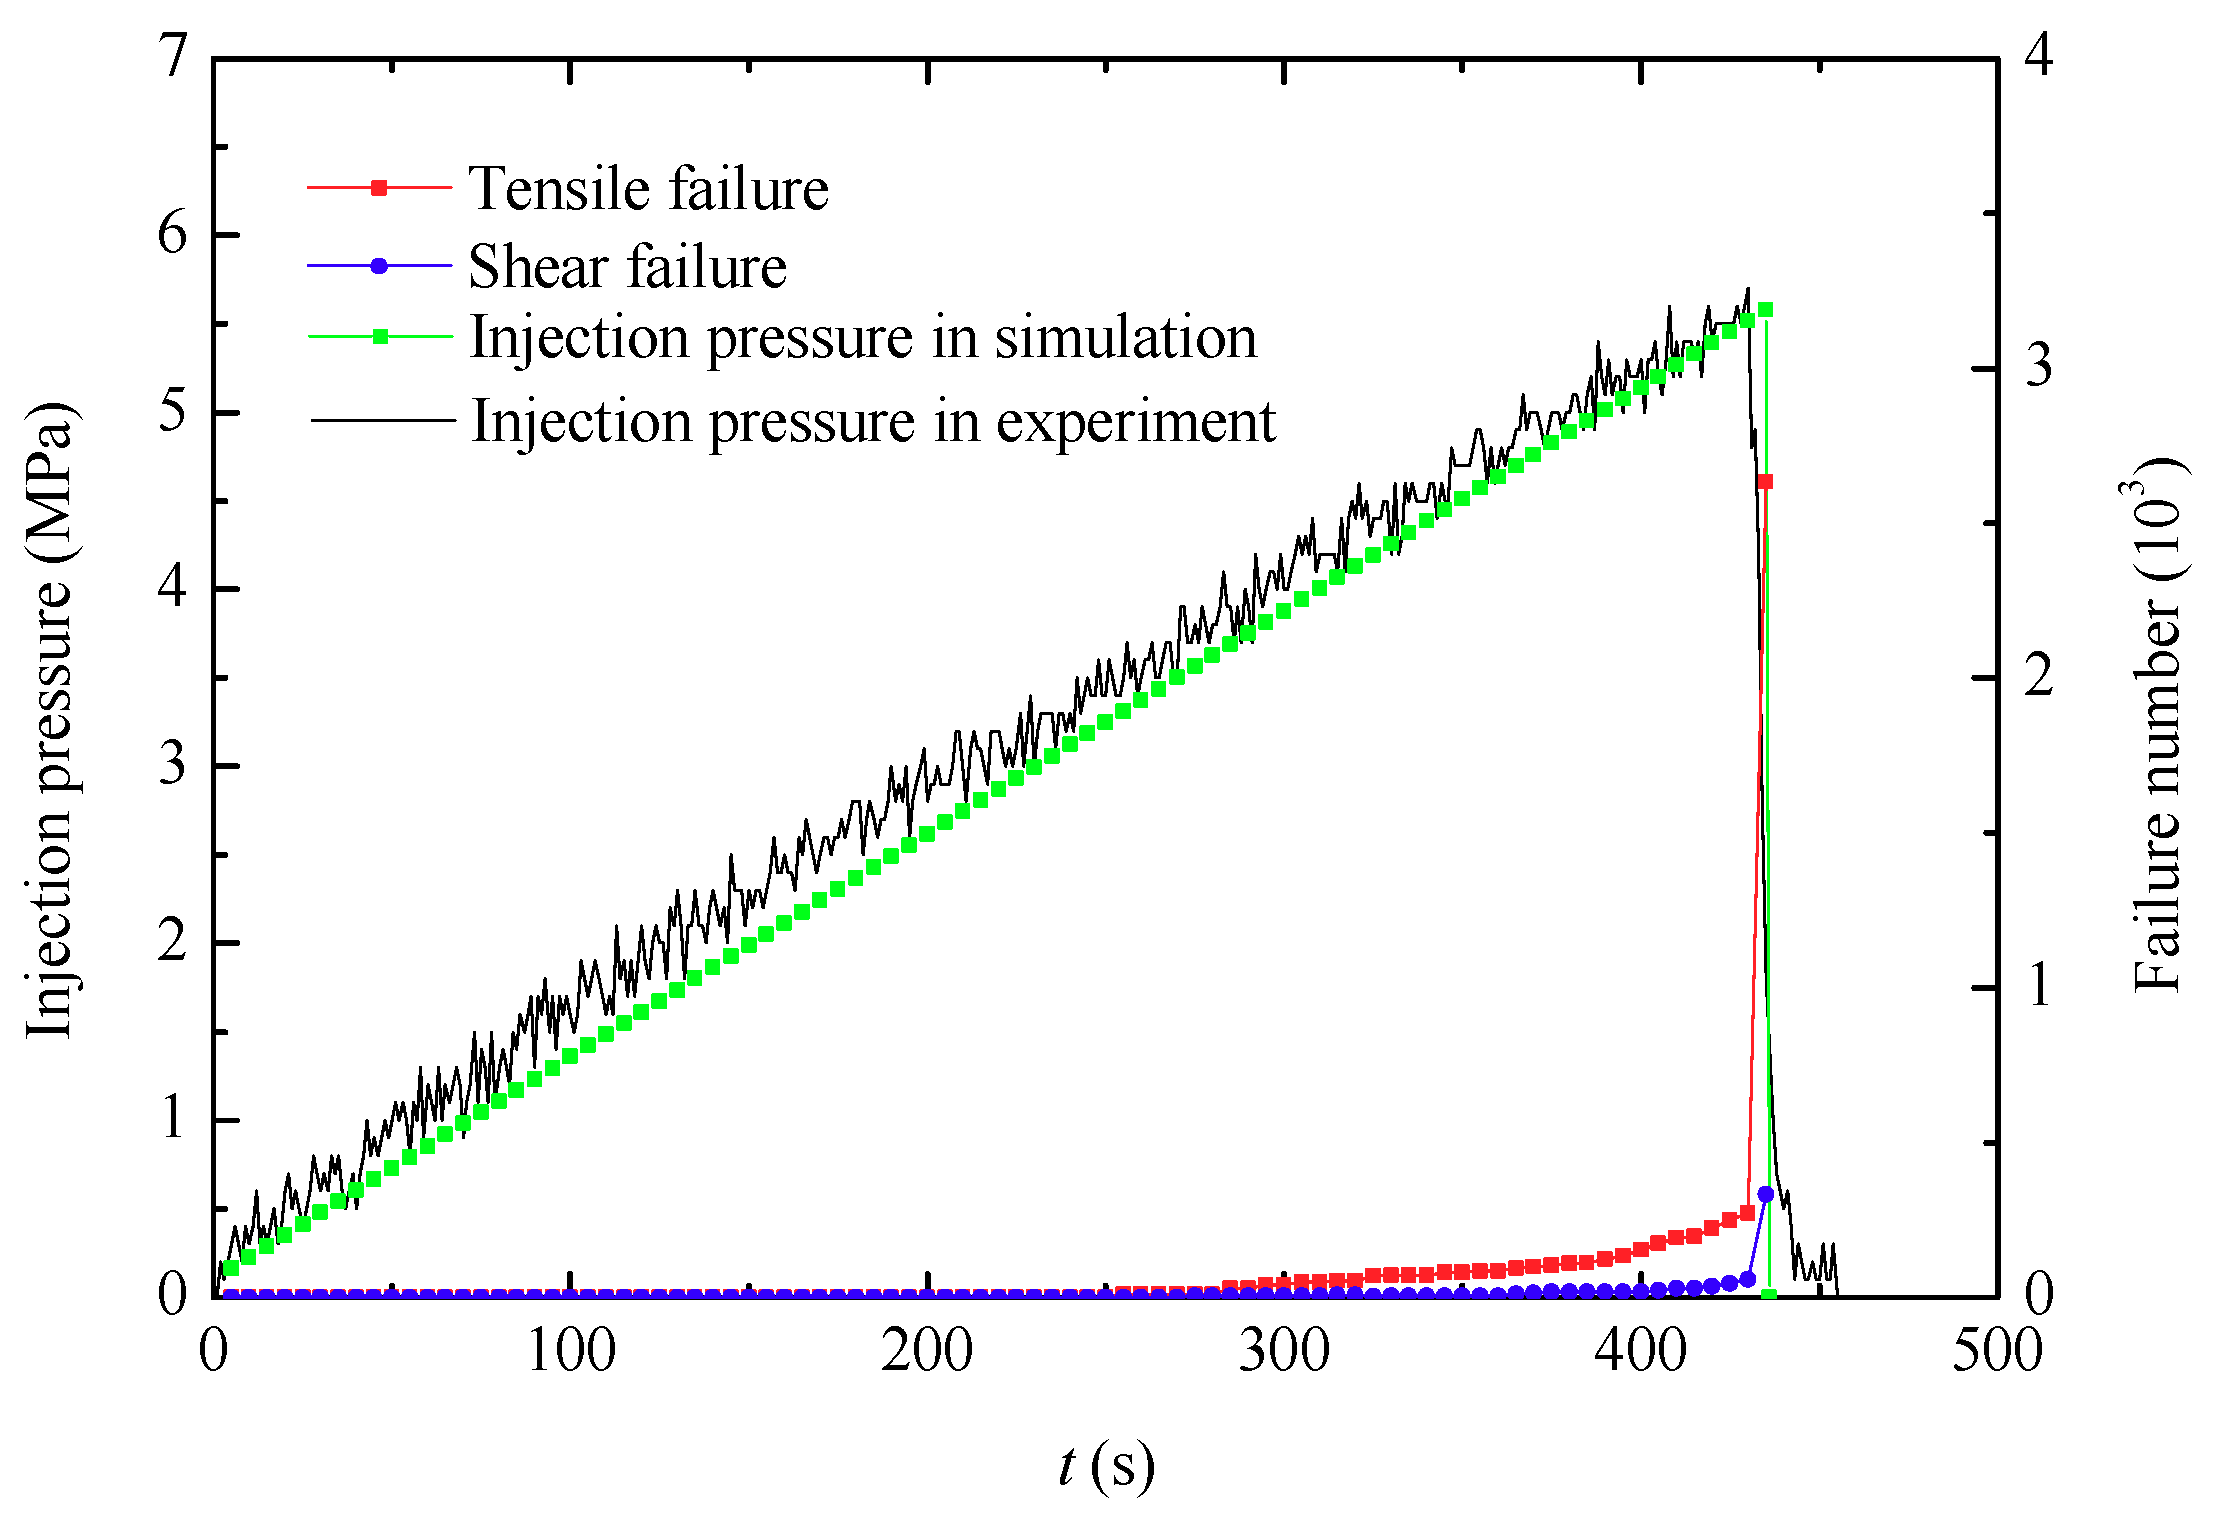
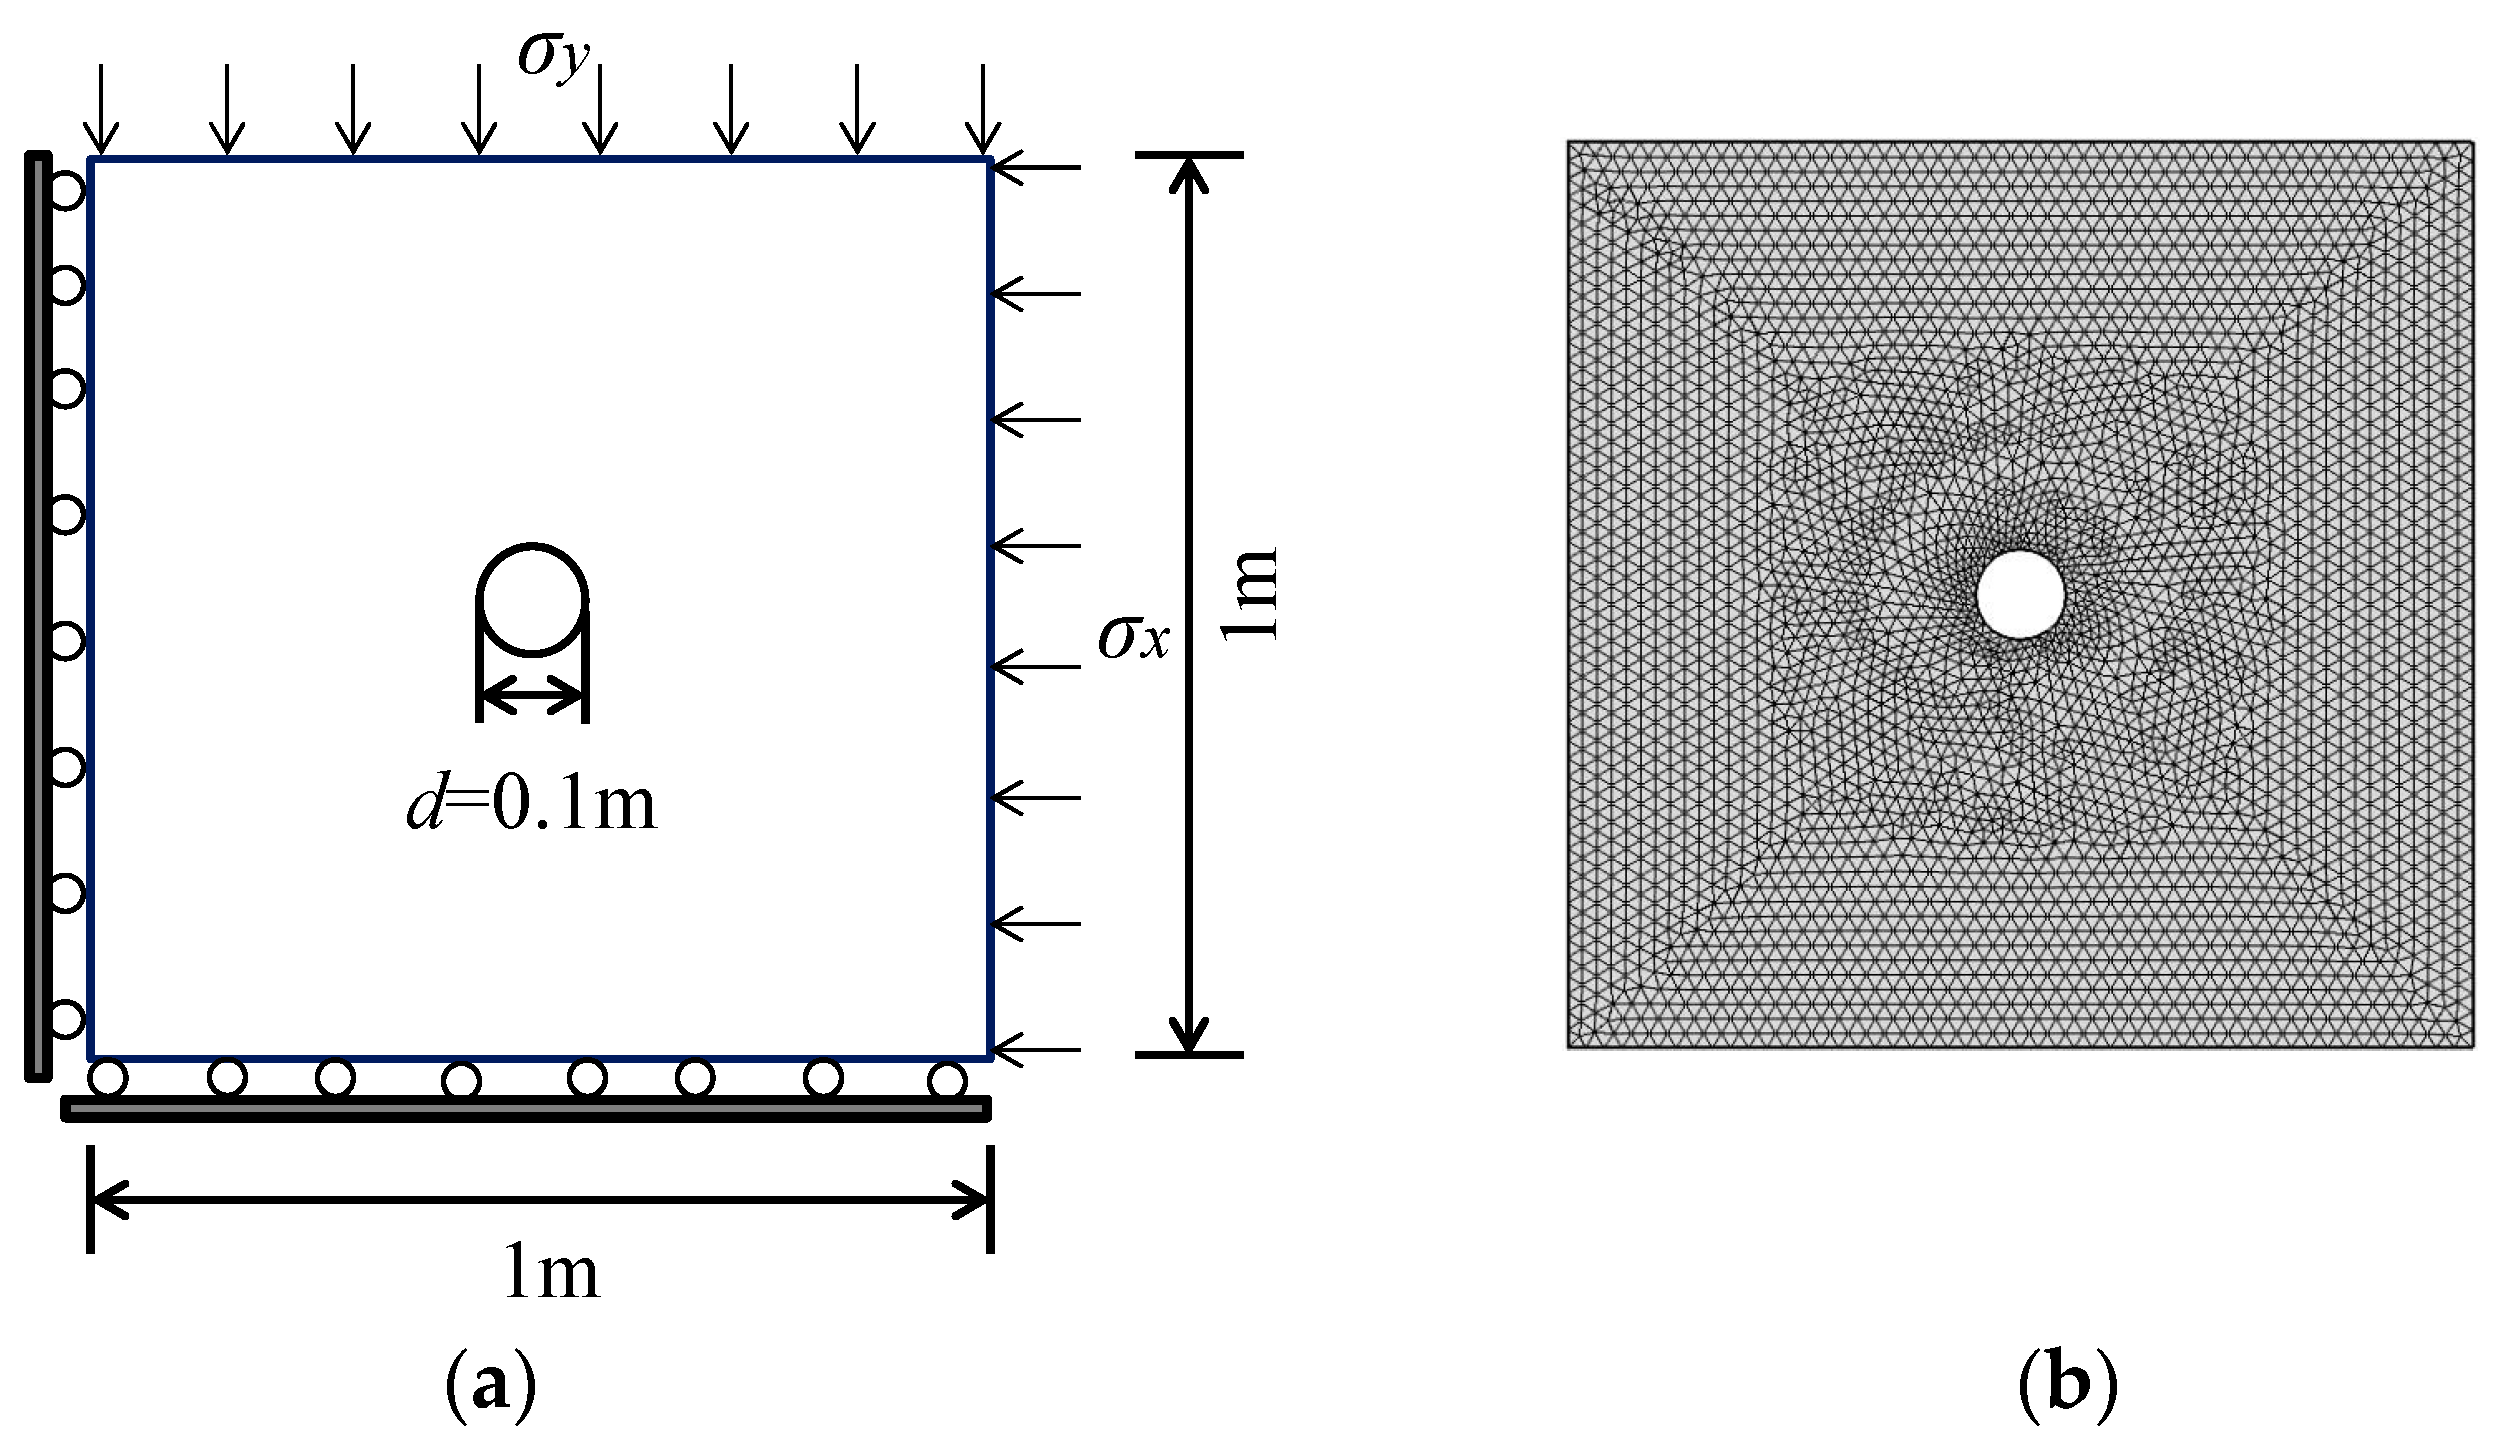
3.2. Numerical Simulation

The numerical model is composed of the governing equations for the mechanical deformation (Equation (5)), the fracturing fluid flow (Equation (15)), and the damage criteria (Equations (21)–(23) and (25)). The interaction of these physical processes is shown in Figure 5. The fracture network is formed by the failure nodes. Combining the constitutive laws of Equations (6), (26) and (27), this model was applied to investigate the fracture network evolution during nitrogen fracturing in shale. Numerical simulations are conducted with the platform of COMSOL using MATLAB. The mechanical deformation (Equation (5)) was conducted by the solid mechanics module in COMSOL and the fracturing fluid flow (Equation (15)) was implemented through the PDE module in COMSOL. According to the simulation results from COMSOL, the damage criteria ((Equations (21)–(23) and (25))) were checked by the MATLAB function. The computational schematic chart is shown in Figure 6 and briefly summarized as follows: (1) The geometry model is established and discretized into a set of nodes to characterize the heterogeneity; (2) The coupling calculation is conducted by COMSOL with the initial boundary conditions and the defined domain parameters; (3) The damage analysis for each node is performed by MATLAB according to the effective stress and strain obtained by the coupling calculation; (4) If the damage increases, the parameters are updated and the computational procedure returns to Step (2); (5) If the damage remains constant, the load is increased and the boundary conditions are updated.
Figure 7 presents a computational model for bedding shale to investigate the fracture network evolution during nitrogen fracturing. The bedding angle of the shale is 90°. The inner diameter is 5 mm and the outer diameter is 50 mm. The shale matrix and bedding plane have different distributions of Young’s modulus. The nitrogen pressurization rate is 12.6 kPa/s, which was obtained by the pressure-time profile in Figure 4a. The nitrogen viscosity is taken as 18   μ Pa s . Table 1 lists the main computational parameters of the shale matrix and bedding planes, including Young’s modulus, tensile strength, cohesion, internal friction angle, porosity and permeability.
Figure 8 presents the fracture network evolution versus time during the nitrogen fracturing. The blue color and red color represent fractures formed by tensile failure nodes and shear failure nodes, respectively. The tensile failure is the major cause of fracture network evolution. The fractures initiated from the borehole wall and propagated along the bedding plane. This was because the bedding plane had lower tensile strength than the shale matrix. The fractures grew slowly from t = 300 s (the time of fracture initiation) to t = 430 s and propagated rapidly from t = 430 s to t =435 s. A split failure pattern in shale has been observed in the experiment above. This indicated that the fracture network evolution in the numerical simulation agreed well with the experimental results.
Figure 9 presents the injection pressure and failure number in the numerical simulation of nitrogen fracturing. The history curve of injection pressure and the breakdown pressure in the numerical simulation well fits the experimental results. The failure number is defined as the number of failure nodes. Before the shale failure, the failure number is small and increases slowly. When the shale failure occurs, the failure number increases rapidly due to the fast propagation of fractures as shown in Figure 8. Furthermore, the tensile failure number is much larger than the shear failure number during nitrogen fracturing. Since a split failure pattern is induced by the tensile failure, the evolution of failure number is consistent with the experimental observation. In conclusion, the proposed model has the capability to simulate the nitrogen fracturing of shale formation.

4. Fracture Network Evolution during Nitrogen Fracturing

Figure 10 presents a computational model for the shale to investigate the fracture network evolution during the nitrogen fracturing. It is a square of 1 m × 1 m with a borehole of 0.1 m in diameter at the center. The fluid pressurization rate is assumed as 0.1 MPa/s. The horizontal stress in the xth direction is taken as 10 MPa. The stress ratio here is defined as the ratio of vertical stress to horizontal stress. That is:
α σ = σ y σ x  

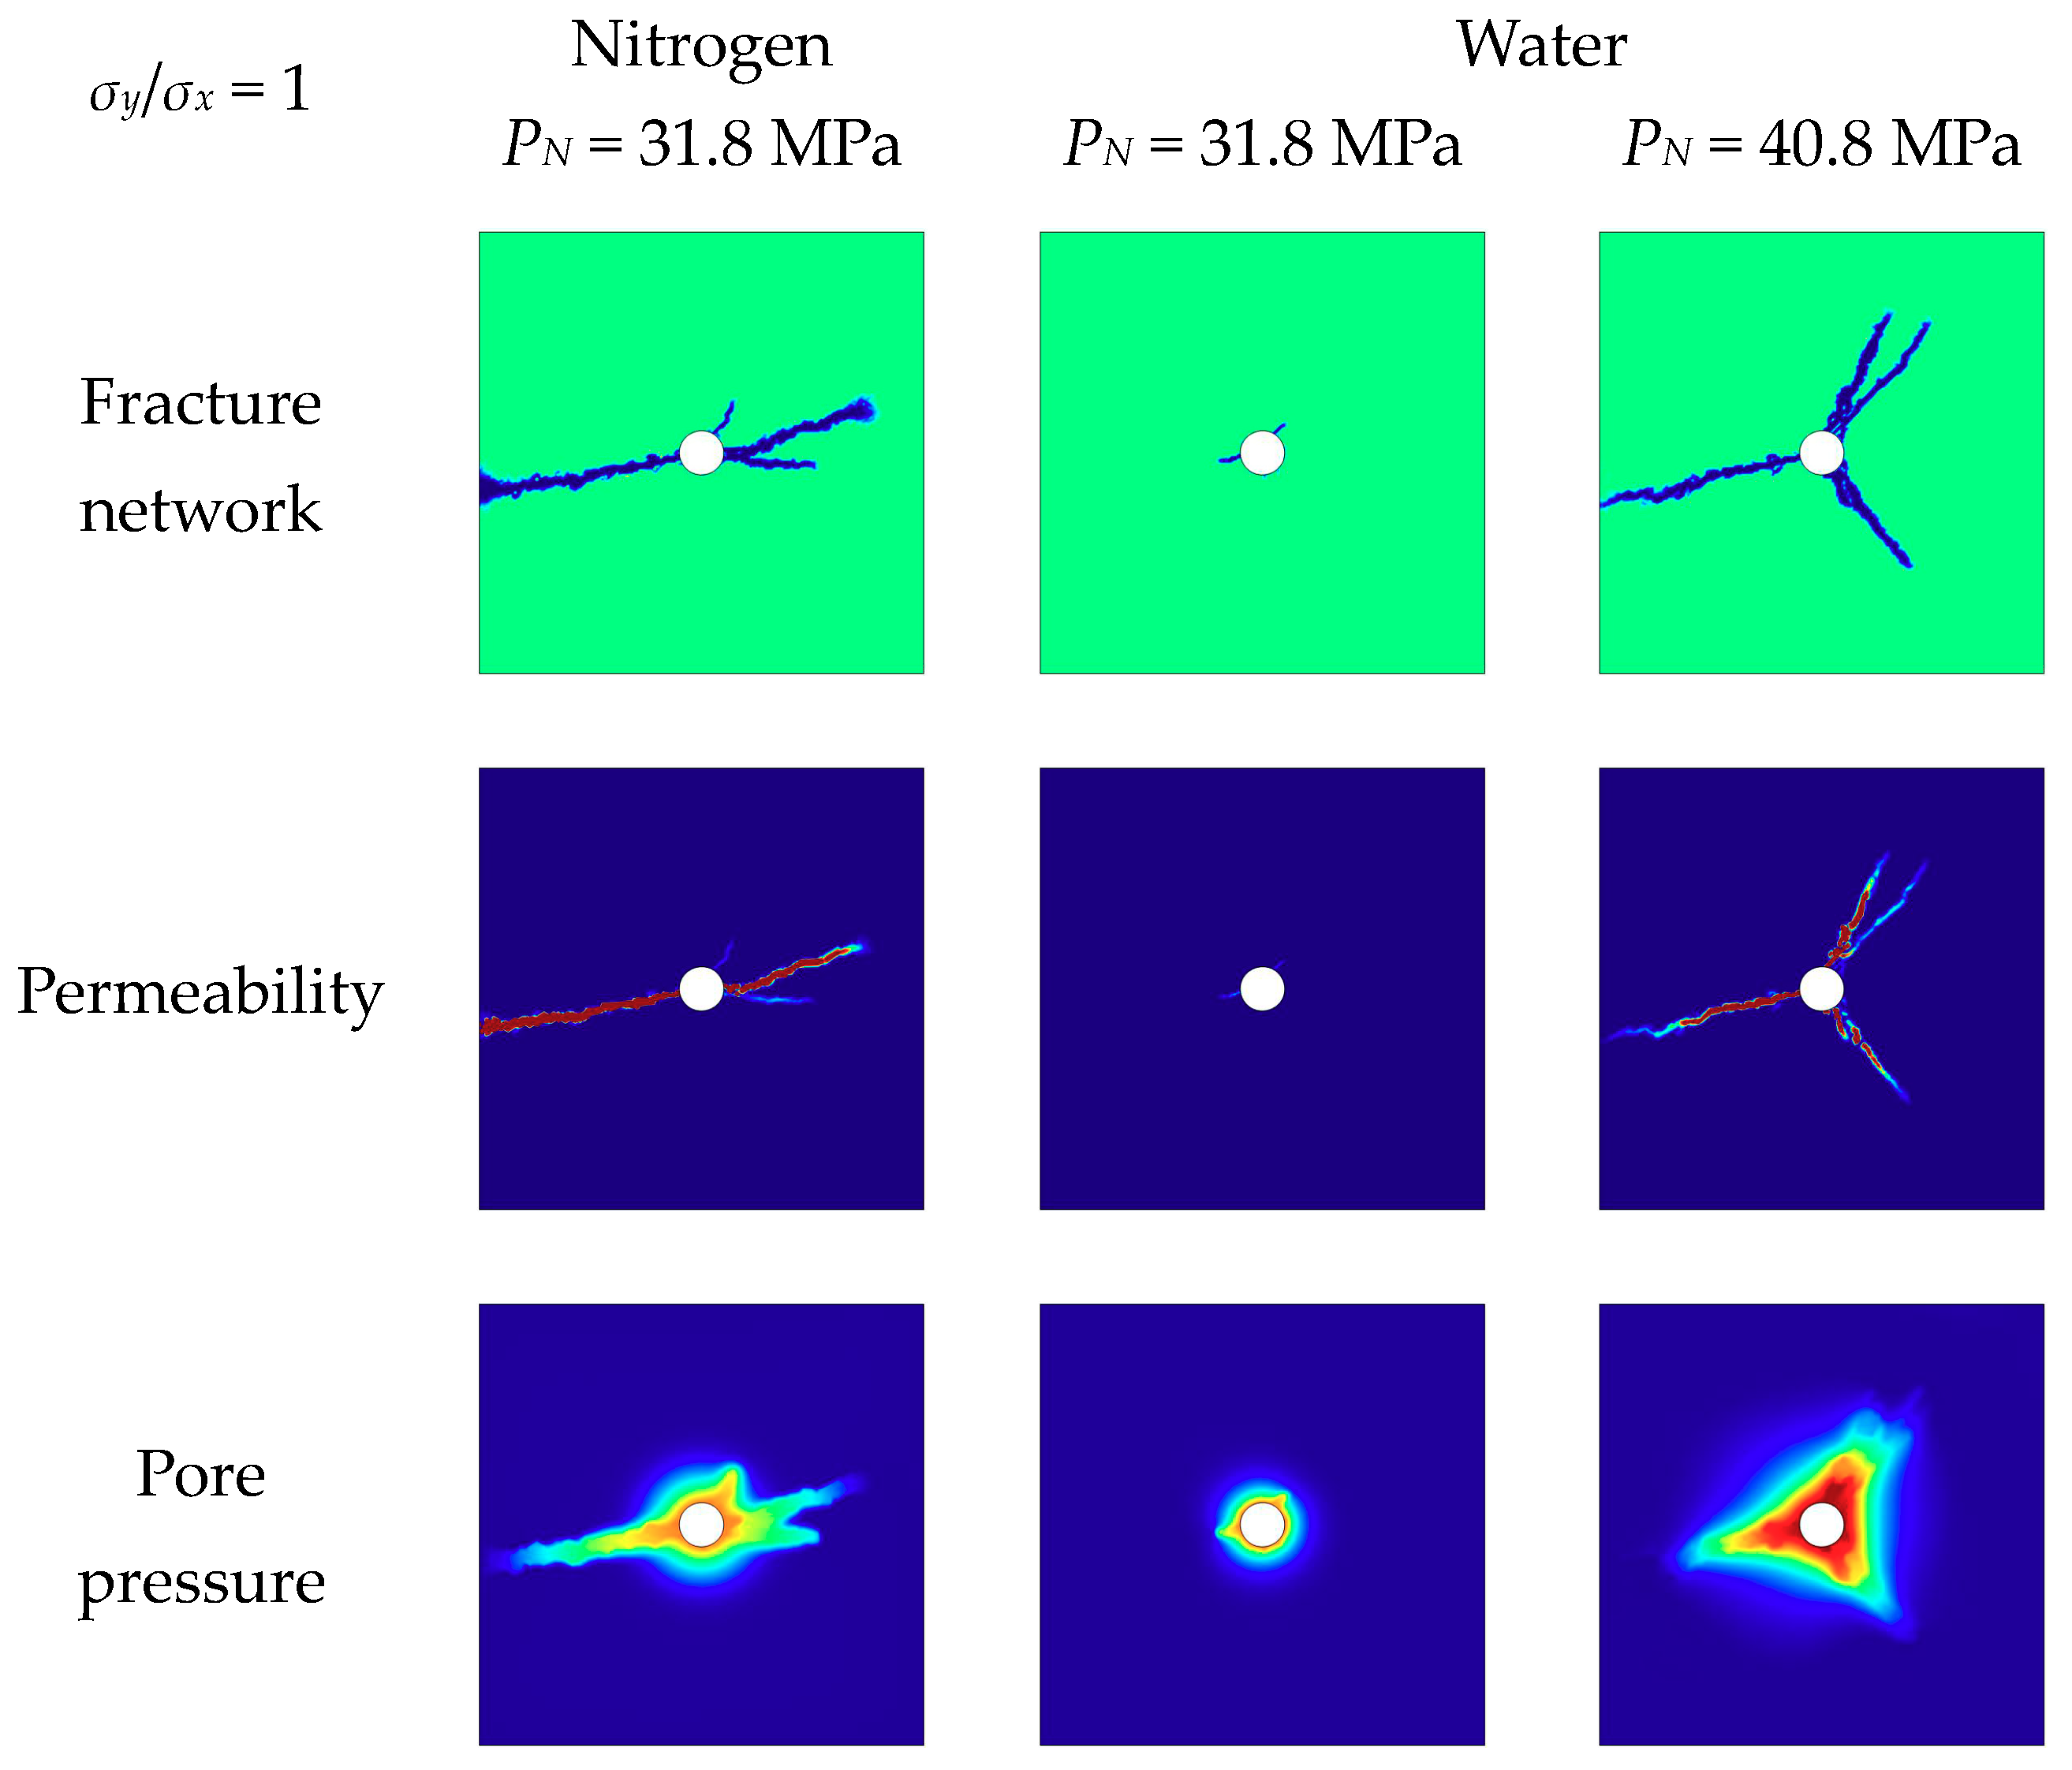
4.1. Comparison between Water Fracturing and Nitrogen Fracturing

In this section, the fracture network evolution, permeability and pore pressure during water fracturing and nitrogen fracturing were compared. The impact of the bedding plane was ignored in the analysis. The stress ratio is taken as 1 and the computational parameters are presented in Table 2.
Figure 11 presents the evolutions of fracture network, permeability and pore pressure during the water and nitrogen fracturing processes. From the first row of Figure 11, fractures initiated at the borehole wall and gradually extended outwards. Tensile failure was the major failure mode which was responsible for the initiation and propagation of fractures. Comparing the first and second columns of the first row, the fractures of nitrogen fracturing are much longer than those of water fracturing at the same injection pressure. In the third column of the first row, the fractures of water fracturing continued to propagate with injection pressure.
After the complete failure of the shale, nitrogen fracturing and water fracturing produced the same number of fractures, but the total length of fractures was a little bigger for water fracturing than for nitrogen fracturing. This is shown in the third row of Figure 11. From the second row of Figure 11, the permeability of the fracture network increased significantly due to the damage increment. Therefore, the injection fluid permeated into the fracture network more easily than the non-damaged zone. The permeability of radial fractures decreased along the fracture propagation path. It was larger near the borehole than near the fracture front. According to the effect of the fracture network, nitrogen fracturing had larger seepage area than water fracturing.
The failure number during water fracturing and nitrogen fracturing is compared in Figure 12. Fracture initiation occurred under almost the same injection pressure for water fracturing as for nitrogen fracturing. After the fracture initiation, the failure number of nitrogen fracturing increased more rapidly and induced a lower breakdown pressure. This was because nitrogen had lower viscosity and higher compressibility, and thus permeated faster in the fracture network than water. The pore pressure changed in a larger zone and modified the effective stress in this zone. Therefore, the fractures propagated rapidly after fracture initiation during nitrogen fracturing. After the complete failure of shale, the cumulative failure number of water fracturing and nitrogen fracturing had a slight difference. In summary, the nitrogen fracturing had a lower breakdown pressure and larger seepage area under the same injection pressure. The fractures from nitrogen fracturing propagated more easily. In consideration of the material and environmental advantages of nitrogen fracturing, nitrogen fracturing can be an alternative method to water fracturing.

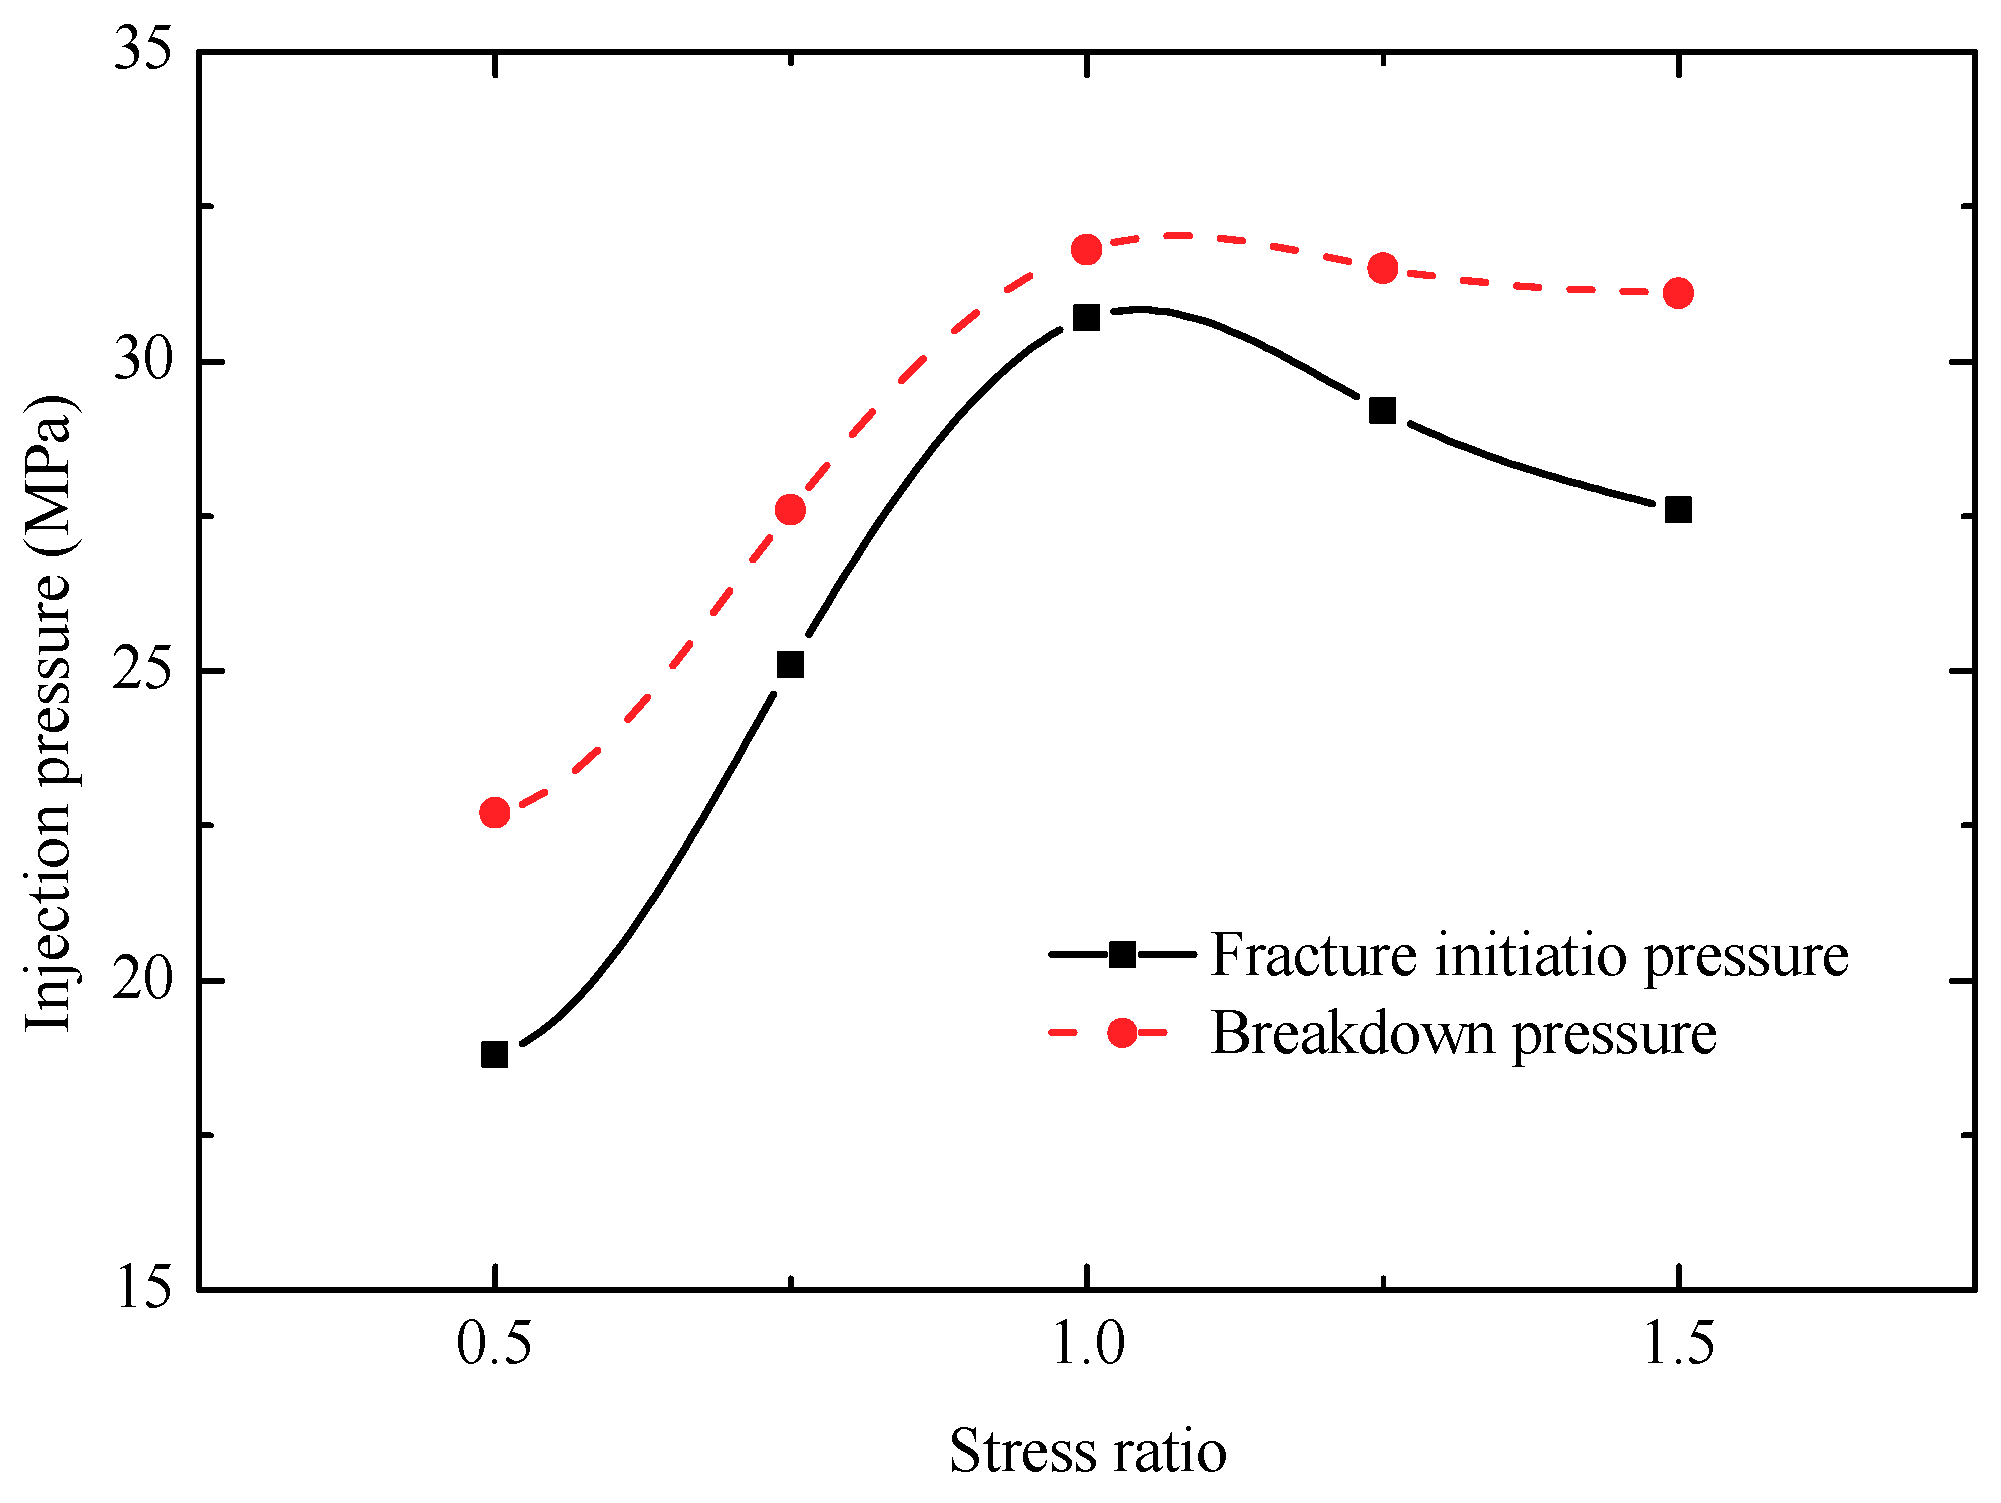
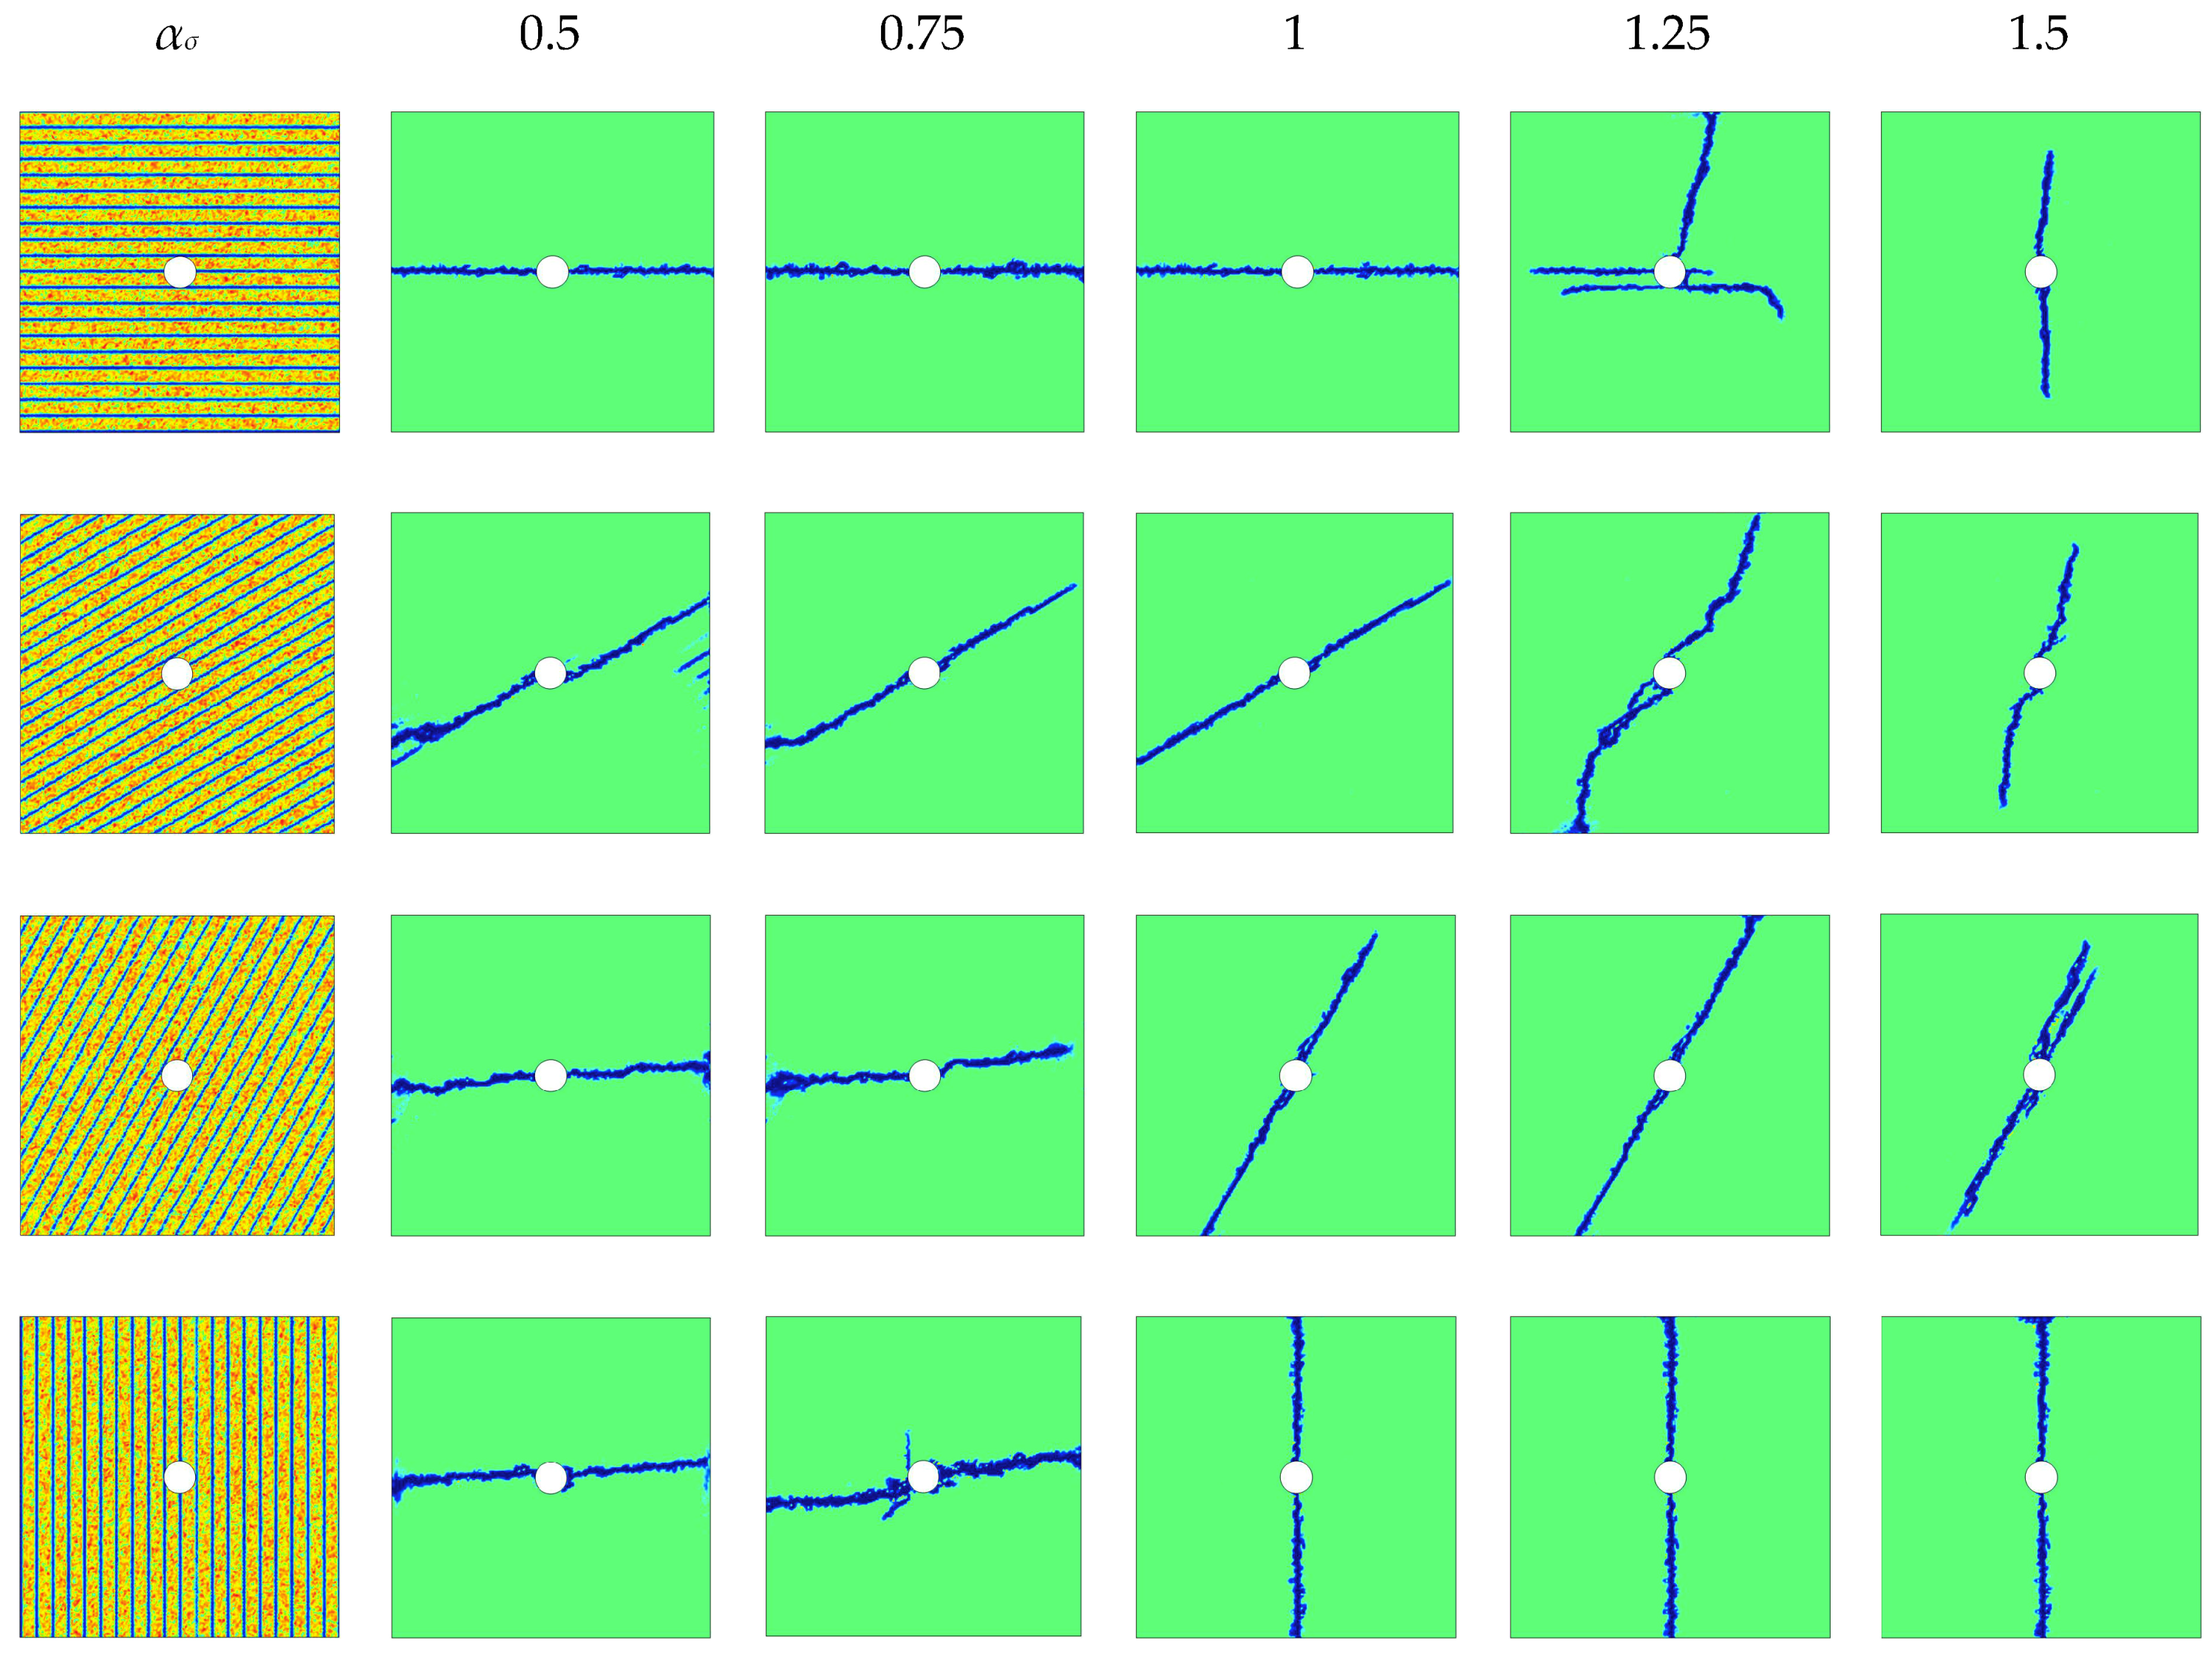
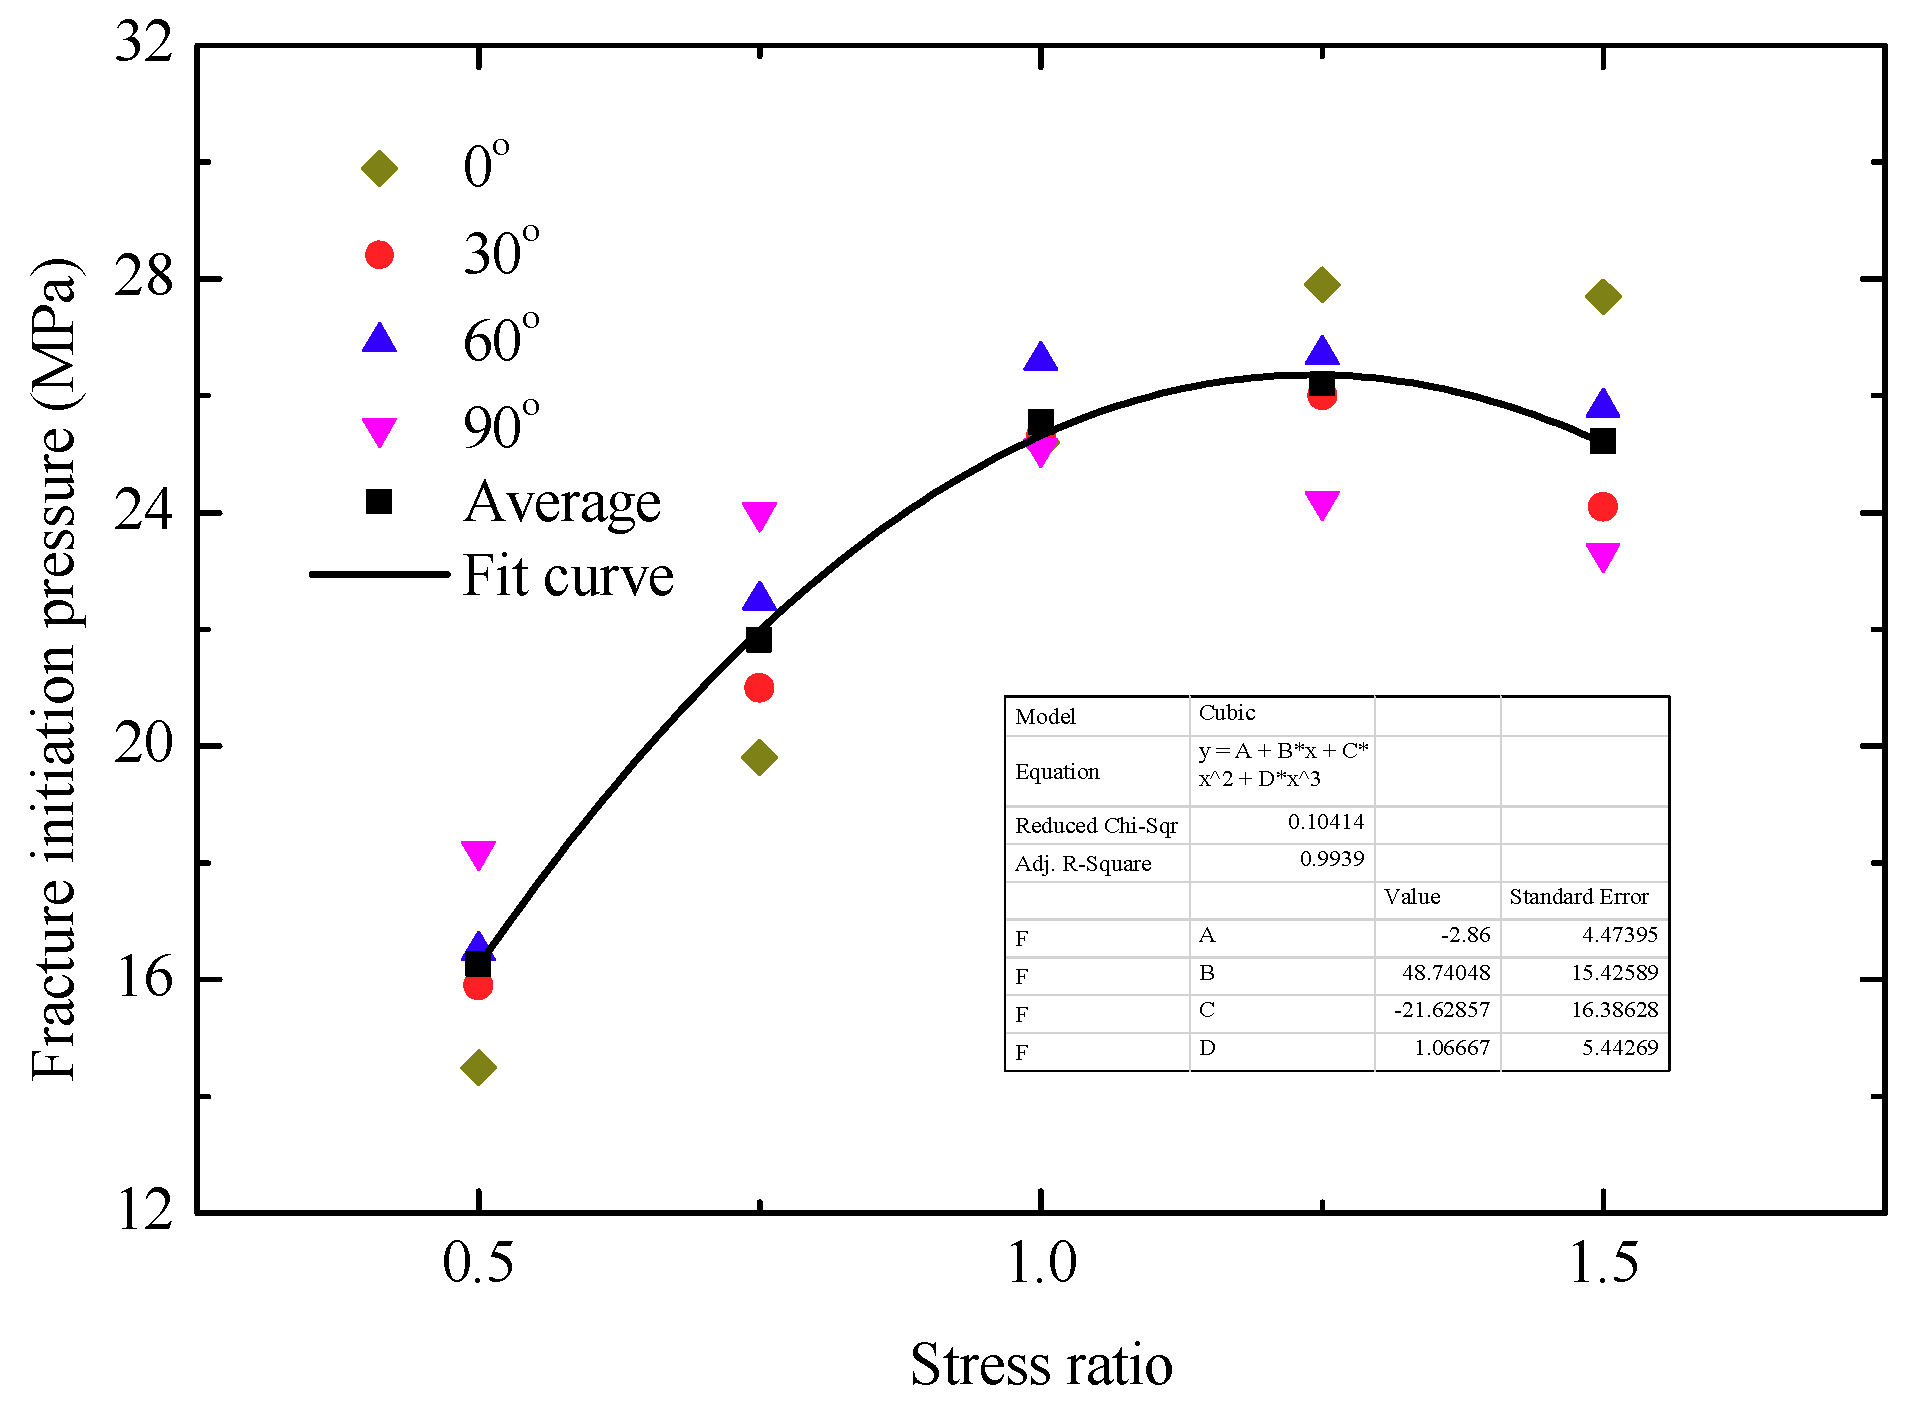
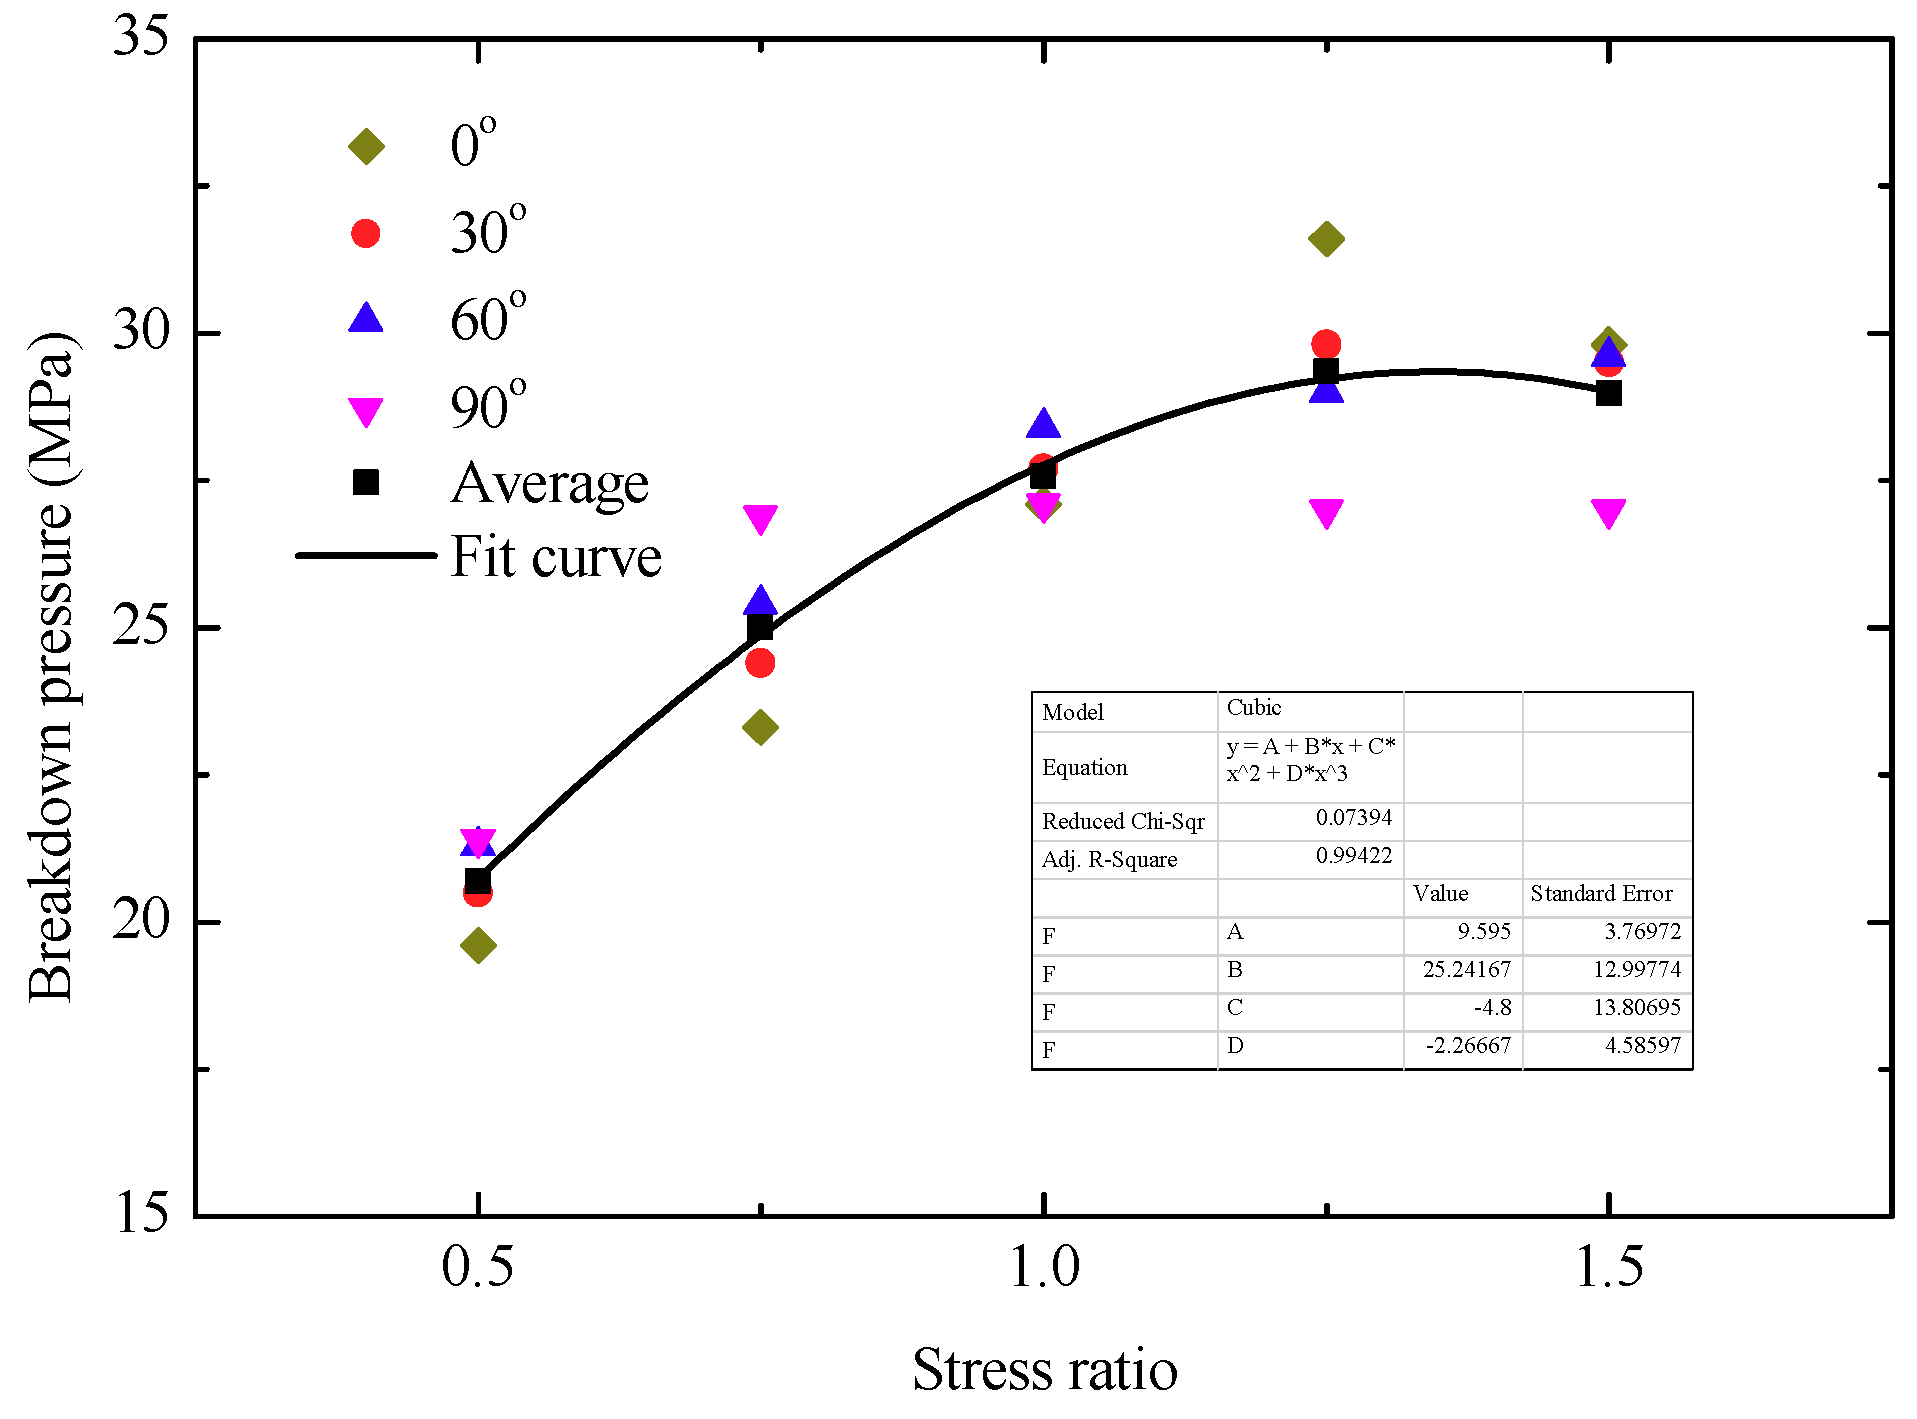
4.2. Impact of Stress Ratio

In this section, the effect of stress ratio on the fracture network evolution during nitrogen fracturing is investigated. The stress ratio ( α σ ) is set to be 0.5, 0.75, 1, 1.25 and 1.5, respectively. During the nitrogen fracturing, the evolutions of fracture network, permeability and pore pressure with stress ratio are presented in Figure 13. The initiation and propagation of main fractures were normal to the maximal principal in-situ stress. This behavior was also observed in the previous experiments [10]. The morphology of the fracture network varied with the stress ratio, which was in agreement with the simulation results of previous research [29]. The fracture number of the nitrogen fracturing reached the maximum when α σ = 1 and decreased with either a decrease or an increase of stress ratio. This indicated that the fracture network was the most complex under an isotropic stress state. Due to the significant effect of damage on permeability, the permeability of the fracture network increased conspicuously, inducing the largest seepage area and pore pressure when α σ = 1 , see Figure 13.
The change in failure number with stress ratio is shown in Figure 14. After the fracture initiation, the failure number grew rapidly with injection pressure. In the last load step, the failure number increased the most, indicating that the fractures propagated rapidly and completely destroyed the shale in a short time. Figure 15 presents the changes in the fracture initiation pressure ( P i n i ) and breakdown pressure ( P b r e a k ) with the stress ratio. The value of P i n i rapidly increased with stress ratio when α σ < 1 and then slightly decreased with stress ratio when α σ > 1 . It reached the maximal value when α σ = 1 . The value of P b r e a k was associated with the tensile strength of shale and the maximal principal stress. When α σ < 1 , the vertical stress was the maximal principal stress and increased with stress ratio. Therefore, there was a positive relationship between the breakdown pressure and stress ratio. When α σ > 1 , the constant horizontal stress became the maximal principal stress. Therefore, the value of P b r e a k almost remained constant. In summary, the stress ratio had a significant impact on fracture network evolution during the nitrogen fracturing. The fracture initiation pressure, fracture effectiveness and failure number reached their maximums when α σ = 1 .

4.3. Impact of Bedding Angle

Previous studies [4,32] have shown that the bedding plane had a significant impact on fracture behaviors due to its low strength, low Young’s modulus and high permeability. This section investigates the effect of the bedding angle on nitrogen fracturing under different stress ratios. The bedding angle ( θ ) is set to be 0 , 30 , 60 and 90 , whose Young’s modulus is shown in the first column of Figure 16. The computational parameters for the bedding shale are taken from Table 1. Figure 16 presents the fracture network evolution of the bedding shale with different bedding angles and stress ratios. It is observed that the fractures initiate from the borehole wall and propagate outwards to the far-field zone. The fracture initiation is mainly induced by tensile failure. When α σ < 1 , the main fractures are normal to the maximal principal stress for θ = 0 ,   60   or   90 , but along the bedding plane for θ = 3 0 . When α σ = 1 , the main fractures are along the bedding plane regardless of the bedding angle. When α σ > 1 , the fracture network is complex and changes with bedding angle. When α σ = 1.25 , the shale has four fractures along different directions for θ = 0 ; the fractures propagate along the bedding plane at first and gradually turn to be normal to the maximal principal stress for θ = 3 0 ; the fractures are along the bedding plane for θ = 6 0   and   9 0 . When α σ = 1.5 , the fractures are tortuous for θ = 3 0 , but the tortuosity is smaller than that for θ = 3 0   and   α σ = 1.25 ; the number of fractures is 3 for θ = 6 0 , while it is only 2 for θ = 6 0   and   α σ = 1.25 . These observations indicate that the fracture network varies with the bedding angle even when the same stress ratio is applied. Similarly, under the same bedding angle, the fracture network is related to the stress ratio. Therefore, the impacts of the bedding angle and stress ratio are not independent, which was consistent with the finding reported in [57].
The combination of these impacts induced the fractures propagation along different paths. For example, Case 1: when the bedding angle had a stronger impact than the stress ratio, the fractures propagated along the bedding plane as presented in the cases of 0 - 1 , 30 - 0.75 , 30 - 1 , 60 - 1 , 60 - 1.25 and 90 - 1 . Otherwise, the fractures propagated normal to the maximal principal stress as presented in the cases of 0 - 1.5 , 30 - 1.5 , 60 - 0.5 , 60 - 0.75 and 90 - 0.5 . Case 2: when the impacts of the bedding plane and stress ratio were of similar magnitude, the dominated factor of the fracture propagation changed alternately during nitrogen fracturing, inducing tortuous and complex propagation paths as presented in the cases of 0 - 1.25 , 30 - 0.5 , 30 - 1.25 , 60 - 1 , 60 - 1.5 and 90 - 0.75 . Therefore, the combined impact is the key factor needed to form effective fracture network in engineering applications.
Figure 17 presents the change of failure number in bedding shale with stress ratio and bedding angle during the nitrogen fracturing. The failure number increases with injection pressure and has a sharp growth after the fracture initiation. After the complete failure of shale, the cumulative failure number is larger when the impacts of bedding plane and stress ratio are of similar magnitude as shown in Figure 16. This indicates that the fracture network is more effective in the bedding shale of Case 2. Figure 18 and Figure 19 present the changes of the fracture initiation pressure and breakdown pressure with stress ratio and bedding angle. Under the same bedding angle, the values of P i n i and P b r e a k vary with stress ratio. The evolution tendencies are similar for different bedding angles and the average values of P i n i and P b r e a k are obtained. It is found that the average values increase at first and then decrease slightly with stress ratio, reaching the maximum when α σ = 1.25 . Furthermore, the values of P i n i and P b r e a k among different bedding angles also change with stress ratio and their difference reaches a minimum when α σ = 1 . This indicates that the impact of bedding angle on fracture initiation pressure and breakdown pressure is maximal under the isotropic stress state.

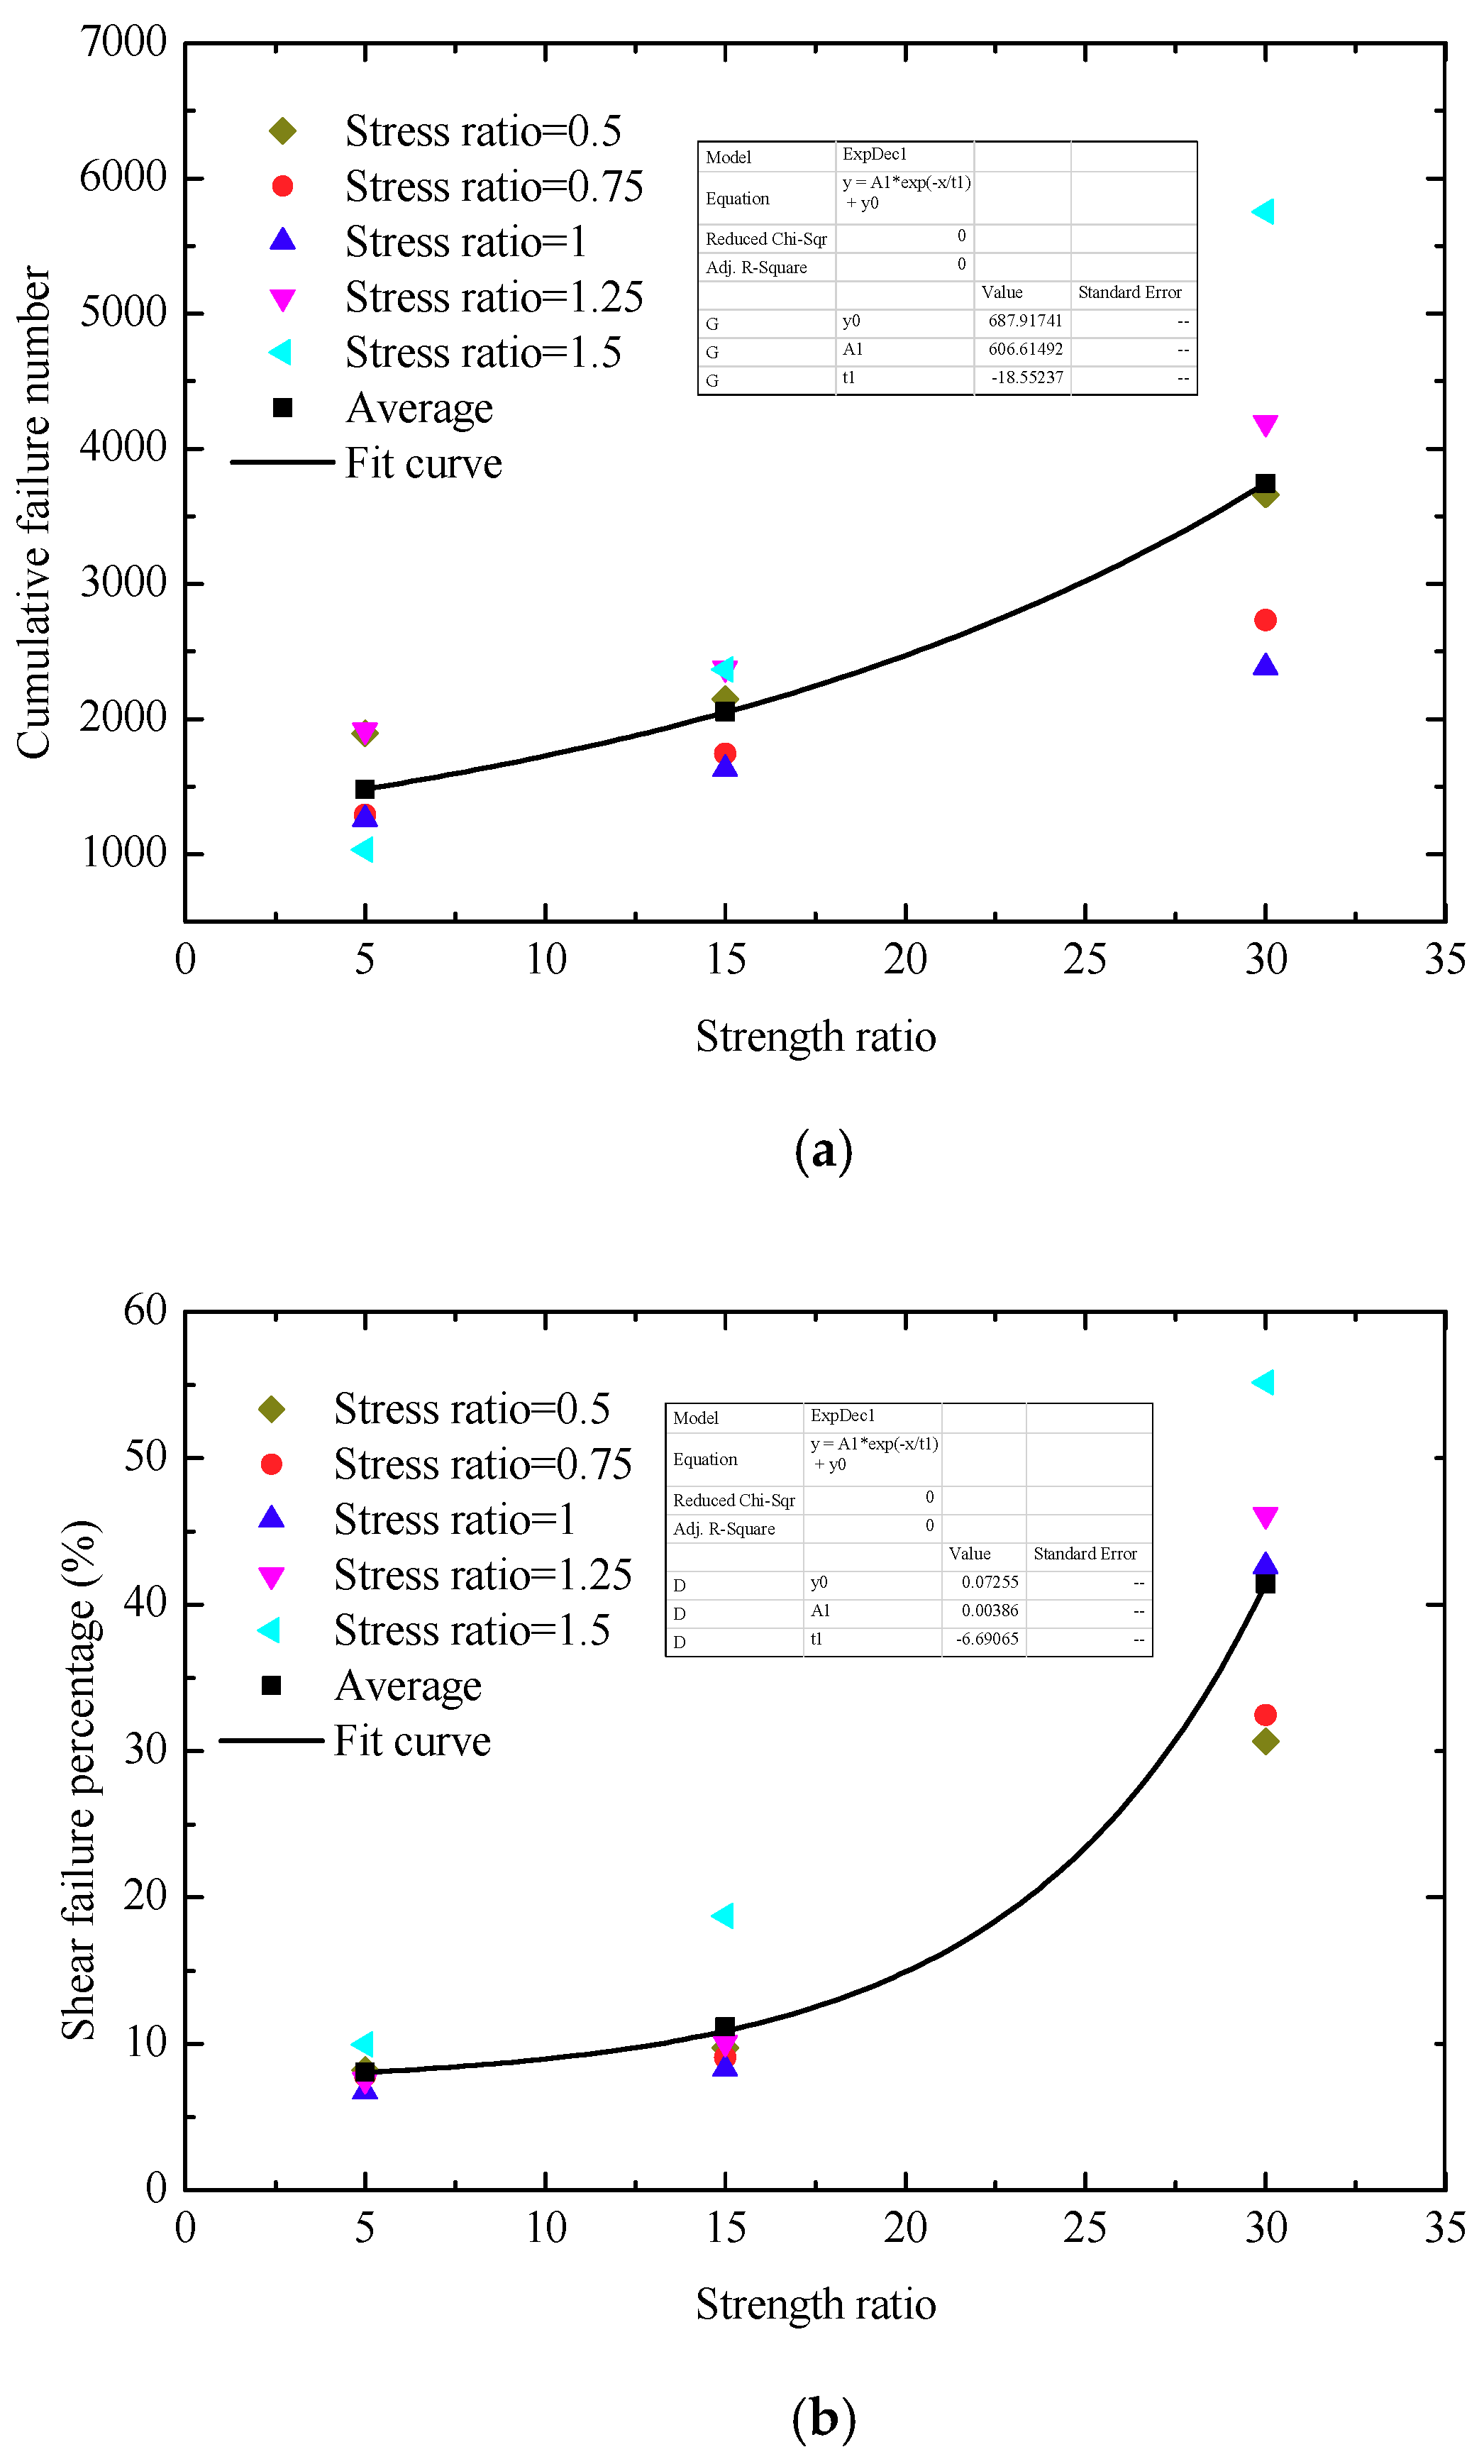
4.4. Impact of Strength Ratio

This section discusses the impact of the bedding plane strength on fracture network evolution during nitrogen fracturing. The shale with 30 bedding angle is taken as the sample and the tensile strength of the bedding plane is assumed as 0.25 MPa, 0.5 MPa and 1.5 MPa, while the strength of the shale matrix remains constant. The strength ratio ( α T ) is defined as the tensile strength of the shale matrix to the tensile strength of the bedding plane. Figure 20 shows the evolution of the fracture network in bedding shale with stress ratio and strength ratio during nitrogen fracturing. It shows that the strength ratio has a significant impact on the fracture network evolution during nitrogen fracturing. Under the same stress ratio, the propagation path and effectiveness of the fracture network vary with the strength ratio. Both fractures and damage zone increase significantly with strength ratio. When α T = 30 , shear failure nodes are numerous and mainly occur along the bedding plane, inducing bedding slide during nitrogen fracturing. This means that a large strength ratio changes the failure mode in the bedding plane and induces more bedding plane shearing. However, the shear failure nodes are discrete and mainly distributed in the far-field zone. The main fractures initiating from the borehole wall are still induced by the tensile failure.
Figure 21 shows the changes in cumulative failure number and shear failure percentage with stress ratio and strength ratio. The shear failure percentage is defined as the shear failure number to overall failure number. Both cumulative failure number and shear failure percentage increase with strength ratio. This means that fracturing effectiveness is better for larger strength ratios and the failure pattern of shale changes from tensile-only mode to tensile-shear combination mode due to the obvious increase in bedding plane shearing. Further, under the same strength ratio, both cumulative failure number and shear failure percentage vary with stress ratio. When α T = 5 , the cumulative failure number reaches its maximum for α σ = 0.5   and   α σ = 1.25 . When α T = 15 , the cumulative failure number reaches its maximum for α σ = 1.25   and   α σ = 1.5 . When α T = 30 , the cumulative failure number reaches its maximum for α σ = 1.5 . However, the shear failure percentage only reaches its maximum for α σ = 1.5 . This indicates that the impact of stress ratio on failure number of bedding shale is also related to the strength ratio. Considering the conclusion in Section 4.3, the fracture network evolution of bedding shale is associated with the combined impact of the stress ratio, bedding angle and strength ratio. In order to increase the fracture effectiveness, this combination impact should be carefully considered in engineering applications.

5. Conclusions

This study proposed a numerical model to study fracture network evolution during the nitrogen fracturing process in shale reservoirs with various stress ratios, bedding angles and strength ratios. The proposed model is composed of the mechanical deformation of shale, the fracturing fluid flow and the damage criteria of tensile mode and shear mode. This model was validated using the experimental data. The following specific conclusions were drawn.
The proposed model has the capacity to investigate fracture network evolution, permeability and pore pressure distribution during the nitrogen fracturing. Ignoring bedding planes, the fracture initiation pressure, breakdown pressure and fracturing effectiveness reached their maxima when the stress ratio is 1. The main fractures initiated and propagated normal to the maximal principal in-situ. The permeability of the fracture network increased significantly, inducing a larger seepage area and pore pressure during nitrogen fracturing in shale. The failure number increased rapidly after fracture initiation, resulting in a rapid propagation of fractures and an abrupt failure of the shale.
The impact of the bedding angle on nitrogen fracturing varied with stress ratio. The main propagation path of fractures was due to the stronger impact between bedding angle and stress ratio. The tortuous and complex fracture network was formed when the impacts of bedding plane and stress ratio were of similar magnitude. The average values of fracture initiation pressure and breakdown pressure increased at first and then decreased slightly with the stress ratio, reaching each maximum when the stress ratio is 1.25.
The strength ratio had a significant impact on fracture network evolution of the bedding shale. The fracture effectiveness and damage zone increased significantly with strength ratio. The failure pattern of shale changed from tensile-only mode to tensile-shear combination mode due to the obvious increase of the sheared bedding plane. Overall, the combined impact of stress ratio, bedding angle and strength ratio played an important role in the fracture network evolution of bedding shale.

Author Contributions

X.Z. conducted the numerical simulations and drafted the manuscript. J.W. designed and modified the theoretical framework and the structure of the manuscript; F.G. improved some Figures and presentations; X.W. provided the insight to the research work and improved the write-up of the manuscript.

Acknowledgments

This research was funded by the National Natural Science Foundation of China [Grant No. 51674246], the Creative Research and Development Group Program of Jiangsu Province [2014-27], the State Key Research Development Program of China [2016YFC0600705], and the China Scholarship Council [CSC, Grant No. 201706420028].

Conflicts of Interest

The authors declare no conflict of interest.

References

  1. Hyman, J.D.; Karra, S.; Makedonska, N.; Gable, C.W.; Painter, S.L.; Viswanathan, H.S. dfnWorks: A discrete fracture network framework for modeling subsurface flow and transport. Comput. Geosci. 2015, 84, 10–19. [Google Scholar] [CrossRef] [Green Version]
  2. Britt, L. Fracture stimulation fundamentals. J. Nat. Gas Sci. Eng. 2012, 8, 34–51. [Google Scholar] [CrossRef]
  3. Middleton, R.S.; Carey, J.W.; Currier, R.P.; Hyman, J.D.; Kang, Q.; Karra, S.; Jiménez-Martínez, J.; Porter, M.L.; Viswanathan, H.S. Shale gas and non-aqueous fracturing fluids: Opportunities and challenges for supercritical CO2. Appl. Energy 2015, 147, 500–509. [Google Scholar] [CrossRef]
  4. Lin, C.; He, J.; Li, X.; Wan, X.; Zheng, B. An experimental investigation into the effects of the anisotropy of shale on hydraulic fracture propagation. Rock Mech. Rock Eng. 2017, 50, 543–554. [Google Scholar] [CrossRef]
  5. Matsunaga, I.; Kobayashi, H.; Sasaki, S.; Ishida, T. Studying hydraulic fracturing mechanism by laboratory experiments with acoustic emission monitoring. Int. J. Rock Mech. Min. Sci. 1993, 30, 909–912. [Google Scholar] [CrossRef]
  6. Zhao, H.; Chen, M.; Jin, Y.; Ding, Y.; Wang, Y. Rock fracture kinetics of the fracture mesh system in shale gas reservoirs. Pet. Explor. Dev. 2012, 39, 465–470. [Google Scholar] [CrossRef]
  7. Hou, B.; Chen, M.; Li, Z.M.; Wang, Y.H.; Diao, C. Propagation area evaluation of hydraulic fracture networks in shale gas reservoirs. Pet. Explor. Dev. 2014, 41, 833–838. [Google Scholar] [CrossRef]
  8. Chen, L.; Chen, W.; Chen, Y.; Benyamin, L.; Li, A. Investigation of hydraulic fracture propagation using a post-peak control system coupled with acoustic emission. Rock Mech. Rock Eng. 2015, 48, 1233–1248. [Google Scholar] [CrossRef]
  9. Weng, X. Modeling of complex hydraulic fractures in naturally fractured formation. J. Unconv. Oil Gas Resour. 2015, 9, 114–135. [Google Scholar] [CrossRef]
  10. Dehghan, A.N.; Goshtasbi, K.; Ahangari, K.; Jin, Y.; Bahmani, A. 3D numerical modeling of the propagation of hydraulic fracture at its intersection with natural (pre-existing) fracture. Rock Mech. Rock Eng. 2017, 50, 367–386. [Google Scholar] [CrossRef]
  11. Hyman, J.D.; Jiménez-Martínez, J.; Viswanathan, H.S.; Carey, J.W.; Porter, M.L.; Rougier, E.; Karra, S.; Kang, Q.; Frash, L.; Chen, L.; Lei, Z. Understanding hydraulic fracturing: A multi-scale problem. Phil. Trans. R. Soc. A 2016, 374, 20150426. [Google Scholar] [CrossRef] [PubMed]
  12. Zhang, C.; Ranjith, P.G. Experimental study of matrix permeability of gas shale: An application to CO2-based shale fracturing. Energies 2018, 11, 702. [Google Scholar] [CrossRef]
  13. Wang, H.; Li, G.; Shen, Z. A feasibility analysis on shale gas exploitation with supercritical carbon dioxide. Energy Source Part A 2012, 34, 1426–1435. [Google Scholar] [CrossRef]
  14. Cao, Z.Z.; Zhou, Y.J.; Zhang, Q.; Wang, E.Q. Mechanical analysis of the coupled gas-solid-thermal model during rock damage. CMC-Comput. Mater. Con. 2015, 47, 203–215. [Google Scholar] [CrossRef]
  15. Stringfellow, W.T.; Domen, J.K.; Camarillo, M.K.; Sandelin, W.L.; Borglin, S. Physical, chemical, and biological characteristics of compounds used in hydraulic fracturing. J. Hazard. Mater. 2014, 275, 37–54. [Google Scholar] [CrossRef] [PubMed]
  16. Chen, Y.; Pope, T.L.; Lee, J.C. Novel CO2-emulsified viscoelastic surfactant fracturing fluid system. In Proceedings of the SPE European Formation Damage Conference, Sheveningen, The Netherlands, 25–27 May 2005. [Google Scholar]
  17. Bustos, O.A.; Heiken, K.R.; Stewart, M.E.; Mueller, P.M.; Lipinski, E.; Bui, T. Case study: Application of a viscoelastic surfactant-based CO2 compatible fracturing fluid in the frontier formation, Big Horn Basin, Wyoming. In Proceedings of the Rocky Mountain Oil & Gas Technology Symposium, Denver, CO, USA, 16–18 April 2007. [Google Scholar]
  18. Gu, M.; Mohanty, K.K. Effect of foam quality on effectiveness of hydraulic fracturing in shales. Int. J. Rock Mech. Min. 2014, 70, 273–285. [Google Scholar] [CrossRef]
  19. Sun, X.; Liang, X.; Wang, S.; Lu, Y. Experimental study on the rheology of CO2 viscoelastic surfactant foam fracturing fluid. J. Pet. Sci. Eng. 2014, 119, 104–111. [Google Scholar] [CrossRef]
  20. Zhang, R.; Yin, X.; Winterfeld, P.H.; Wu, Y. A fully coupled thermal-hydrological-mechanical-chemical model for CO2 geological sequestration. J. Nat. Gas Sci. Eng. 2016, 28, 280–304. [Google Scholar] [CrossRef]
  21. He, J.; Afolagboye, L.O.; Lin, C.; Wan, X. An experimental investigation of hydraulic fracturing in shale considering anisotropy and using freshwater and supercritical CO2. Energies 2018, 11, 557. [Google Scholar] [CrossRef]
  22. Lau, H.C.; Li, H.; Huang, S. Challenges and opportunities of coalbed methane development in China. Energy Fuel 2017, 31, 4588–4602. [Google Scholar] [CrossRef]
  23. Li, H.; Lau, H.C.; Huang, S. China’s coalbed methane development: A review of the challenges and opportunities in subsurface and surface engineering. J. Pet. Sci. Eng. 2018, 166, 621–635. [Google Scholar] [CrossRef]
  24. Alpern, J.; Marone, C.; Elsworth, D.; Belmonte, A.; Connelly, P. Exploring the physicochemical processes that govern hydraulic fracture through laboratory experiments. In Proceedings of the 46th U.S. Rock Mechanics/Geomechanics Symposium, Chicago, IL, USA, 24–27 June 2012. [Google Scholar]
  25. Gomaa, A.M.; Qu, Q.; Maharidge, R.; Nelson, S.; Reed, T. New insights into hydraulic fracturing of shale formations. In Proceedings of the International Petroleum Technology Conference, Doha, Qatar, 19–22 January 2014. [Google Scholar]
  26. Li, X.; Feng, Z.; Han, G.; Elsworth, D.; Marone, C.; Saffer, D.; Cheon, D. Breakdown pressure and fracture surface morphology of hydraulic fracturing in shale with H2O, CO2 and N2. Geomech. Geophys. Geo-Energy Geo-Resour. 2016, 2, 63–76. [Google Scholar] [CrossRef]
  27. Zhang, X.; Wang, J.G.; Gao, F.; Ju, Y.; Liu, J. Impact of water and nitrogen fracturing fluids on fracturing initiation pressure and flow pattern in anisotropic shale reservoirs. Comput. Geotech. 2017, 81, 59–76. [Google Scholar] [CrossRef]
  28. Behnia, M.; Goshtasbi, K.; Zhang, G.; Mirzeinaly Yazdi, S.H. Numerical modeling of hydraulic fracture propagation and reorientation. Eur. J. Environ. Civ. Eng. 2015, 19, 152–167. [Google Scholar] [CrossRef]
  29. Wang, Y.; Li, X.; Zhang, Y.X.; Wu, Y.S.; Zheng, B. Gas shale hydraulic fracturing: A numerical investigation of the fracturing network evolution in the Silurian Longmaxi formation in the southeast of Sichuan Basin, China, using a coupled FSD approach. Environ. Earth Sci. 2016, 75, 1093. [Google Scholar] [CrossRef]
  30. Shojaei, A.; Taleghani, A.D.; Li, G. A continuum damage failure model for hydraulic fracturing of porous rocks. Int. J. Plast. 2014, 59, 199–212. [Google Scholar] [CrossRef]
  31. Shalev, E.; Lyakhovsky, V. The processes controlling damage zone propagation induced by wellbore fluid injection. Geophys. J. Int. 2013, 193, 209–219. [Google Scholar] [CrossRef] [Green Version]
  32. Nagel, N.B.; Sanchez-Nagel, M.A.; Zhang, F.; Garcia, X.; Lee, B. Coupled numerical evaluations of the geomechanical interactions between a hydraulic fracture stimulation and a natural fracture system in shale formations. Rock Mech. Rock Eng. 2013, 46, 581–609. [Google Scholar] [CrossRef]
  33. Chong, Z.; Li, X.; Chen, X.; Zhang, J.; Lu, J. Numerical investigation into the effect of natural fracture density on hydraulic fracture network propagation. Energies 2017, 10, 914. [Google Scholar] [CrossRef]
  34. Perkins, T.K.; Kern, L.R. Widths of hydraulic fractures. J. Pet. Technol. 1961, 13, 937–949. [Google Scholar] [CrossRef]
  35. Voegele, M.D.; Abou-Sayed, A.S.; Jones, A.H. Optimization of stimulation design through the use of in-situ stress determination. J. Pet. Technol. 1983, 35, 1071–1081. [Google Scholar] [CrossRef]
  36. Haimson, B.; Fairhurst, C. In-situ stress determination at great depth by means of hydraulic fracturing. In Proceedings of the 11th US Symposium on Rock Mechanics (USRMS), Berkeley, CA, USA, 16–19 June 1969. [Google Scholar]
  37. Hoek, E.; Brown, E.T. Underground Excavations in Rock; CRC Press: Boca Raton, FL, USA, 1980. [Google Scholar]
  38. Brady, B.H.; Brown, E.T. Rock Mechanics: For Underground Mining; Springer: Glasgow, UK, 2013. [Google Scholar]
  39. Figueiredo, B.; Tsang, C.; Rutqvist, J.; Niemi, A. Study of hydraulic fracturing processes in shale formations with complex geological settings. J. Pet. Sci. Eng. 2017, 152, 361–374. [Google Scholar] [CrossRef]
  40. Hou, B.; Zhang, R.; Zeng, Y.; Fu, W.; Muhadasi, Y.; Chen, M. Analysis of hydraulic fracture initiation and propagation in deep shale formation with high horizontal stress difference. J. Pet. Sci. Eng. 2018. [Google Scholar] [CrossRef]
  41. Li, Z.; Li, L.; Huang, B.; Zhang, L.; Li, M.; Zuo, J.; Li, A.; Yu, Q. Numerical investigation on the propagation behavior of hydraulic fractures in shale reservoir based on the DIP technique. J. Pet. Sci. Eng. 2017, 154, 302–314. [Google Scholar] [CrossRef]
  42. Zhou, J.; He, S.; Tang, M.; Huang, Z.; Chen, Y.; Chi, J.; Zhu, Y.; Yuan, P. Analysis of wellbore stability considering the effects of bedding planes and anisotropic seepage during drilling horizontal wells in the laminated formation. J. Pet. Sci. Eng. 2018, 170, 507–524. [Google Scholar] [CrossRef]
  43. Cheng, C.; Li, X. Cyclic Experimental studies on damage evolution behaviors of shale dependent on structural orientations and confining pressures. Energies 2018, 11, 160. [Google Scholar] [CrossRef]
  44. Daneshy, A.A. Hydraulic fracture propagation in layered formations. Soc. Pet. Eng. J. 1978, 18, 33–41. [Google Scholar] [CrossRef]
  45. Cho, J.; Kim, H.; Jeon, S.; Min, K. Deformation and strength anisotropy of Asan gneiss, Boryeong shale, and Yeoncheon schist. Int. J. Rock Mech. Min. 2012, 50, 158–169. [Google Scholar] [CrossRef]
  46. Shen, B.; Siren, T.; Rinne, M. Modelling fracture propagation in anisotropic rock mass. Rock Mech. Rock Eng. 2015, 48, 1067–1081. [Google Scholar] [CrossRef]
  47. Zhou, M.; Zhang, Y.; Zhou, R.; Hao, J.; Yang, J. Mechanical property measurements and fracture propagation analysis of Longmaxi shale by micro-CT uniaxial compression. Energies 2018, 11, 1409. [Google Scholar] [CrossRef]
  48. Detournay, E.; Cheng, A.H. Fundamentals of poroelasticity. In Analysis and Design Methods; Pergamon Press: Oxford, UK, 1995; pp. 113–171. [Google Scholar]
  49. Zhang, H.; Liu, J.; Elsworth, D. How sorption-induced matrix deformation affects gas flow in coal seams: A new FE model. Int. J. Rock Mech. Min. 2008, 45, 1226–1236. [Google Scholar] [CrossRef]
  50. Mudunuru, M.K.; Karra, S.; Makedonska, N.; Chen, T. Sequential geophysical and flow inversion to characterize fracture networks in subsurface systems. Stat. Anal. Data Min. 2017, 10, 326–342. [Google Scholar] [CrossRef] [Green Version]
  51. Civan, F.; Rai, C.S.; Sondergeld, C.H. Shale-gas permeability and diffusivity inferred by improved formulation of relevant retention and transport mechanisms. Transp. Porous Media 2011, 86, 925–944. [Google Scholar] [CrossRef]
  52. Zhu, W.C.; Tang, C.A. Micromechanical model for simulating the fracture process of rock. Rock Mech. Rock Eng. 2004, 37, 25–56. [Google Scholar] [CrossRef]
  53. Zhu, W.C.; Wei, C.H.; Li, S.; Wei, J.; Zhang, M.S. Numerical modeling on destress blasting in coal seam for enhancing gas drainage. Int. J. Rock Mech. Min. 2013, 59, 179–190. [Google Scholar] [CrossRef]
  54. Kim, J.; Moridis, G.J. Development of the T + M coupled flow–geomechanical simulator to describe fracture propagation and coupled flow–thermal–geomechanical processes in tight/shale gas systems. Comput. Geosci. 2013, 60, 184–198. [Google Scholar] [CrossRef]
  55. Mudunuru, M.K.; Nakshatrala, K.B. A framework for coupled deformation–diffusion analysis with application to degradation/healing. Int. J. Numer. Meth. Eng. 2012, 89, 1144–1170. [Google Scholar] [CrossRef]
  56. Xu, C.; Mudunuru, M.K.; Nakshatrala, K.B. Material degradation due to moisture and temperature. Part 1: Mathematical model, analysis, and analytical solutions. Contin. Mech. Thermodyn. 2016, 28, 1847–1885. [Google Scholar] [CrossRef]
  57. Beugelsdijk, L.; De Pater, C.J.; Sato, K. Experimental hydraulic fracture propagation in a multi-fractured medium. In Proceedings of the SPE Asia Pacific Conference on Integrated Modelling for Asset Management, Yokohama, Japan, 25–26 April 2000. [Google Scholar]
Figure 1. Typical constitutive law for rock under uniaxial stress.
Energies 11 02503 g001
Figure 2. Yield surfaces of the M–C and D–P criteria on the deviatoric plane.
Energies 11 02503 g002
Figure 3. Schematic diagram of the nitrogen fracturing test system.
Energies 11 02503 g003
Figure 4. Experimental results of the shale sample during nitrogen fracturing. (a) Pressurization history; and (b) Failure pattern.
Energies 11 02503 g004
Figure 5. Interactions among mechanical deformation, fracturing fluid flow and damage evolution.
Energies 11 02503 g005
Figure 6. Computational schematic chart in the numerical simulation.
Energies 11 02503 g006
Figure 7. A computational model for the shale with a bedding angle of 90 . (a) Grid model with 6776 triangular elements, (b) Young’s modulus for shale matrix and bedding plane.
Energies 11 02503 g007
Figure 8. Fracture network evolution versus time in numerical simulation: (a) 3.78 MPa; (b) 5.52 MPa; and (c) 5.58 MPa.
Energies 11 02503 g008
Figure 9. Injection pressure and failure number in numerical simulation.
Energies 11 02503 g009
Figure 10. A computational model for shale. (a) Geometry model, (b) Grid model with 7008 triangular elements.
Energies 11 02503 g010
Figure 11. Fracture network evolution and related responses during the water and nitrogen fracturing processes.
Energies 11 02503 g011
Figure 12. Failure number during water fracturing and nitrogen fracturing.
Energies 11 02503 g012
Figure 13. Fracture network evolution and related responses during the nitrogen fracturing under different stress ratios.
Energies 11 02503 g013
Figure 14. Change of failure number with stress ratio during nitrogen fracturing.
Energies 11 02503 g014
Figure 15. Changes of fracture initiation pressure and breakdown pressure with stress ratio.
Energies 11 02503 g015
Figure 16. Young’s modulus and fracture network evolution of bedding shale during nitrogen fracturing.
Energies 11 02503 g016
Figure 17. Change of failure number in bedding shale during nitrogen fracturing.
Energies 11 02503 g017
Figure 18. Change of fracture initiation pressure with stress ratio and bedding angle.
Energies 11 02503 g018
Figure 19. Change of breakdown pressure with stress ratio and bedding angle.
Energies 11 02503 g019
Figure 20. Evolution of fracture network with stress ratio and strength ratio during nitrogen fracturing.
Energies 11 02503 g020
Figure 21. Changes of (a) Cumulative failure number and (b) Shear failure percentage with stress ratio and strength ratio.
Energies 11 02503 g021
Table 1. Computational parameters of the shale matrix and bedding plane.
ParameterMatrixBedding
Young’s modulus, E0 (GPa)141.4
Initial porosity, φ00.030.1
Initial permeability, k0 (m2)1 × 10−181 × 10−17
Tensile strength, σt (MPa)7.51.5
Internal friction angle, φ30°20°
Cohesion, c (MPa)206
Table 2. Computational parameters of heterogeneous shale.
ParameterValue
Density of shale, ρs(kg/m3)2230
Temperature, T (K)304
Viscosity of nitrogen, μn (mPa·s)0.018
Viscosity of water, μw(mPa·s)1
Young’s modulus, E0 (GPa)14
Shape parameter, b6
Initial porosity, φ00.03
Initial permeability, k0 (m2) 1 × 10⁻¹⁸
Poisson’s ratio, υ0.2
Pressurization rate, lP (MPa/s)0.1
Tensile strength, σt (MPa)7.5
Internal friction angle, φ30°
Cohesion, c (MPa)20

