Article

Impacts of Bioenergy Policies on Land-Use Change in Nigeria

1
Center for Earth System Research and Sustainability, Institute of Geography, Bundesstrasse 55, 20146 Hamburg, Germany
2
Center for Earth System Research and Sustainability, Research Unit Sustainability and Global Change, Grindelberg 5, 20144 Hamburg, Germany
*
Author to whom correspondence should be addressed.
Energies 2018, 11(1), 152; https://doi.org/10.3390/en11010152
Submission received: 17 November 2017 / Revised: 29 December 2017 / Accepted: 29 December 2017 / Published: 8 January 2018

Abstract

:
In recent years, bioenergy policies have increased the competition for land as well as the risk of adverse environmental impacts resulting from deforestation and greenhouse gas emissions (GHGs). Primary land-use objectives confronting society today include meeting the growing demand for agricultural products, especially energy crops, preserving essential ecosystem services for human well-being and long-run agrarian production, and contributing to the climate policy target. Here, future agricultural, societal and environmental consequences of bioenergy policies under different global climate and societal development scenarios were assessed using a novel Forest and Agricultural Sector Optimization Model for Nigeria (NGA–FASOM). The results reveal that, in Nigeria, meeting emission reduction requires an implementation of a minimum carbon price of $80/ton within the forest and agricultural sectors. A carbon price alone is not sufficient to preserve the remaining forests and pasture land in Nigeria when bioenergy is subsidized. Furthermore, the result shows that subsidy on bioenergy does not have any significant effect on the total social welfare. The findings in this study provide a guide for policymakers in designing appropriate policies addressing bioenergy industry issues in Nigeria.

1. Introduction

One of the most significant challenges for sustainable development today is how to manage limited land resources to achieve an optimal balance between market commodities production, especially food production, and provision of non-market services. To meet the growing demand for agricultural products while preserving essential ecosystem services on which human well-being depends, various government policy actions are implemented. Many countries, including Nigeria, initiated different bioenergy policies with the underlying aim of decarbonizing their economy [1,2,3,4,5]. Current bioenergy policies in Nigeria include the Renewable Electricity Policy Guidelines (REPG, 2006), the Renewable Electricity Action Program (REAP, 2006), the Nigerian Biofuel Policy and Incentives (2007), and others. These Nigerian bioenergy policies are in line with the United Nations Framework Convention on Climate Change entitled National Adaptation Strategy and Plan of Action on Climate Change for Nigeria (NASPA–CCN) as part of its commitment to the Global Climate Action Plan [6]. There is agreement that the mitigation efforts and investments over the next two to three decades will have a substantial impact on opportunities to achieve lower stabilization levels of greenhouse gas emissions (GHGs) [7]. Controversial opinions exist, however, about the feasibility of a decarbonized economy with current policies. Many studies have debated the expected results of different bioenergy mandates, which include its risks as related to indirect land-use impact concerning GHGs, food security, land grabbing, etc. [7,8,9,10,11,12].
In scenario assessments with high demand for crop-based bioenergy, food production is often achieved by a substantial expansion of cropland area [13]. The projected global demand for transportation fuel in 2050 requires about twice the land used to meet food demand under the presumed 70% increase in per capita food demand [14]. Thus, in developing bioenergy policies, the inclusion of land-use change (LUC) impacts is necessary [15].
Many developed countries and emerging economies have implemented biofuel development initiatives; for instance, the European Union, United States of America, Brazil, etc. The adoption of similar actions in Africa requires a proper assessment of the complex and heterogeneous interactions between land use, society and environment. Currently, bioenergy policy impact assessments in Africa involve only low-resolution studies or studies with limited scope. In Nigeria, however, significant emphasis is placed on researching bioenergy potential. Integrated assessment review studies have drawn their policy recommendations from reviews on modeling studies done in other countries. These assessments have been made neglecting the uncertainties from the economic perspective of bioenergy policies and only taking into consideration spatial and technological assessment methods, with little impact scope [16].
Few studies shed light on LUC implications for Nigeria with a broader scope and higher-resolution modeling framework [17]. Existing model-based studies on various energy demand and supply pathways for Nigeria are limited by a low range and a coarse resolution [18]. While trade had internalized agricultural products and welfare distribution, environmental impacts are not internalized. Appropriate policies should be drawn from detailed scientific-modeling studies because their effects can be heterogeneous.
To study bioenergy policies in Nigeria in a more comprehensive way, we develop here a novel Forest and Agricultural Sector Optimization Model for Nigeria (NGA–FASOM). It is a partial equilibrium model that combines complex natural conditions for agricultural and forest production and aggregate commodity-market demand functions. It integrates engineering, geographical and economical methods in addressing policy recommendations regarding bioenergy deployment. One of the novelties of this modeling work is that it is among the few models of its kind that adequately capture the biophysical aspect of oil palm as a bioenergy feedstock/crop by incorporating the model output of [19]. The objectives of this study are to show trajectories of the future agricultural, societal, and environmental outcomes of various bioenergy policies in Nigeria under different global climate and societal development scenarios.

2. Methodology and Data

2.1. Description of Forest and Agricultural Sector Optimization Model for Nigeria (NGA–FASOM)

The Nigeria Forest and Agricultural Sector Model (NGA–FASOM) is a bottom-up approach economic model which implies that supply is formed from the bottom (land cover, land use and management systems) to the top (markets/trade/demand) (see Figure 1). NGA–FASOM is a recursive dynamic partial equilibrium model which integrates bioenergy production processes, crop products as well as livestock and forestry products. All land-cover types are explicitly represented in the model across each time horizon. The optimal decision in time-step t depends on decisions that the agents have taken in time-step t − 1. When each new time-step starts, the conditions for land use are updated using the solutions of the simulations from the previous time-step. NGA–FASOM is brought up to date for each time step using exogenous drivers such as population and bioenergy policies. Bioenergy conversion processes in the model are also well represented according to the conversion processes, technological cost, conversion efficiencies and their corresponding co-product.
The model design concept and structure is similar to the US Agricultural Sector and Mitigation of Greenhouse Gas (ASMGHG) model [20], and its derivative the Global Biomass Optimization Model (GLOBIOM) [8]. Market equilibrium is computed by choosing land use, processing, and trade activities which maximize the sum of the producer and consumer surpluses as stated in the objective function (W) subject to resource, technological and policy constraints (see Appendix A for model equations) [21]. In NGA–FASOM, agricultural production faces a downward-sloped commodity-demand function (see also Appendix A). Land-use equations are part of the block equations of NGA–FASOM. To restrict extreme specialization in the model, we implemented the so-called crop mix equation which makes the share of each crop mimic and stay within observed bounds. NGA–FASOM is based on the decision and rational theory [22], consumer economics and law of demand [23], resource economics and law of supply [21,22], as well as market equilibrium with trade [23,24,25,26]. Market prices and resource values are endogenous outputs of the model. The model comprises 36 states of Nigeria plus the federal capital territory. Trade with other countries is kept exogenous. Here, a spatial equilibrium approach following [20] is used. Therefore, trade and demand adjustments occurred at the 37 economic units of the model according to marginal production prices and transportation cost assuming homogeneous goods across states. We represented the following bioenergy conversion processes in the model: combined heat and power production, heat, fermentation of ethanol, power and gas production, and gasification for methanol and heat production. NGA–FASOM is solved for 5 decadal time steps (2011–2050). For more details about the model structure and philosophy see [8,20,21,27,28].

2.2. NGA–FASOM Baseline

The NGA–FASOM baseline model is calibrated to reference data through a physical gap parameter and a linear activity cost adjustment. The gap parameter corrects data deficiencies and implicitly depicts all model-exogenous activities. For example, NGA–FASOM depicts eight important agricultural crops. Resources used by other crops are exogenous to the model and are assigned to the gap parameter. The linear cost adjustment is performed such that at baseline activity levels, marginal cost equals marginal revenue according to microeconomic theory. The model assumes a $200/ha and $500/ha cost for crop management change (CMC) and LUC respectively [29]. Furthermore, we assume constant cost functions throughout the entire model horizon. The LUC impacts of the Nigeria REPG (2006), REAP (2006), and the Nigerian Biofuel Policy and Incentives (2007) are assessed in comparison to a policy baseline with and without emission tax. The baseline represents the way Nigeria develops between 2011 (the model base year) and 2050 with our modeled bioenergy policy mix and no tax on GHG emissions. We chose 2011 as the baseline because the National Bureau of Statistics of Nigeria provides state-level data for this year on crop areas and crop yields, commodity-market indicators, population, consumption patterns and exchange rates. Population is assumed to increase continuously until 2050 with a growth rate equal to the averaged growth rate for the past 10 years in each state. The assumption and calculation result is in line with the projected population of Nigeria according to [30]. Food commodity-demand functions are shifted in proportion to population growth. Other factors that influence demand for land-based products, e.g., Gross Domestic Product (GDP) and dietary patterns, are not explicitly modeled in this study because of insufficient data availability.

2.3. NGA-FASOM Scenarios

The main driving forces for the scenarios are the bioenergy mandates as stipulated in the Nigeria REPG (2006), REAP (2006), the Nigerian Biofuel Policy and Incentives (2007), and the National Renewable Energy and Energy Efficiency Policy (NREEEP, 2015). Tax abatement is modeled as a subsidy which implies a reduction in the producer’s price of bioenergy products. Electricity demand from biomass is 2273.08 GJ, 11,560.10 GJ, 16,201.61 GJ, 16,201.61 GJ by 2020, 2030, 2040 and 2050, respectively [31]. Bio-diesel demand is planned at 900 million liters for 2020, 2030 and 2040 [32]. Ethanol demand is 2 billion liters by 2020, 2030, 2040, 2050 for the gasoline 10% ethanol blend ratio (E10) requirement [32]. The assessed bioenergy support instruments include: (a) a 50% subsidy at the price of $0.044097/GJ for electricity; and (b) a 50% subsidy for biodiesel and ethanol at the price of $0.88/L. As an incentive to reduce GHG emissions from deforestation, we implemented and compared three carbon tax levels of $40, $80 and $120 per ton of carbon. The combination of carbon tax and bioenergy subsidies resulted in eight scenarios, which were simulated and compared to the baseline of the bioenergy mandate. This analysis does not intend to evaluate the feasibility of Nigerian government policies on the bioenergy target incorporated in the study. Instead, the scenarios aim to assess the impacts of different policy actions on the LUC, GHG emission and agricultural welfare, with future welfare being discounted at 5% following [33,34], and including the implications for Nigeria under constrained technology. Our approach is in line with the findings of the Intergovernmental Panel on Climate change (IPCC) [34], that the mitigation response of implementing carbon pricing is consistent across models and studies. The opportunity costs of carbon sequestration (break-even carbon price) for most countries in Africa is still unknown. In this study, the base year was calibrated using the above carbon prices to help give more insight into the implications of the different carbon prices for the case of Nigeria.

2.4. Data

Land resources are the only resources explicitly incorporated in the current version of the model; this is crucial to this modeling. To enable regional biophysical process characterization modeling of agricultural and forest production, a detailed land delineation was used [29]. The land-cover/land-use data of the forest and agricultural area of Nigeria used is a combination of [30] and [31]. Three different land-cover types were represented; forest land, grassland and cropland. The crop species disaggregation was done using the crop-area statistical estimates from the National Bureau of Statistics of Nigeria at the state level. The study chose to use remotely sensed data and survey statistics as a scaling factor in disaggregation since political and economic pressure, combined with inconsistencies in reporting, often results in over/underestimates of the quantity of agricultural land. Government statistics underestimate agrarian area as well as the rate at which it is converted to non-agricultural use (see also [32]). The biophysical model outputs used include those of the Environmental Policy Integrated Climate Model (EPIC) [33] and the Agricultural Production Systems Simulator oil palm (APSIM) [19,34]. To explore different biophysical model output scenarios with the IPCC Representative Concentration Pathway 4.5 (RCP4.5) scenario, three productivity pathways are considered which include subsistence agriculture, low input, and high input (see Table 1 and [19] for a detailed description of the input assumptions). In total, 8 crops were represented in the model; cassava, corn, cotton, dry beans, millet, oil palm, rice, and sugarcane. The IPCC tier 3 digestion and metabolism model for ruminants (RUMINANT) model output was used for livestock production representation in the model [35]. In the current version of NGA–FASOM, we incorporated the updated International Livestock Research Institute/Food and Agriculture Organization (FAO) production systems classification. Twelve livestock production systems from this nomenclature were represented: livestock-only systems, arid and semi-arid (LGA); livestock-only systems, humid and sub-humid (LGH); livestock-only systems, hyper-arid (LGHYP); livestock-only systems, highland/temperate (LGT); irrigated mixed crop/livestock systems, arid and semi-arid (MIA); irrigated mixed crop/livestock systems, humid and sub-humid (MIH); irrigated mixed crop/livestock systems, hyper-arid (MIHYP); rain-fed mixed crop/livestock systems, arid and semi-arid (MRA); rain-fed mixed crop/livestock systems, humid and sub-humid (MRH); rain-fed mixed crop/livestock systems, hyper-arid (MRHYP); rain-fed mixed crop/livestock systems, highland/temperate (MRT); built-up areas (URBAN); and, root-crop based and root-based mixed systems (Others) [36,37]. Seven livestock products are present in the model; cow meat, cow milk, pig meat, poultry meat, poultry eggs and sheep and goat meat. We also used the output of the Global Forest Model (G4M) model for that of the forestry sector [38]. The forest products considered consist of saw logs, pulp logs, other industrial logs, traditional fuelwood, and biomass for energy. Biomass, pulp logs and saw logs further undergo processing for their respective bioenergy products. The processing cost and conversion coefficients for both forest and crop biomass, and crop to ethanol and/or methanol are sourced from [39,40,41] and Brunus Enterprises Nigeria Ltd. To enable quantitative comparison, all energy products were converted to gigajoules. LUC and livestock CO2-equivalent emissions are derived from [8]. Market data are sourced from the National Bureau of Statistics of Nigeria, FAO and from literature. Where market data is available at the national level, disaggregation using state population was done. For more details on each of the input data, see appropriate citations above.

2.5. Model Uncertainties

The study model, NGA–FASOM is robust to input data; therefore, our analysis relies on the available data which are plausible but might be a potential source of uncertainty. Future climate and socioeconomic development pathways could be another source of uncertainty in the model.

3. Results and Discussion

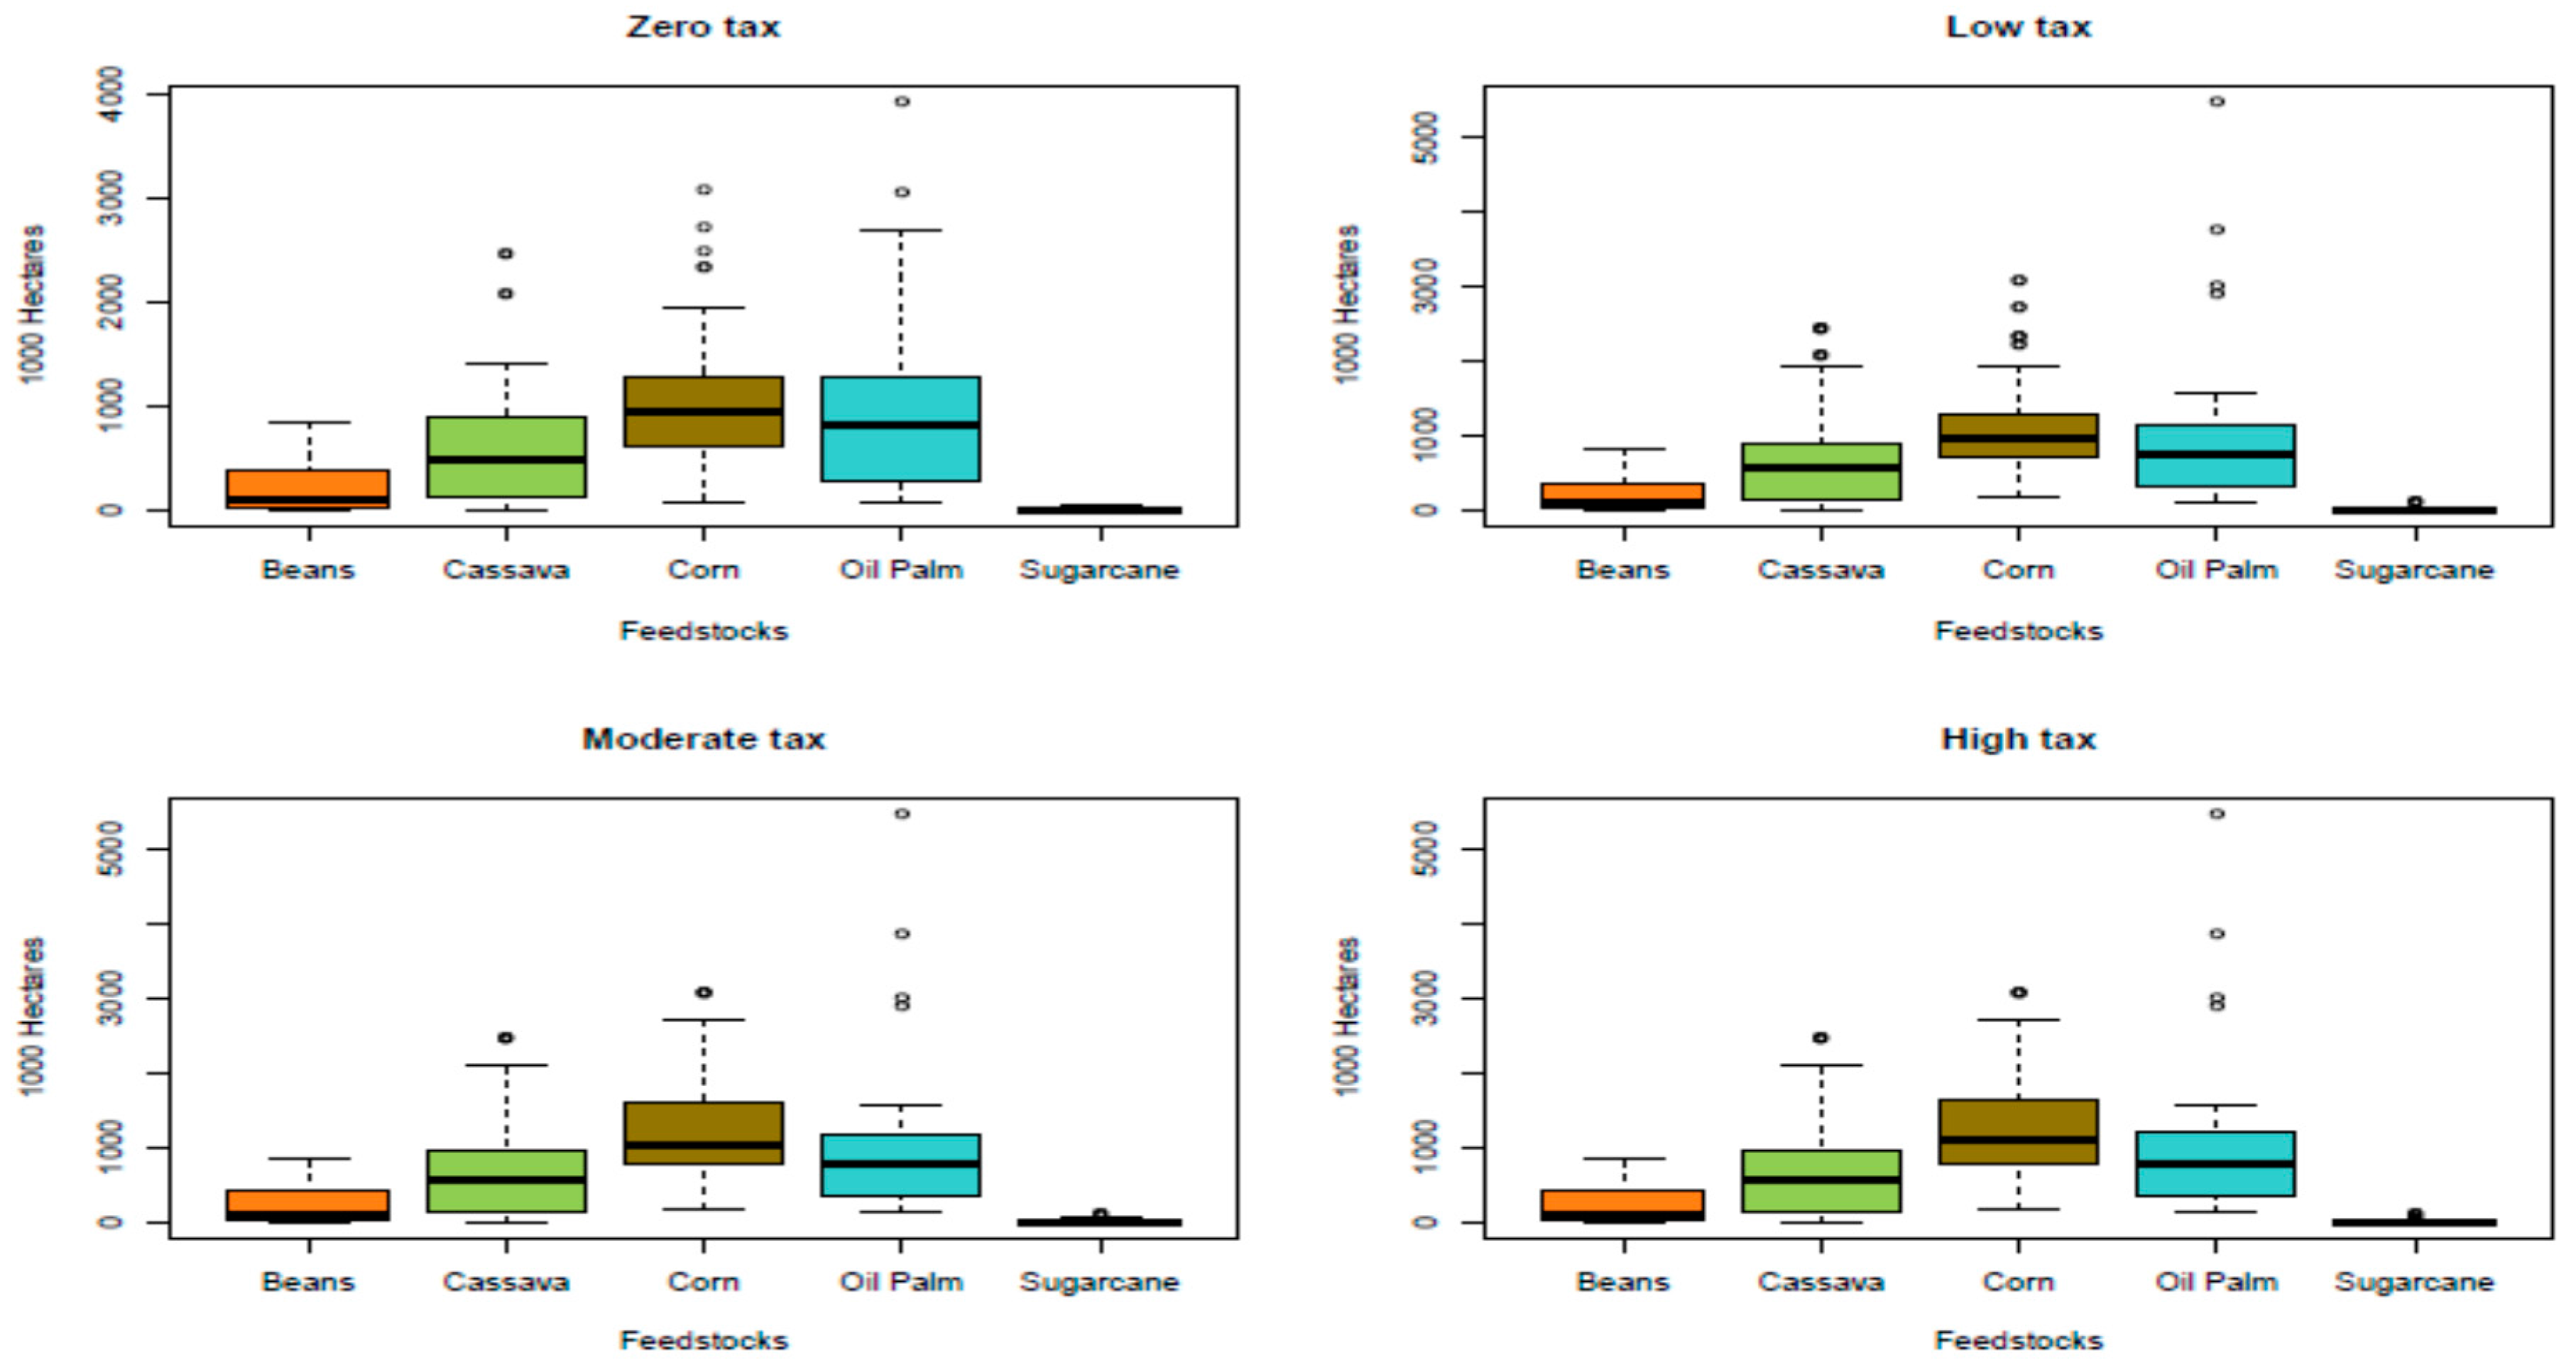
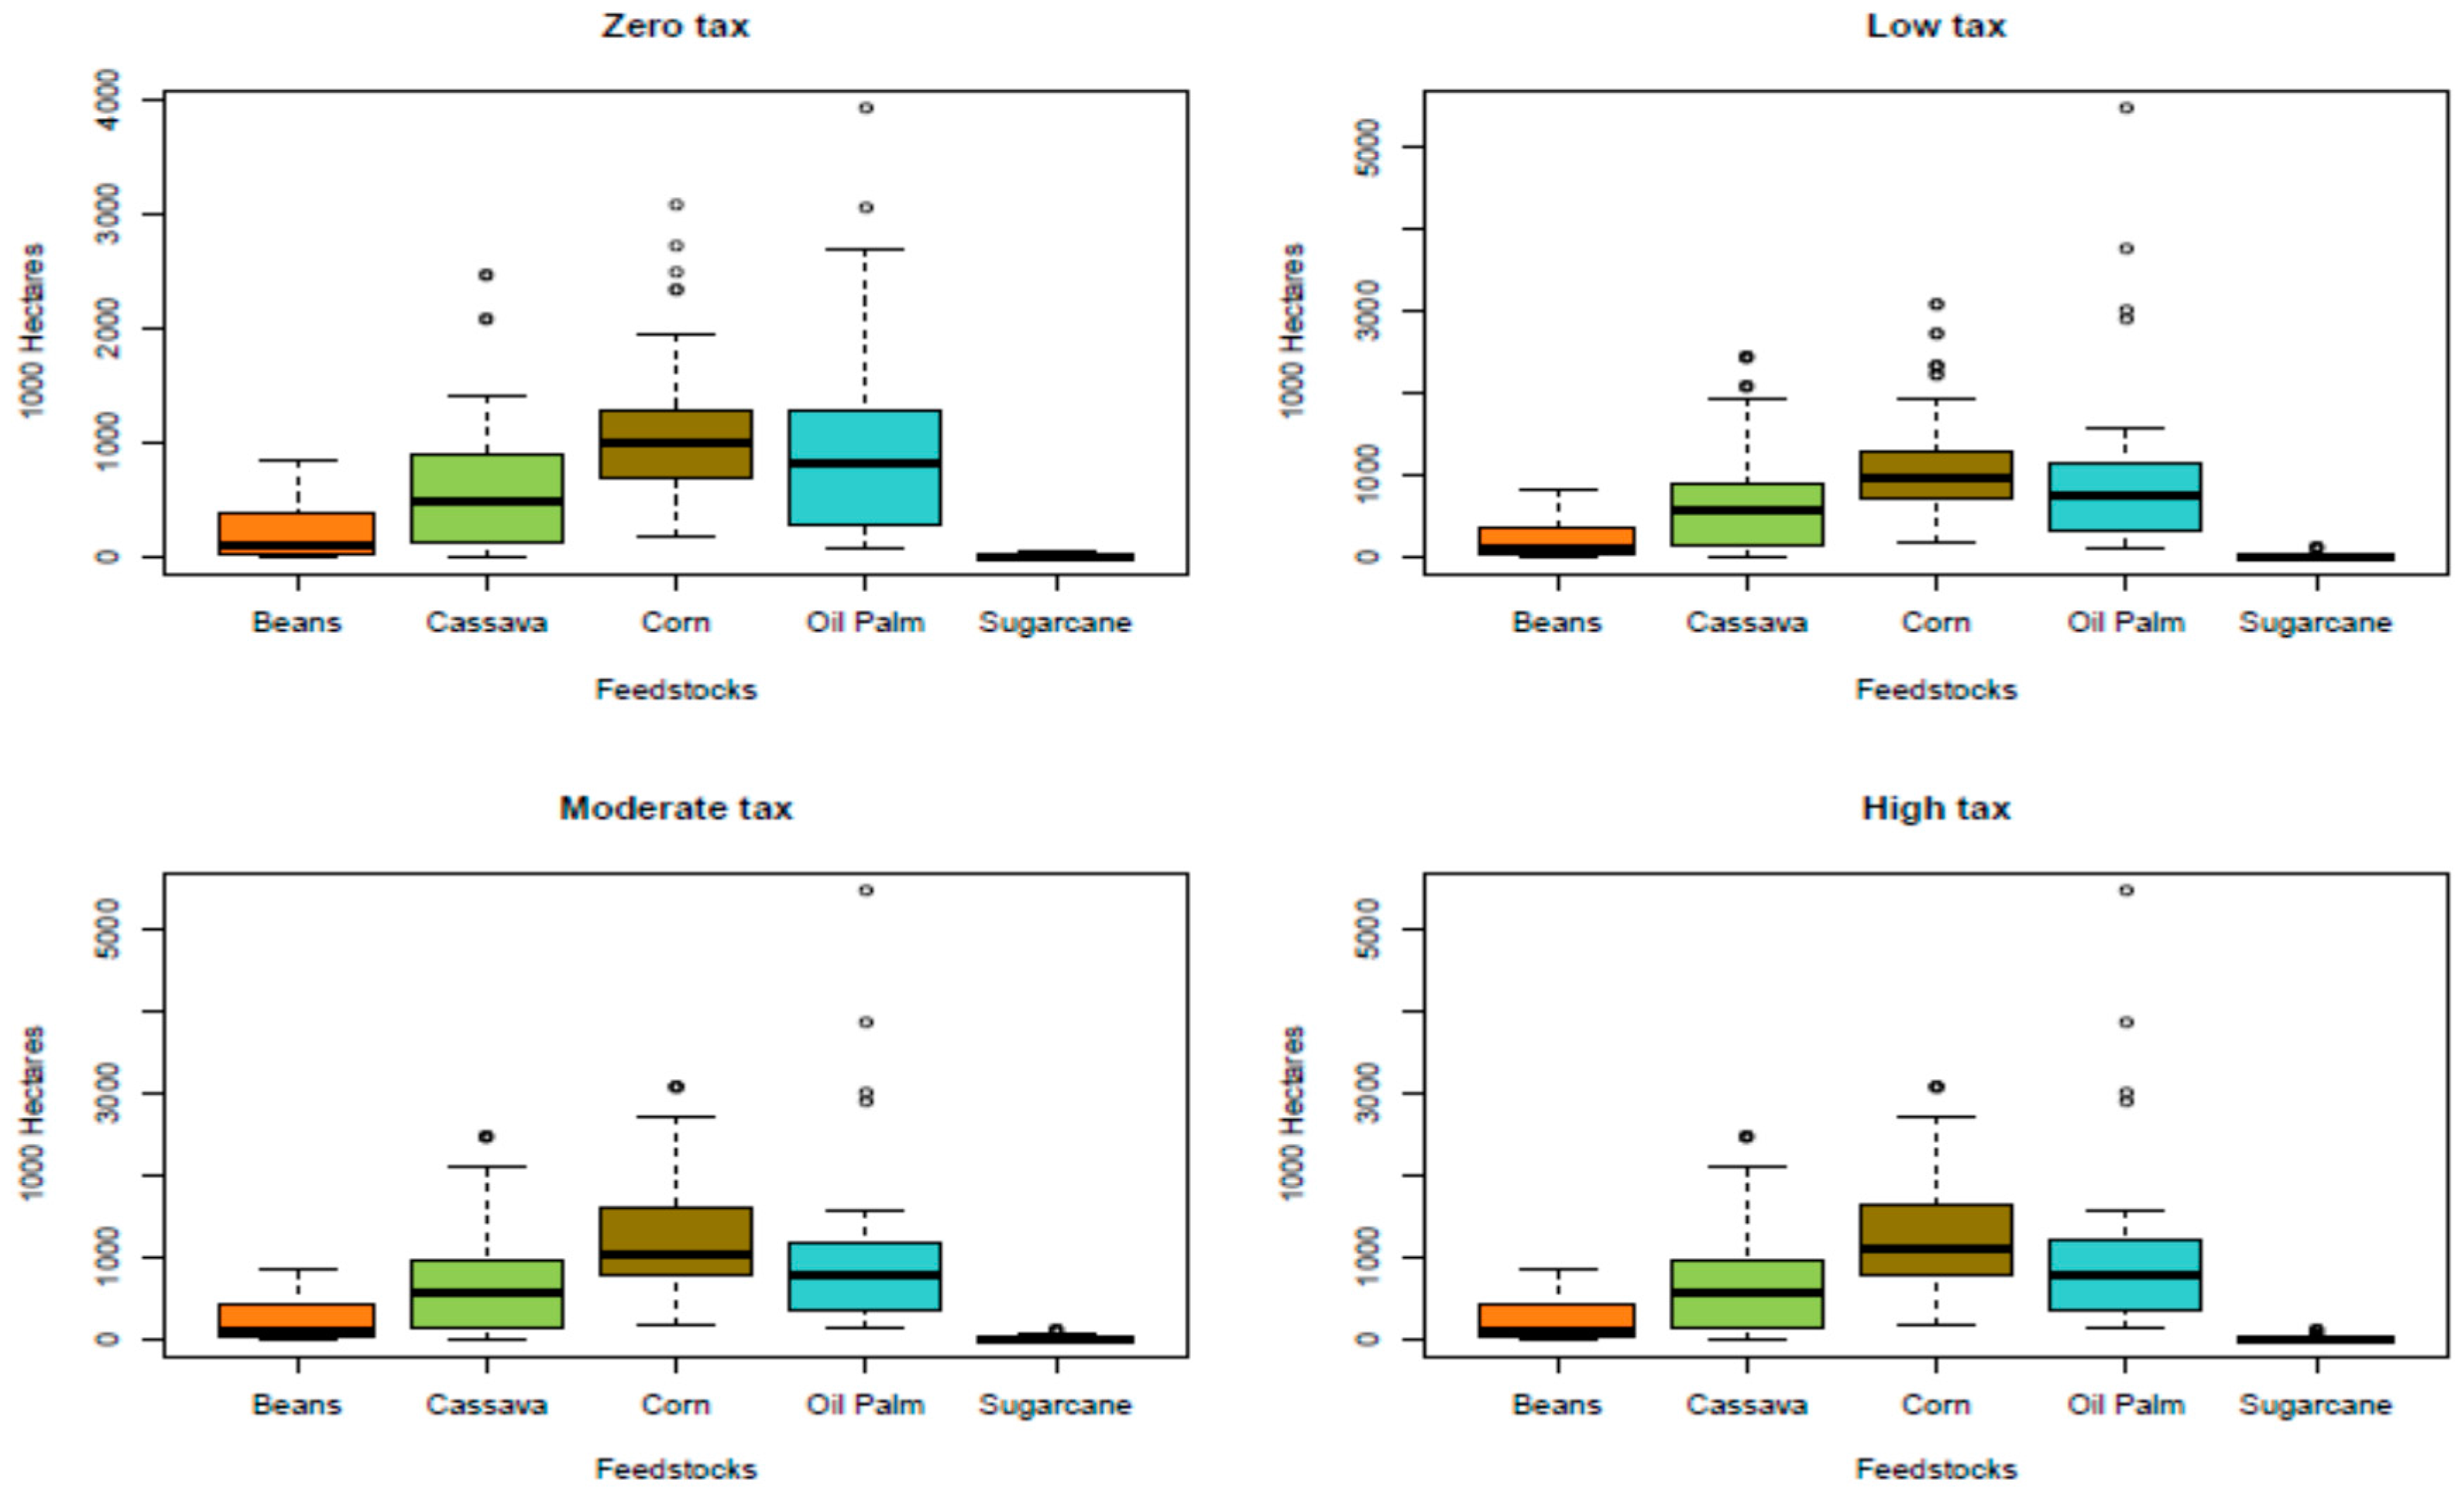
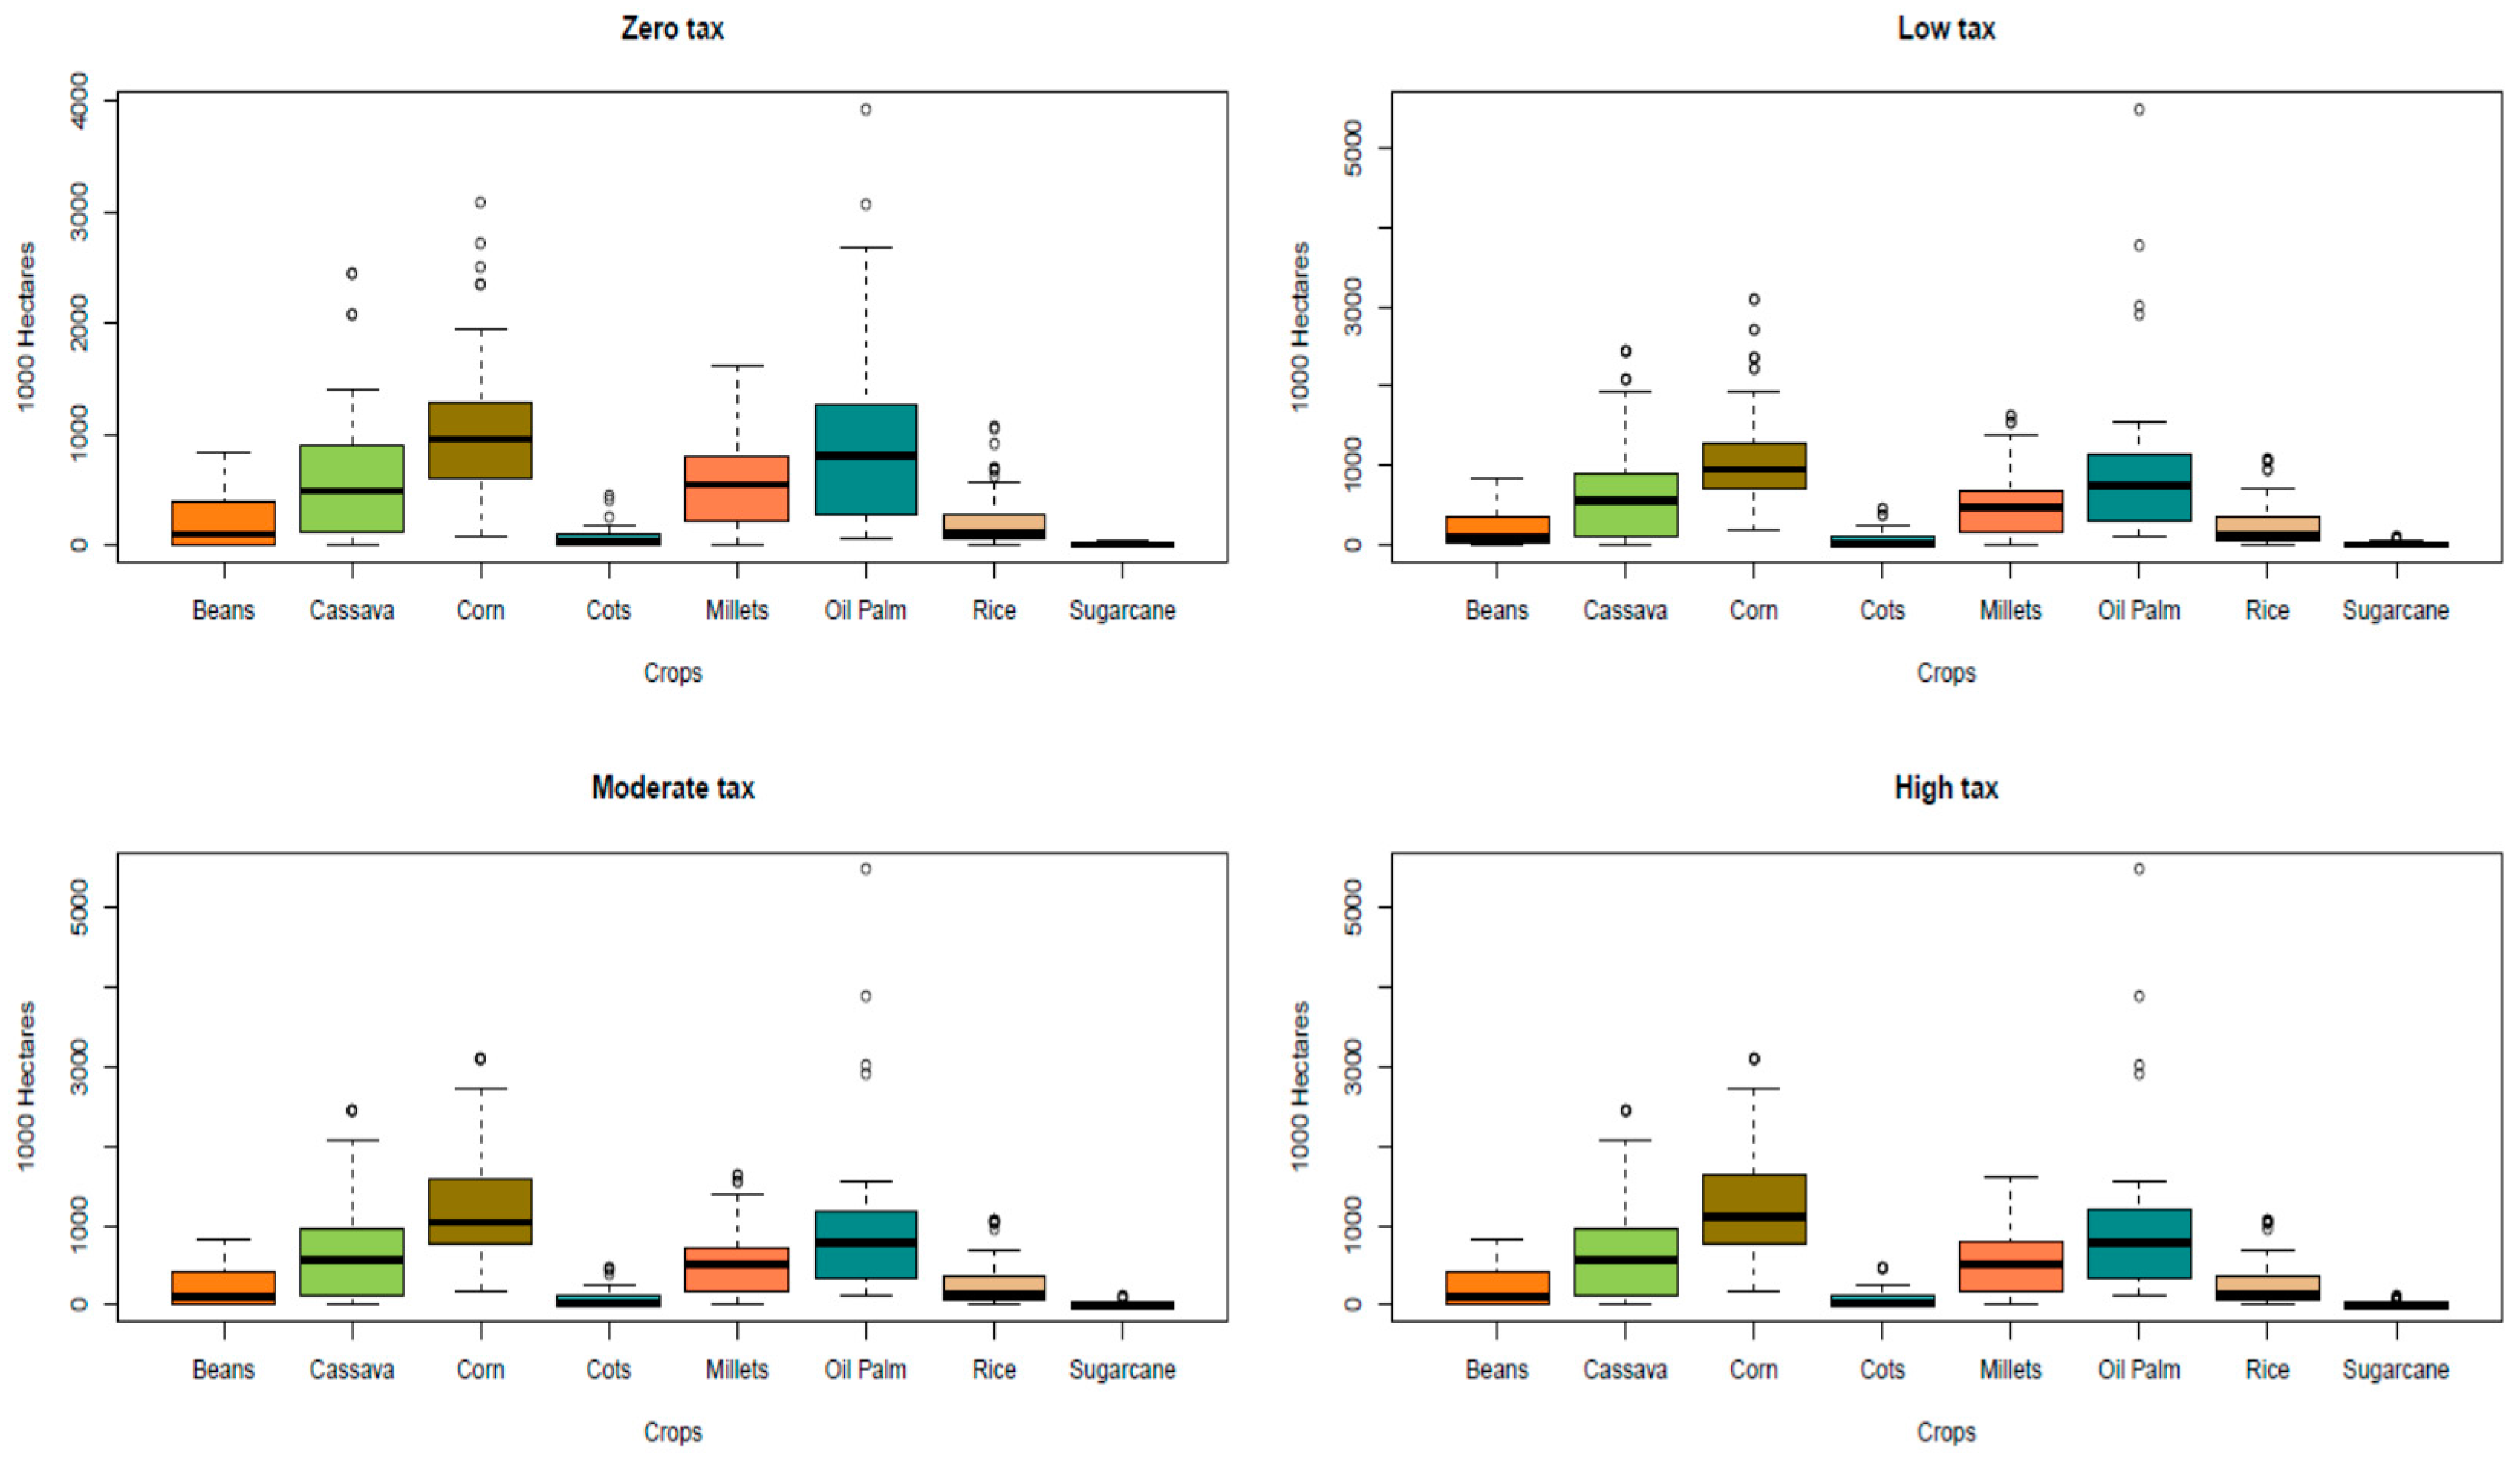
3.1. Land-Use Change Implications of Bioenergy Policy in Nigeria

The relative area for bioenergy feedstocks becomes evenly distributed when the carbon tax is implemented (Figure 2 and Figure 3). The oil palm area is slightly larger with a low and high tax scenario when there is subsidy action (Figure 2 and Figure 3). The percentage change in land-use area by 2050 compared to the base year of our model run shows that all the grassland area will be converted to cropland across all model scenarios after the first model horizon. In all the scenarios, the land-use change trajectory goes from cropland and grassland to forest within the first two decades and afterwards entirely from forest and grassland to cropland by 2050. The introduction of carbon tax shrinks the total area of oil palm (Figure 2 and Figure 3). About 4.94% of the forest area will remain forest under zero carbon taxation and carbon price of $40/ton. When carbon tax above $40/ton is implemented, however, all the area will be converted to cropland. Interestingly, the study found that carbon tax alone even with a relatively high conversion cost ($500/ha) of forest to another land-use type is not sufficient to retain the existing forest area in Nigeria. A sensitivity analysis revealed that Nigerian policymakers should place a much higher conversion cost for converting forest to other land-use types in order not to allow the conversion of the remaining forest area to cropland due to bioenergy policy action. This result suggests that farmers are rational decision makers. However, several caveats are worth commenting. For instance, land-use change restriction strategies, e.g., carbon pricing (market-based instrument) are not appropriate for ecosystem conservation in Nigeria. Our result is in agreement with that of [43], that market-based instruments can be controversial and may not signify the setting as a priority of nature conservation. We further argue that multiple policy actions should be put in place to enable the realization of the multiple objectives. If nature conservation takes precedence for policymakers, facilitation of effort to map protected areas should follow alongside the bioenergy mandates. Conservation instruments such as payment schemes and tradable land-use permits need to be implemented. The study result also demonstrates that policymakers will be required to make trade-offs between bioenergy production and nature conservation as the cost of carbon alone cannot offset the profitability of subsidized bioenergy. High-incentive payments like payment for ecosystem services (PES) and reduced transaction costs can improve the outcomes of forest conservation [44].
The argument behind this is that the physical process of sequestering carbon can take several years; the cost of carbon sequestration cannot be estimated without making assumptions (implicitly or explicitly) about its fate over time [45]. This creates a massive vacuum for uncertainty although we assume that the price of carbon remains constant in real time. The opportunity cost of converting land from its current use to one with higher carbon sequestration may not be profitable when comparing the rate of sequestration in the agricultural area that has been converted.
The study also finds that subsidy for the bioenergy industry in Nigeria does not mean that some feedstock will have comparative advantages over others. The share of the total area for oil palm in the baseline scenario will substantially become higher by 2050 compared with other feedstocks. But when the carbon tax is implemented the other feedstocks will come into play in the bioenergy feedstock mix as shown in Figure 2 and Figure 3. This is also replicated in the total agricultural crop area (see Figure 4 and Figure 5).

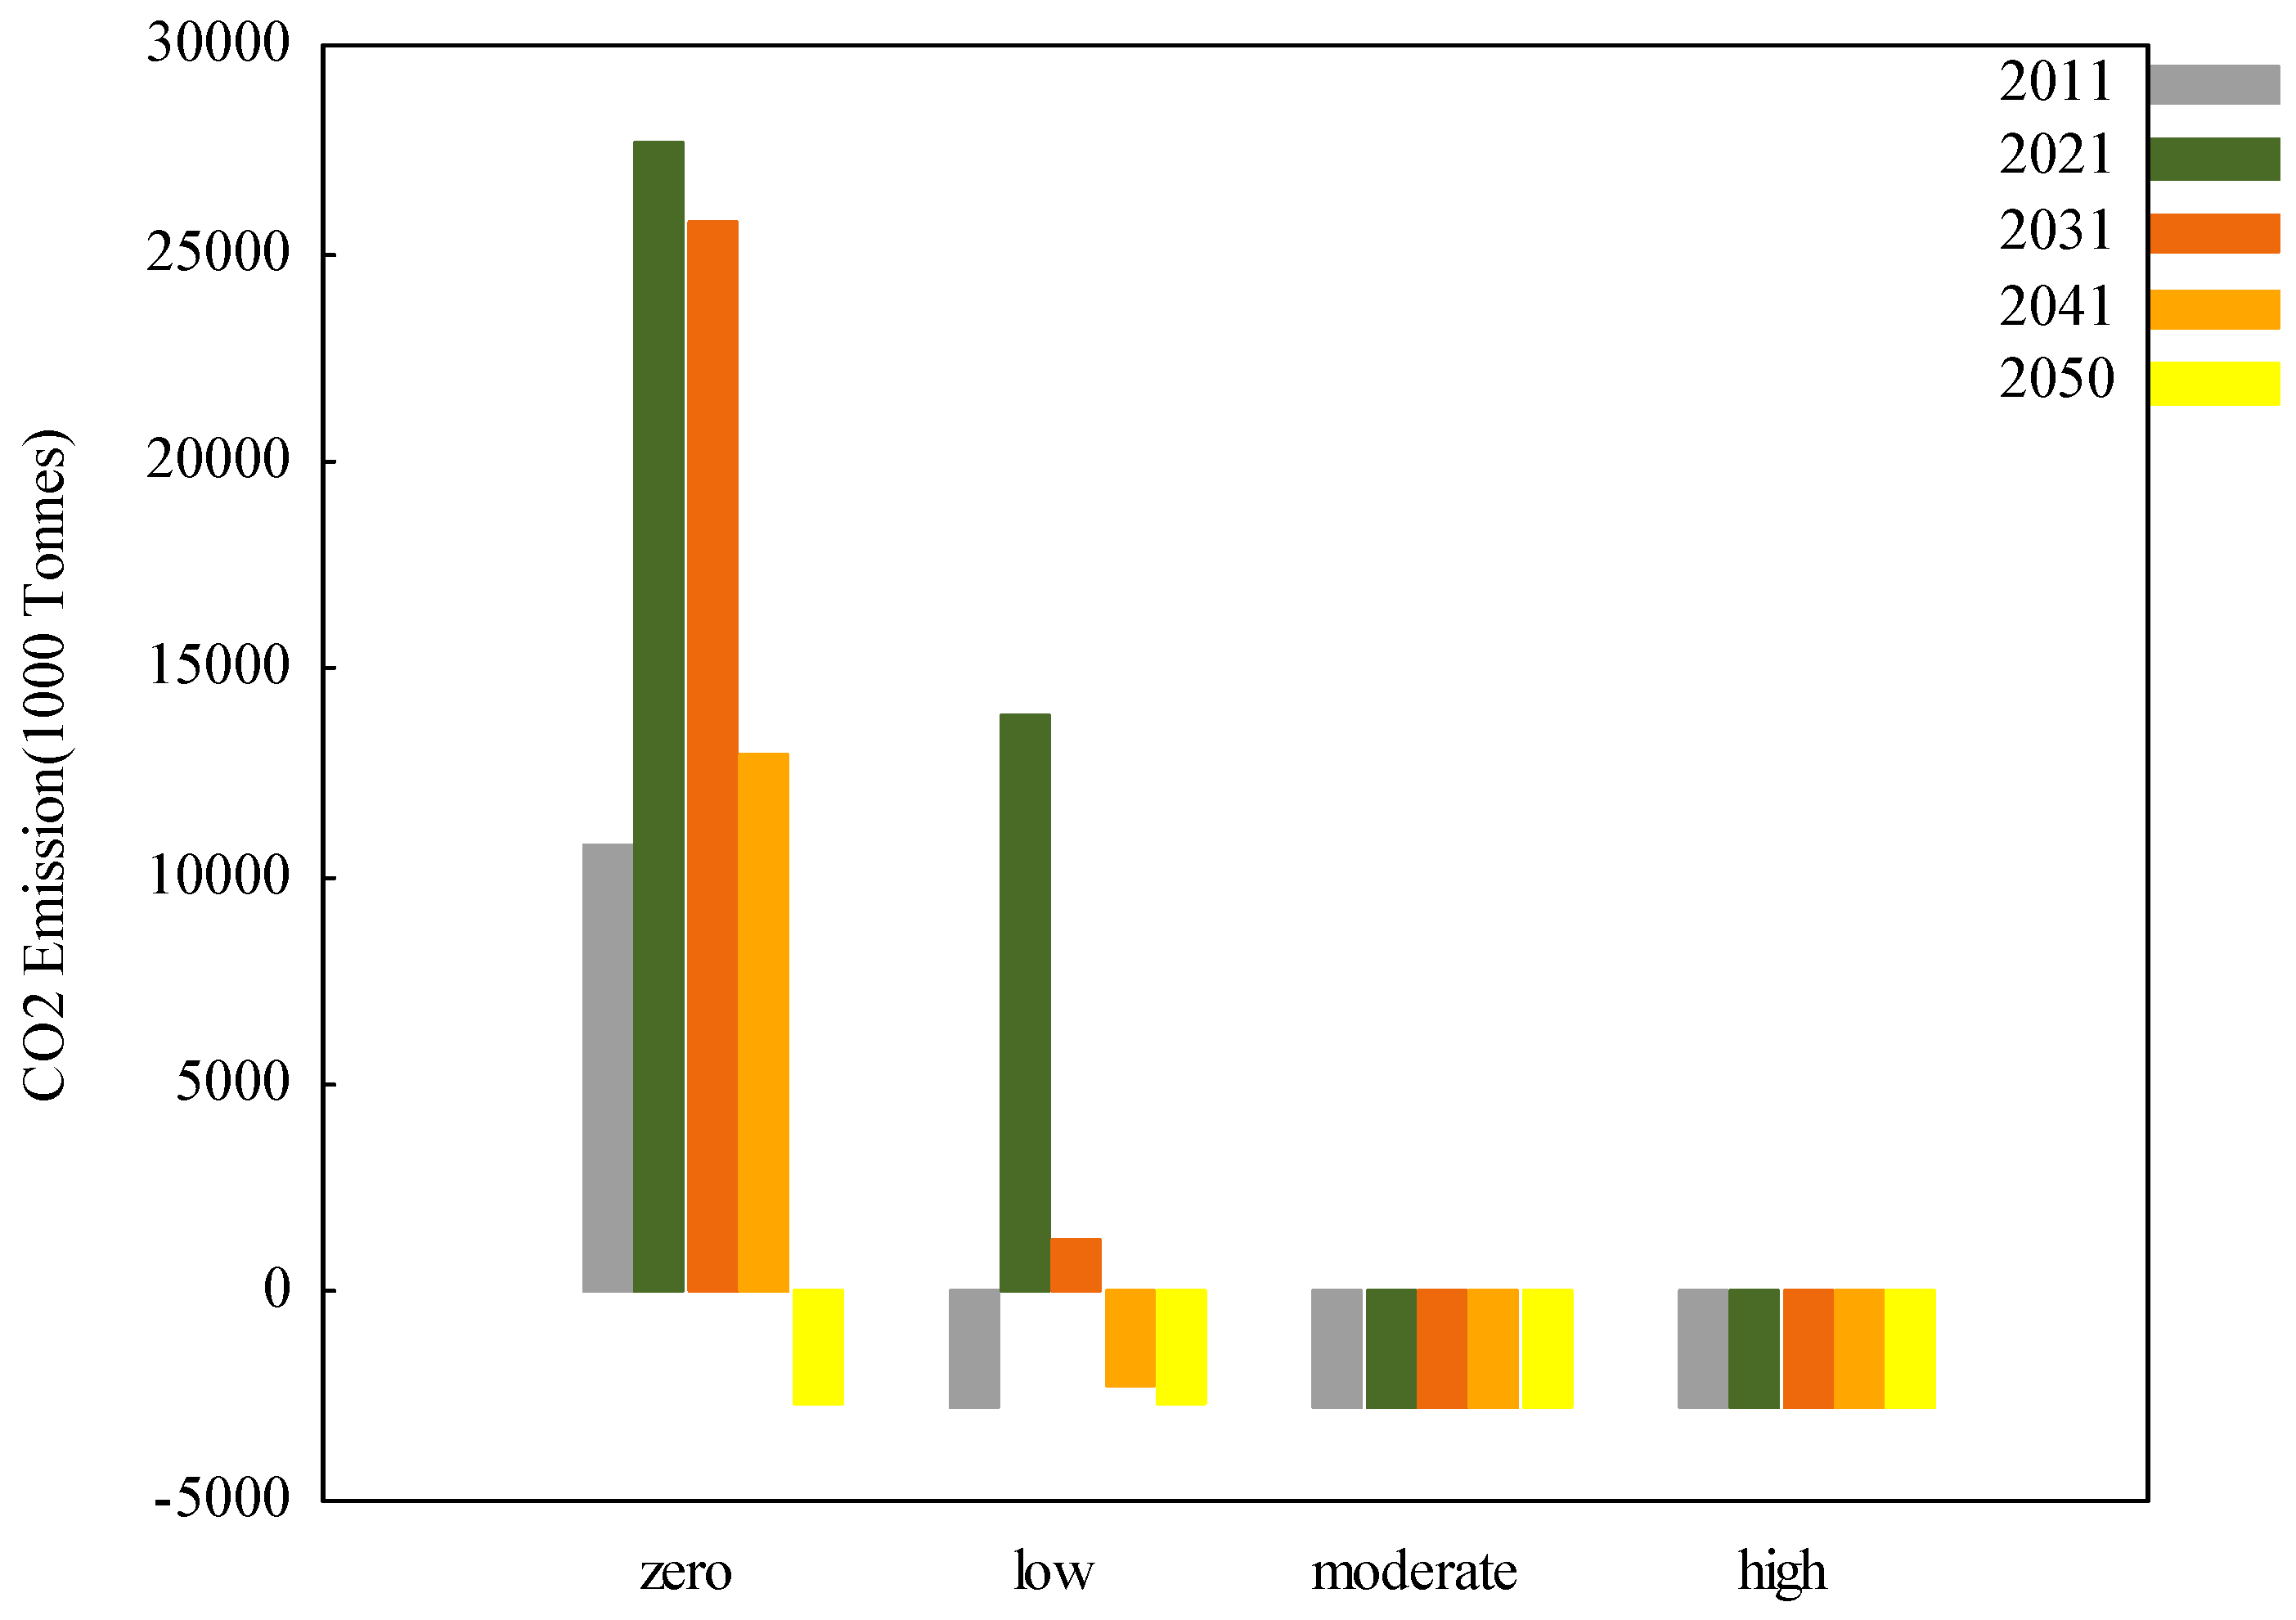
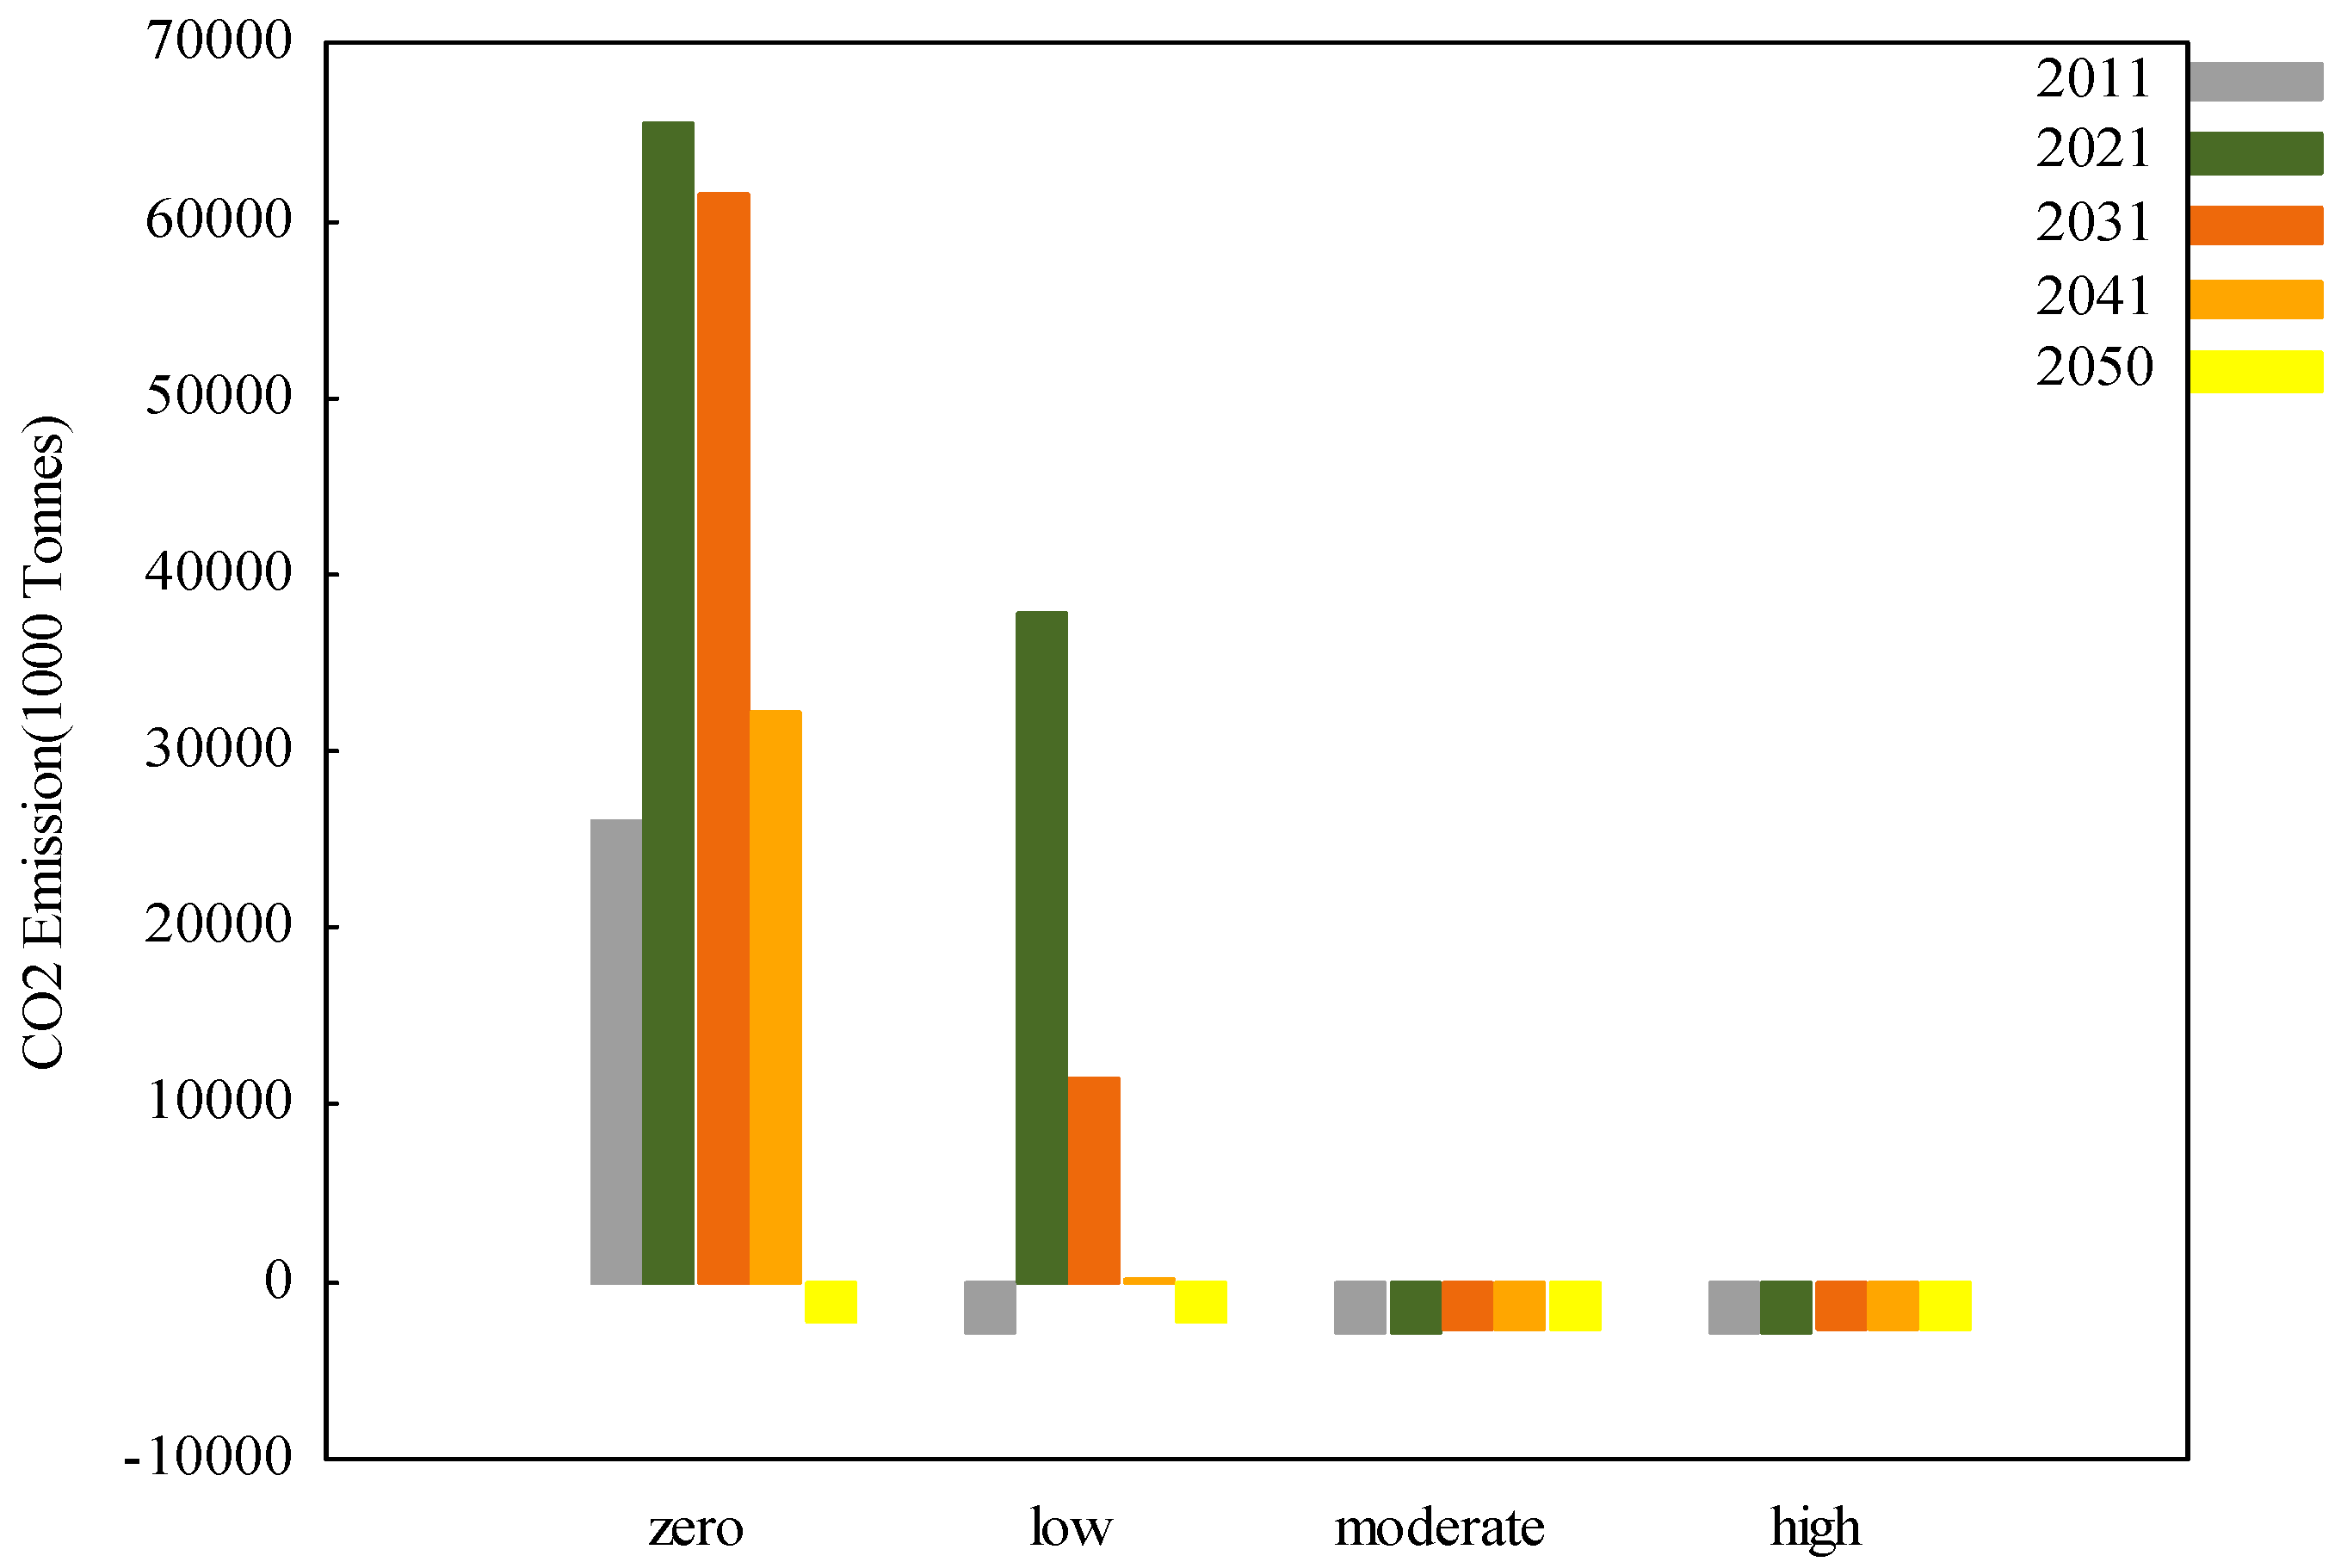
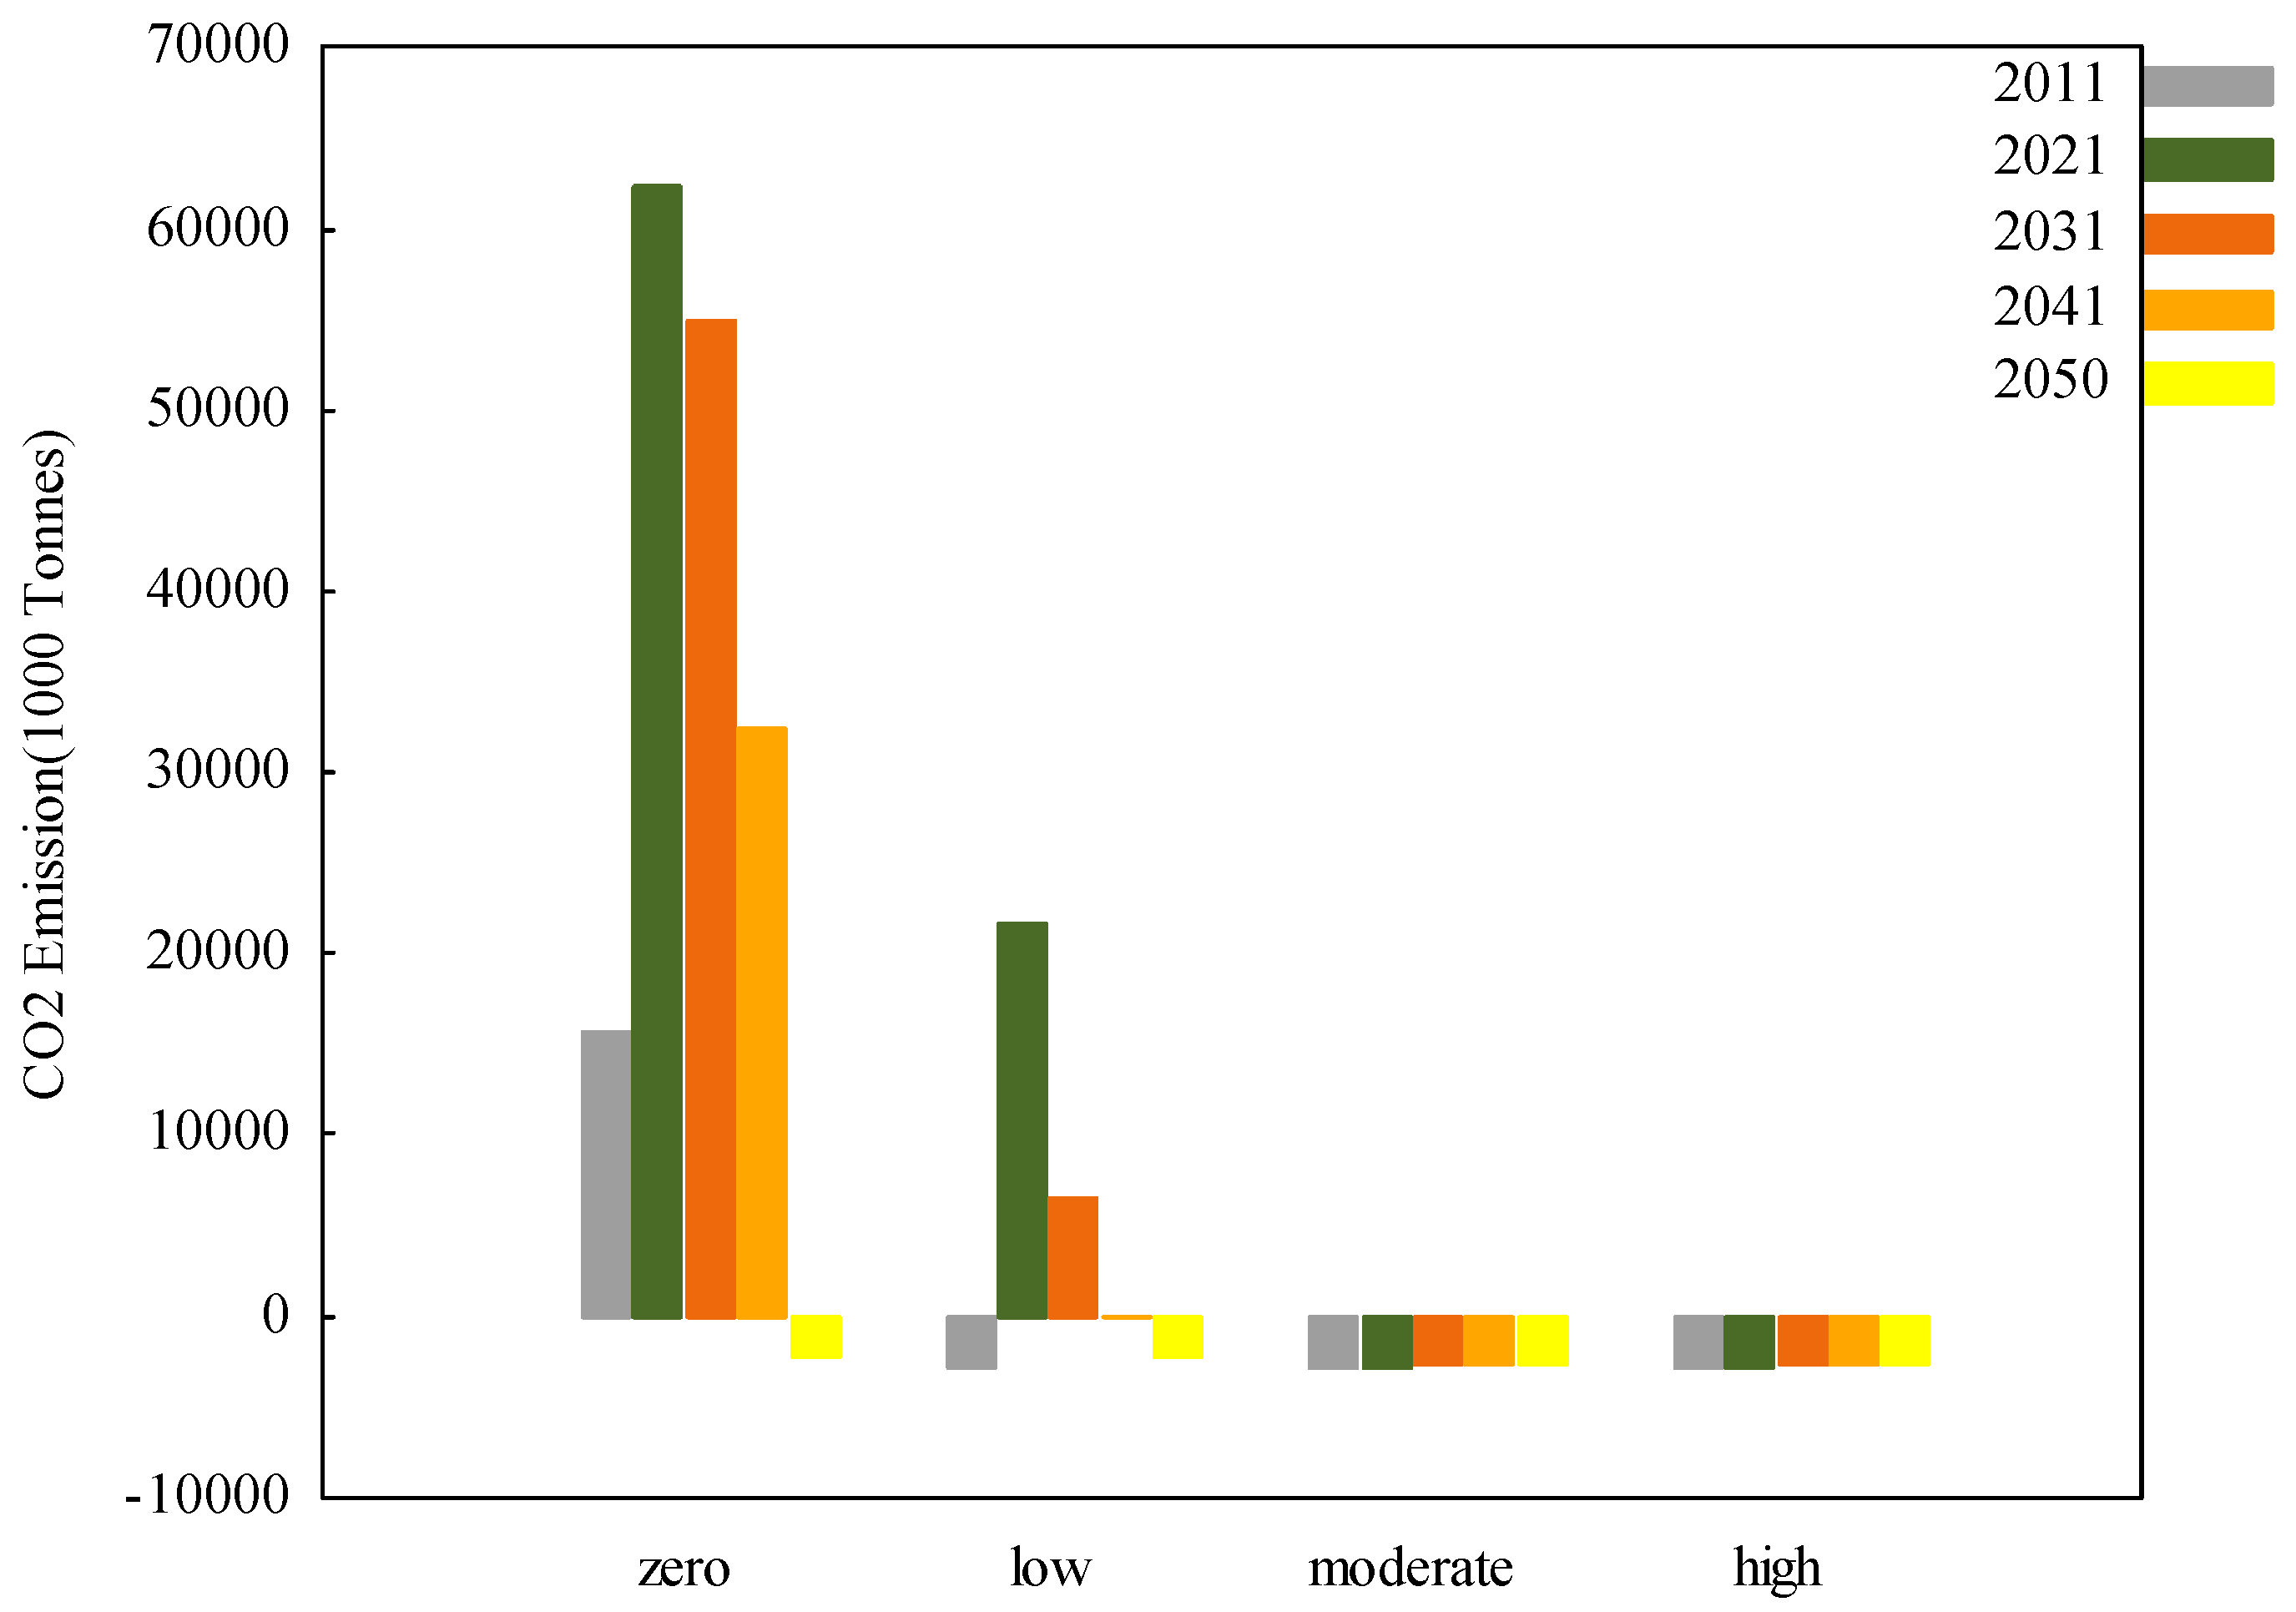
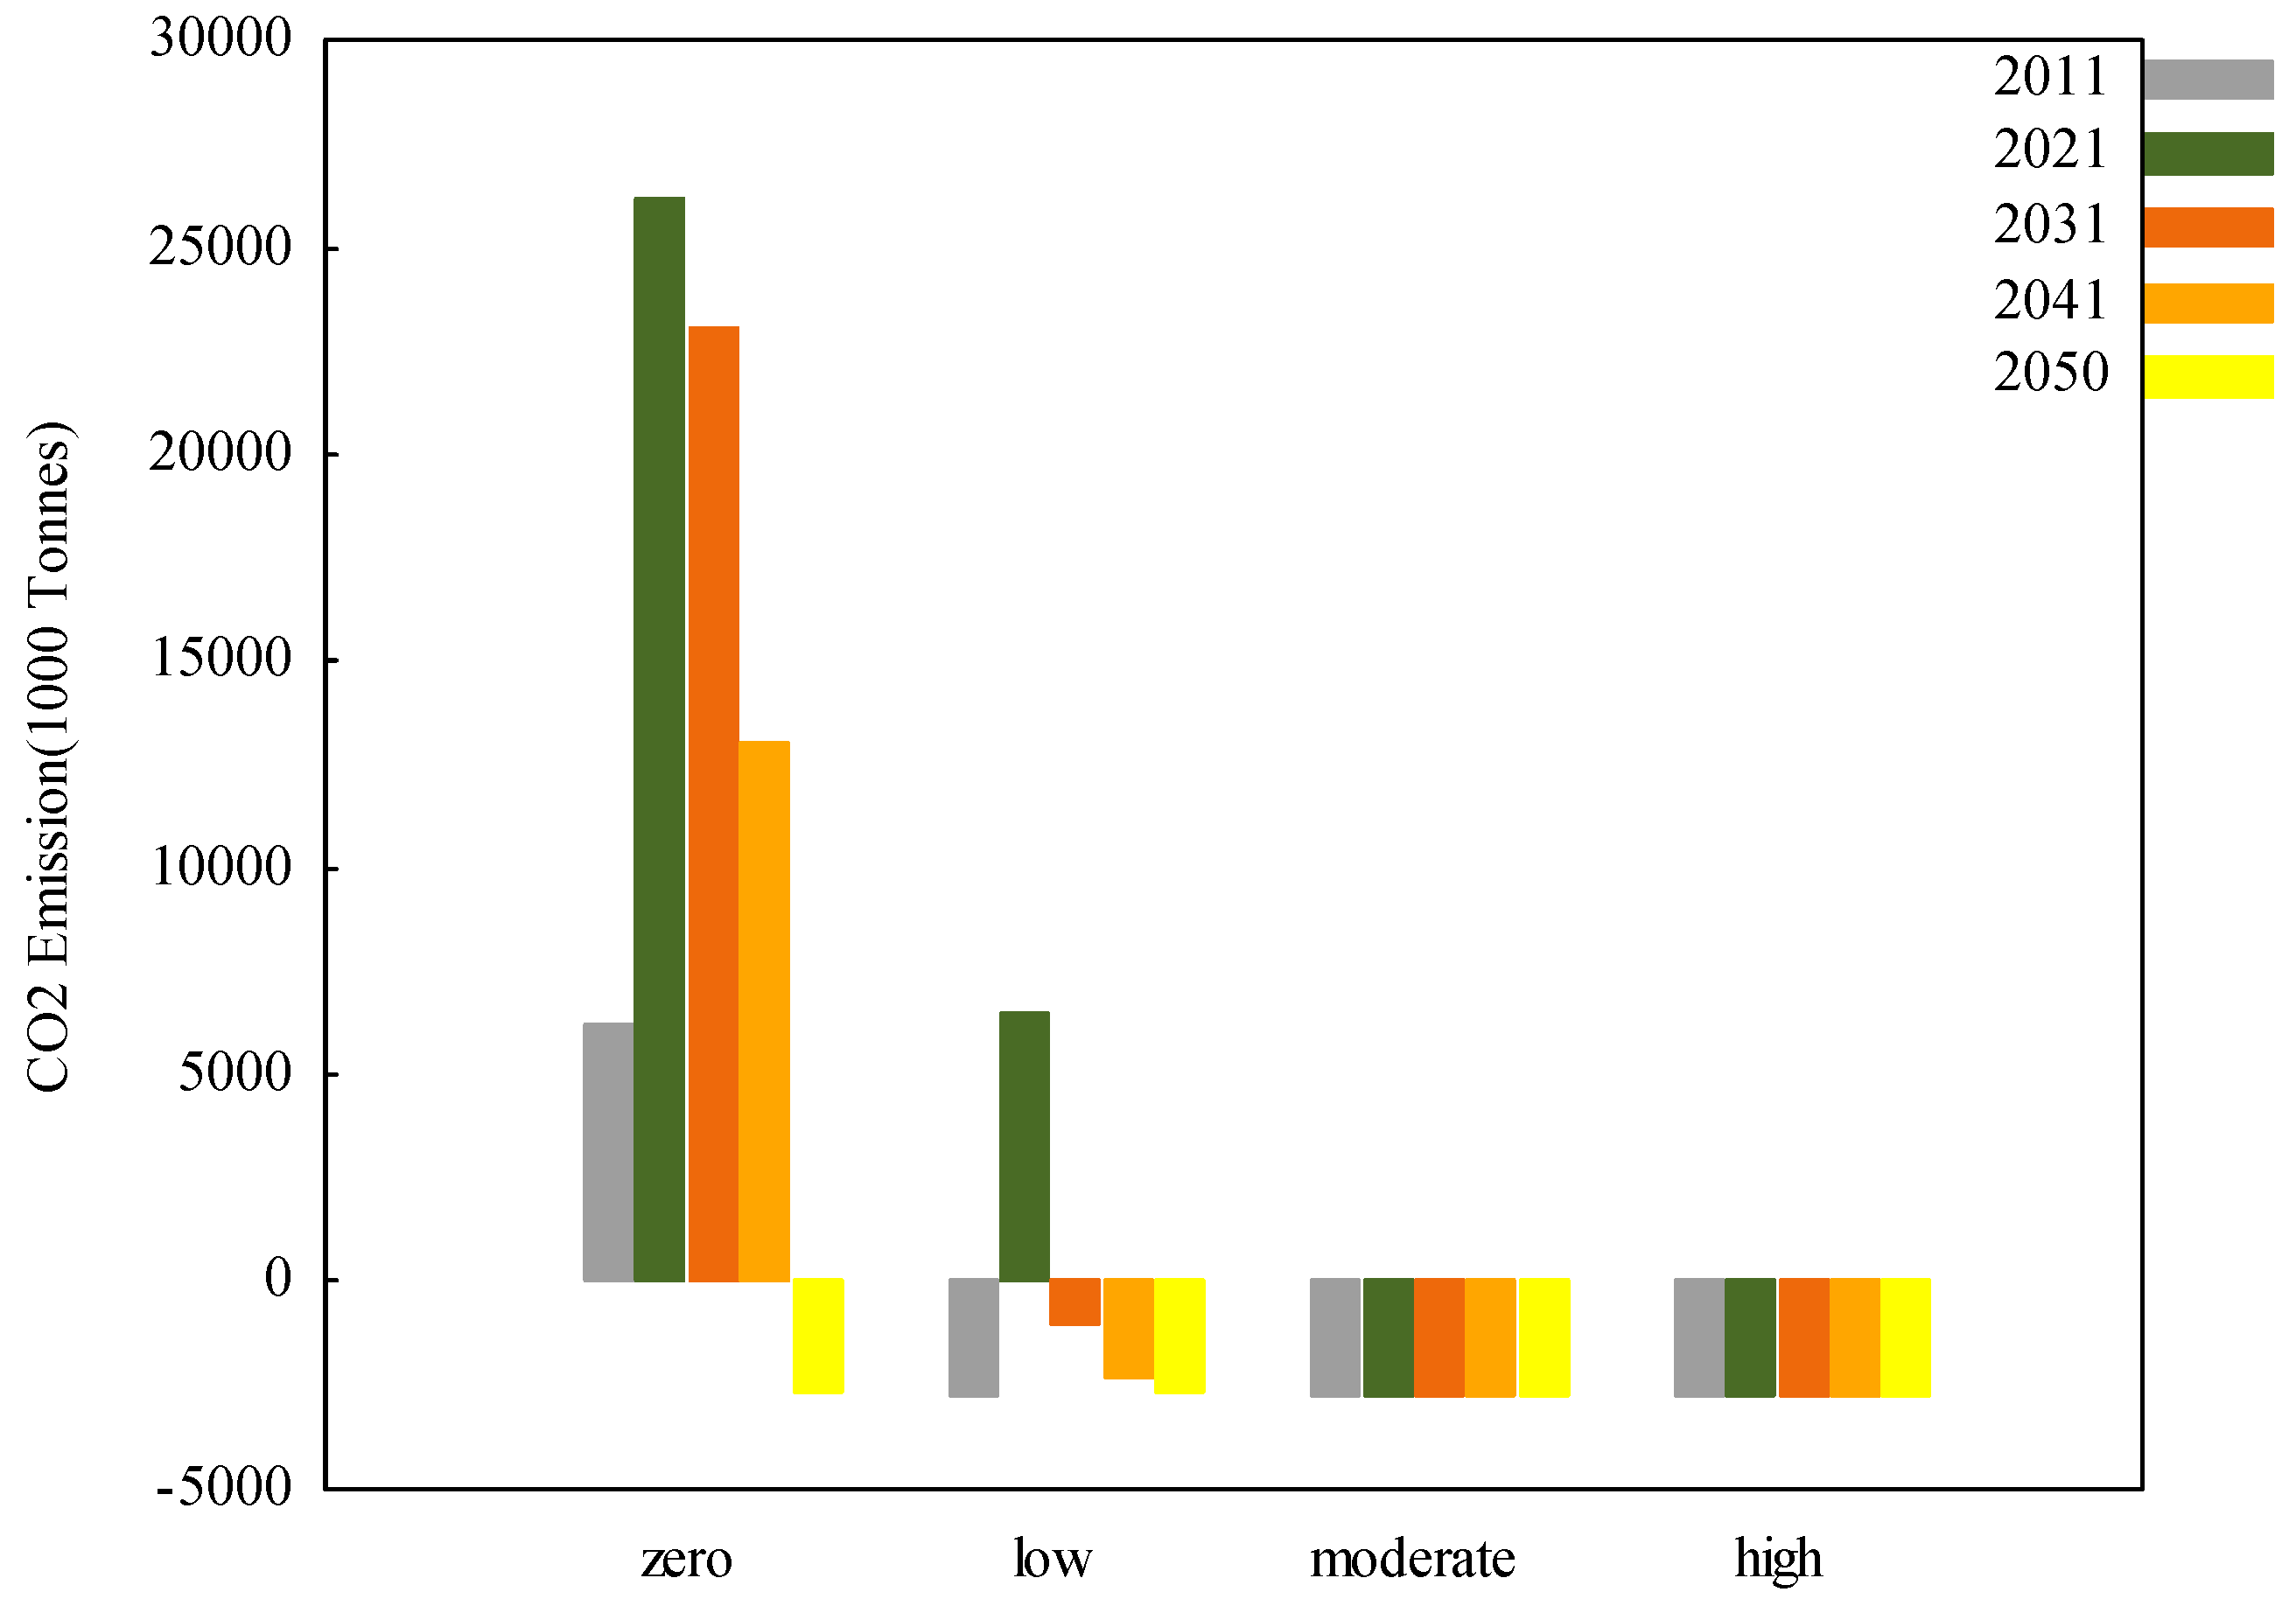
3.2. The Effect of Direct and Indirect Land-Use Change Greenhouse Gas Emissions (GHGs) as a Consequence of Bioenergy Policy Mix

Total potential GHG emissions of the bioenergy scenarios (no carbon tax, low carbon tax, moderate carbon tax, and high carbon tax) for both subsidy and no subsidy action (Figure 6 and Figure 7) indicate that the use of emission tax is an appropriate instrument for Nigeria if emission reduction is to be achieved when compared to the baseline scenario of zero-emission cost. Therefore, implementation of a carbon tax is essential for the slope of the land-use change emission supply function. Nevertheless, policies that could allow a win–win situation are needed. We further argue that policies should aim at subsidizing landowners for their below- and above-ground biomass because vegetation carbon transpiring in the first two-time horizons of our result is very likely. This might happen because there are no incentives to keep land-use areas such as grassland and shrubland. However, challenges such as the proper measurement of below-ground biomass are an open research area for scientists. The result of this study concurs with the consensus that carbon pricing will be a useful strategy for meeting the Paris Agreement [46].
As shown in Figure 8 and Figure 9, the indirect land-use change emissions reduction will only be feasible if a carbon price of a minimum of $80/ton is implemented. The calculation of LUC emissions is based on the assumptions from [8], that agricultural practices do not have an impact on soil carbon emissions, and deforestation is defined as the expansion of cropland into the forest, so the total carbon contained in above- and below-ground biomass is emitted. The study result shows that a substantial amount of emission could be saved by implementation of a carbon tax whether there is a subsidy on bioenergy production or not. However, another interesting point from this result is the break-even carbon price of $80/ton. The result shows that support for the bioenergy industry does not have any substantial effect on LUC emissions. NGA–FASOM is subject to limitation based on data availability.
One of these limitations includes the limited data on crop-management system areas in Nigeria. This deficiency leads to an improper representation of the crop-management system within the crop-mix equation where we restricted the crop area to mimic the crop area share of the observation.
On a sensitivity analysis, we find that a negative indirect land-use change GHG emission is achievable with the implementation of a carbon tax of $40/ton if, and only if, the Nigerian government places a land-use conversion cost of $10,000/ha with or without subsidy on the bioenergy industry.

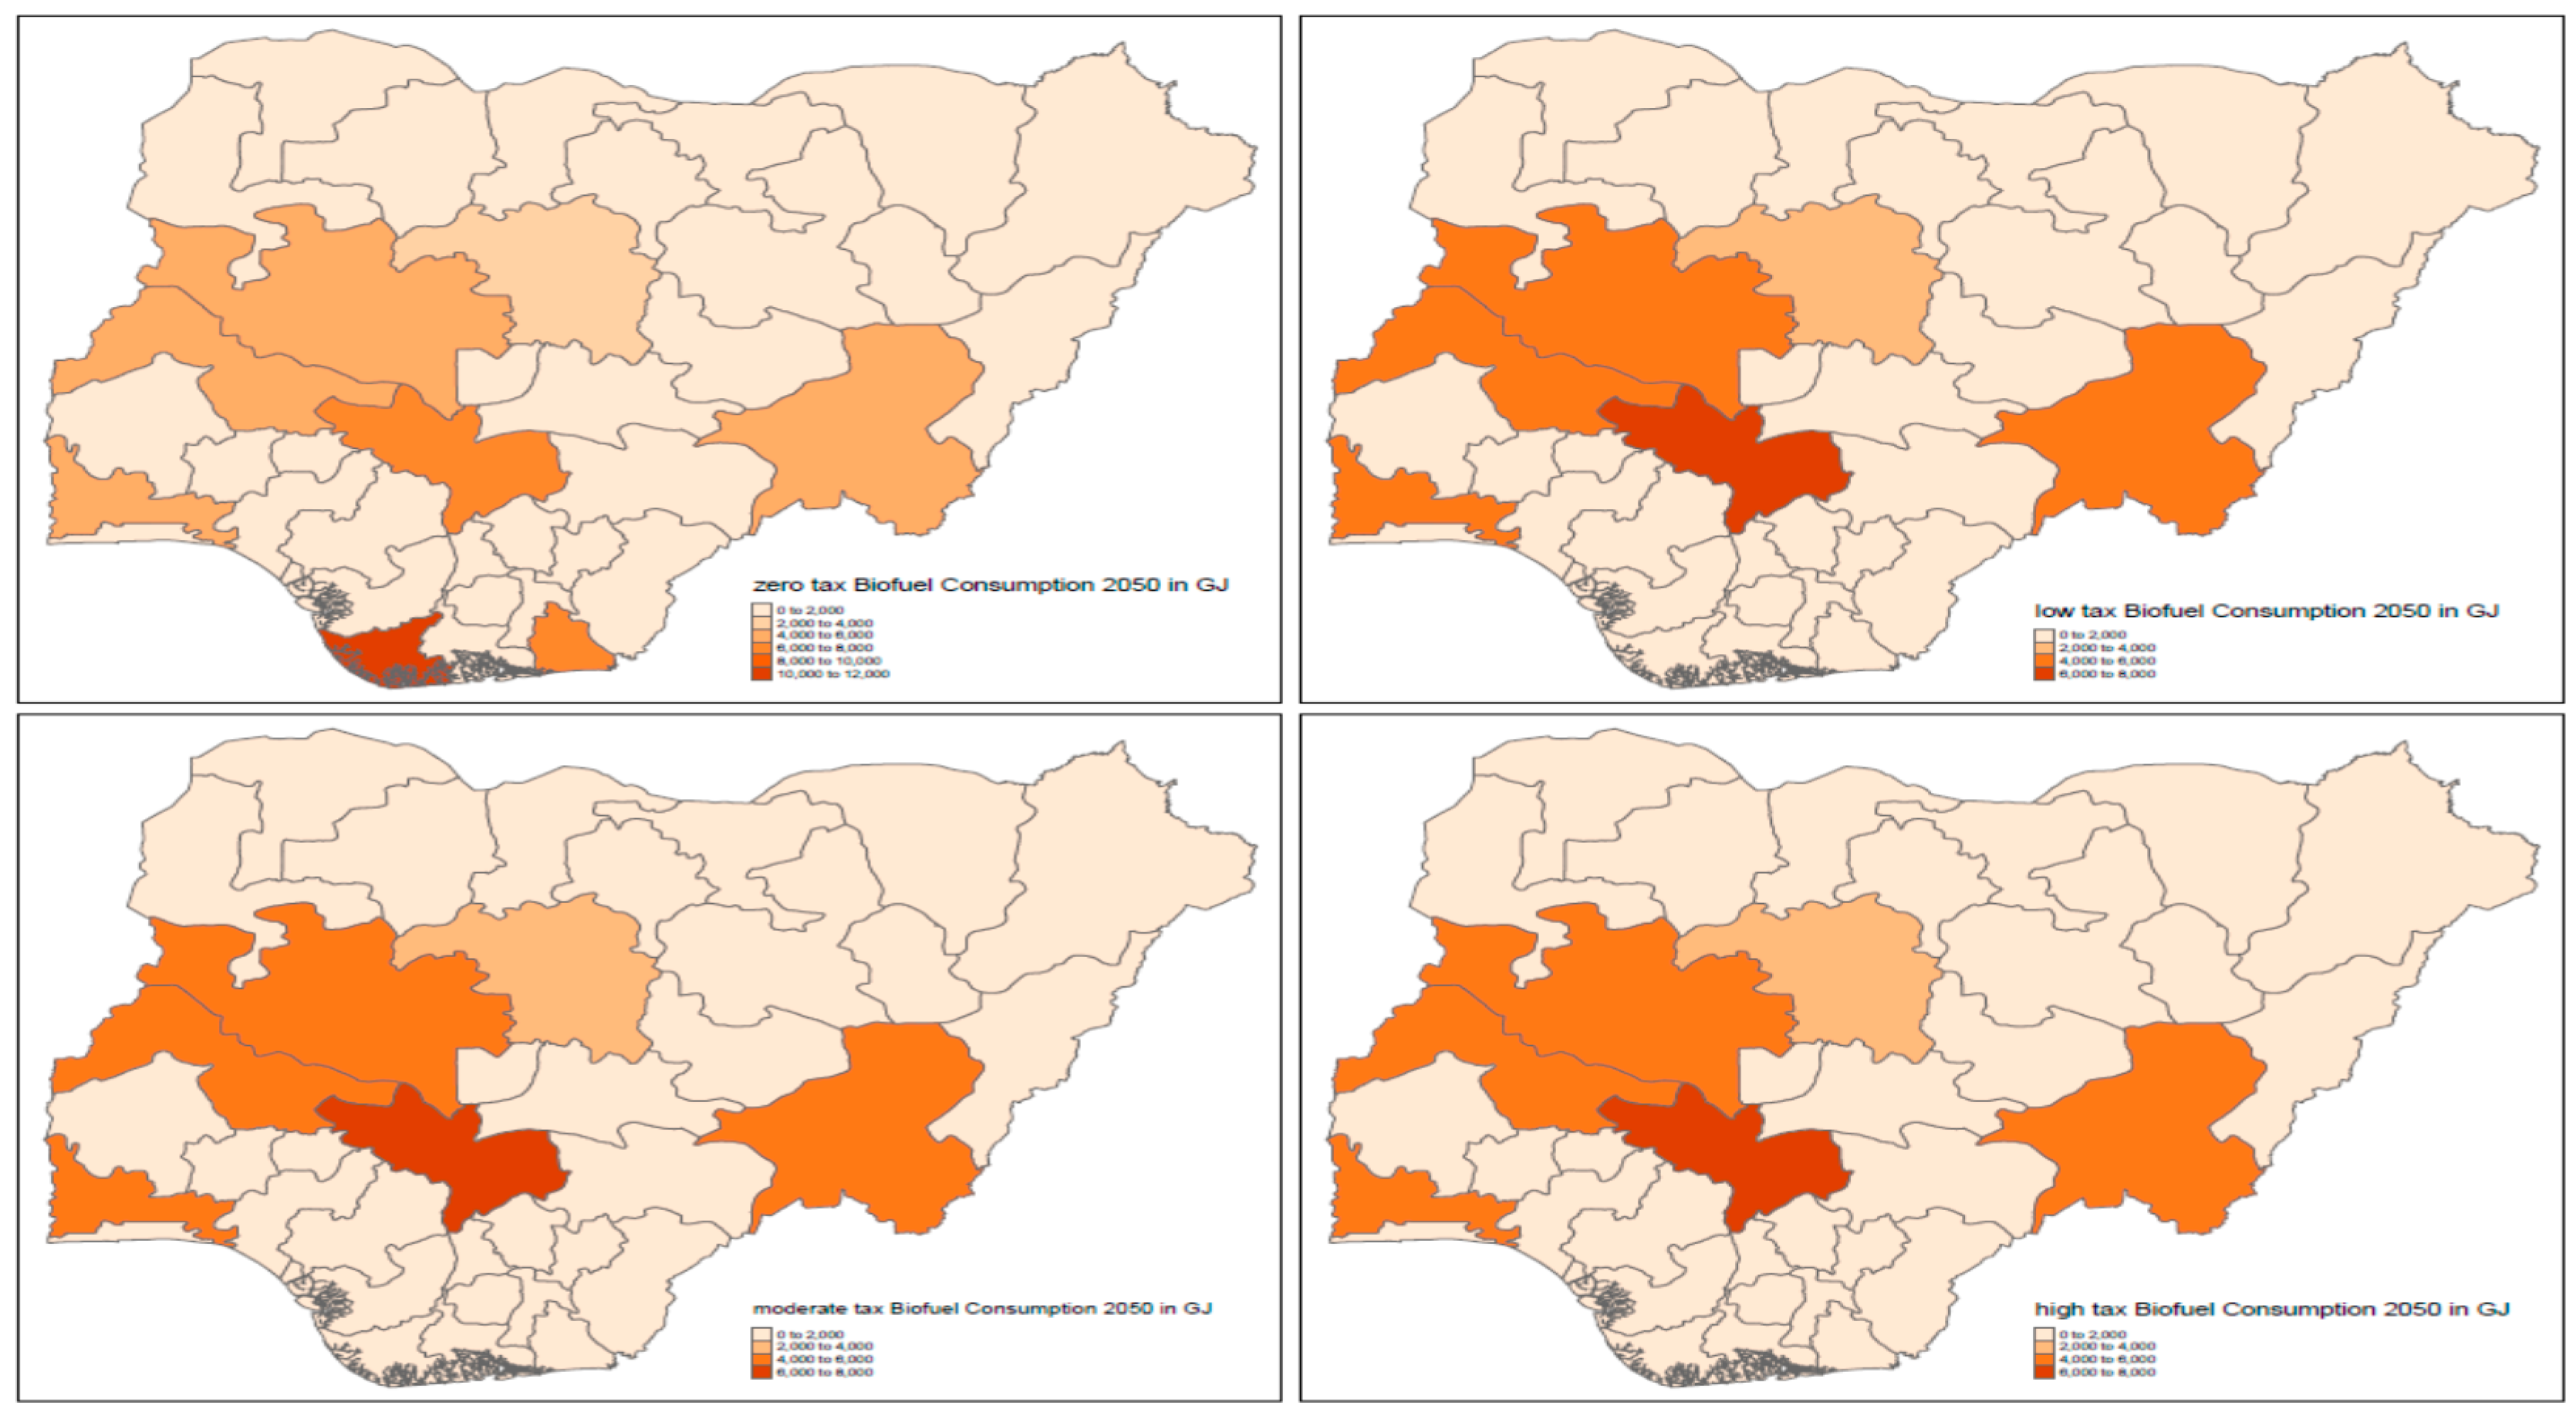
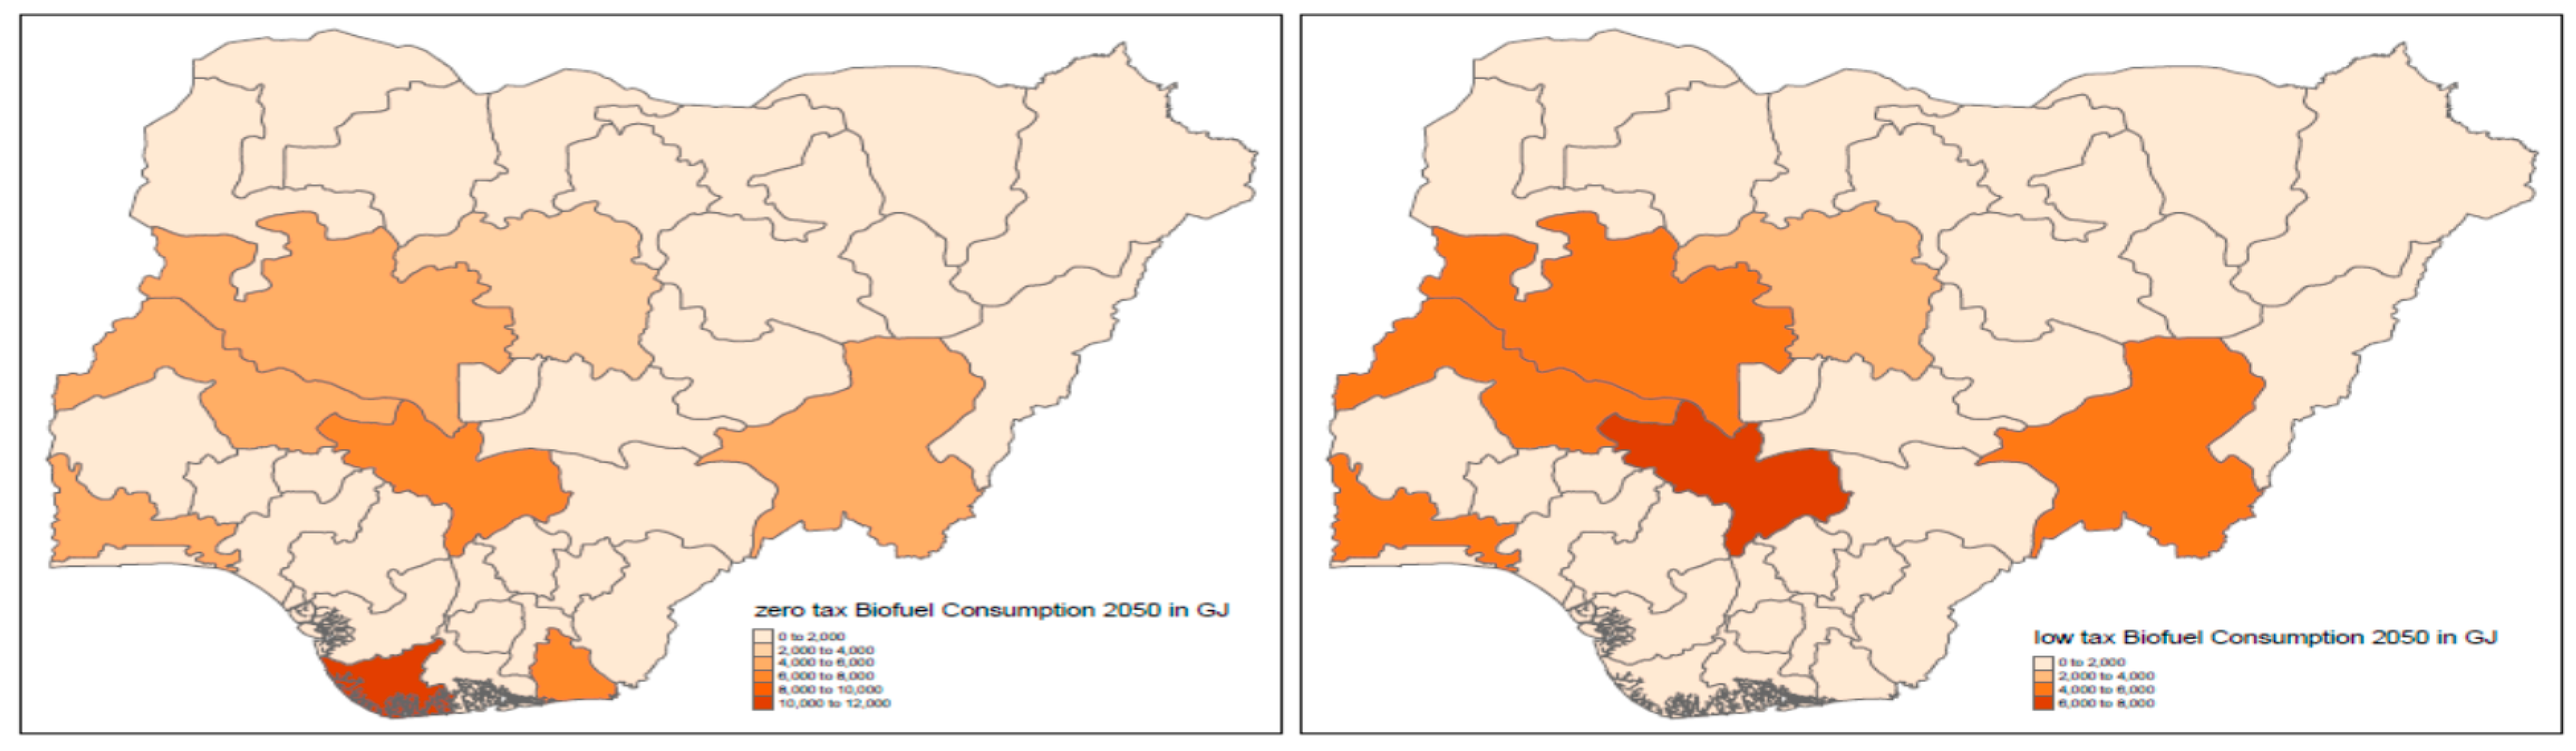
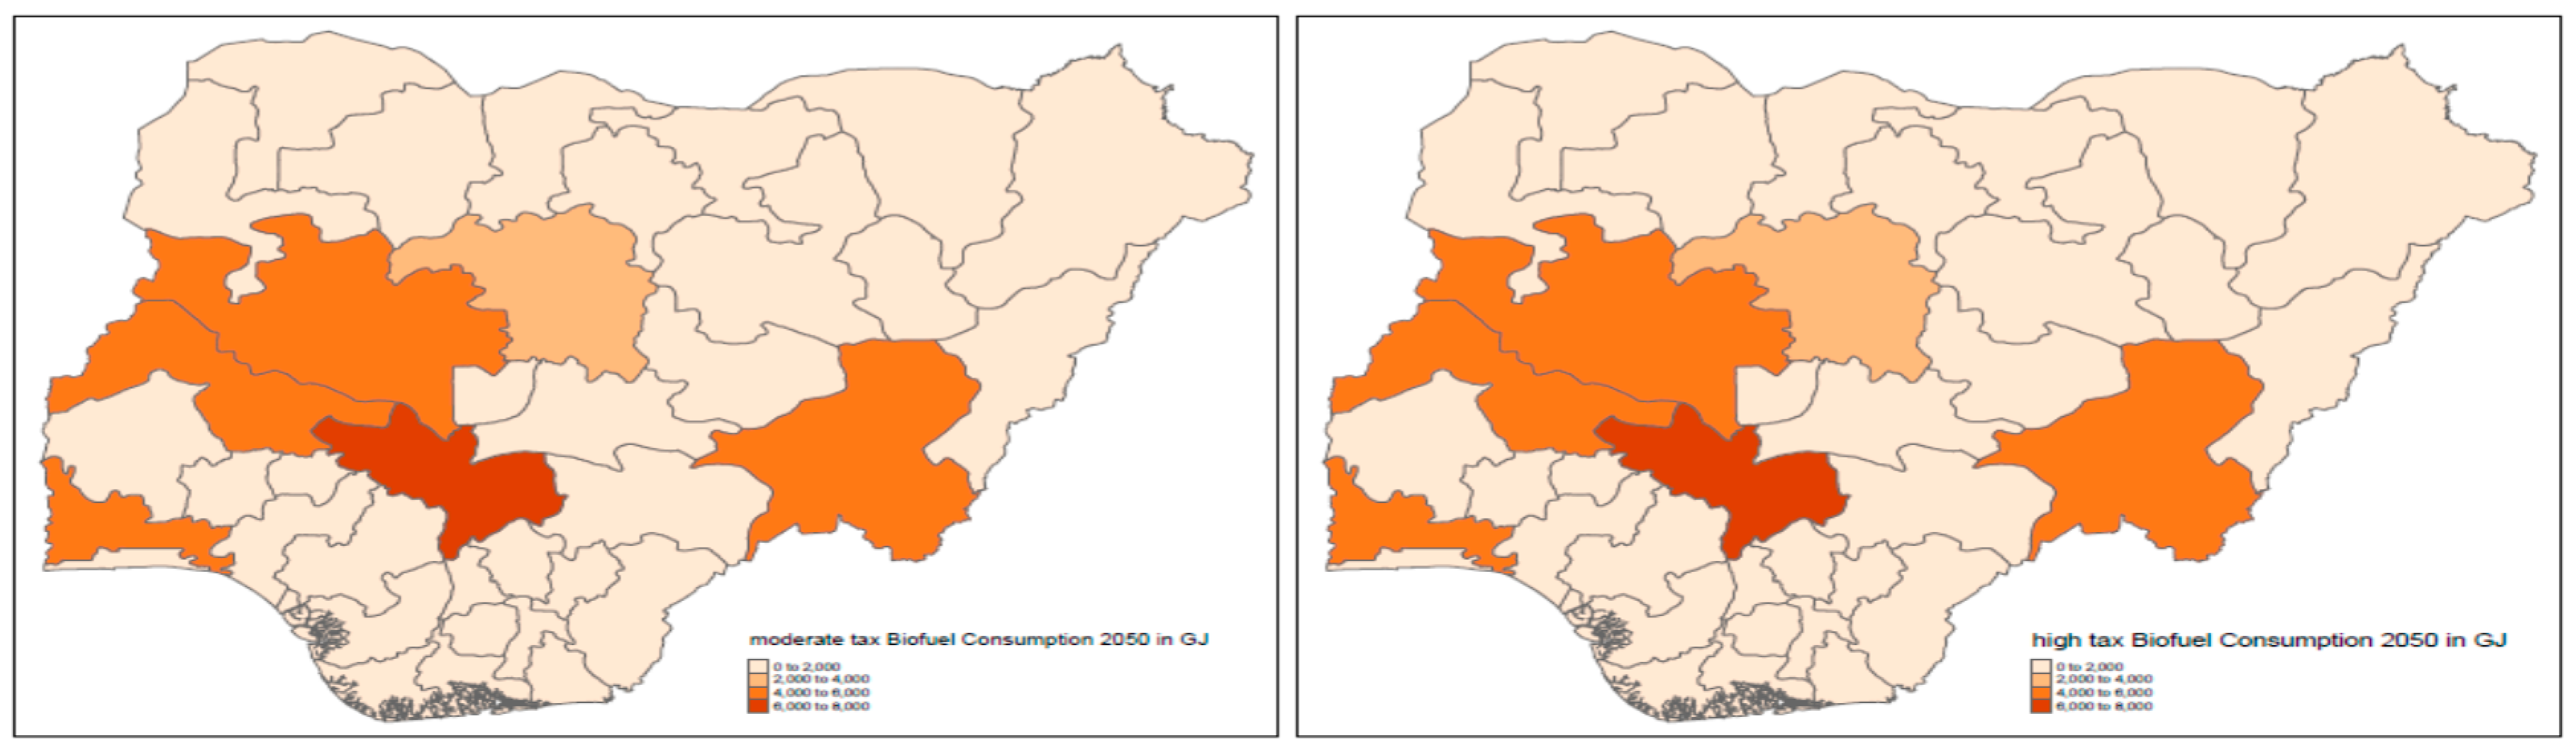
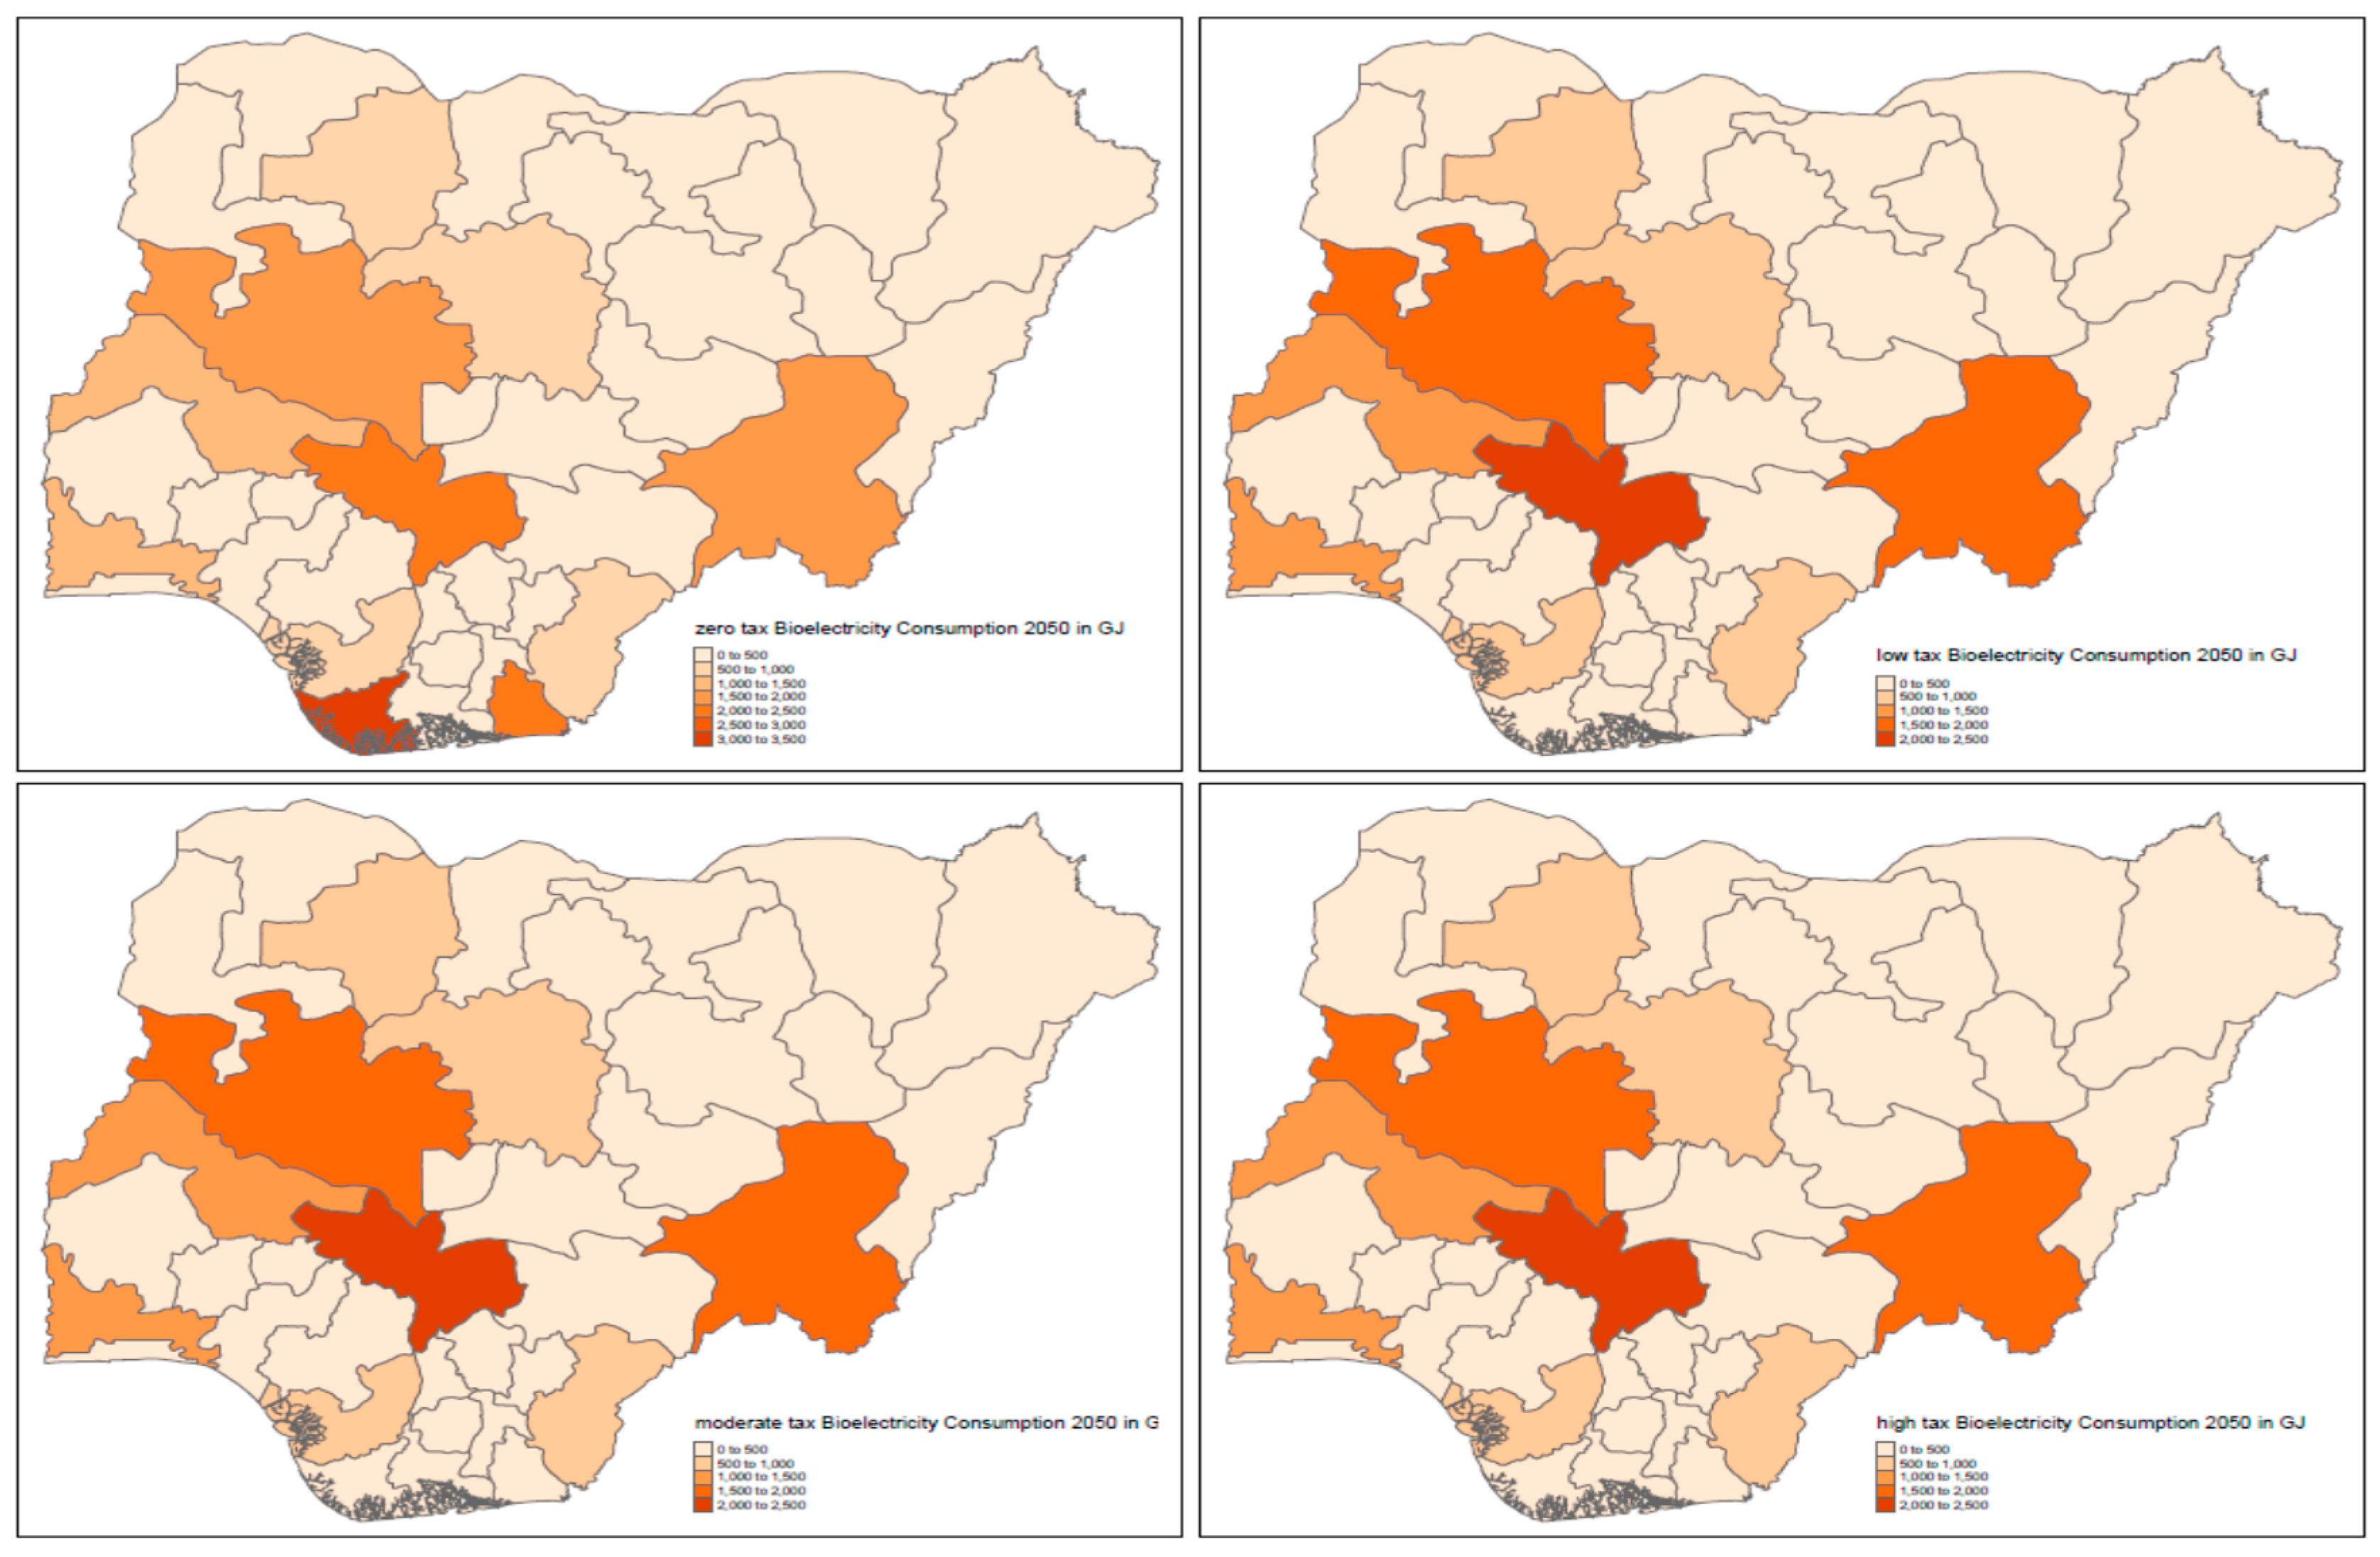
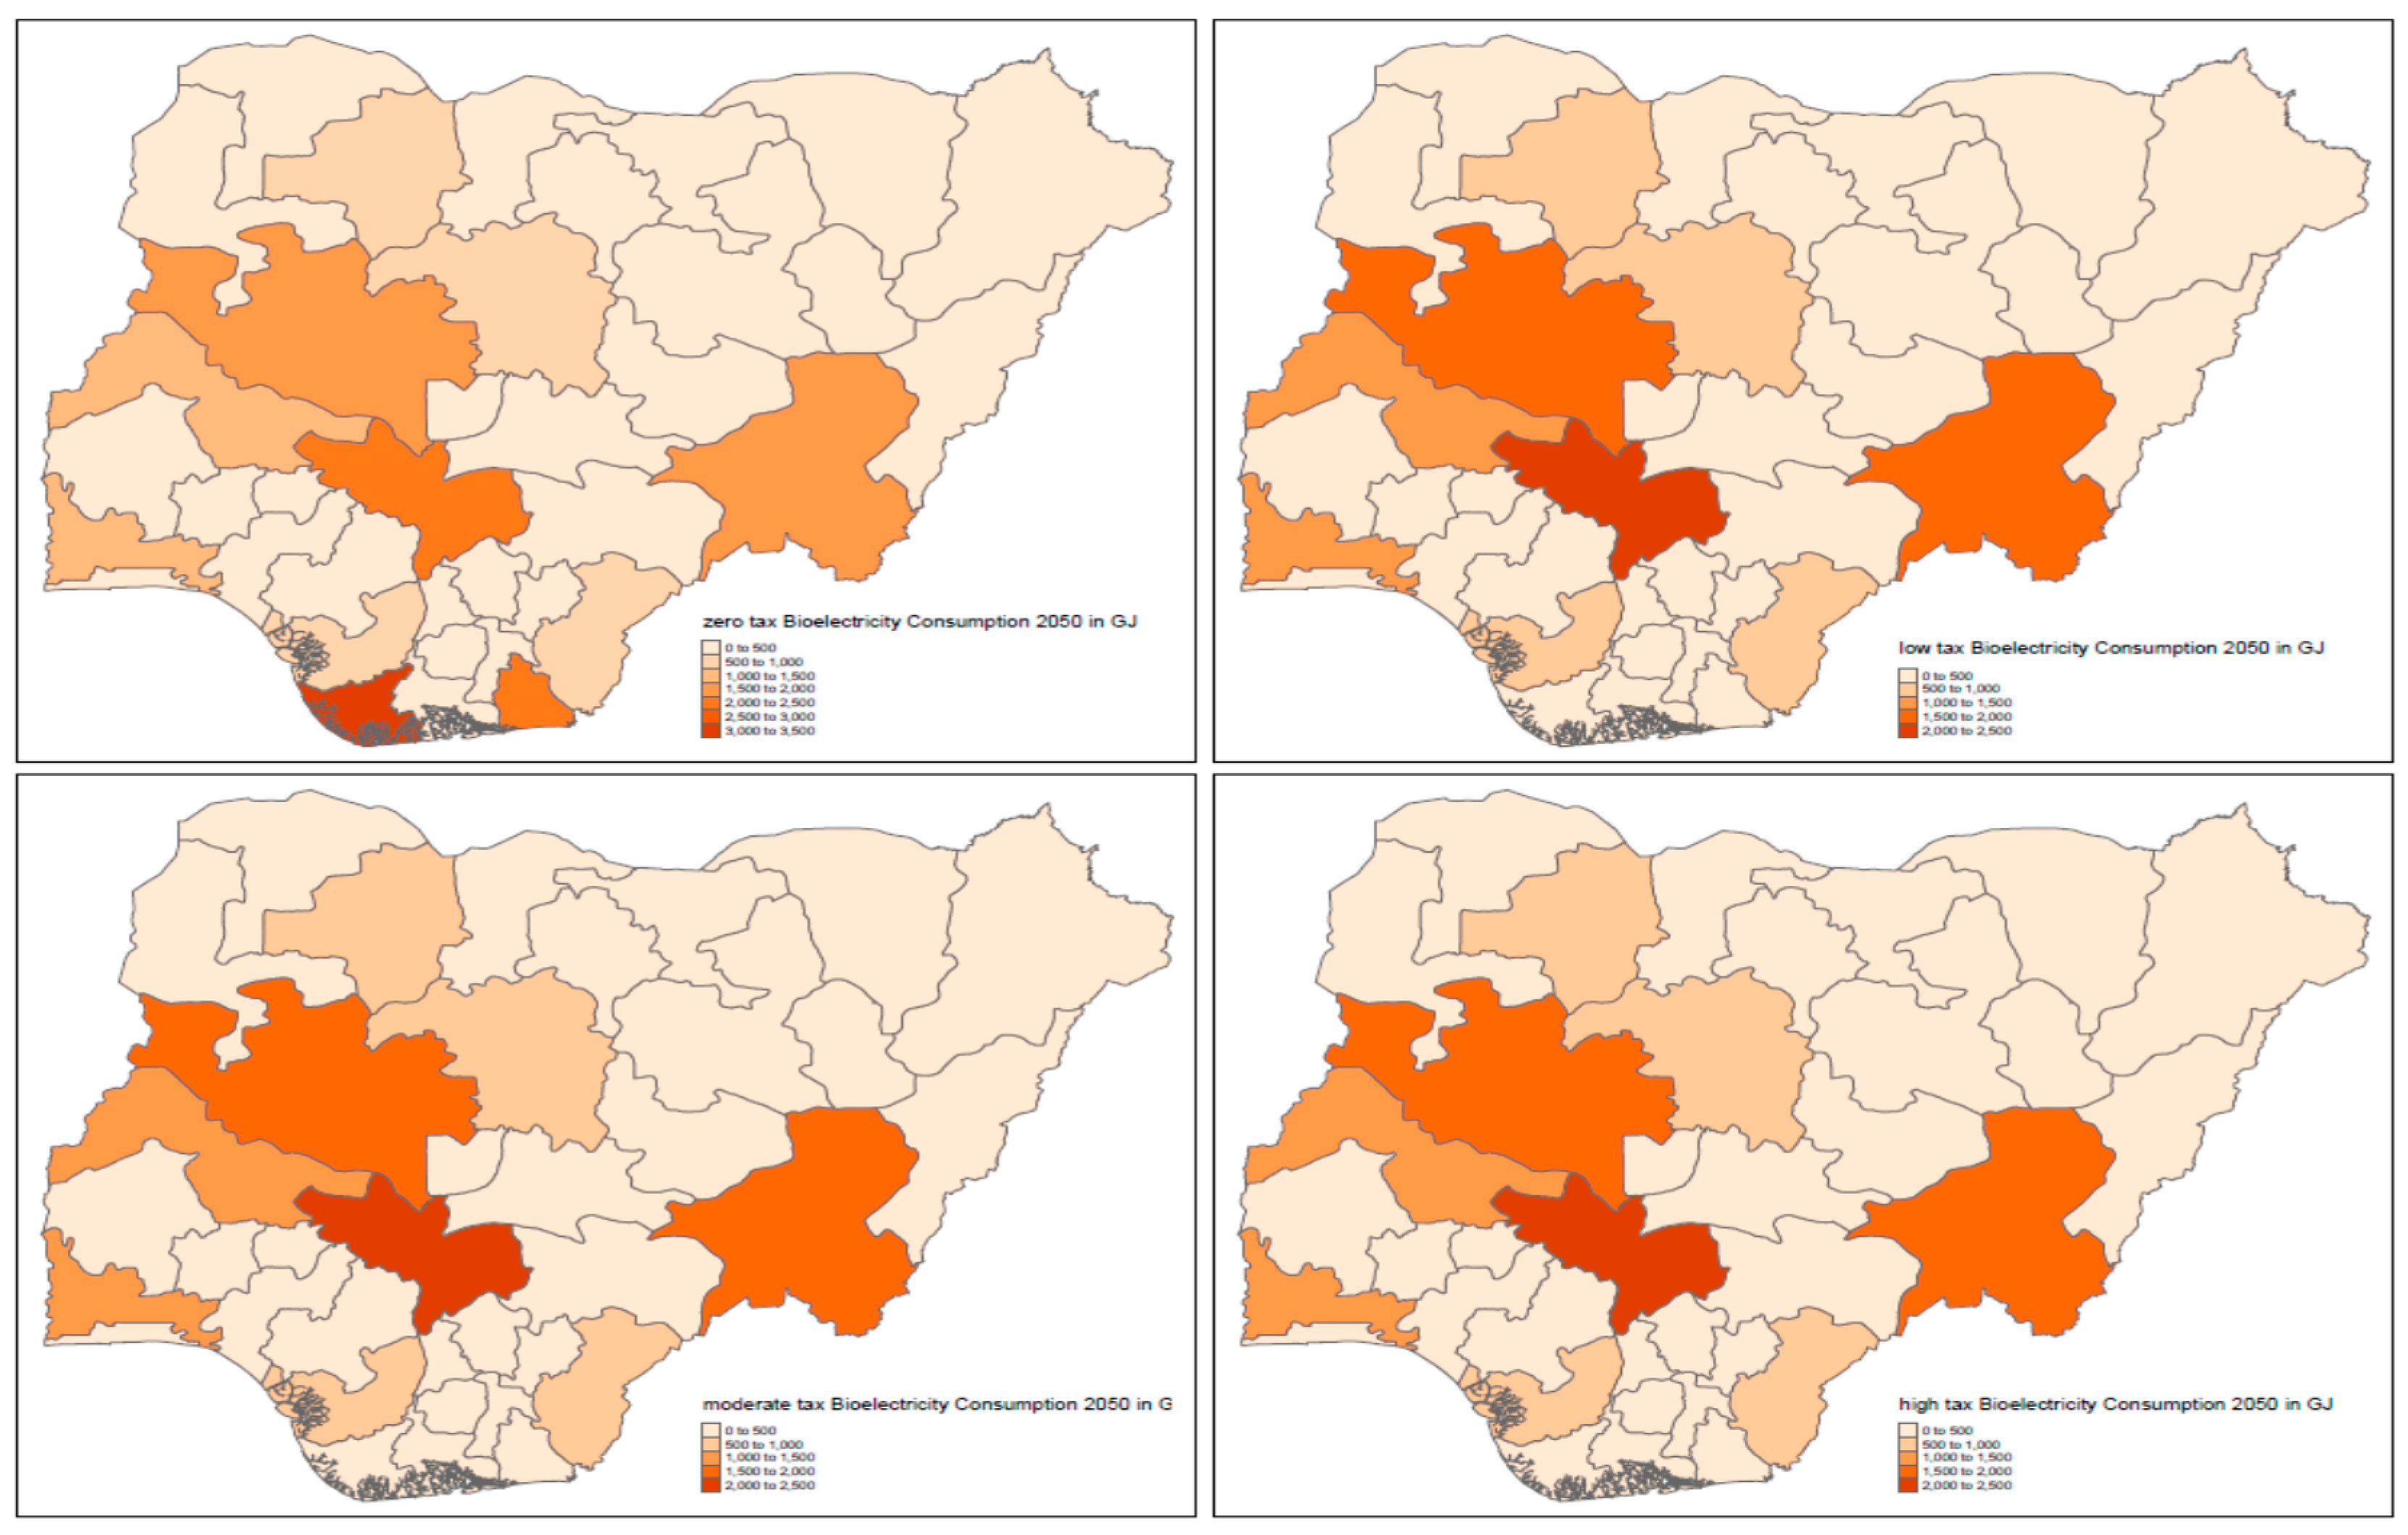
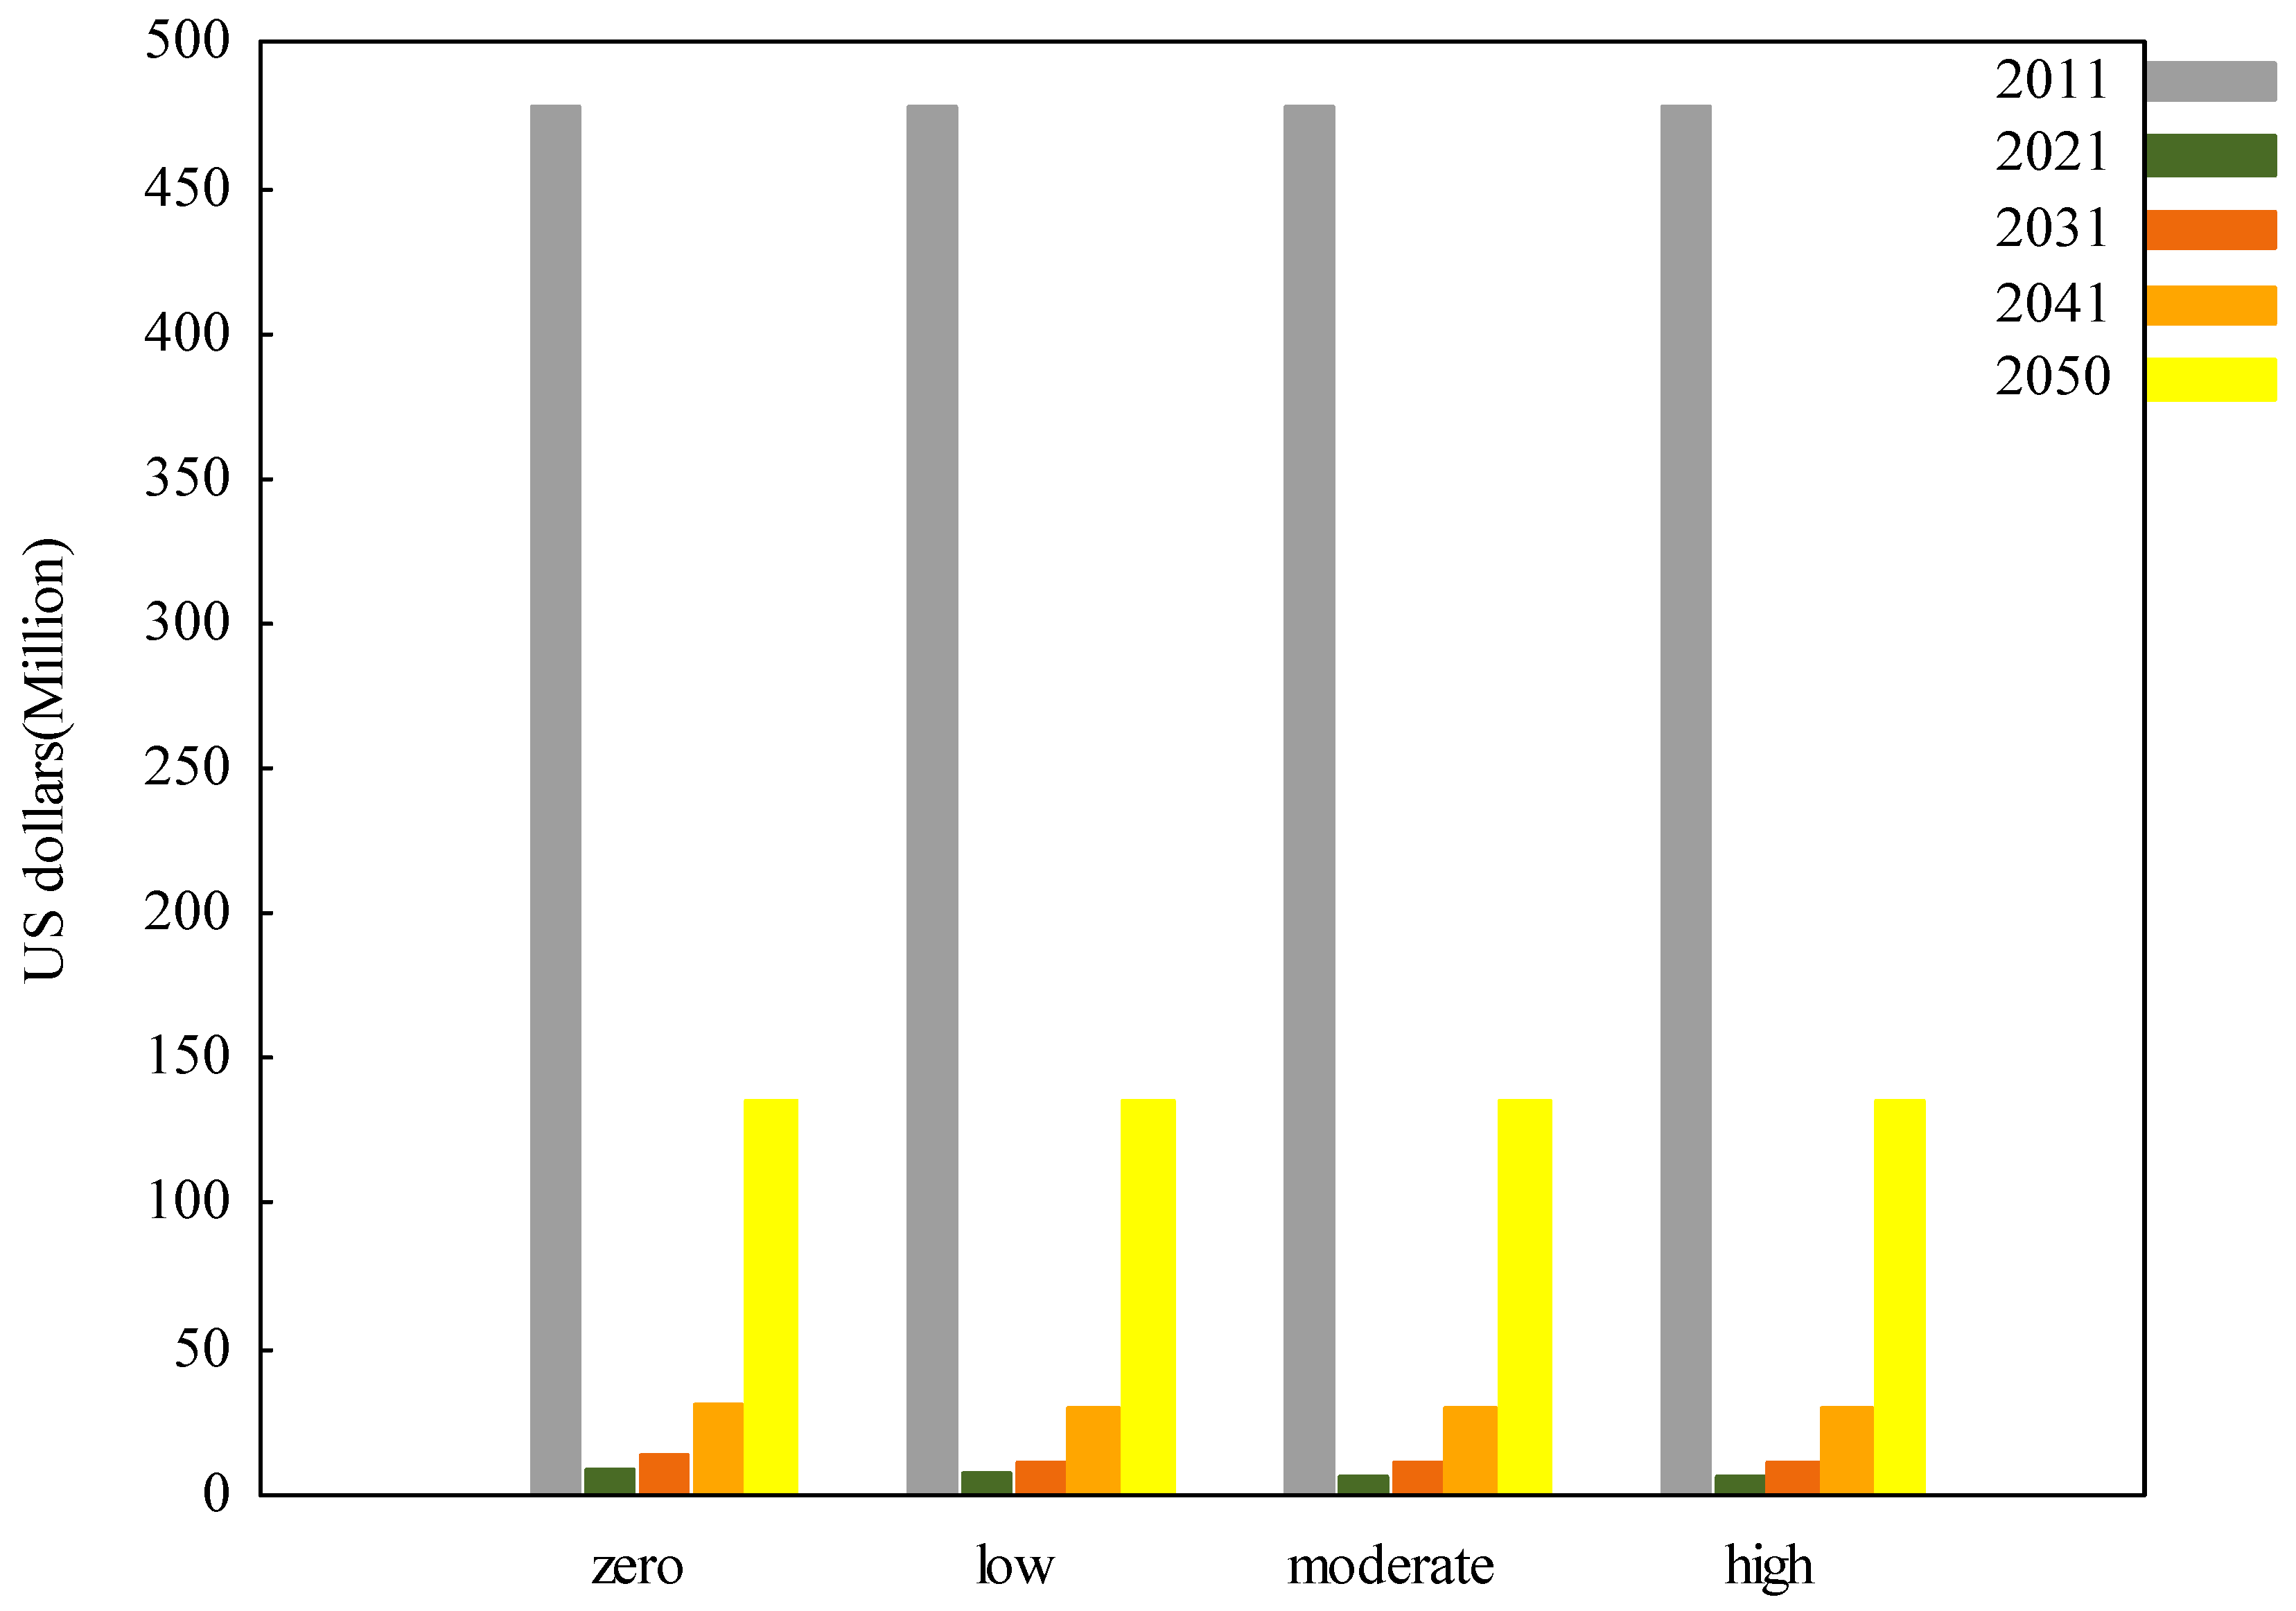
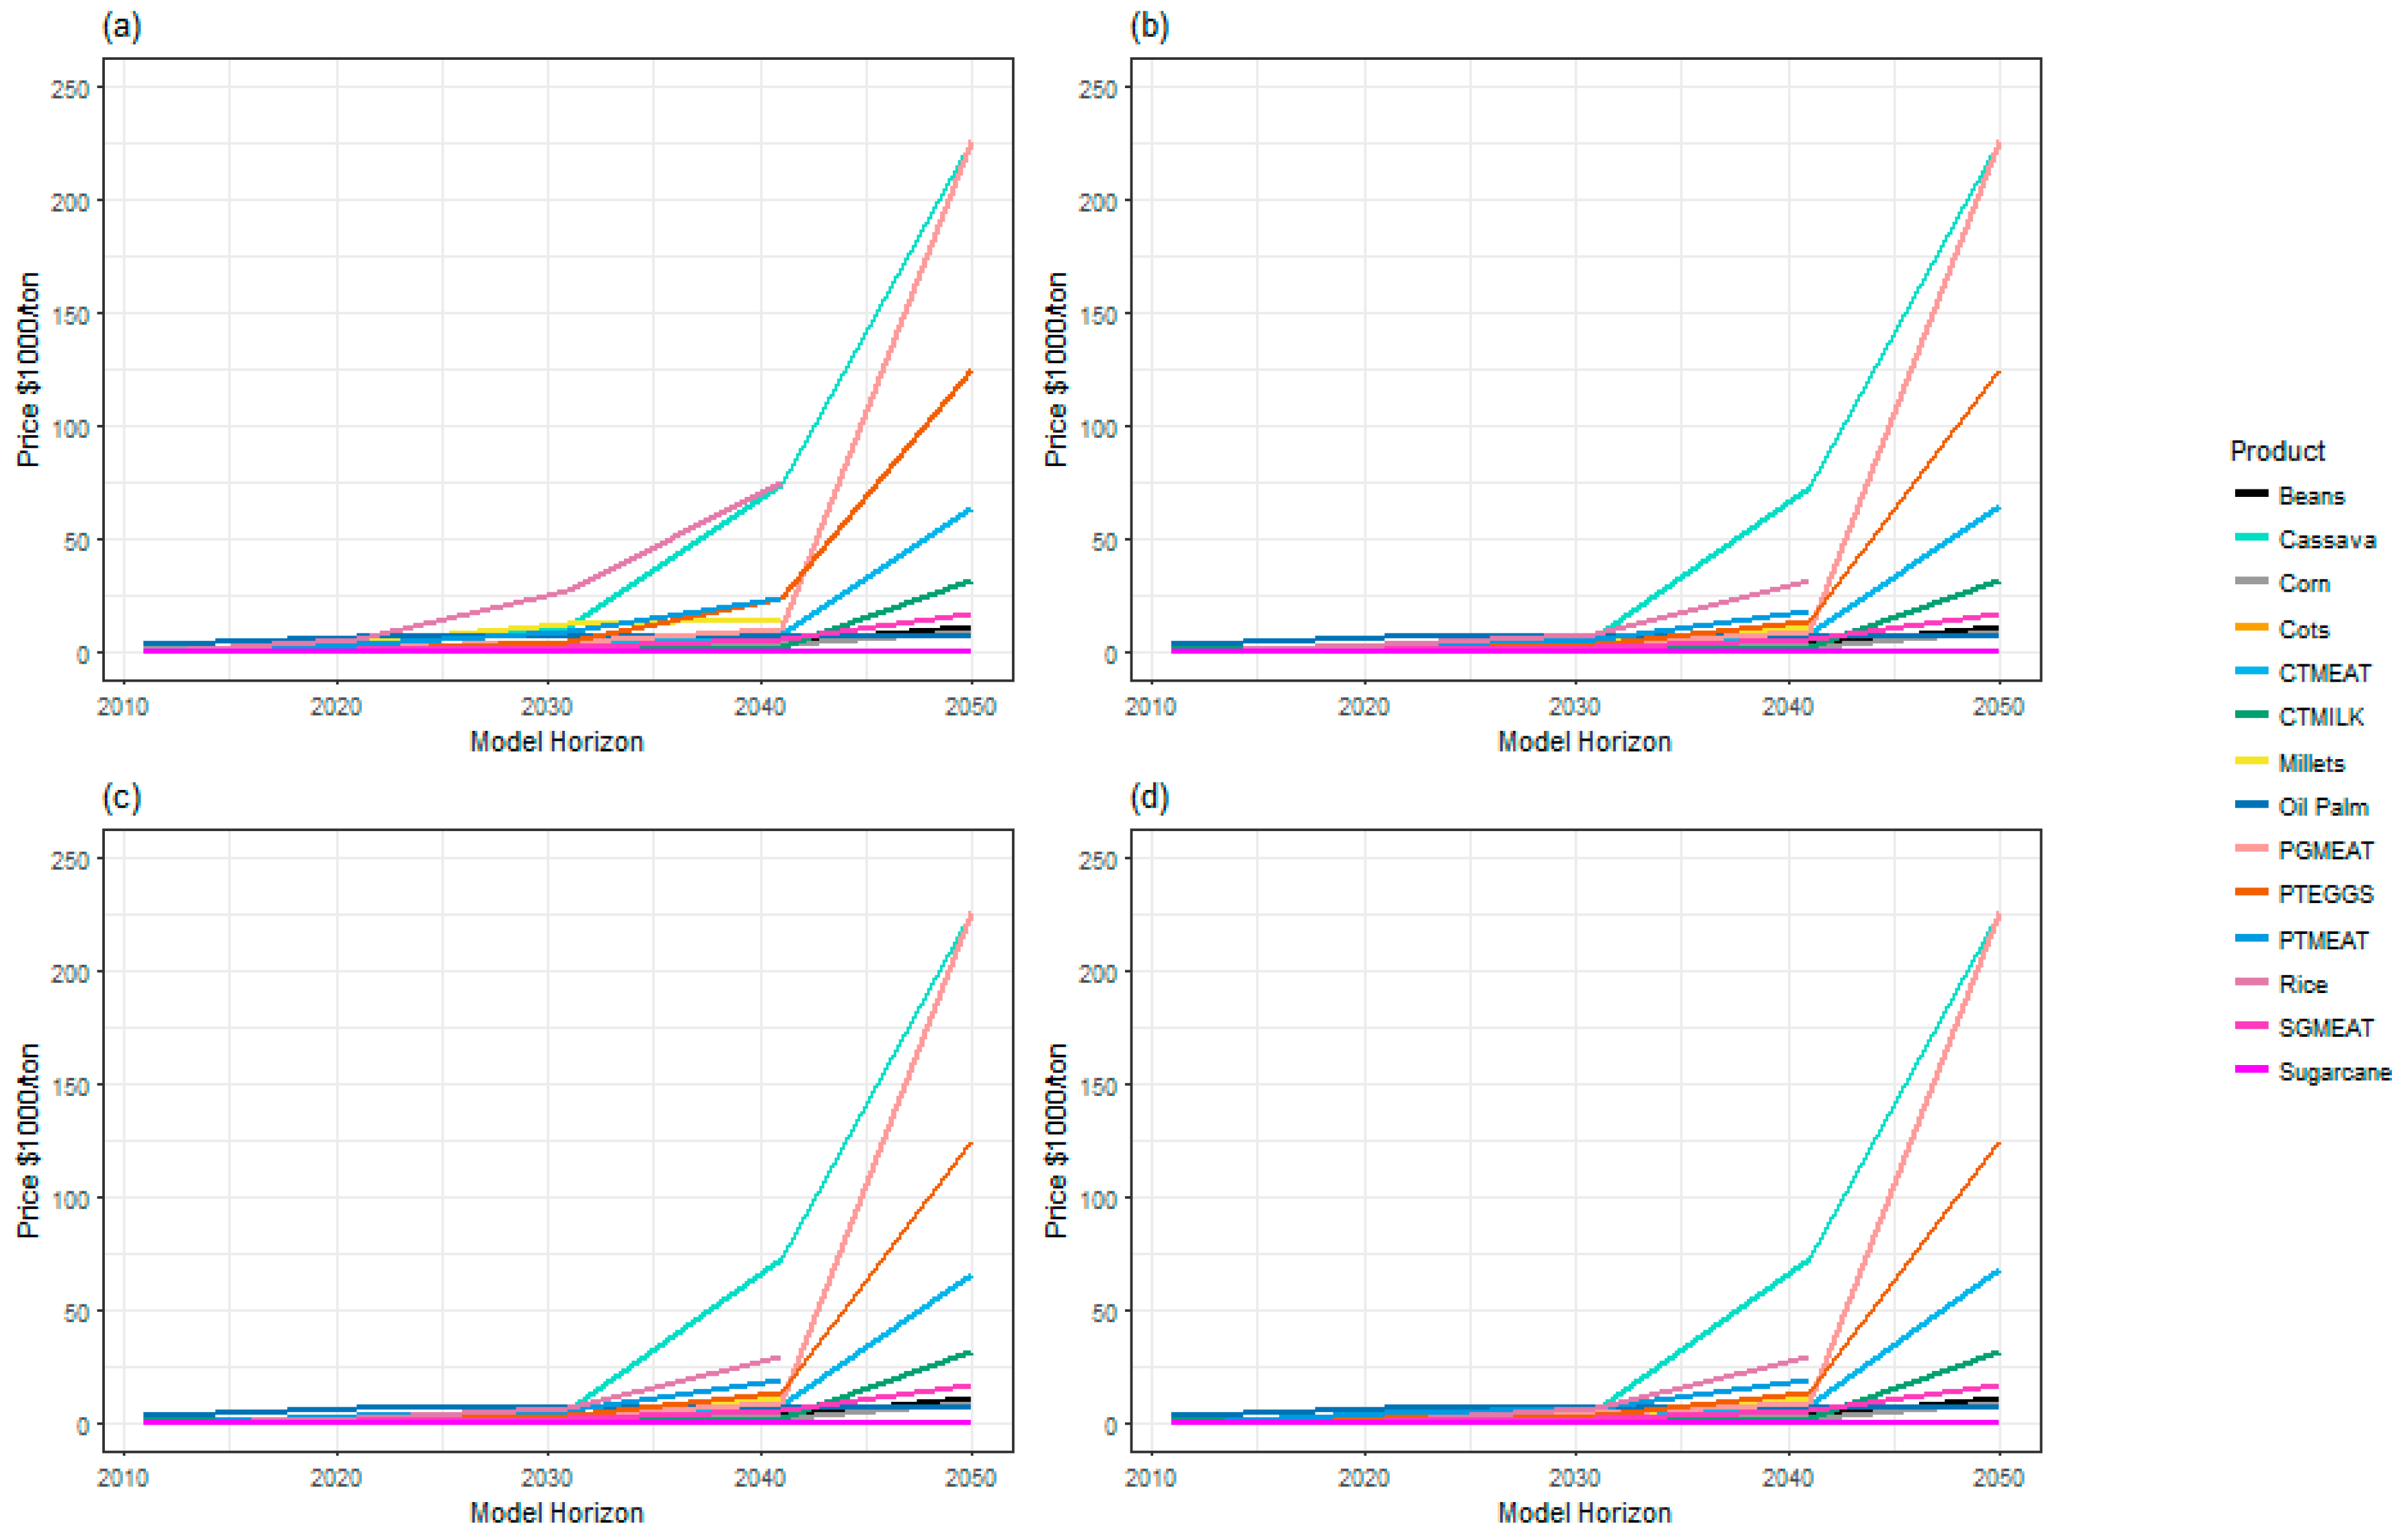
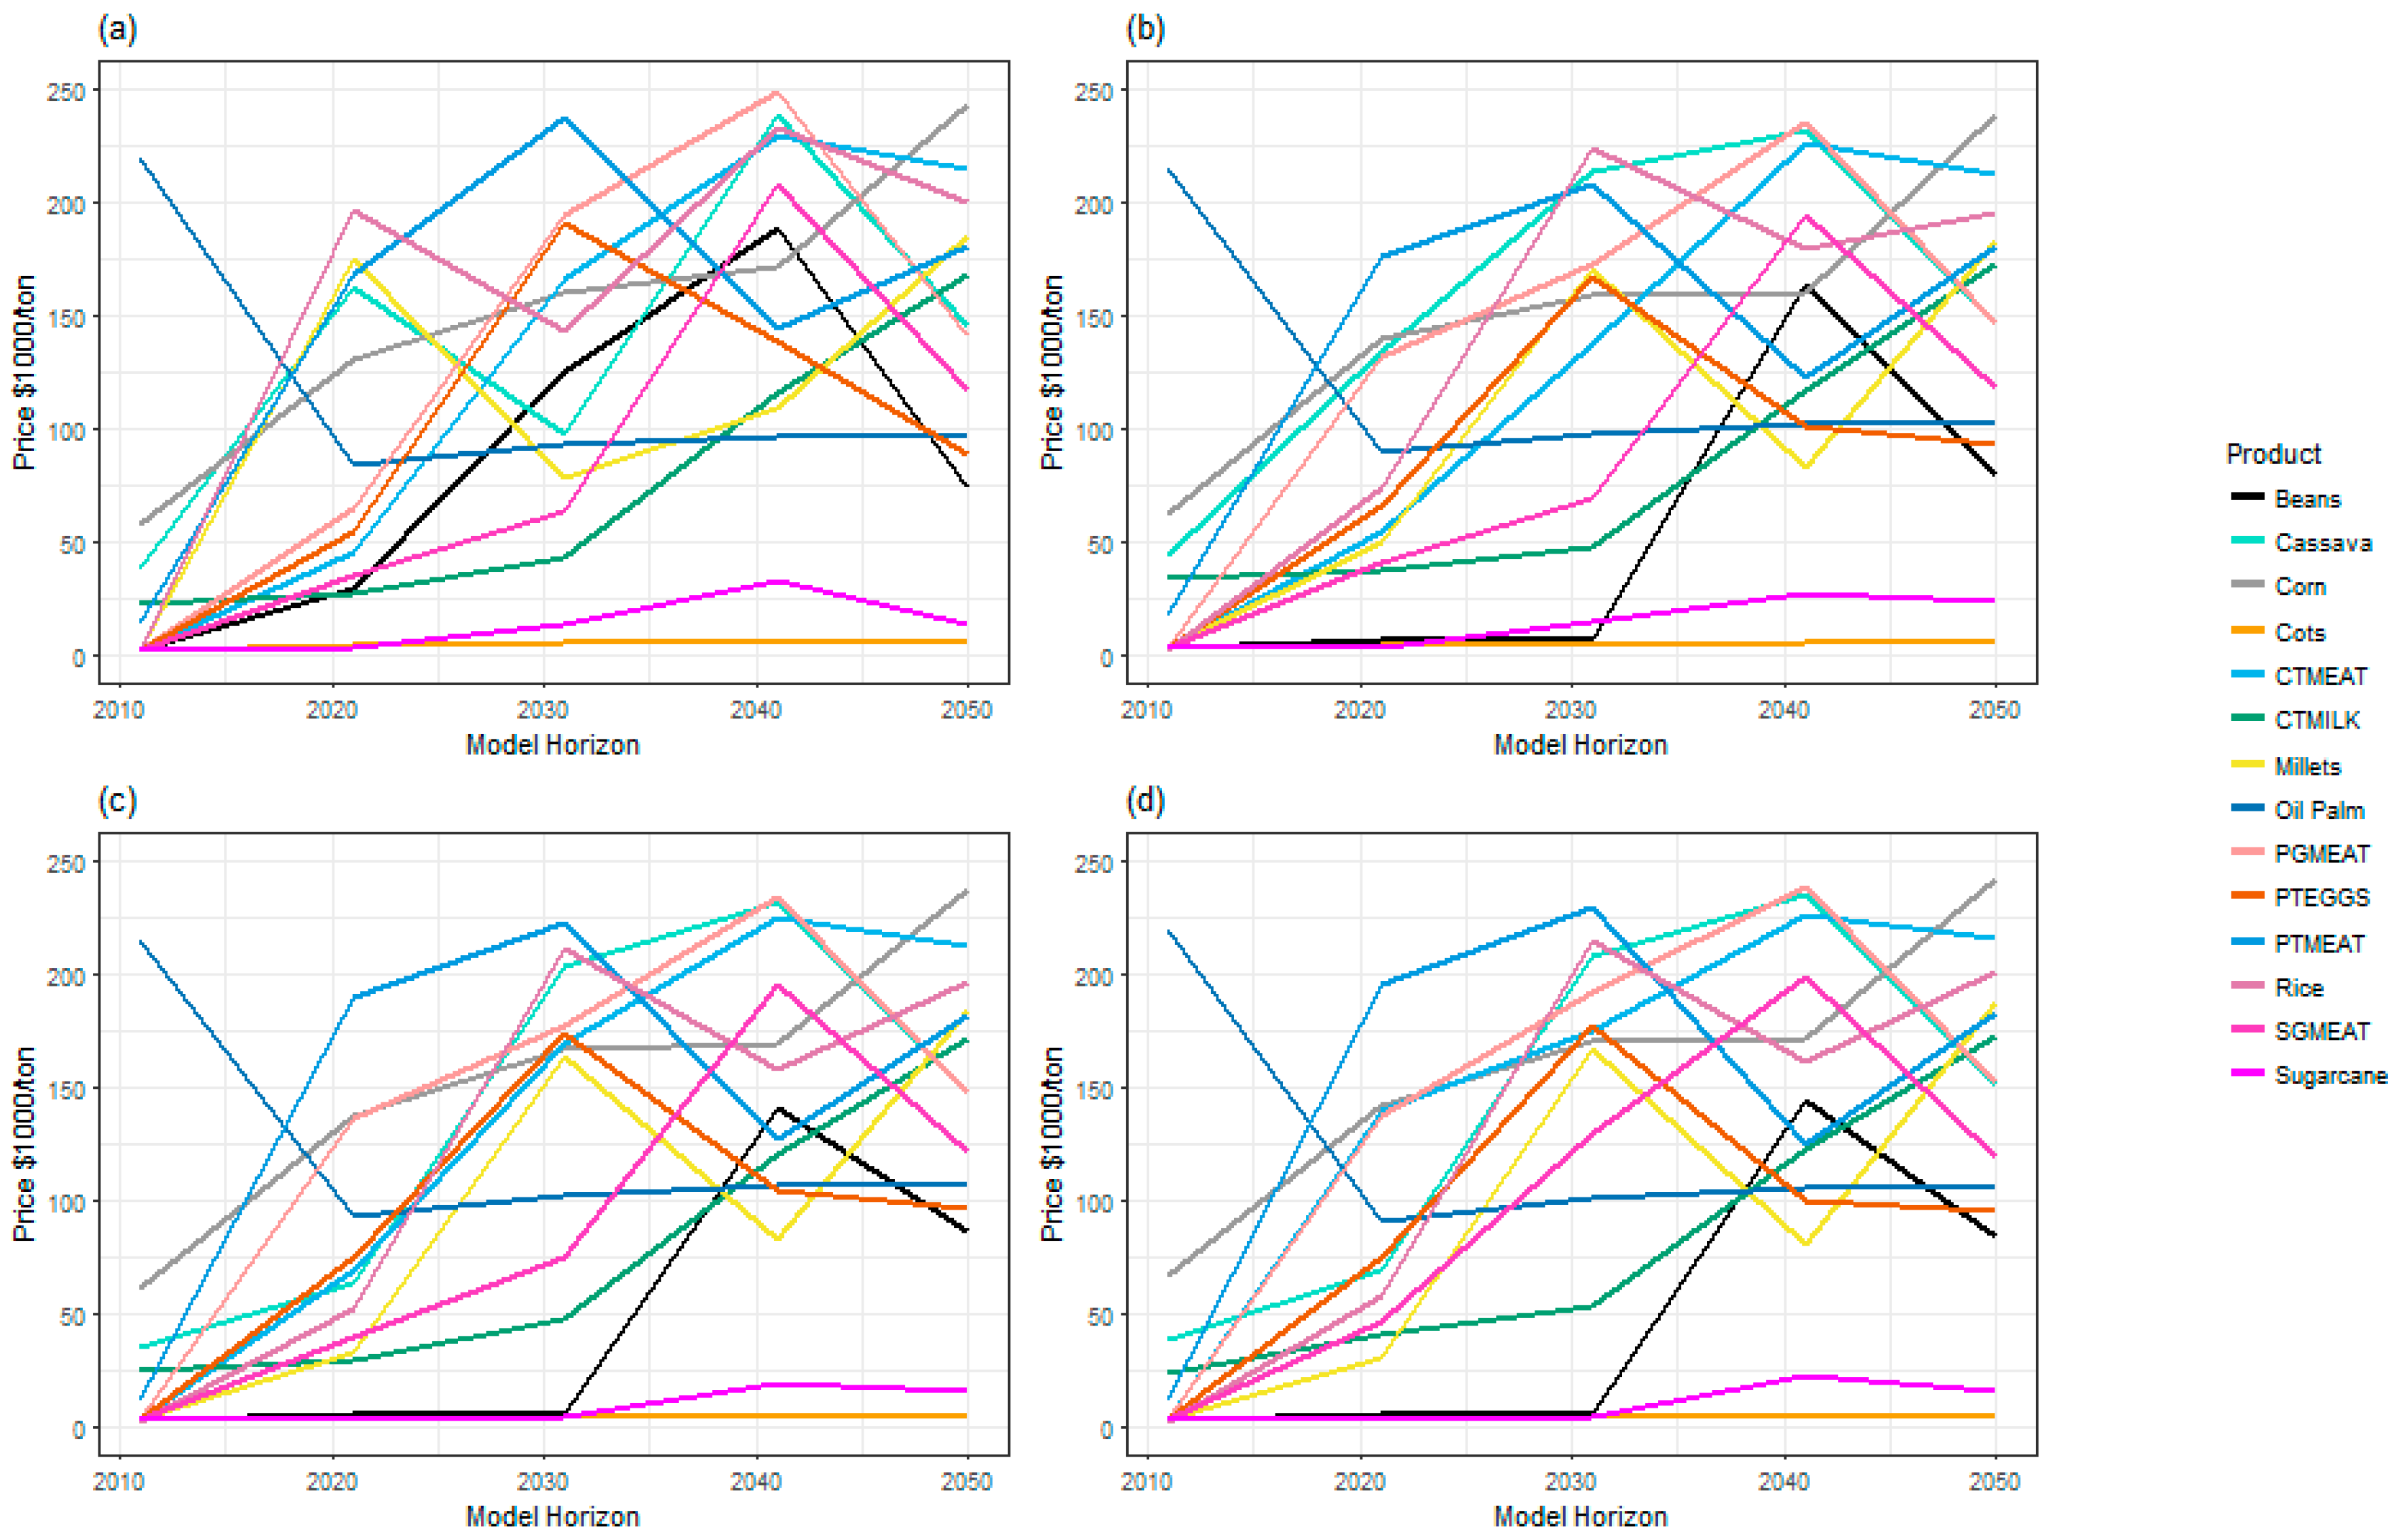
3.3. Implications of Bioenergy Subsidies on Food Prices, Total Welfare and Bioenergy Consumption Pattern

The results reveal that combining a volume mandate with a carbon price policy does not provide any substantial change in bioenergy consumption due to the energy products’ elasticity (see Figure 10, Figure 11, Figure 12 and Figure 13). Instead, at optimal control, a carbon tax tends to favor the disposable income with regards to bioenergy at the expense of other competing agricultural products. Our results reveal that by 2050 the biofuel and bioelectricity consumption trend by states showed very little difference across the three tax scenarios with or without a subsidy on bioenergy (see Figure 10, Figure 11, Figure 12 and Figure 13). Kogi state showed the highest consumption share when a carbon price is implemented in scenarios for both biofuel and bioelectricity by 2050. Bayelsa state consumes the highest bioenergy when there is no carbon tax, and decreases its consumption share by almost a factor of 5 with the introduction of a carbon tax. Putting this into perspective, one could translate this into changes in land use, principally those associated with deforestation of the mangrove forest, land-use change emissions cost and the trade cost with other states due to proximity challenges. The result also replicates the same issue as with Bayelsa state in the case of Akwa Ibom state with a factor of 4 when a carbon tax is implemented.
The study result also shows that a subsidy does not have any significant effect on the total welfare due to deadweight loss (Figure 14 and Figure 15). The economic inefficiency caused by the grant is because of the cost of enacting the government support, which is more than the marginal benefit of the subsidy to the producers and consumers.
Our result shows that the bioenergy policy target in Nigeria will translate to very high food prices by 2050 under all the scenarios with or without a carbon tax (see Figure 16 and Figure 17). This result is in accord with that of [47]. The food-price dynamics across the model horizon as seen in without subsidy scenarios (Figure 17) are caused by the land-use change trajectories.

4. Conclusions and Policy Implications

Public support for bioenergy deployment is widely debated, and it is agreed that the substitution of traditional fossil-fuel energy sources by bioenergy can provide benefits for energy security and potential for GHG mitigation. However, the rapid expansion of biofuels production from some feedstocks (e.g., oil palm) has raised concerns regarding land use and the implications of cropland expansion for net GHG emissions. Thus, the focus for future bioenergy use has shifted toward second-generation feedstocks that may alleviate these issues of converting forest land to cropland. However, there are some technological and logistical hurdles to overcome before second-generation feedstocks can be used to generate large quantities of bioenergy at competitive costs [48]. Conclusions from this study are that market-based instruments such as a carbon tax alone are not sufficient for preserving the remaining forest area in Nigeria. Therefore, political willingness to support an infant industry such as the bioenergy industry have to couple a carbon tax with conservation instruments such as Payment for Ecosystem Services (PES). NGA–FASOM showed that, to achieve a negative GHG reduction in the forest and agricultural sector in Nigeria, a carbon tax above $80/ton is required. In Nigeria, a subsidy on bioenergy products does not have any significant effect on total social welfare. Another general conclusion that emerges from this study is that a subsidy on the bioenergy industry in Nigeria does not translate into any substantial comparative advantage on bioenergy feedstocks. Furthermore, bioenergy consumption will not be significantly affected by a subsidy. In addition, we conclude that following the stipulated bioenergy mandates will cause a substantial hike in food prices in Nigeria. We recommend further studies to look at the potential and realization of the bioenergy targets as stipulated above using second-generation feedstocks and placing a physical restriction on land-use change.

Acknowledgments

Stanley U. Okoro is partially sponsored by the Center for a Sustainable University at the University of Hamburg and CliSAP/SICSS University of Hamburg. We are grateful to the three anonymous reviewers for their comments that contributed to the improvement of this paper.

Author Contributions

Stanley U. Okoro designed the overall study and prepared the input data. Stanley U. Okoro and Schneider developed the model coding and calibration. Stanley U. Okoro run the analysis, analyzed the results and wrote the manuscript. All authors read, discussed and approved the manuscript.

Conflicts of Interest

The authors declare no conflict of interest.

Appendix A. Model Equations

W = t { δ t [ ( + r , y ( ϕ t , r , y ( D t , r , y ) d D t , r , y ) + r , e ( υ t , r , e ( E t , r , e ) d E t , r , e ) ) ( + r , s , m ( c t , r , s , m A t , r , s , m ) + r , a , m ( c t , r , a , m L t , r , a , m ) + r , r ˜ , y ( c t , r , r ˜ , y T t , r , r ˜ , y ) + r , m ( c t , r , _ , m P t , r , m ) ) ( + r , i ( ϕ t , r , i ( S t , r , i ) d S t , r , i ) + r , u , u ˜ ( χ t , r , u , u ˜ ( U t , r , u , u ˜ ) d U t , r , u , u ˜ ) ) ] }
s . t . D t , r , y + ( r ˜ T t , r ˜ , r , y + r ˜ T t , r , r ˜ , y ) ( + s , m ( a t , r , s , m , y A t , r , s , m ) + a , m ( a t , r , a , m , y L t , r , a , m ) + m ( a t , r , _ , m , y P t , r , m ) ) 0 t , r , y Commodity Supply   Demand   Balance   Equations ( + s , m ( a t , r , s , m , i A t , r , s , m ) + a , m ( a t , r , a , m , i A t , r , a , m ) + m ( a t , r , _ , m , i P t , r , m ) ) S t , r , i 0 t , r , i Resource Accounting   Equations ( + s , m ( a t , r , s , m , e A t , r , s , m ) + a , m ( a t , r , a , m , e L t , r , a , m ) + m ( a t , r , _ , m , e P t , r , m ) r ˜ , y ( k t , r , r ˜ , y , e T t , r , r ˜ , y ) ) E t , r , e 0 t , r , e Environmental   Impact   Accounting   Equations s u A t , r , s , m + ( + u ˜ U t , r , u , u ˜ u ˜ U t , r , u ˜ , u ) ( s u A t 1 , r , s , m ) t > 1 = b t 0 , r , u , _ | t = 1 t , r , u Land   Use   Change   Accounting   Equations S t , r , i b t , r , i , _ t , r , i Physical   Resource   Restrictions U t , r , u , u ˜ b t , r , u , u ˜ t , r , u , u ˜ Land   Use   Change   Restrictions y ( k t , r , _ , y , z D t , r , y ) = b t , r , z , _ t , r , z Commodity   Restrictions Linearization   Equations
Table A1. Description of Variables, Parameters, Functions and Indices.
VariableDescriptionUnit
WWelfaremillion USD
DDomestic demand quantity1000 tons
SDomestic supply quantity1000 units
TTrade quantity1000 tons
ALand-use activity1000 ha
LLivestock production activity1000 units
PProcessing activity (also used to depict product substitutions)1000 units
EEnvironmental impacts1000 units
ULand-use change1000 ha
ParameterDescriptionUnit
aTechnical coefficient containing productivities, input coefficients, per-unit cost, environmental impact coefficientsproduct or resource unit/activity unit
bEndowments1000 units
cObjective function coefficientsUSD/activity unit
kCommodity coefficientsattribute unit/product unit
δdiscount factorunit less
εelasticityunit less
FunctionDescription
ɸinverse demand/supply function
χmarginal cost function
νmarginal value function
IndexDescriptionElements
ttimedecades
rregion36 States + FCT
ycommodityfood commodities, forest products, and bioenergy
iinput (resource)land and energy (implicitly represented)
eenvironmental impactGHG emissions (CO2eqv.)
sspecies~8 Crops, ~1 forest type
aanimal~6 animal types
mmanagementland, livestock production, and processing alternatives
uland-use typecropland, forest land, and grassland
zcommodity attributefood commodities, animal feedstuffs, and bioenergy products

References

  1. Ohimain, E.I. A review of the Nigerian biofuel policy and incentives (2007). Renew. Sustain. Energy Rev. 2013, 22, 246–256. [Google Scholar] [CrossRef]
  2. Ojo, O.V. An Overview of the Legal and Regulatory Framework for Renewable Energy Projects in Nigeria: Challenges and Prospects; Social Science Research Network: Rochester, NY, USA, 2017. [Google Scholar]
  3. Fytili, D.; Zabaniotou, A. Social acceptance of bioenergy in the context of climate change and sustainability—A review. Curr. Opin. Green Sustain. Chem. 2017, 8, 5–9. [Google Scholar] [CrossRef]
  4. Gazull, L. Agricultural and Forestry Chains in the Countries of the South in the Age of Bioenergy. In Sustainable Development and Tropical Agri-Chains; Springer: Dordrecht, The Netherlands, 2017; pp. 175–186. [Google Scholar]
  5. Souza, G.M.; Ballester, M.V.R.; de Brito Cruz, C.H.; Chum, H.; Dale, B.; Dale, V.H.; Fernandes, E.C.M.; Foust, T.; Karp, A.; Lynd, L.; et al. The role of bioenergy in a climate-changing world. Environ. Dev. 2017. [Google Scholar] [CrossRef]
  6. The United Nations (UN). Climate Action Now: Summary for Policymakers 2016; United Nations Climate Change Secretariat: Bonn, Germany, 2016. [Google Scholar]
  7. Bottcher, H.; Aoki, K.; De Cara, S.; Gusti, M.; Havlik, P.; Kindermann, G.; Schneider, U.A.; Obersteiner, M. GHG Mitigation Potentials and Costs from Land-Use, Land-Use Change and Forestry (LULUCF) in Annex 1 Countries. Available online: http://gains.iiasa.ac.at/gains/reports/AnnexI-LULUCF.pdf (accessed on 9 August 2017).
  8. Havlík, P.; Schneider, U.A.; Schmid, E.; Böttcher, H.; Fritz, S.; Skalskỳ, R.; Aoki, K.; De Cara, S.; Kindermann, G.; Kraxner, F.; et al. Global land-use implications of first and second generation biofuel targets. Energy Policy 2011, 39, 5690–5702. [Google Scholar] [CrossRef]
  9. Mosnier, A.; Havlík, P.; Valin, H.; Baker, J.; Murray, B.; Feng, S.; Obersteiner, M.; McCarl, B.A.; Rose, S.K.; Schneider, U.A. Alternative U.S. biofuel mandates and global GHG emissions: The role of land use change, crop management and yield growth. Energy Policy 2013, 57, 602–614. [Google Scholar] [CrossRef]
  10. Murphy, F.; McDonnell, K. Investigation of the potential impact of the Paris Agreement on national mitigation policies and the risk of carbon leakage; an analysis of the Irish bioenergy industry. Energy Policy 2017, 104, 80–88. [Google Scholar] [CrossRef]
  11. Bracco, S. Effectiveness of EU biofuels sustainability criteria in the context of land acquisitions in Africa. Renew. Sustain. Energy Rev. 2015, 50, 130–143. [Google Scholar] [CrossRef]
  12. Aha, B.; Ayitey, J.Z. Biofuels and the hazards of land grabbing: Tenure (in)security and indigenous farmers’ investment decisions in Ghana. Land Use Policy 2017, 60, 48–59. [Google Scholar] [CrossRef]
  13. Warner, E.; Inman, D.; Kunstman, B.; Bush, B.; Vimmerstedt, L.; Peterson, S.; Macknick, J.; Zhang, Y. Modeling biofuel expansion effects on land use change dynamics. Environ. Res. Lett. 2013, 8, 015003. [Google Scholar] [CrossRef]
  14. The Food and Agriculture Organization (FAO). Global Agriculture towards 2050; The Food and Agriculture Organization of the United Nations: Rome, Italy, 2009. [Google Scholar]
  15. Plevin, R.J.; O’Hare, M.; Jones, A.D.; Torn, M.S.; Gibbs, H.K. Greenhouse Gas Emissions from Biofuels’ Indirect Land Use Change Are Uncertain but May Be Much Greater than Previously Estimated. Environ. Sci. Technol. 2010, 44, 8015–8021. [Google Scholar] [CrossRef] [PubMed]
  16. Smeets, E.M.W.; Faaij, A.P.C. Bioenergy potentials from forestry in 2050. Clim. Chang. 2007, 81, 353–390. [Google Scholar] [CrossRef]
  17. Emodi, N.V.; Ebele, N.E. Policies Enhancing Renewable Energy Development and Implications for Nigeria. Sustain. Energy Sustain. Energy 2016, 4, 7–16. [Google Scholar] [CrossRef]
  18. Emodi, N.V. Energy Policies for Sustainable Development Strategies Frontiers in African Business Research; Springer: Singapore, 2016; ISBN 978-981-10-0974-7. [Google Scholar]
  19. Okoro, S.U.; Schickhoff, U.; Boehner, J.; Schneider, U.A.; Huth, N.I. Climate impacts on palm oil yields in the Nigerian Niger Delta. Eur. J. Agron. 2017, 85, 38–50. [Google Scholar] [CrossRef]
  20. Schneider, U.A.; McCarl, B.A.; Schmid, E. Agricultural sector analysis on greenhouse gas mitigation in US agriculture and forestry. Agric. Syst. 2007, 94, 128–140. [Google Scholar] [CrossRef]
  21. McCarl, B.A.; Spreen, T.H. Price Endogenous Mathematical Programming as a Tool for Sector Analysis. Am. J. Agric. Econ. 1980, 62, 87–102. [Google Scholar] [CrossRef]
  22. Muth, J.F. Rational Expectations and the Theory of Price Movements. Econometrica 1961, 29, 315–335. [Google Scholar] [CrossRef]
  23. Dibblee, G.B. The Laws of Supply and Demand: With Special Reference to Their Influence on Over-Production and Unemployment; Constable and Company, Ltd.: London, UK, 1912. [Google Scholar]
  24. Anderson, K.P. Optimal growth when the stock of resources is finite and depletable. J. Econ. Theory 1972, 4, 256–267. [Google Scholar] [CrossRef]
  25. Samuelson, P.A. Spatial price equilibrium and linear programming. Am. Econ. Rev. 1952, 42, 283–303. [Google Scholar]
  26. Takayama, T.; Judge, G.G. An Intertemporal Price Equilibrium Model. J. Farm Econ. 1964, 46, 477–484. [Google Scholar] [CrossRef]
  27. Schleupner, C.; Schneider, U.A. Effects of bioenergy policies and targets on European wetland restoration options. Environ. Sci. Policy 2010, 13, 721–732. [Google Scholar] [CrossRef]
  28. Schneider, U.A.; McCarl, B.A. Economic potential of biomass based fuels for greenhouse gas emission mitigation. Environ. Resour. Econom. 2003, 24, 291–312. [Google Scholar] [CrossRef]
  29. Skalskỳ, R.; Tarasovičová, Z.; Balkovič, J.; Schmid, E.; Fuchs, M.; Moltchanova, E.; Scholtz, P. GEO-BENE Global Database for Bio-Physical Modeling. GEOBENE Project. 2008. Available online: http://www.geo-bene.eu/files/Deliverables/Geo-BeneGlbDb10%28DataDescription%29.pdf (accessed on 16 November 2017).
  30. Arino, O.; Ramos Perez, J.J.; Kalogirou, V.; Bontemps, S.; Defourny, P.; Van Bogaert, E. Global Land Cover Map for 2009 (GlobCover 2009); European Space Agency ESA & Univiversity Catholique Louvain (UCL), PANGAEA: Paris, France; Louvain-la-Neuve, Belgium, 2012. [Google Scholar]
  31. Okoro, S.U.; Schickhoff, U.; Böhner, J.; Schneider, U.A. A novel approach in monitoring land-cover change in the tropics: Oil palm cultivation in the Niger Delta, Nigeria. ERDE–J. Geogr. Soc. Berl. 2016, 147, 40–52. [Google Scholar]
  32. Seto, K.C.; Kaufmann, R.K.; Woodcock, C.E. Landsat reveals China’s farmland reserves, but they’re vanishing fast. Nature 2000, 406, 121. [Google Scholar] [CrossRef] [PubMed]
  33. Izaurralde, R.C.; Williams, J.R.; Mcgill, W.B.; Rosenberg, N.J.; Jakas, M.Q. Simulating soil C dynamics with EPIC: Model description and testing against long-term data. Ecol. Model. 2006, 192, 362–384. [Google Scholar] [CrossRef]
  34. Huth, N.I.; Banabas, M.; Nelson, P.N.; Webb, M. Development of an oil palm cropping systems model: Lessons learned and future directions. Environ. Model. Softw. 2014, 62, 411–419. [Google Scholar] [CrossRef]
  35. Herrero, M.; Havlik, P.; Valin, H.; Notenbaert, A.; Rufino, M.C.; Thornton, P.K.; Blummel, M.; Weiss, F.; Grace, D.; Obersteiner, M. Biomass use, production, feed efficiencies, and greenhouse gas emissions from global livestock systems. Proc. Natl. Acad. Sci. USA 2013, 110, 20888–20893. [Google Scholar] [CrossRef] [PubMed]
  36. Kruska, R.L. Seré and Steinfeld Version 3; Digit Data Set; ILRI: Nairobi, Kenya, 2006. [Google Scholar]
  37. Seré, C.; Steinfeld, H. World Livestock Production Systems: Current Status, Issues and Trends; Food Agriculture Organization (FAO): Rome, Italy, 1996. [Google Scholar]
  38. Kindermann, G.; Obersteiner, M.; Sohngen, B.; Sathaye, J.; Andrasko, K.; Rametsteiner, E.; Schlamadinger, B.; Wunder, S.; Beach, R. Global cost estimates of reducing carbon emissions through avoided deforestation. Proc. Natl. Acad. Sci. USA 2008, 105, 10302–10307. [Google Scholar] [CrossRef] [PubMed]
  39. Simonyan, K.J.; Fasina, O. Biomass resources and bioenergy potentials in Nigeria. Afr. J. Agric. Res. 2013, 8, 4975–4989. [Google Scholar]
  40. Sørensen, A.L. Economies of Scale in Biomass Gasification Systems; IIASA Interim Report; IIASA: Laxenburg, Austria, 2005. [Google Scholar]
  41. Leduc, S.; Schwab, D.; Dotzauer, E.; Schmid, E.; Obersteiner, M. Optimal location of wood gasification plants for methanol production with heat recovery. Int. J. Energy Res. 2008, 32, 1080–1091. [Google Scholar] [CrossRef]
  42. Valin, H.; Havlík, P.; Mosnier, A.; Herrero, M.; Schmid, E.; Obersteiner, M. Agricultural productivity and greenhouse gas emissions: Trade-offs or synergies between mitigation and food security? Environ. Res. Lett. 2013, 8, 035019. [Google Scholar] [CrossRef]
  43. Filoche, G. Playing musical chairs with land use obligations: Market-based instruments and environmental public policies in Brazil. Land Use Policy 2017, 63, 20–29. [Google Scholar] [CrossRef]
  44. Angelsen, A.; Brockhaus, M.; Duchelle, A.E.; Larson, A.; Martius, C.; Sunderlin, W.D.; Verchot, L.; Wong, G.; Wunder, S. Learning from REDD+: A response to Fletcher et al. Conserv. Biol. 2017, 31, 718–720. [Google Scholar] [CrossRef] [PubMed]
  45. Thamo, T.; Pannell, D.J.; Kragt, M.E.; Robertson, M.J.; Polyakov, M. Dynamics and the economics of carbon sequestration: Common oversights and their implications. Mitig. Adapt. Strateg. Glob. Chang. 2017, 22, 1095–1111. [Google Scholar] [CrossRef]
  46. Di Sbroiavacca, N.; Nadal, G.; Lallana, F.; Falzon, J.; Calvin, K. Emissions reduction scenarios in the Argentinean Energy Sector. Energy Econ. 2016, 56, 552–563. [Google Scholar] [CrossRef]
  47. Frank, S.; Havlík, P.; Soussana, J.-F.; Levesque, A.; Valin, H.; Wollenberg, E.; Kleinwechter, U.; Fricko, O.; Gusti, M.; Herrero, M.; et al. Reducing greenhouse gas emissions in agriculture without compromising food security? Environ. Res. Lett. 2017, 12, 105004. [Google Scholar] [CrossRef]
  48. Ben-Iwo, J.; Manovic, V.; Longhurst, P. Biomass resources and biofuels potential for the production of transportation fuels in Nigeria. Renew. Sustain. Energy Rev. 2016, 63, 172–192. [Google Scholar] [CrossRef] [Green Version]
Figure 1. Structure of the Nigeria Forest and Agricultural Sector Model (NGA–FASOM).
Energies 11 00152 g001
Figure 2. Bioenergy feedstock area by 2050 under subsidy action.
Energies 11 00152 g002
Figure 3. Bioenergy feedstock area by 2050 under no subsidy action.
Energies 11 00152 g003
Figure 4. Agricultural crop area by 2050 under subsidy action.
Energies 11 00152 g004
Figure 5. Agricultural crop area by 2050 under no subsidy action.
Energies 11 00152 g005
Figure 6. Total greenhouse gas (GHG) emission under subsidy action.
Energies 11 00152 g006
Figure 7. Total GHG emissions under no subsidy action.
Energies 11 00152 g007
Figure 8. GHG emissions due to land-use change (LUC) under subsidy action.
Energies 11 00152 g008
Figure 9. GHG emissions due to LUC under no subsidy action.
Energies 11 00152 g009
Figure 10. Biofuel consumption by 2050 under subsidy action.
Energies 11 00152 g010
Figure 11. Biofuel consumption by 2050 under no subsidy action.
Energies 11 00152 g011aEnergies 11 00152 g011b
Figure 12. Bioelectricity consumption by 2050 under subsidy action.
Energies 11 00152 g012
Figure 13. Bioelectricity consumption by 2050 under no subsidy action.
Energies 11 00152 g013
Figure 14. Total social welfare under subsidy action.
Energies 11 00152 g014
Figure 15. Total social welfare under no subsidy action.
Energies 11 00152 g015
Figure 16. Agricultural product prices: (a) Baseline; (b) $40 carbon tax; (c) $80 carbon tax; (d) $120 carbon tax, under subsidy action.
Energies 11 00152 g016
Figure 17. Agricultural product prices: (a) Baseline; (b) $40 carbon tax; (c) $80 carbon tax; (d) $120 carbon tax, under no subsidy action.
Energies 11 00152 g017
Table 1. Input assumption for the different productivity pathways. Adapted from [42].
Productivity Input PathwaysCrop Management
Fertilizer AdjustmentOther Input Adjustment
HighYesYes
LowNoYes
SubsistenceNoNo

