Article

Scheduling Model for Renewable Energy Sources Integration in an Insular Power System

1
Centre for Mechanical and Aerospace Science and Technologies (C-MAST), University of Beira Interior, 6201-001 Covilhã, Portugal
2
Instituto de Engenharia de Sistemas e Computadores—Investigação e Desenvolvimento (INESC-ID), Instituto Superior Técnico, University of Lisbon, 1049-001 Lisbon, Portugal
3
Institute for Systems and Computer Engineering, Technology and Science (INESC TEC) and Faculty of Engineering of the University of Porto, 4200-465 Porto, Portugal
*
Author to whom correspondence should be addressed.
Energies 2018, 11(1), 144; https://doi.org/10.3390/en11010144
Submission received: 5 November 2017 / Revised: 23 December 2017 / Accepted: 4 January 2018 / Published: 7 January 2018
(This article belongs to the Special Issue Distributed Renewable Generation 2018)

Abstract

:
Insular power systems represent an asset and an excellent starting point for the development and analysis of innovative tools and technologies. The integration of renewable energy resources that has taken place in several islands in the south of Europe, particularly in Portugal, has brought more uncertainty to production management. In this work, an innovative scheduling model is proposed, which considers the integration of wind and solar resources in an insular power system in Portugal, with a strong conventional generation basis. This study aims to show the benefits of increasing the integration of renewable energy resources in this insular power system, and the objectives are related to minimizing the time for which conventional generation is in operation, maximizing profits, reducing production costs, and consequently, reducing greenhouse gas emissions.

1. Introduction

1.1. Framework and Motivation

Following the largest industrial and technological revolution that the world has seen over the last 200 years, there has been a unique increase in the world’s population, due to an increasing capacity to transform energy for the benefit of humanity. However, this increase has catalyzed a greater demand for energy and has also increased the economic, environmental, and safety costs of the electrical system (ES). With this increased demand and the corresponding increases in electricity production, emissions of greenhouse (GHG) gases, and other toxic and acid gases have been rising, creating the large environmental impact that the world is now facing [1,2].
Worldwide, the main priority in several countries has been the development of sustainable ESs; these increase the integration of energy from renewable sources with the goals of reducing emissions from fossil fuel consumption and improving the energy efficiency of the system by minimizing its footprint [3]. This development and the increasing implementation of renewable energies in the ESs have been noticeable, and the investments and incentives that are offered by governments in the last two decades have contributed to this by promoting the environmental and economic advantages of this type of electricity production [4].
In fact, world energy production is expected to increase by 69% between 2012 and 2040, with an average growth of 2.9% per year in renewable production and only 0.8% in energy production from coal [5]. The European Union (EU) has set several environmental targets for the coming years in order to facilitate a transition to a low carbon ES, i.e., with a lower environmental footprint. The EU predicts a reduction of about 40% of GHG emissions by 2030 (compared to 1990) and a rate of energy consumption from renewable energy sources of 27% by 2040. A huge investment in the ES is predicted, allowing for a rate of integration of renewable energy sources of 75.2% and a reduction of 80% in GHGs as compared to 1990 [6].
In the context of the implementation of new strategies and/or tools for the sustainable and profitable management of power systems, namely the electricity sector, insular power systems are exceptional cases due to the different factors characterizing them in terms of their state of economic, technological, environmental, geographic, and social development. Dependence on imported energy, reduced facilities for saving fresh water, treatment of waste, population seasonality, and climate conditions all have a great impact on the economy of these systems. A combination of these aspects increases the consumption of energy. The use of endogenous and renewable resources has therefore been essential to the energy policy of island power systems over the last decade, and the interest in renewable energy production has led to a significant change in the insular ES [7].
However, as widespread research has shown, a high level of integration of renewable sources has challenging obstacles to overcome, even when considering its advantages. The natural variability and uncertainty of this type of energy production make optimal system operation very difficult, and often increase the operational costs and GHG emissions due to low-efficiency situations [8,9].

1.2. Literature Review

To deal with the unpredictability of renewable energy resources, stochastic relationships can be introduced through the unit commitment (UC) formulation, energy storage systems (ESS), or demand response (DR). The flexibility introduced by ESS has attracted attention in the literature in dealing with the uncertainty of renewable energies. Their use can reduce energy costs and increase the level of integration of renewable resources. ESS has a large economic impact in the case of the aforementioned features of wind farms, i.e., the large size of EES that is required to deal with a hypothetical lack of wind increases the project costs of an ESS solution [10].
Currently, the Monte Carlo Simulation (MCS) method is used to solve some of the ES concerns described above; this takes into account the probabilistic characteristics of renewable production in the case of wind and solar energy. In addition, it allows for a correlation between continuous observations, the profile of the energy production forecast, and consequent forecast errors. This method needs to perform an analysis of a certain number of tests, which requires great computational effort and which increases with the number of possibilities considered [11].
Other solutions have been proposed. For instance, in [12] a model was proposed based on the creation/reduction of scenarios in order to establish a relationship between the number of scenarios and the computational time required for their analysis, carrying out the analysis of each scenario separately. Firstly, the method used creates time profiles to integrate the natural correlation of wind energy production. Then, unexpected wind changes are simulated as a consequence of forecasting errors. The objective is to minimize the cost of producing energy for each scenario. In order to evaluate the quality of the obtained solution, it is compared with a solution of the problem using stochastic programming.
In [13], a method combining Chance-Constrained Programming (CCP) with a Quantum-Inspired Binary Gravitational Search Algorithm (QBGSA) was proposed. The UC is determined for different confidence levels and prediction errors. The model is divided into two optimization sub-problems: the first determines the states of the production units using QBGSA, and the second solves the DE using an increment method, resulting in faster convergence for the solution.
There are two main approaches that can help to deal with the problem of uncertainty in renewable production: improving the accuracy of forecasts, or developing technologies that deal with uncertainty, given that prediction error is always present.
Recently, there has been an increasing amount of research into probabilistic forecasting to improve prediction accuracy; despite this growth, few of these methods have been introduced into optimization and decision problems [14]. Forecasting tools involving renewable forecasts have been proposed that consider the probabilistic quantification of uncertainty playing a better role in ES decisions, as reported [15].
One of the most important objectives for the operation of the ES is to determine for a certain period the optimal combination of production units capable of satisfying the load and other constraints at the lowest operating cost. Basically, UC is a complex optimization problem that is expected to minimize the total costs of energy production [16]. Mathematically, the UC problem is usually non-convex and non-linear, and the combination of these characteristics implies an integer-mixed and combinatorial optimization problem formulation, since the various production units that are allied to these characteristics make this problem very complex and difficult to solve [17].
This problem is no longer unusual in the electricity sector, and there are several methods to solve it. The most widely used methods involved deterministic mathematical programming techniques, such as branch-and-bound, Lagrange relaxation (LR), or mixed-whole methods. However, these techniques have some disadvantages, although they do have the advantage of being relatively fast solutions and easy to implement. Hence, due to the features of the UC problem mentioned above, this type of technique does not guarantee convergence to the optimal point, and the results may not be the most consistent due to the approximations made in the resolution of the constraints and the objective function. Evolutionary programming, genetic algorithm (GA), particle swarm optimization (PSO), and hybrid models are some of the intelligent algorithms that more advances have been able to achieve. Although the aforementioned techniques offer better results, their usage is limited due to dimensionality problems, and the increase of the system and corresponding complexity of the problem affects the quality of the results of the objective function [18,19].
In the traditional structure, the UC was controlled only by a central authority, which aimed at the level of integration of the various generators controlled by a single authority, so that the amount of energy produced was that demanded by the load within a given period of time and for the lowest cost of operation. In liberalized markets, production companies (PCs) control the production resources, and the UC problem is also solved by these companies within the market framework. The purpose of the UC solution, from the viewpoint of the PCs, is simply to maximize the profits, and meeting the load requirements is the responsibility of the Independent System Operator (ISO). Thus, the PCs are responsible for providing their strategy of participation in the energy market a day before the current dispatch plan, taking into account several factors, such as the load forecast or renewable resources [20,21].
For instance, [22] presented an UC problem that considered the uncertainty of load and wind power generation using a chance-constrained two-stage stochastic programming model to reduce the probability of load imbalance, Big-M and Benders’ decomposition method with a bilinear mixed integer formulation of chance constraints.
In [23], an improved version of GA was presented with an optimization technique, called an Imperialist Competitive Algorithm (ICA), to solve the UC problem in order to maximize profits. To reduce the computational complexity and improve the convergence of the solution, a method was proposed to obtain initial solutions based on the improved coding, which replaced the traditional binary coding.
In [24], the optimal UC was determined in order to maximize the profit by keeping emissions below a certain limit. As in [23], the proposed work was presented that used the ICA technique to perform the UC, although using an emission-related penalty factor. In [24], a methodology was proposed from a probabilistic perspective, to solve the UC. In this UC model, a probabilistic economic dispatch (ED) with priority list (PL) were combined to represent the various variables of interest, such as the power produced by thermal units, production cost, revolving reserve, power requirements that are not met, or excess energy produced, through their probability distribution function (PDF), which gave an analytical treatment to the UC problem in terms of uncertainty.
In [21], the impact of ESS on UC was analyzed, and it was concluded that these systems help to improve reliability, flexibility, and efficiency in the ES. When the power system faces peak loads that are greater than the capacity of the staggered units, these systems reduce the need to add further units to satisfy the load. The variation of the load profile is also decreased, thus increasing the load in those periods when the load is smaller, and reducing the number of inputs and outputs of production units. The study in [10] proposed a method for the inclusion of UC and ESS systems, taking into account the effects of thermal and wind energy, power converters, load control, and battery discharge. The method was composed of two steps: first, the UC was solved without integration of the ESS, and then, in the second step, with the knowledge of all the available energy to charge the batteries, making the UC with the integration of ESS. Moreover, the problem was extended through a probabilistic method by analysis of renewable energy integration [25].
In [26], the ESS was integrated into the UC through the pumping technology, and an integration of an artificial binary sheep algorithm was designed to improve the optimization performance, which was based on the social behavior of a flock of sheep. In [27], a cost-based UC was proposed, and an optimization approach to the design of ESS based on batteries of a microgrid with wind power potential, with the uncertainty of this type of energy being considered as a constraint. In order to minimize the total cost and maximize the benefit, the PSO algorithm was used, considering scenarios with and without ESS, and with or without connections to the main network.
The ED can be considered a sub-problem of the UC since it only dispatches those units that are already affected for a certain period. The ED can have several variations, such as convex economic dispatch (CED), non-convex economic dispatch (NCED), economic emission dispatch (EED), and combined emission economic dispatch (CEED) [28]. There are several methods to solve ED, and more recent methods, such as GA, PSO, evolutionary programming, tabu search, NN, and ant colony optimization have been increasingly explored and show better results than traditional methods, such as LR, nonlinear programming, or dynamic programming. The aforementioned methodologies have their advantages and disadvantages, but PSO has been the method that has attracted the most attention as the best tool to solve these problems [29].
In [30], a PSO algorithm was proposed with some changes in the velocity set, which improved the PSO performance. When compared with the traditional PSO, the proposed method gave better results, proving that it can be applied to other optimization problems. As in the case of the UC problem, the PCs also solve the ED problem, with the goal of increasing profits in an electricity market environment [31]. In [32], a variation of a traditional PSO was also proposed to solve the ED problem, in which a more realistic swarm behavior was introduced, promoting better communication among several solutions through the inertia of the swarm weights. When the algorithm stagnates, a genetic algorithm-like mutant operator goes into operation. In [33], using a state-space model predictive control, the dispatch of wind energy with ESS in South Australia was examined.
Moreover, in [34], an ED strategy was divided into two phases, based on ESS and renewable energy potential; in the first phase, a stochastic UC was formulated with wind power uncertainty prediction combined with ESS, while in the second phase, the first step of the solution was used to determine the ED with a flexible ESS scheduling. In [35], a dynamic economic emission dispatch (DEED) with ESS integration and a load side control program was proposed to analyze the costs, emission, and use of wind energy. The integration of these two solutions allowed for a greater integration of wind energy, and consequently minimized production costs and GHG emissions. Moreover, a stochastic programming model to optimize the performance of a small smart grid was proposed in [36] to minimize operational costs and GHG emissions in the short term.
In [37], the DR program was integrated into the dynamic ED to reduce the operating costs and GHG emissions, based on a wind farm. The method was applied to 10 unit test systems with three types of DR, with the least costly DR being the first to be selected. As the state-of-the-art research shows, the UC and ED are fundamental tools for the reliable operation of the ES; they make the ES a better optimized, cleaner, and safer system, even on a small scale, as islanded power systems show [38].

1.3. Objectives and Manuscript Organization

In this work, a scheduling model is proposed that considers the integration of wind and solar resources in an insular system with a strong conventional generation basis. This study aims to show the benefits of increasing the integration of renewable energy resources in this insular power system, and the objectives involve the minimum time that conventional generation is in operation, maximization of profits, reduction of production costs, and consequently, a reduction in GHG emissions, when compared with the real scheduling profile existing in this islanded ES.
To this end, the proposed approach considers the UC and scheduling problem for conventional generation and renewable production, together with random conditions of solar and wind power and load, taking as a real case study an islanded power system in Portugal. Mixed integer quadratic programming (MIQP) is used to model the system, and the CPLEX ensemble on the general algebraic modeling system (GAMS)® [39] is used to solve the problem.
The remaining manuscript is organized in the following sections: the proposed methodology together with the mathematical formulation to describe the problem is presented in Section 2; Section 3 shows the case study and details considered to validate the proposed model, together with the main results analysis; finally, the main conclusions are presented in Section 4.

2. Proposed Methodology

As stated above, renewable and endogenous energy sources have gained greater prominence, and their large-scale integration into conventional ES is a major concern today. The potential of renewable endogenous energy is considered as essential for sustainability and reducing footprint impact, and it is necessary to integrate all of the available production of renewable energy in order to reduce the production of conventional generation, while reducing the operational costs and GHG emissions, thus ensuring a diversity of electricity production [2].
In the particular case of island power systems, the problem as a whole is intensified. Due to their physical isolation, the production costs of thermal units are much higher because of the high cost of transportation, transformation, and storage of fossil fuels. However, the features of these island power systems allow access to various sources of endogenous renewable energy. If these systems can make the most of the available resources of the island, they can improve their energy production costs, and have a positive impact on the economic and social development of the island [38].
For the UC and scheduling problem with conventional generation and renewable production, an objective function is defined which integrates all of the costs of the production units, including their starting cost and the cost of the fuel used, in order to compute the total cost of production of each existing combination. In the first step, it is necessary to define the various constraints on the system, such as the limits of production, the limitations of the ramps of the producing units, the satisfaction of the load requirements, and the reserve, in order to guarantee the system’s reliability and robustness.
In the second step of renewable energy integration, it is necessary to create extra restrictions for each type of renewable energy to be integrated, thus ensuring that the result of the ED renewable production is equal or lower than the availability of the resource that is considered. Finally, as a third step, it is necessary to input the different ES data where the algorithm will be applied, such as the type, number, and characteristics of the generators, the desired reserve, and considered random scenarios of wind and photovoltaic power and load, which may be produced by a forecast tool, and therefore is another uncertainty to be considered in the problem.
The objective function of the UC is the minimization of production costs, where the renewable production units will be the first to be scaled due to their reduced operating cost; these form the basis of the production diagram, and the thermal generation completes the load diagram.
As reported in state-of-the-art research, the UC problem generally uses a quadratic formulation involving the fuel cost of the corresponding production and certain constraints, such as starting cost and ramping. In this work, the proposed UC and scheduling problem is solved based on:
m i n { T C = t = 1 T g = 1 G ( a g I g t + b g P g t + c g ( P g t ) 2 ) × f u e l + ( S T g t ( 1 S g t 1 ) S g t ) }
where T C is the total operating and I g t is the binary status of unit g at time t , i.e., (1—On; 0—Off).
The starting cost S T g t , due to some limitation of the solver used, needs to be linearized, and based on [40,41] it can be represented:
S T g t = H S C g × y t + ( C S C g H S C g ) S S U g t
S g t S g t 1 = y t z t
y t + z t 1
S S U g t y t + ε 1 × ( 1 + w t 1 H S g ) 1 ε 2
w t w t 1 + 1
w t + ( 1 + B H S g ) × y t w t 1 + 1
w t B H S g × ( 1 y t ) 0
w t 0
where B H S g is a large number (maximum time that generator g can be Off). All of the generators have production limits, and when generator g is committed, it is necessary to ensure that these minimum and maximum limits are not exceeded, here represented in Mega Watt (MW):
P g m i n I g t P g t P g m a x I g t
The technologies that are used in the operation of the ES have limitations on the sudden variation of energy production, and even between periods, production variations are limited. The following equations model these ramping constraints:
P g t P g t 1 U R g I g t + S U R g ( 1 I g t 1 ) , I g t = 1 ;   I g t 1 = 1
P g t 1 P g t D R g + S D R ( 1 I g t ) , I g t = 1 ;   I g t 1 = 1
There are also the startup and shutdown ramps ( S U R g and S D R g ), which usually provide similar information of the ramp-up and ramp-down constraints:
P g t S U R g + P g m i n ( 1 I g t 1 ) , I g t = 1 ;   I g t 1 = 0
P g t S D R g + P g m i n ( 1 I g t + 1 ) , I g t = 1 ;   I g t + 1 = 0
Spinning reserve is an instrument that provides some flexibility to the ES, making it able to cope with unexpected situations, such as unexpected load peaks or production failures. In this sense, the up-pinning reserve is implemented by Equation (15), and down-spinning reserve is considered in Equation (16), taking into account the effects of the conventional ramping constraints:
g = 1 G P g t , m a x I g t g = 1 G P g t I g t R u p , I g t = 1
g = 1 G P g t I g t g = 1 G P g m i n I g t R d o w n , I g t = 1
In this sense, the spinning reserve is fixed by the assumption:
R = ( δ ) L t
where δ is the rate of desired reserve from the uncertainty of renewable production, i.e., from the forecasted error of wind, solar, and load power, obtained by sensitive analysis. Moreover, it is required the guarantee of balance between total power production and consumption, which is described:
g = 1 G P g t I g t = L t , I g t = 1
Another limitation from power generation is the time that generators need to be online and offline. The minimum down-time ( M D T g , in hours), and the minimum up-time ( M U T g , in hours), can be represented as:
t = t + 2 t + M U T g ( 1 I g t ) + M U T g ( I g t I g t 1 ) M U T g
t = t + 2 t + M U T g I g t + M D T g ( I g t 1 I g t ) M D T g
As the literature shows, most renewable resources are dependent on climatic conditions, such as wind speed and related variables, and solar radiation [38]; it is therefore necessary to establish restrictions that check the production of this type of energy depending on the availability of the dependent resources, using the following equations to represent the restrictions on wind and photovoltaic production, respectively, in accordance with their uncertainty and forecasting errors:
0 e = 1 E W e t W m a x t
0 s = 1 S S s t S m a x t
For the integration of the aforementioned renewable production into the proposed program code, the renewable generators are assumed to be conventional generators, i.e., with operational constraints where the restrictions in Equations (21) and (22) are applied only to the renewable electricity production. Moreover, in this study, power losses and power flow restrictions are not considered, due to the absence of reliable data from the system operator [42]. For the same reason, there is no data for the accurate calculation of the emission, and in this work, a comparison of results is therefore assumed, whereby if conventional generation is reduced while meeting all of the production constraints, the reduction in GHGs will reflect the reduction in conventional power [43].

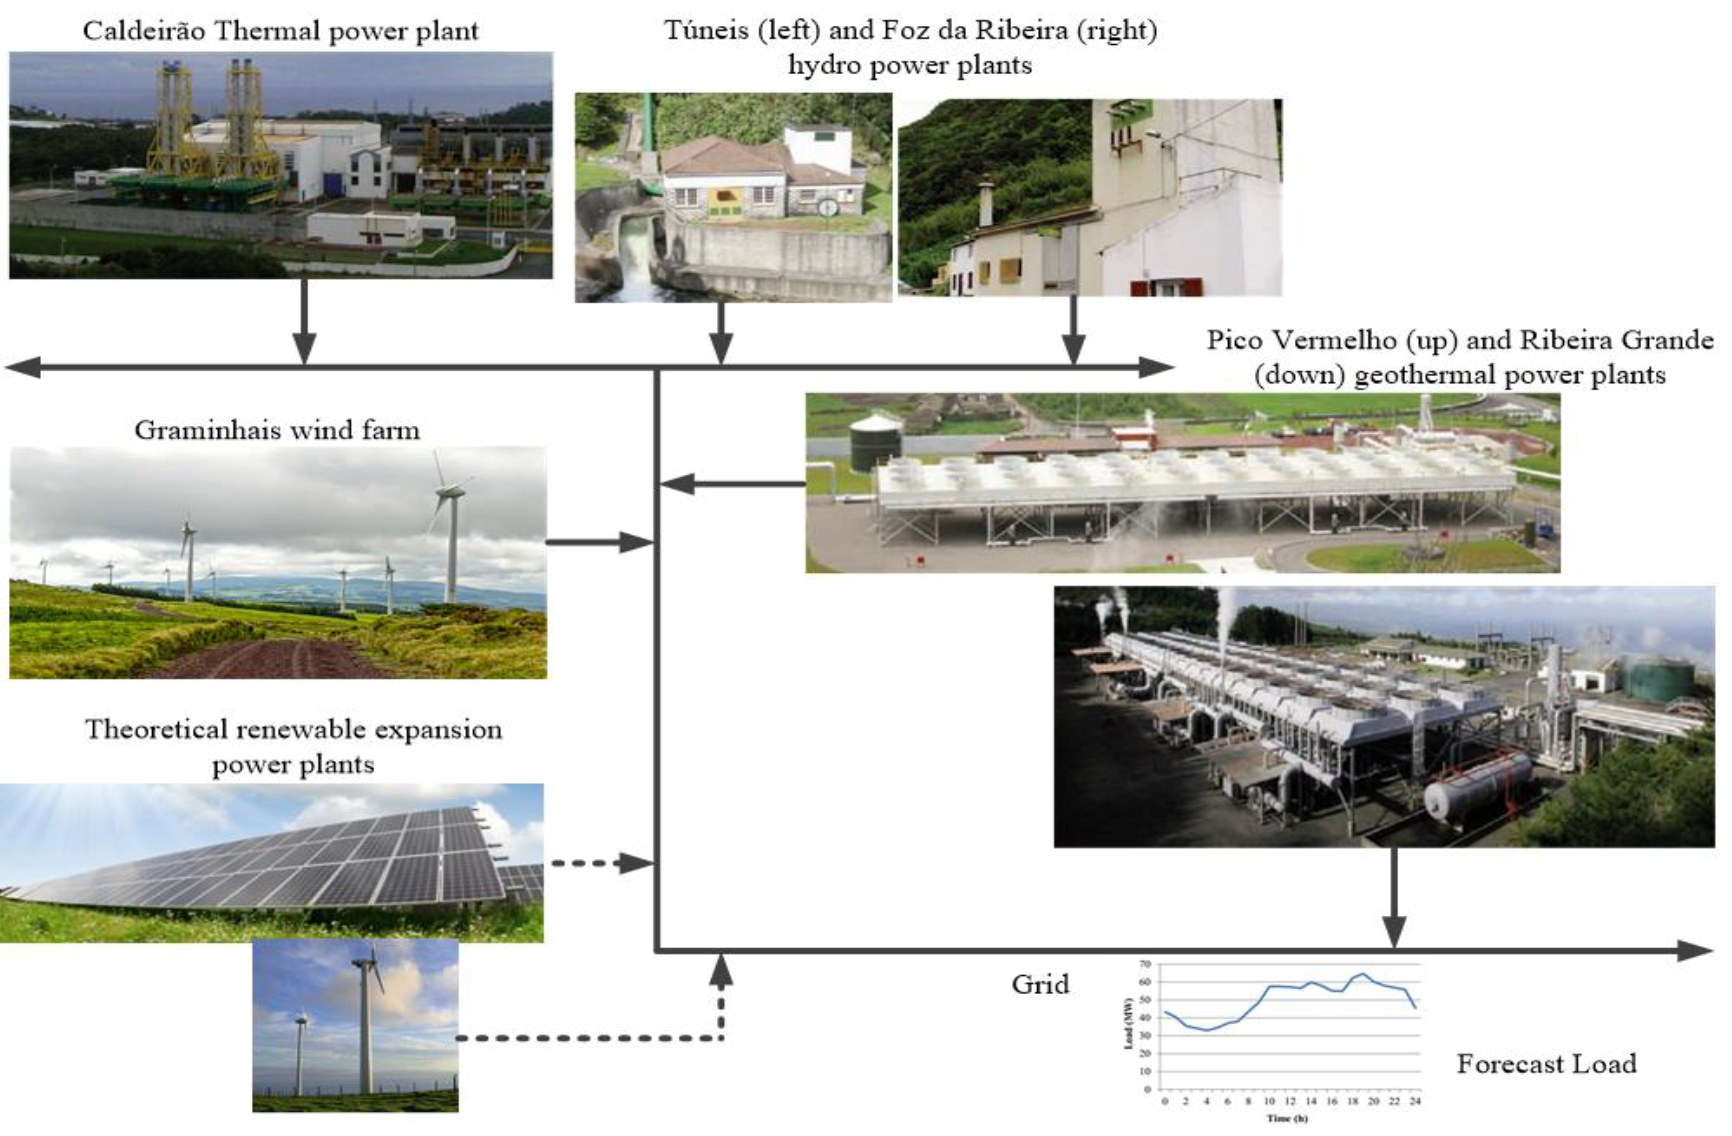
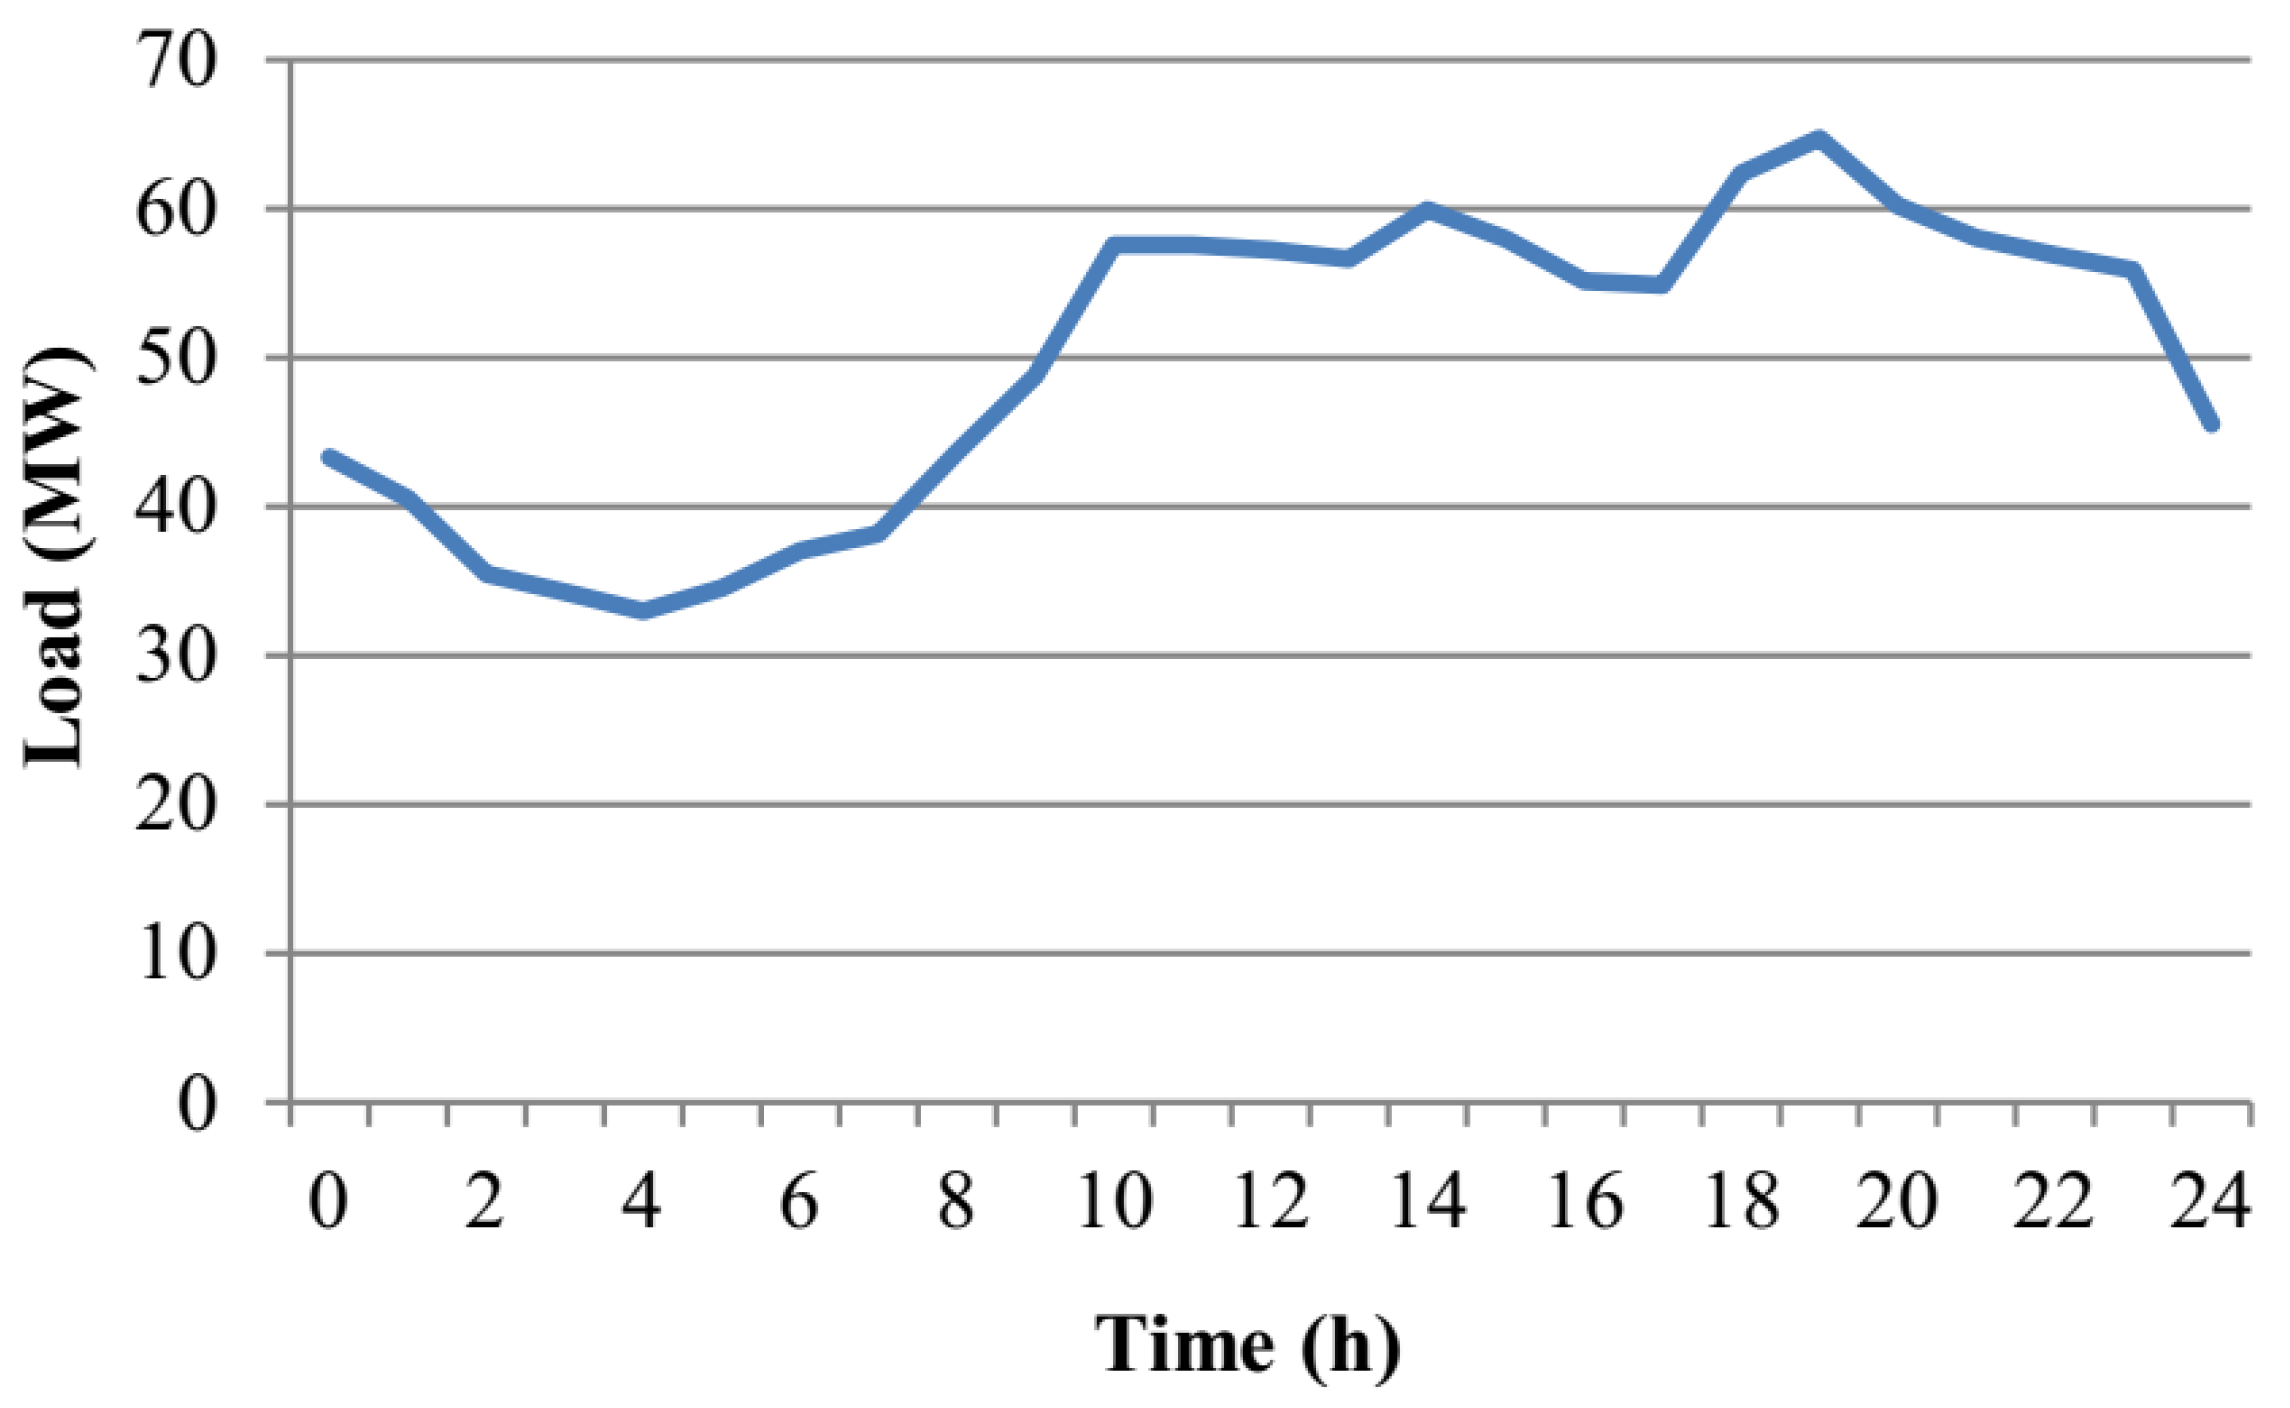
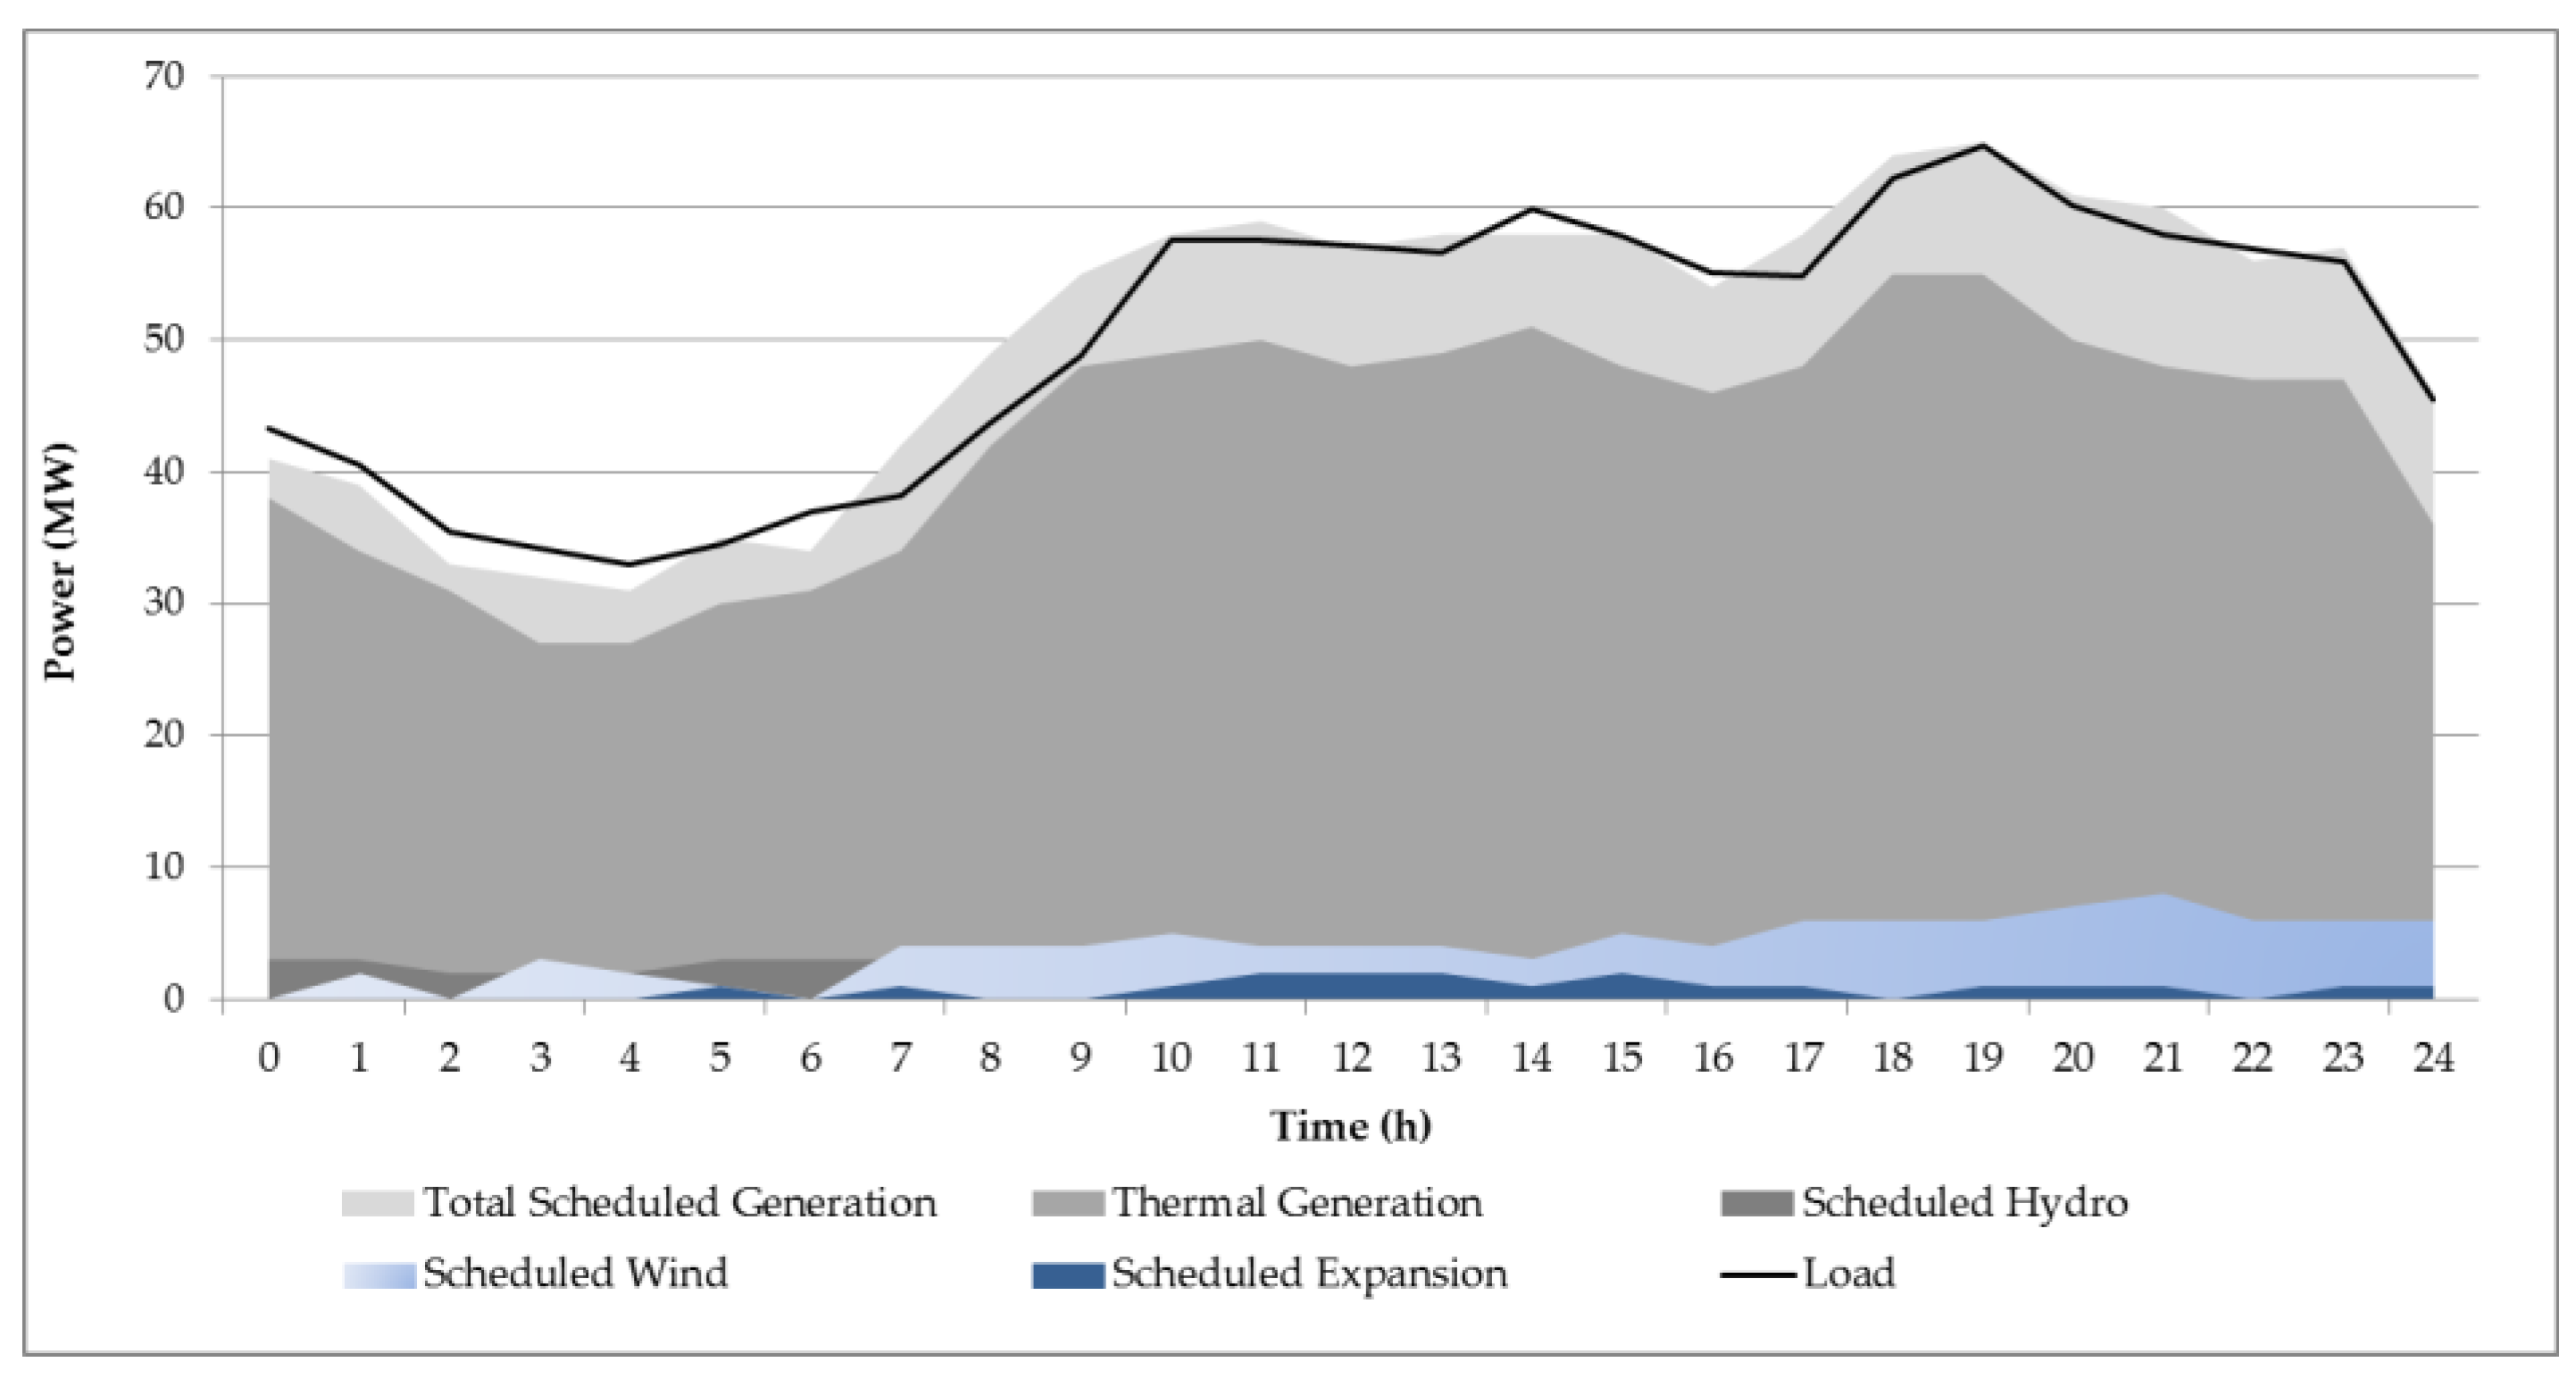
3. Case Study and Results

The case study where the proposed methodology was tested involves the ES of the São Miguel Island, Azores. This island is the largest of the Azores archipelago; it has a larger population and it is more developed than the rest of the group of islands, and consequently presents greater energy dependence, due to the scarcity of certain natural resources. It therefore imports many petroleum products, which represents a negative aspect of the social and economic development of the island [44].
Of this fossil energy, 31% is used in the production of electricity and 40% in transportation, demonstrating that these sectors are responsible for more than 70% of fossil energy use, and, consequently, for the GHG emissions from the island [43]. The solution to this problem is to integrate more renewable production in order to reduce production costs, due to the decrease in the use of fossil fuels, with a consequent reduction in the environmental footprint and the increment of benefits in economic and social development of the island. In this case, the power plants considered are summarized in Figure 1:
  • the Caldeirão thermal power plant, consisting of 8 fuel oil generators;
  • the Túneis and Foz da Ribeira hydroelectric power plants, which will be considered as one, due to their low installed capacity and similar features;
  • the two geothermal power stations of Pico Vermelho (1 generator) and Ribeira Grande, with 4 generators; and,
  • the Graminhais wind farm, consisting of 10 wind turbines.
In addition to above generation power plants, it will be considered a hypothetical expansion from the installed capacity in the island, in order to have a higher usage of the island’s endogenous resources, by considering the following assumptions:
  • increase the Graminhais wind farm with two more wind turbines, with similar wind-driven machines specifications from those already installed; and,
  • consideration of a small photovoltaic production, which could be a set of production coming from domestic/micro generation production together with a small/industrial photovoltaic power plant.
The features of the thermal power station, the two geothermal plants and the wind farm are shown in Table 1 [42,45,46]. The theoretical features of the wind farm expansion and the photovoltaic expansion are given in Table 2, where wind turbines were considered to be more similar than those described in Table 1. Photovoltaic generation represents the possible total micro-generation connected to the grid without solar tracking technology.
Due to the problem of symmetry (i.e., the large number of similar generation units), the specification costs were adjusted using sensitive analyses to help the optimization tool recognize the effective number of units as different, thus reducing the computational time required by the optimization tool.
The fuel oil used by conventional generation has a cost of 0.847 ($/L) [47] and has a reserve rate of δ = 10 % . The estimated profiles of load, wind power [48], and photovoltaic power [49] were taken as the expected data, and are shown in Figure 2 and Figure 3, respectively.
It should be stated that fuel cost includes storage and transportation costs, government taxes and GHG emission taxes. Initially, the proposed scheduling model only considered power plants with greater capacity, i.e., the Caldeirão thermal power plant, the hydroelectric plant and the two geothermal power plants. Then, the proposed scheduling model introduced the Graminhais wind farm and the hypothetical expansion. Finally, the obtained results were compared, including total generation costs, computational effort, and rate of renewable production.
The proposed UC and scheduling approach was performed using GAMS_24.1.2_ [39] and the MIQP/CPLEX solver. The hardware used was an Intel® Core(TM)2 Duo CPU E7200, with 2.53 GHz and 4 GB of RAM, running on Windows 7 Professional®. The scheduling results of the first case are shown in Table 3. For only those power plants with higher capacity, the total generation cost reached $13,885.82 with a gap of 9.35%. The computational time was reduced, reaching the solution in 7.92 s on average.
For the inclusion of the Graminhais wind farm and the theoretical expansion and an increase in the number of renewable units of the system, the corresponding scheduling is shown in Table 4. The total generation costs are $12,846.00 with a gap of 7.12%. The computational time was also acceptable, reaching the solution in 8.22 s on average.
In the second case, with greater integration of renewable production, the total costs of operation are lower, with total thermal production going from 641.30 MW in the first case, to 538.78 MW in the second, representing a decrease of about 16%. In terms of computational effort, it is shown that for more generator units, the time to reach the solution is naturally higher. However, this is acceptable in the context of the problem.
By analyzing the scheduled results, it is possible to observe that the geothermal and hydro units form the basis of the load diagram, being committed in the whole day. When wind and solar energy production are included, these are used whenever possible, and deliver the maximum of renewable production to the system. The thermal units serve to satisfy the complementary requirements of the system, as shown in Figure 4, where the different profiles of thermal production on a winter’s day are shown; these are very similar to the profile of the load for the same period.
Figure 5 shows the decrease in thermal production with an increase of integration of renewable production. It is possible to observe that conventional generation decreases from 50% to 42%, which is a marked reduction; renewable integration (wind, PV, and hydro generation) represents 15% of the total generation.
Figure 6 shows how all types of generation are scheduled during the day. It is possible to analyze the influence of the variability and uncertainty of renewable generation, which may be reduced, for instance, by considering the flexibility of the energy storage system.
Finally, Figure 7 shows the benefits of the model against the results reported by the ES operator on the same day. It is thus possible to observe that the proposed model propose more wind generation (the scheduling process), in opposition with the real wind dispatched (from ES operator point-of-view), which reflects conventional thermal generation reduction.

4. Conclusions

This study addresses the optimal scheduling problem with the goal of maximizing the integration of renewable production with reduced operational cost. The application of this tool to the energy system of São Miguel Island, Azores, shows that optimizing and maximizing the integration of renewable energy reduces the amount of fuel consumption, decreases the production costs, and consequently, the GHG emissions, and thereby increases the sustainable economy of the island and promotes its social and economic development. The decrease of 29% in production costs represents a significant saving, and a reliable solution is found by the algorithm, which is essential in real applications today.

Acknowledgments

This work was supported by FEDER funds through COMPETE 2020 and by Portuguese funds through FCT, under Projects SAICT-PAC/0004/2015—POCI-01-0145-FEDER-016434, POCI-01-0145-FEDER-006961, UID/EEA/50014/2013, UID/CEC/50021/2013, UID/EMS/00151/2013, and SFRH/BPD/103079/2014. Also, the research leading to these results has received funding from the EU Seventh Framework Programme FP7/2007-2013 under grant agreement no. 309048. Moreover, the authors would like to acknowledge the contributions of Marcos D. B. Silva.

Author Contributions

All authors have worked on this manuscript together and all authors have read and approved the final manuscript.

Conflicts of Interest

The authors declare no conflict of interest.

Nomenclature

a g Constant parameter of operational curve line of generator g.
b g Linear parameter of operational curve line of generator g.
B H S g Maximum number of hours that generator g can be OFF.
c g Quadratic parameter of operational curve line of generator g.
D R g Ramp-down rate of generator g.
e Wind generator index, e = 1 ,   2 ,   ,   E .
f u e l Fuel cost value.
g Conventional generator index, g = 1 ,   2 ,   ,   G .
H S C g Hot starting cost of generator g.
H S g Number of hours that generator g is OFF before it is considered in the cold/hot condition.
I g t Operational binary matrix of generator g at time t (1 = ON, 0 = OFF).
L t Forecasted load at time t.
M D T g Minimum down-time of generator g.
M U T g Minimum up-time of generator g.
P g m a x Maximum power of generator g.
P g m i n Minimum power of generator g.
P g t , m a x Maximum power of generator g at time t to fulfill the required reserve R.
P g t Power output from generator g at time t.
R Available reserve.
R u p Up-spinning reserve.
R d o w n Down-spinning reserve.
s Photovoltaic generator index, s = 1 ,   2 ,   ,   S .
S D R g Starting ramp-down rate of generator g.
δ Expected rate of reserve desired.
S S U g t Binary variable with the heat state of generator g at time t.
S m a x t Maximum forecasted solar power at time t.
S s t Solar production by the solar generator s at time t.
S g t 1 Overall starting cost of generator g at previous time t − 1
S T g t Overall starting cost of generator g at time t
S U R g Starting ramp-up rate of generator g.
t Time index, t = 1 ,   2 ,   ,   T .
T C Total cost objective function.
U R g Ramp-up rate of generator g.
w t Number of hours t that generator g has been decommitted from last shut-down till time t.
w t 1 Number of hours t that generator g has been decommitted from the last shut-down till previous time t − 1.
W e t Wind production by the wind generator e on time t.
W m a x t Maximum forecasted wind power at time t.
y t Auxiliary binary variable at time t.
z t Auxiliary binary variable at time t.

References

  1. International Energy Agency (OECD/EIA). Energy Climate Change and Environment: 2016 Insights; International Energy Agency (OECD/EIA): Paris, France, 2016; p. 133. [Google Scholar]
  2. World Energy Council. World Energy Issues Monitor 2017: Exposing the New Energy Realities; World Energy Council: London, UK, 2017; p. 156. [Google Scholar]
  3. Vagropoulos, S.I.; Kardakos, E.G.; Simoglou, C.K.; Bakirtzis, A.G.; Catalão, J.P.S. ANN-based scenario generation methodology for stochastic variables of electric power systems. Electr. Power Sustain. Res. 2016, 134, 9–18. [Google Scholar] [CrossRef]
  4. Simoglou, C.K.; Bakirtzis, E.A.; Biskas, P.N.; Bakirtzis, A.G. Optimal operation of insular electricity grids under high RES penetration. Renew. Energy 2016, 86, 1308–1316. [Google Scholar] [CrossRef]
  5. U.S. Energy Information Administration Report. International Energy Outlook 2016 with Projection to 2040; U.S. Energy Information Administration: Washinton DC, USA, 2016; p. 290. Available online: http://www.eia.gov/forecast/ieo# (accessed on 6 February 2017).
  6. European Union. Directorate-General for Internal Policies. Policy Department A: Economic and Scientific Policy. In European Energy Industry Investments; European Union: Brussels, Belgium, 2017. [Google Scholar]
  7. Erdinç, O.; Paterakis, N.G.; Catalão, J.P.S. Overview of insular power systems under increasing penetration of renewable energy sources: Opportunities and challenges. Renew. Sustain. Energy Rev. 2015, 52, 333–346. [Google Scholar] [CrossRef]
  8. Luickx, P.J.; Delarue, E.D.; D’haeseleer, W. D. Impact of large amounts of wind power on the operation of an electricity generation system: Belgian case study. Renew. Sustain. Energy Rev. 2010, 14, 2019–2024. [Google Scholar] [CrossRef]
  9. Katzenstein, W.; Apt, J. The cost of wind power variability. Energy Policy 2012, 51, 233–243. [Google Scholar] [CrossRef]
  10. Osório, G.J.; Rodrigues, E.M.G.; Lujano-Rojas, J.M.; Matias, J.C.O.; Catalão, J.P.S. New control strategy for the weekly scheduling of insular power systems with a battery storage system. Appl. Energy 2015, 154, 459–470. [Google Scholar] [CrossRef]
  11. Osório, G.J.; Lujano-Rojas, J.M.; Matias, J.C.O.; Catalão, J.P.S. A new scenario generation-based method to solve the unit commitment problem with high penetration of renewable energies. Int. J. Electr. Power Energy Syst. 2015, 64, 1063–1072. [Google Scholar] [CrossRef]
  12. Osório, G.J.; Lujano-Rojas, J.M.; Matias, J.C.O.; Catalão, J.P.S. A fast method for the unit scheduling problem with significant renewable power generation. Energy Convers. Manag. 2015, 94, 178–189. [Google Scholar] [CrossRef]
  13. Jia, B.; Yuan, X.; Li, X.; Huang, Y.; Li, W. Application of quantum-inspired binary gravitational search algorithm for thermal unit commitment with wind power integration. Energy Convers. Manag. 2014, 87, 589–598. [Google Scholar] [CrossRef]
  14. Quan, H.; Srinivasan, D.; Khosravi, A. Integration of renewable generation uncertainties into stochastic unit commitment considering reserve and risk: A comparative study. Energy 2016, 103, 735–745. [Google Scholar] [CrossRef]
  15. Zhang, Y.; Wang, J. K-nearest neighbors and a kernel density estimator for GEFCom2014 probabilistic wind power forecasting. Int. J. Forecast. 2016, 32, 1074–1080. [Google Scholar] [CrossRef]
  16. Simoglou, C.K.; Kardakos, E.G.; Bakirtzis, E.A.; Chatzigiannis, D.I.; Vagropoulos, S.I.; Ntomaris, A.V.; Biskas, P.N.; Gigantidou, A.; Thalassinakis, E.J.; Bakirtzis, A.G.; et al. An advanced model for the efficient and reliable short-term operation of insular electricity networks with high renewable energy sources penetration. Renew. Sustain. Energy Rev. 2014, 38, 415–427. [Google Scholar] [CrossRef]
  17. Abujarad, S.Y.; Mustafa, M.W.; Jamian, J.J. Recent approaches of unit commitment in the presence of intermittent renewable energy resources: A review. Renew. Sustain. Energy Rev. 2017, 70, 215–223. [Google Scholar] [CrossRef]
  18. Venkata SubbaReddy, G.; Ganesh, R.V.; Rao, C.S. Implementation of clustering based unit commitment employing imperialistic competition algorithm. Int. J. Electr. Power Energy Syst. 2016, 82, 621–628. [Google Scholar]
  19. Yu, X.; Zhang, X. Unit commitment using Lagrangian relaxation and particle swarm optimization. Int. J. Electr. Power Energy Syst. 2014, 61, 510–522. [Google Scholar] [CrossRef]
  20. Sudhakar, A.V.V.; Karri, C.; Laxmi, A.J. Profit based unit commitment for GENCOs using Lagrange relaxation-differential evolution. Eng. Sci. Technol. Int. J. 2017, 20, 738–747. [Google Scholar] [CrossRef]
  21. Columbus, C.C.; Simon, S.P. Profit based unit commitment for GENCOs using parallel NACO in a distributed cluster. Swarm Evol. Comput. 2013, 10, 41–58. [Google Scholar] [CrossRef]
  22. Zhang, Y.; Wang, J.; Zeng, B.; Hu, Z. Chance-constrained two-stage unit commitment under uncertain load and wind power output using bilinear Benders decomposition. IEEE Trans. Power Syst. 2017, 32, 3637–3647. [Google Scholar] [CrossRef]
  23. Ghadi, M.J.; Baghramian, A.; Imani, M.H. An ICA based approach for solving profit based unit commitment problem market. Appl. Soft Comput. 2016, 38, 487–500. [Google Scholar] [CrossRef]
  24. Ghadi, M.J.; Itami Karin, A.; Baghramian, A.; Hosseini Imani, M. Optimal power scheduling of thermal units considering emission constraint for GENCOs’ profit maximization. Int. J. Electr. Power Energy Syst. 2016, 82, 124–135. [Google Scholar] [CrossRef]
  25. Lujano-Rojas, J.M.; Osório, G.J.; Catalão, J.P.S. New probabilistic method for solving economic dispatch and unit commitment problems incorporating uncertainty due to renewable energy integration. Int. J. Electr. Power Energy Syst. 2016, 78, 61–71. [Google Scholar] [CrossRef]
  26. Wang, W.; Li, C.; Liao, X.; Qin, H. Study on unit commitment problem considering pumped storage and renewable energy via a novel binary artificial sheep algorithm. Appl. Energy 2017, 187, 612–626. [Google Scholar] [CrossRef]
  27. Khorramdel, H.; Aghaei, J.; Khorramdel, B.; Siano, P. Optimal battery sizing in microgrids using probabilistic unit commitment. IEEE Trans. Ind. Inform. 2016, 12, 834–843. [Google Scholar] [CrossRef]
  28. Jebaraj, L.; Venkatesan, C.; Soubache, I.; Rajan, C.C.A. Application of differential evolution algorithm in static and dynamic economic or emission dispatch problem: A review. Renew. Sust. Energy Rev. 2017, 77, 1206–1220. [Google Scholar] [CrossRef]
  29. Mahor, A.; Prasad, V.; Rangnekar, S. Economic dispatch using particle swarm optimization: A review. Renew. Sustain. Energy Rev. 2009, 13, 2134–2141. [Google Scholar] [CrossRef]
  30. Sun, Y.; Wang, Z. Improved particle sward optimization based dynamic economic dispatch of power system. In Proceedings of the International Conference on Sustainable Materials Processing and Manufacturing, Skukuza, South Africa, 23–25 January 2017; Kruger: Skukuza, South Africa, 2017. [Google Scholar]
  31. Gao, F.; Sheble, G.B.; Hedman, K.W.; Yu, C.-N. Optimal bidding strategy for GENCOs based on parametric linear programming considering incomplete information. Int. J. Electr. Power Energy Syst. 2015, 66, 272–279. [Google Scholar] [CrossRef]
  32. Modi, M.K.; Swarnkar, A.; Gupta, N.; Niazi, K.R.; Bansal, R.C. Stochastic economic load dispatch with multiple fuels using improved particle swarm optimization. IFAC-PaperOnLine 2015, 48, 490–494. [Google Scholar] [CrossRef]
  33. Tarca, S.; Roughan, M.; Ertugrul, N.; Bean, N. Dispatchability of wind power with battery energy storage in South Australia. Energy Procedia 2017, 110, 223–228. [Google Scholar] [CrossRef]
  34. Li, N.; Uçkun, C.; Constantinescu, E.M.; Birge, J.R.; Hedman, K.W.; Botterud, A. Flexible operation of batteries in power systems scheduling with renewable energy. IEEE Trans. Sustain. Energy 2016, 7, 685–696. [Google Scholar] [CrossRef]
  35. Alham, M.H.; Elshahed, M.; Ibrahim, D.K.; Abo El Zahab, E.E.D. A dynamic economic emission dispatch considering wind power uncertainty incorporating energy storage system and demand side management. Renew. Energy 2016, 96, 800–811. [Google Scholar] [CrossRef]
  36. Aghajani, G.R.; Shayanfar, H.A.; Shayeghi, H. Demand side management in a smart micro-grid in the presence of renewable generation and demand response. Energy 2017, 126, 622–637. [Google Scholar] [CrossRef]
  37. Xing, H.; Cheng, H.; Zhang, L. Demand response based and wind farm integrated economic dispatch. CSEE J. Power Energy Syst. 2015, 1, 37–41. [Google Scholar] [CrossRef]
  38. Catalão, J.P.S. Smart and Sustainable Power Systems: Operations, Planning and Economics of Insular Electricity Grids; CRC Press: Boca Raton, FL, USA, 2015; p. 439. [Google Scholar]
  39. General Algebraic Modeling System (GAMS)—Cutting Edge Modeling. Available online: https://www.gams.com/ (accessed on 27 March 2017).
  40. Arroyo, J.M.; Conejo, A.J. Optimal response of a thermal unit to an electricity spot market. IEEE Trans. Power Syst. 2000, 15, 1098–1104. [Google Scholar] [CrossRef]
  41. Shafie-khah, M.; Parsa Moghaddam, M.; Sheikh-El-Eslami, M.K. Unified solution of a non-convex SCUC problem using combination of modified branch-and-bound method with quadratic programming. Energy Convers. Manag. 2011, 52, 3425–3432. [Google Scholar] [CrossRef]
  42. Eletricidade dos Açores Açores Sa (EDA). Relatório e Contas: Em Harmonia com a Natureza; GLOBALEDA: Azores, Portugal, 2015; p. 246. (In Portuguese) [Google Scholar]
  43. Heydarian-Forushani, E.; Golshan, M.E.H.; Siano, P. Evaluating the benefits of coordinated emerging flexible resources in electricity markets. Appl. Energy 2017, 199, 142–154. [Google Scholar] [CrossRef]
  44. Ilić, M.; Xie, L.; Liu, Q. Engineering IT-Enabled sustainable electricity services: The tale of two low-cost green azores islands. In Power Electronics and Power System; Springer: New York, NY, USA, 2013; p. 558. [Google Scholar] [CrossRef]
  45. Eletricidade dos Açores Açores Sa (EDA). Caracterização das Redes de Transporte e Distribuição de Energia Eléctrica da Região Autónoma dos Açores; EDA: Azores, Portugal, 2014; p. 388. [Google Scholar]
  46. ENERCON—Energy for the World. Available online: http://www.enercon.de/en/products/ep-1/e-44/ (accessed on 27 March 2017).
  47. Trading Economics. Available online: http://tradingeconomics.com/commodity/heating-oil (accessed on 27 March 2017).
  48. SMARTWATT—Solution for Energy Systems. Available online: http://smartwatt.net/SingularWeb/#/home/azores (accessed on 27 March 2017).
  49. Renewable Forecast. Available online: https://www.renewables.ninja/# (accessed on 27 March 2017).
Figure 1. Main São Miguel Island power plants under study.
Energies 11 00144 g001
Figure 2. Winter load forecast profile in a single day of 2014.
Energies 11 00144 g002
Figure 3. Winter wind power and photovoltaic power forecasts profiles in a single day of 2014.
Energies 11 00144 g003
Figure 4. Thermal diagram comparison with load diagram.
Energies 11 00144 g004
Figure 5. Comparison between schedule without/with Graminhais wind farm and theoretical renewable integration expansion.
Energies 11 00144 g005
Figure 6. Scheduled diagram of all generation under study.
Energies 11 00144 g006
Figure 7. Comparison results between real dispatched and proposed scheduled.
Energies 11 00144 g007
Table 1. Main Features of the Power System under Analysis [42,45,46].
GXi P m i n g (MW) P m a x g (MW) a g ($/h) b g ($/MWh) c g × 10−4 ($/MW2h) D R g (MW/h) U R g (MW/h) M U T g (h) M D T g (h) C S C g ($) H S C g ($)
GTher13.867.202650.01620.1000.2850.2850.5000.50056.0028.00
GTher23.857.202640.01610.1000.2850.2850.5000.50056.0028.00
GTher33.857.202640.01610.1000.2850.2850.5000.50056.0028.00
GTher43.857.202640.01610.1000.2850.2850.5000.50056.0028.00
GTher58.4216.502680.00820.0300.5500.5500.1330.16750.0025.00
GTher68.4116.502670.00810.0300.5500.5500.1330.16750.0025.00
GTher78.4116.502670.00810.0300.5500.5500.1330.16750.0025.00
GTher88.4216.502680.00820.0300.5500.5500.1330.16750.0025.00
GGeo10.5010.00------0.5000.5000.0170.0176.603.30
GGeo20.502.50------0.5000.5000.0170.0176.303.30
GGeo30.502.50------0.5000.5000.0170.0176.303.30
GGeo40.504.00------0.5000.5000.0170.0176.303.30
GGeo50.504.00------0.5000.5000.0170.0176.303.30
GHydro0.013.005.00----00.0100.0170.017---
GW10.030.908.20----00.0400.0170.017----
GW20.030.908.20----00.0400.0170.017----
GW30.030.908.20----00.0400.0170.017----
GW40.030.908.20----00.0400.0170.017----
GW50.030.908.20----00.0400.0170.017----
GW60.030.908.20----00.0400.0170.017----
GW70.030.908.20----00.0400.0170.017----
GW80.030.908.20----00.0400.0170.017----
GW90.030.908.20----00.0400.0170.017----
GW100.030.908.20----00.0400.0170.017----
Table 2. Main Features of the Power System Expansion under Analysis.
GXi P m i n g (MW) P m a x g (MW) a g ($/h) b g ($/MWh) c g × 10−4 ($/MW2h) D R g (MW/h) U R g (MW/h) M U T g (h) M D T g (h) C S C g ($) H S C g ($)
GWEx10.030.908.20----00.040.0170.017----
GWEx20.030.908.20----00.040.0170.017----
PV0.011.3313.50----00.010.0170.017----
Table 3. Scheduling of generation units with bigger capacity (MW).
Time0123456789101112131415161718192021222324
GTher10000000004444444400000000
GTher24400000000000000000000000
GTher34000000000000000000000000
GTher44000000000000000000000000
GTher50000000800000000000000000
GTher600000000091010101011109121515131211110
GTher70000000888888888888888888
GTher8811988912816910101010111091215151312111111
GGeo1910101010101041010101010101010101010101010101010
GGeo22222222222222222222222222
GGeo32222222222222222222222222
GGeo43444444344444444444444444
GGeo53444444344444444444444444
GHydro3333333333333333333333333
Table 4. Scheduling of generation units with renewable integration and theoretical expansion (MW).
Time0123456789101112131415161718192021222324
GTher10000000000000000000000040
GTher20040000000000000000000000
GTher34000000000000000000000000
GTher40000004440000000000000000
GTher50000000080000000009900000
GTher68000000000000000000000000
GTher700000000010111210111310810881210990
GTher8812888888816161616161616161616161616161214
GGeo1810999109101010101010101010101010101010101010
GGeo22222222222222222222222222
GGeo32222222222222222222222222
GGeo43433343444444444444444444
GGeo53433343444444444444444444
GHydro3322233333333333333333333
GW10000000000000010100101011
GW20001000000000010110110100
GW30001000100010011010111011
GW40100100010100001011111011
GW50000000100111000111010111
GW60001000010101100101111100
GW70100000101010011011011011
GW80000100011111101011001100
GW90000010101000100101110111
GW100000000011101010100110100
GWEx10000000010101101010101100
GWEx20000010100011101101111011
PV0000000000111111000000000

