Article

Evaluation of the Theoretical Geothermal Potential of Inferred Geothermal Reservoirs within the Vicano–Cimino and the Sabatini Volcanic Districts (Central Italy) by the Application of the Volume Method

1
Istituto Nazionale di Geofisica e Vulcanologia (INGV), via di Vigna Murata 605, 00143 Roma, Italy
2
Via Camerano 1, 01028 Orte, Italy
*
Author to whom correspondence should be addressed.
Energies 2018, 11(1), 142; https://doi.org/10.3390/en11010142
Submission received: 27 November 2017 / Revised: 3 January 2018 / Accepted: 4 January 2018 / Published: 6 January 2018
(This article belongs to the Section L: Energy Sources)

Abstract

:
The evaluation of the theoretical geothermal potential of identified unexploited hydrothermal reservoirs within the Vicano–Cimino and Sabatini volcanic districts (Latium region, Italy) has been made on the basis of a revised version of the classical volume method. This method is based on the distribution of the partial pressure of CO2 (pCO2) in shallow and deep aquifers to delimit areas of geothermal interest, according to the hypothesis that zones of high CO2 flux, either from soil degassing and dissolved into aquifers, are spatially related to deep hydrothermal reservoirs. On the whole, 664 fluid discharges (cold waters, thermal waters, and bubbling pools) have been collected from shallow and deep aquifers in the Vicano–Cimino Volcanic District and the Sabatini Volcanic District for chemical and isotopic composition, in an area of approximately 2800 km2. From this large hydro-geochemical dataset the pCO2 values have been computed and then processed to obtain a contour map of its spatial distribution by using geostatistical techniques (kriging). The map of pCO2 has been used to draw up the boundaries of potentially exploitable geothermal systems within the two volcanic districts, corresponding to the areas where endogenous CO2 raise up to the surface from the deep hydrothermal reservoirs. The overall estimated potential productivities and theoretical minimum and maximum thermal power of the two volcanic districts are of about 45 × 103 t/h and 3681–5594 MWt, respectively. This makes the Vicano–Cimino Volcanic District and the Sabatini Volcanic District very suitable for both direct and indirect exploitation of the geothermal resources, in view of the target to reduce electricity generation from conventional and poorly sustainable energy sources.

1. Introduction

In recent decades, the worldwide demand for energy has increased far beyond a critical threshold, with an associated rise in CO2 emissions being observed. In such conditions, the development of a plan focused on non-carbon or reduced-carbon sources of energy involves the evaluation of the subsurface energy potential and the development of such technologies as the geothermal energy [1]. The peri-Tyrrhenian sector of central Italy hosts a large thermally anomalous area that comprises southern Tuscany, the Latium region, and the Campanian volcanic areas of the Phlegraean Fields and Vesuvius, where exploration for high and medium enthalpy fluids has concentrated in areas of recent magmatism [2,3]. Starting in late 1960s, a massive program of geothermal prospections has been conducted in large areas of Latium by ENEL (National Electric Energy Agency) and AGIP (National Oil Company) companies, in order to quantify the potential resources suitable for electricity generation [4,5,6,7,8,9]. Several tens of 1–5 km-deep boreholes and about 180 test-holes have been drilled until the early 1990s [10] (and references therein), providing maximum bottom-hole temperatures exceeding 300 °C. Despite the significant potential highlighted by these preliminary explorations, the geothermal resources of Latium remain so far unexploited. The reasons for this failure have mostly been related to the low permeability of the reservoirs [11], resulting in dry and unproductive boreholes for almost half of the deep wells drilled in the whole region, whereas potentially productive wells have regularly suffered the presence of hot brines (up to 350 g/L at Cesano; [5]) and/or corrosive gases (H2S), so that operations always stopped at the preliminary phases. Notwithstanding these negative attempts, Italy is experiencing a renewed interest in geothermal energy favored by recent technological advances in exploration and exploitation, which have extended the potential of geothermal reservoirs to lower temperatures and greater depths, and encouraged by the growth of energy demand [1]. In recent years, several exploration permits have been requested by private companies in Italy, many of these are in the Latium region [12], indicating the significant interest of industry for the development of this renewable resource.
A classical method proposed to estimate the theoretical geothermal potential of a given area is the volume method [13], which is based on the calculation of the heat stored in a certain volume of rock and requires information on the depth of the top of the geothermal reservoir and both an average porosity and an average fluid temperature of the reservoir itself. In more recent years, the old approach has been reviewed with the introduction of the CO2 surveyed in the regional aquifers as a tracer for reservoir productivity [14], as typical geothermal systems exhibit an anomalous CO2 degassing of deep provenance in areas of high heat flux [15,16,17,18,19]. In this paper, a revised version of the volume method has been applied to estimate the theoretical geothermal potential [20] of inferred geothermal reservoirs within the Vicano–Cimino Volcanic District (VCVD) and the Sabatini Volcanic District (SVD) in the Latium region. Based on a large and very detailed geochemical dataset, the aim of this study is to identify potential areas for high-to-low temperature resource exploitation and refine the estimation of the theoretical geothermal potential.

2. Geological and Hydrogeological Background

The study area comprises the VCVD and the SVD, two of the four large (more than 1000 km2 each) Quaternary volcanic districts of the Roman Magmatic province [21], and the adjacent Tolfa mountains, which formed from the emplacement of an intrusive body pertaining to the Tuscan Magmatic Province (i.e., the Tolfa Dome Complex [22]) on a sedimentary basement (Figure 1). Magmatism in the Tyrrhenian sector of central Italy was generated as the result of a post-collisional crustal extension which occurred at the back of the eastward-migrating Apennine fold-and-thrust belt. This extensional system also led to the development of dominantly NW- and minor NE-striking extensional fault sets arranged in a horst–graben pattern [10,23], and produced a strong crustal thinning (<25 km; [24]) and high heat flow (locally > 200 mW/m2; [25]). Volcanic complexes grew up on buried horst–graben structures, as shown by gravimetric anomalies [10], whilst marine clastic sediments filled the structural lows.
The volcanic activity took place in different phases separated in space and time, becoming progressively younger from east to west [26], and associated with important changes in the nature of the erupted magmas. It was initially characterized by crustal metasomatized acidic magmas pertaining to the Tuscan Magmatic Province then evolving towards under-saturated alkali-potassic products of the Roman Magmatic Province [27]. In the study area, the acid products consisted of rhyolites, rhyodacites, and trachydacites mostly found as dome complexes, corresponding to the Tolfa–Cerite–Manziate (3.5 Ma) domes and the Cimini (1.3–0.9 Ma) dome [22,27]. Alkali-potassic Roman volcanics, consisting of potassic (thachybasalts, trachytes) and ultrapotassic (leucites, tephrites, phonolites) pyroclastics, phreatomagmatic deposits, and minor lavas, generated a large volcanic complex (the Sabatini complex 0.8–0.09 Ma; [28,29]) and a stratovolcano (the Vicano complex 0.4–0.1 Ma; [30]).
The pre-volcanic basement of the SVD and VCVD comprises, from bottom to top (Figure 1): (1) Mesozoic carbonates overlying Triassic evaporitic facies (Burano Fm.); (2) a Cretaceous–Paleogene arenaceous-clayey-carbonate allochthonous flyschoid complex (Ligurian s.l.); and (3) a Miocene–Plio-Pleistocene autochthonous complex made of continental marls, sands, clays, and conglomerates. The youngest formations are Quaternary continental clastic sediments associated with travertines and diatomites [10,31].
The hydrogeological setting is dominated by a regional hydrothermal reservoir hosted in the carbonate-evaporite units and a shallow, mainly unconfined, regional aquifer within the volcanic rocks [32]. Low-permeability Plio–Pleistocene deposits and/or the Ligurian s.l. rocks generally act as an efficient hydraulic barrier between the shallow and the deep aquifer. Locally, permeable layers within the low-permeability sedimentary deposits host perched aquifers that feed numerous springs of limited and discontinuous extent. Thermal and mineral springs, representing clear examples of localized rising waters from the deeper regional hydrothermal reservoir, abundantly emerge from the volcanic and sedimentary deposits in the presence of tectonic disturbance, since fractures in fault zones act as preferential paths for the fast upwelling of deep-originated fluids to the surface [33,34].

3. Results

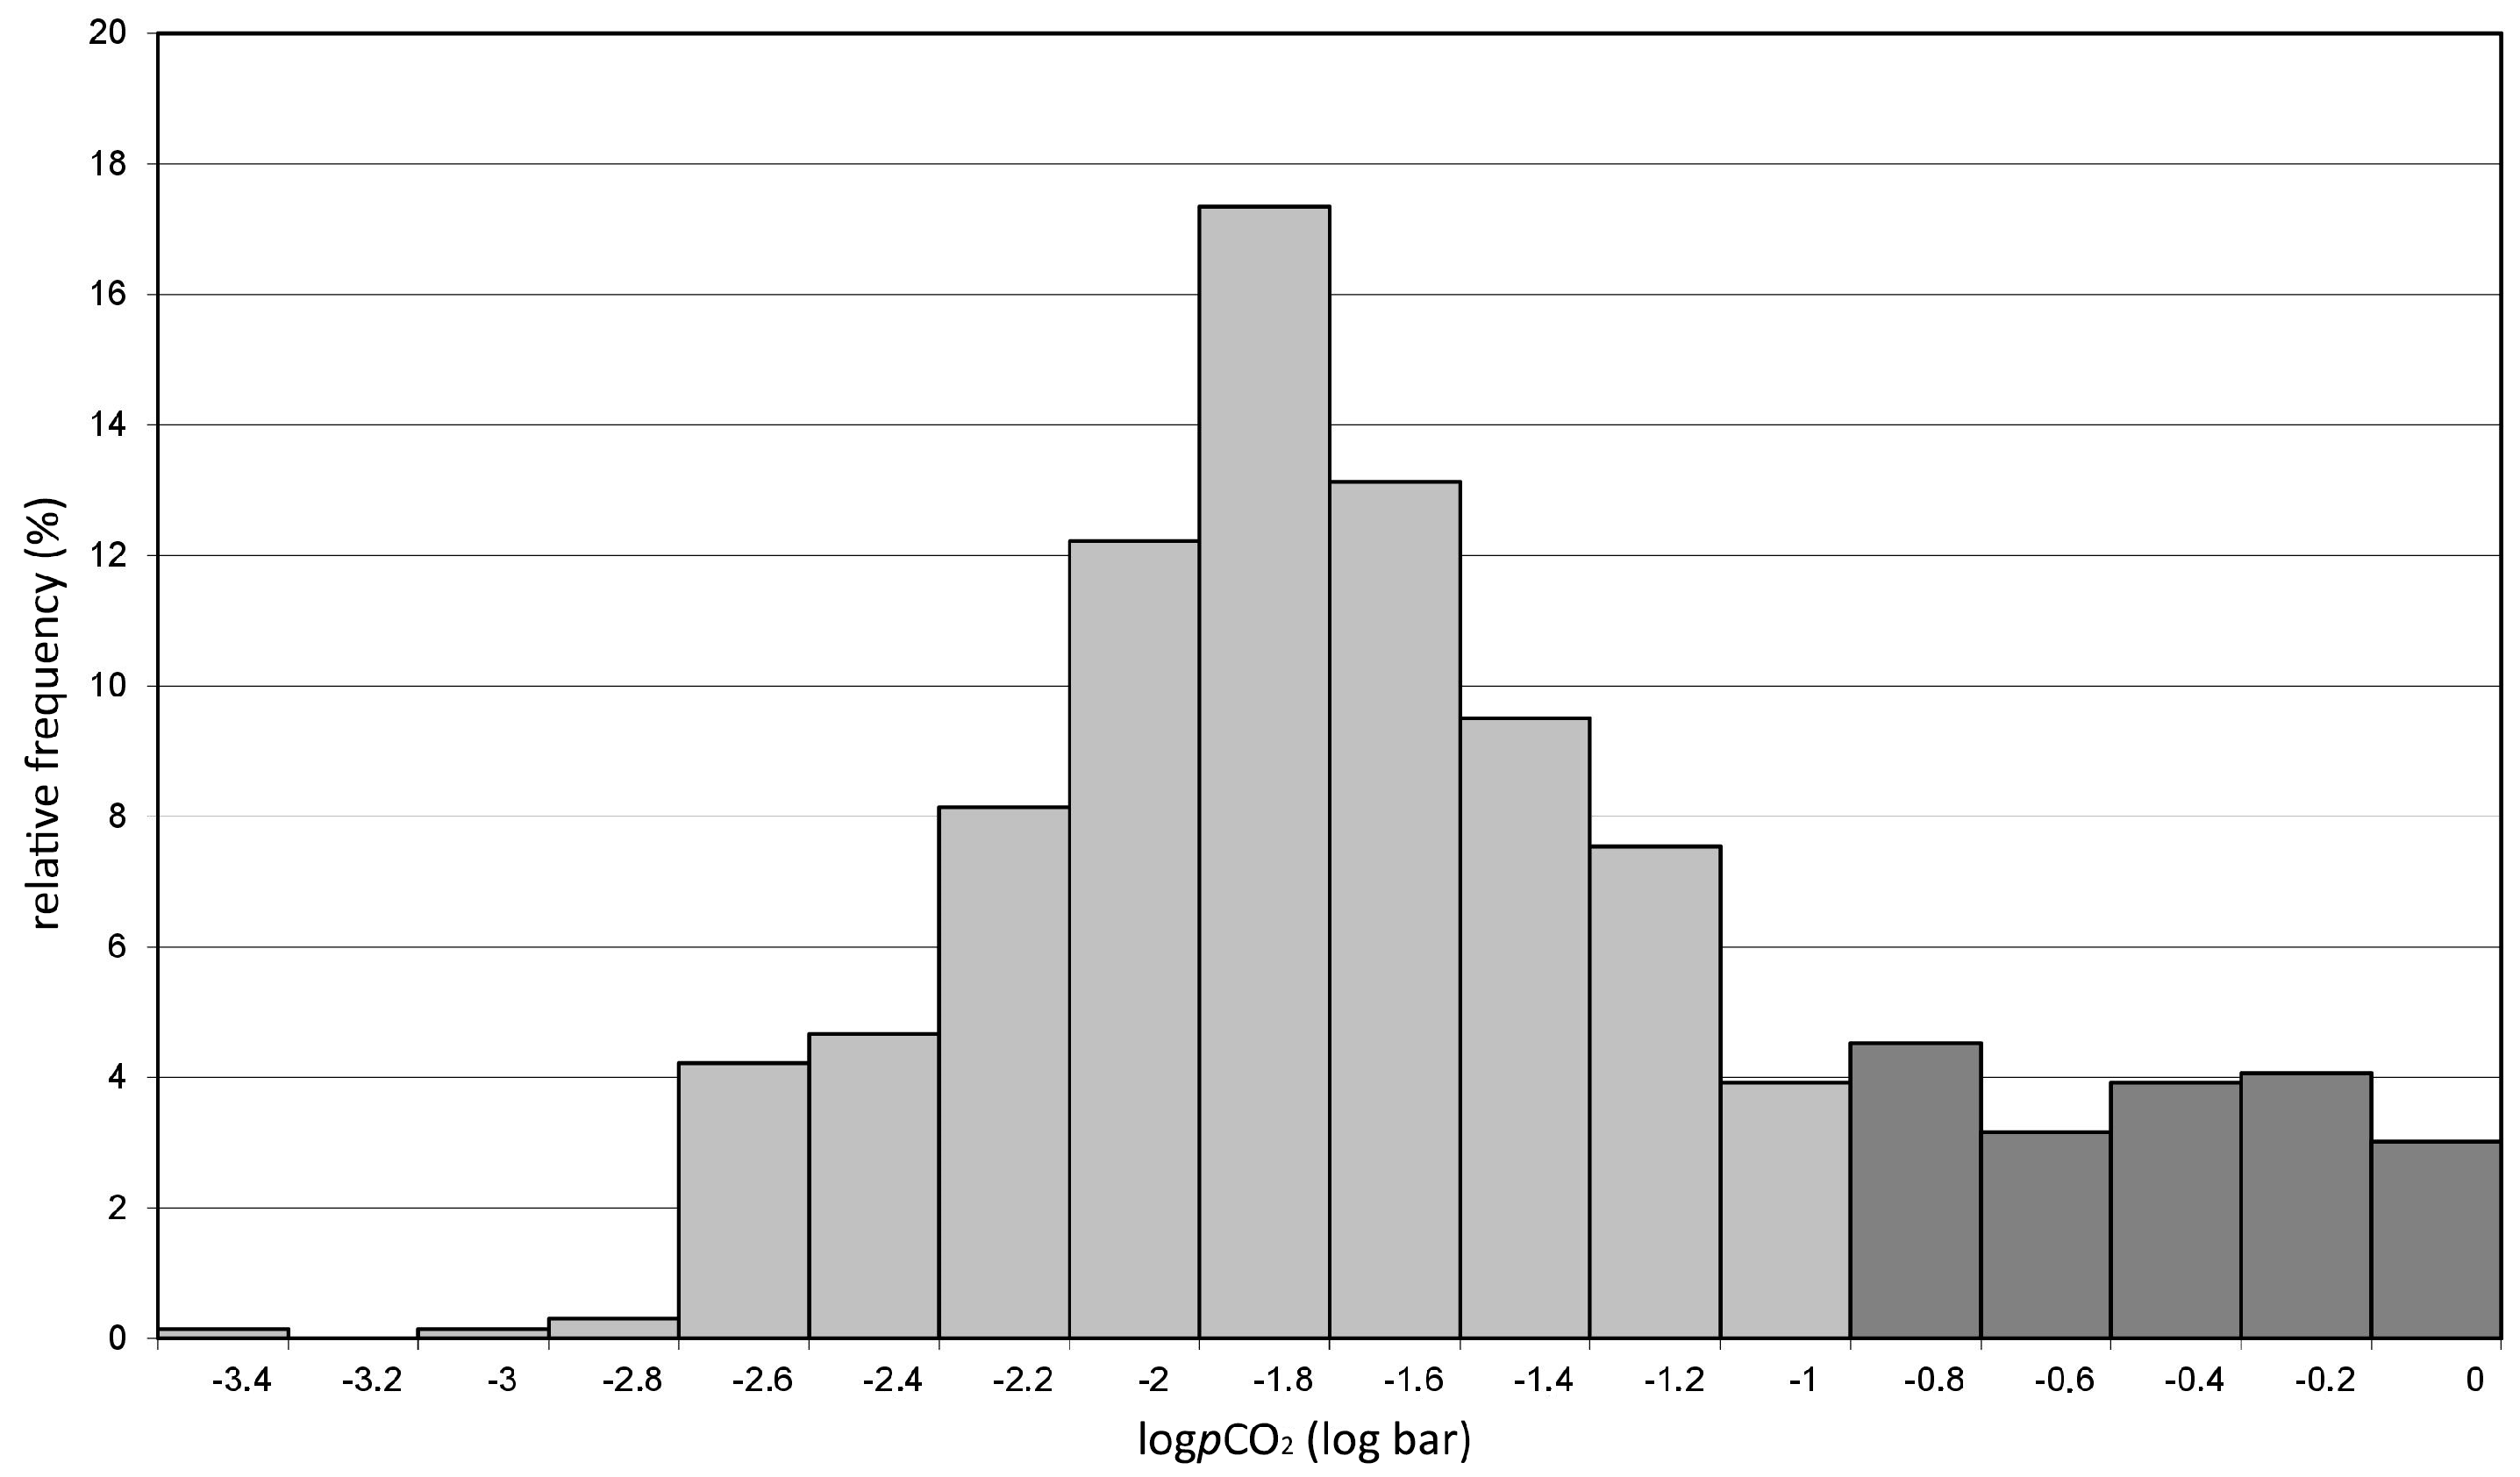
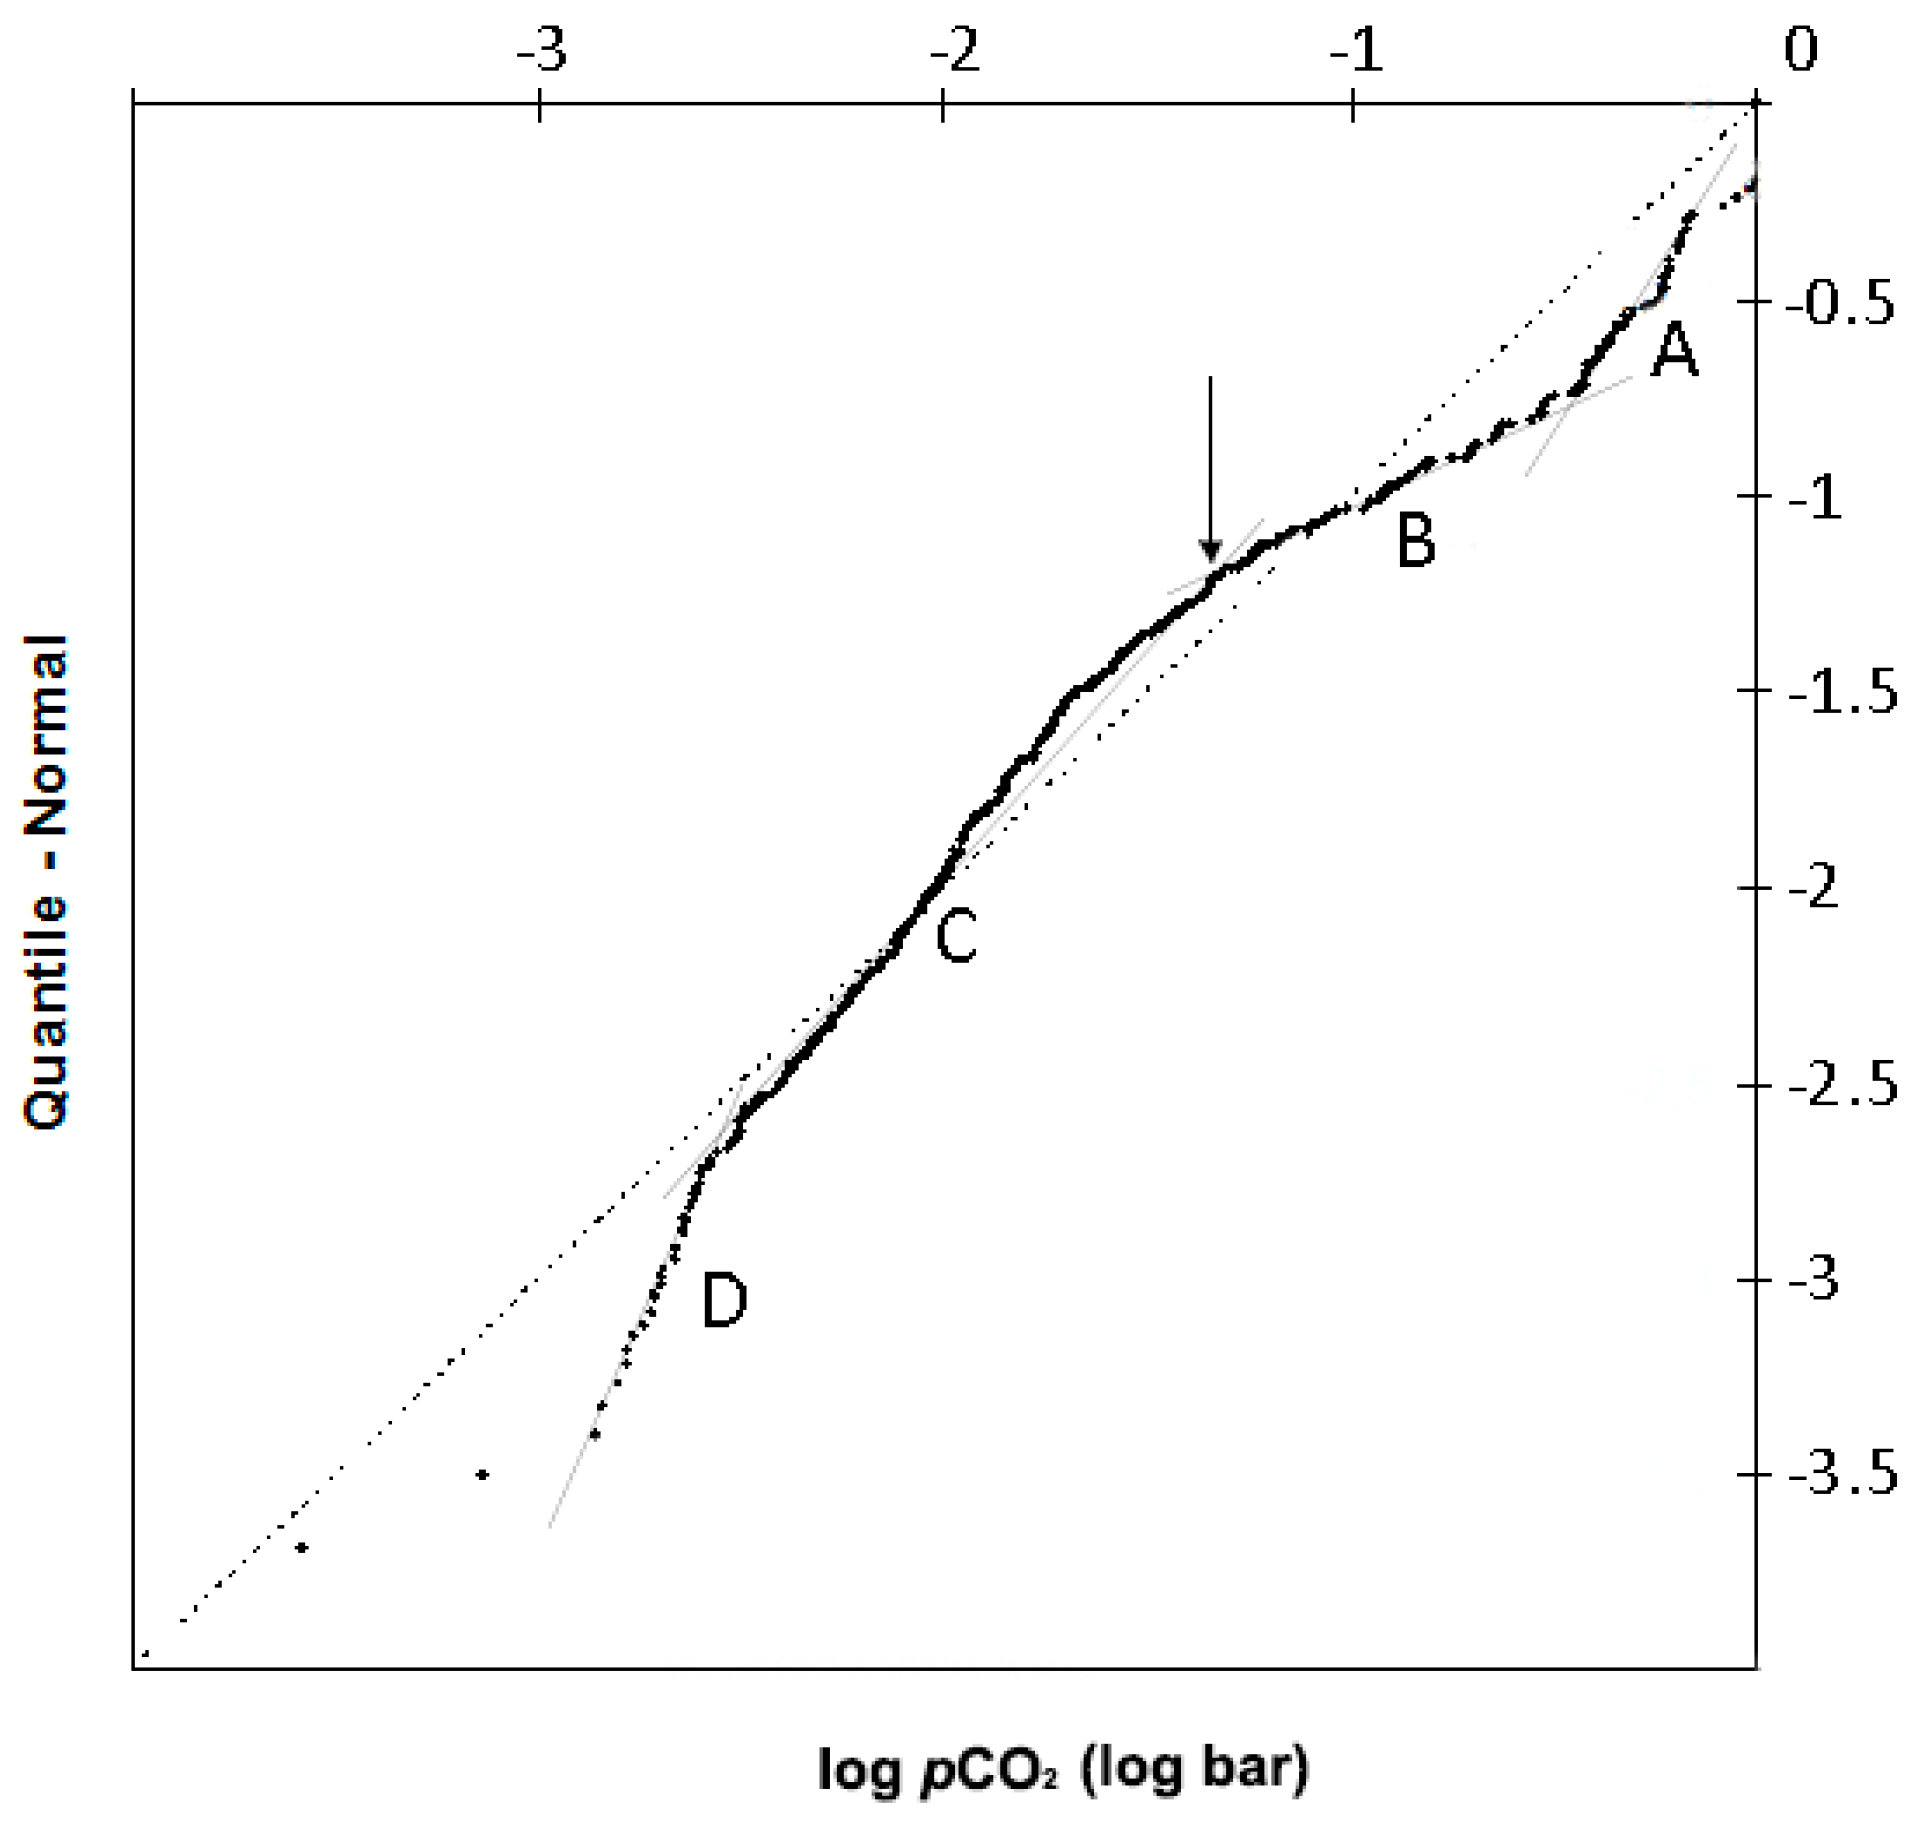
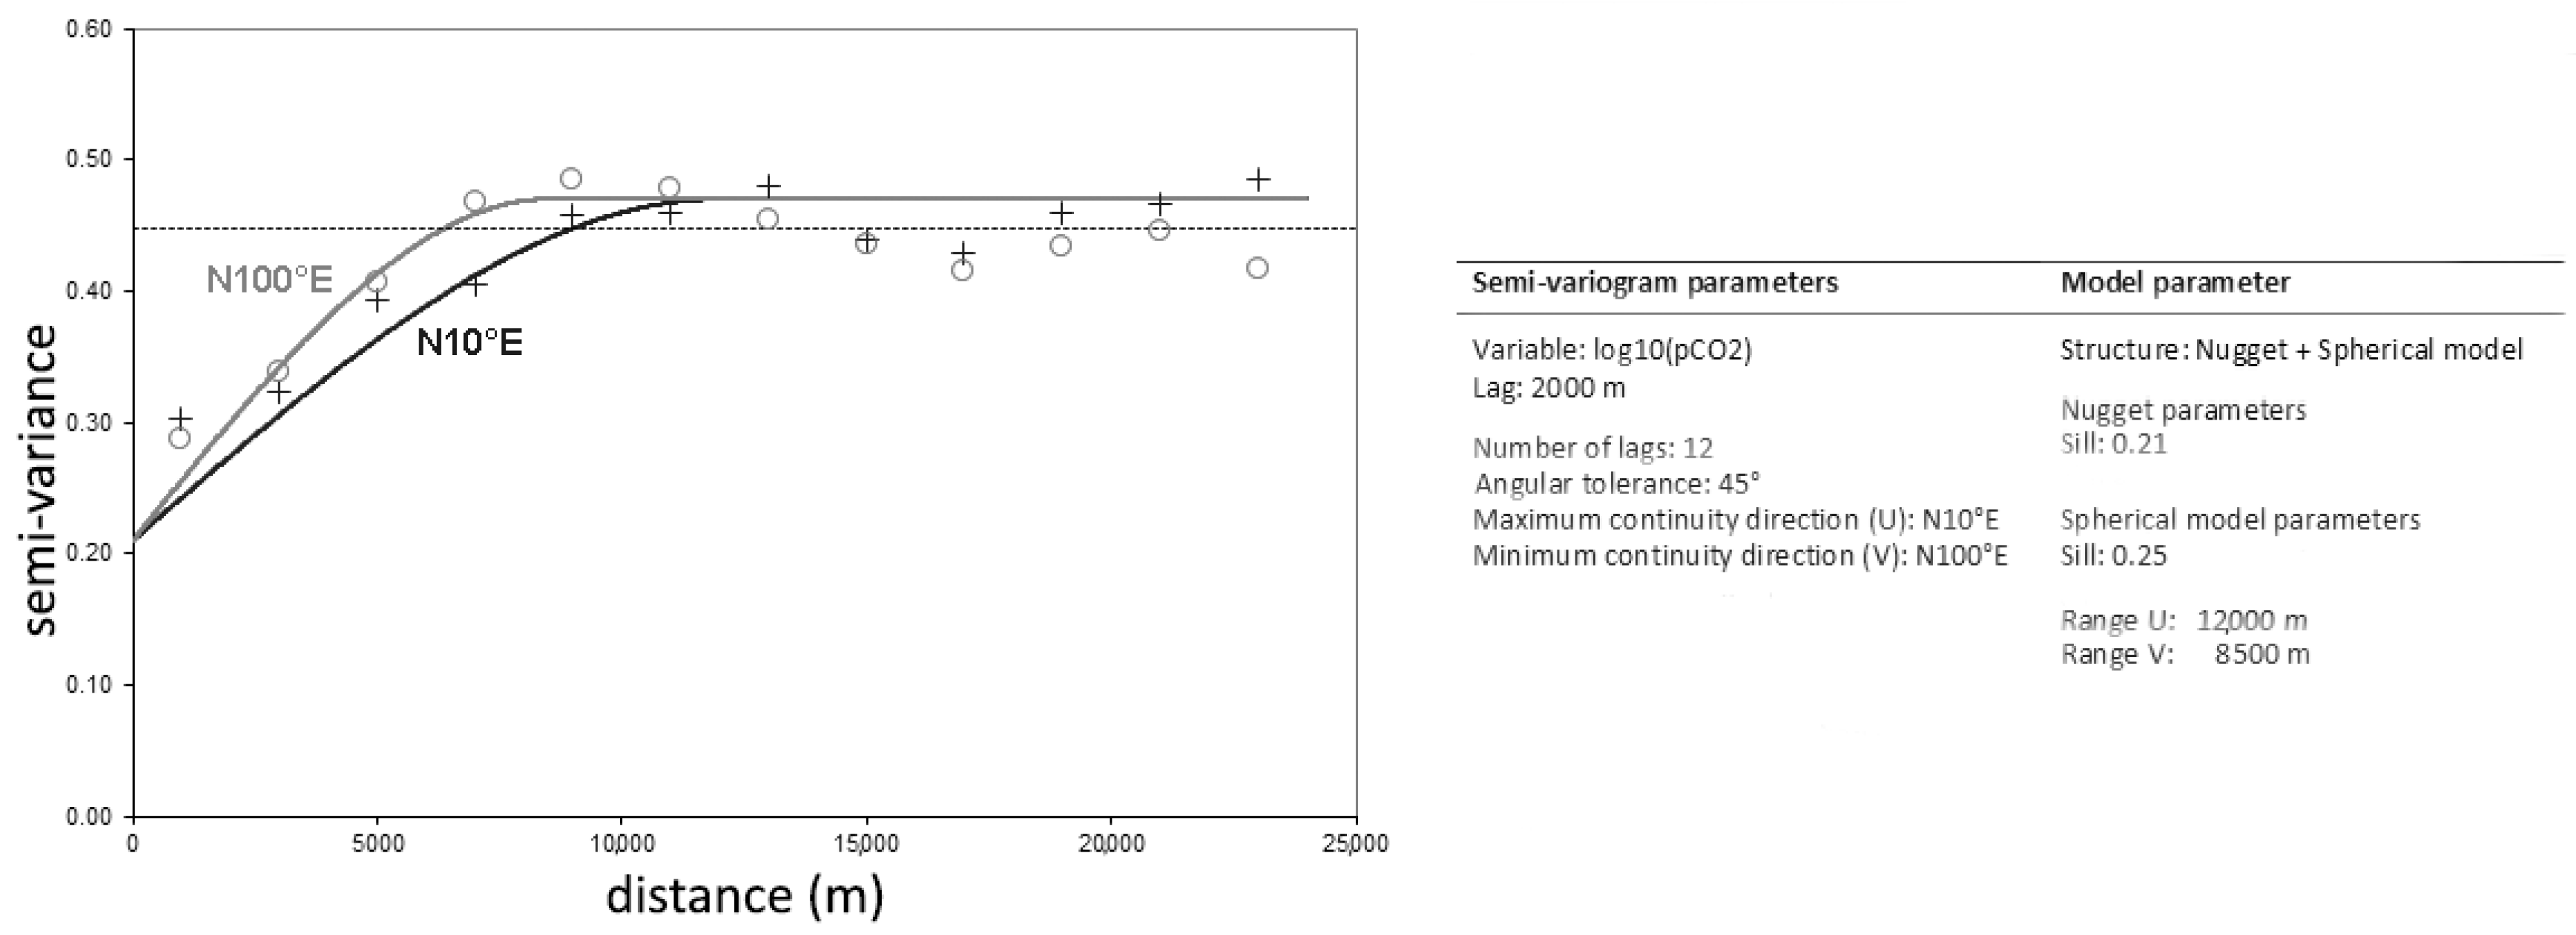
3.1. Basic Statistics and Geostatistical Analysis

Basic statistics (Table 1) show that the whole population of samples (664) is positively skewed with respect to pCO2 (i.e., the mean is higher than the median value) and, consequently, characterized by non-normal distribution. The pCO2 varies from 0.001 to 0.98 bar with the median value, which represents a more robust statistic parameter for non-normal distributions, of 0.017 bar and the inter-quartile range, representative of the distribution dispersion, of 0.046 bar (0.008–0.055 bar).
In order to improve the symmetry of the highly-skewed normal distribution and obtain a distribution as close as possible to a Gaussian-type, a log10-transformation of the variable has been applied. As a result, the frequency distribution of pCO2 (Figure 2) and the Quantile-Quantile (QQ) plot (Figure 3), both derived from the log-normal transformation of the variable, approach a symmetrical distribution although they do not follow a normal distribution. The histogram (Figure 2) shows a unimodal shape with a long right tail; more in detail, it highlights the presence of one maximum in the interval from −2.6 to −1.0 log bar and a uniform trend from −1.0 to 0 log bar. In the QQ plot (Figure 3) the pCO2 values plot along a curve which can be modeled as the combination of four different log-normal populations [36], which reflect the complexity of the CO2 degassing process from different sources.
After basic statistics, the pCO2 values have been processed to obtain a map of its spatial distribution. The geostatistical technique applied herein involves the use of kriging [37,38] through semi-variogram computation and modeling. A directional semi-variogram of the log-transformed variable has been calculated to estimate the spatial variation of pCO2 by applying a lag distance of 2000 m (tolerance ± 1000 m) (Figure 4). This distance is comparable to the average minimum distance among pairs of samples.
This representation takes into account the possible spatial anisotropy of the variable and allows verification of the presence of spatial autocorrelation among the experimental data. The directional semi-variogram shows a general growth of the semi-variance γ(h) with the distance, within a radius of influence (range), while beyond that distance the γ(h) remains approximately constant around the value (sill) of 0.46. This means that a spatial correlation among observations exists within the range distance, over which no spatial correlation between data is apparent. Moreover, for h = 0 the semi-variance γ(h) > 0 due to the short scale variations enclosed within the first lag (nugget effect). The geometric anisotropy for pCO2 is defined along the N10° E and N100° E directions (Figure 4), which have been identified as representative of major (U direction) and minor (V direction) axes of the anisotropy ellipse, respectively. In particular, the major axis is the direction of maximum spatial continuity of the variable (maximum range: 12,000 m) and the minor axis is the direction of maximum spatial variability (minimum range: 8500 m). Ordinary kriging has been applied to produce the estimation map of pCO2 (Figure 5) that, at a preliminary phase, has been back-transformed into the original variable values.

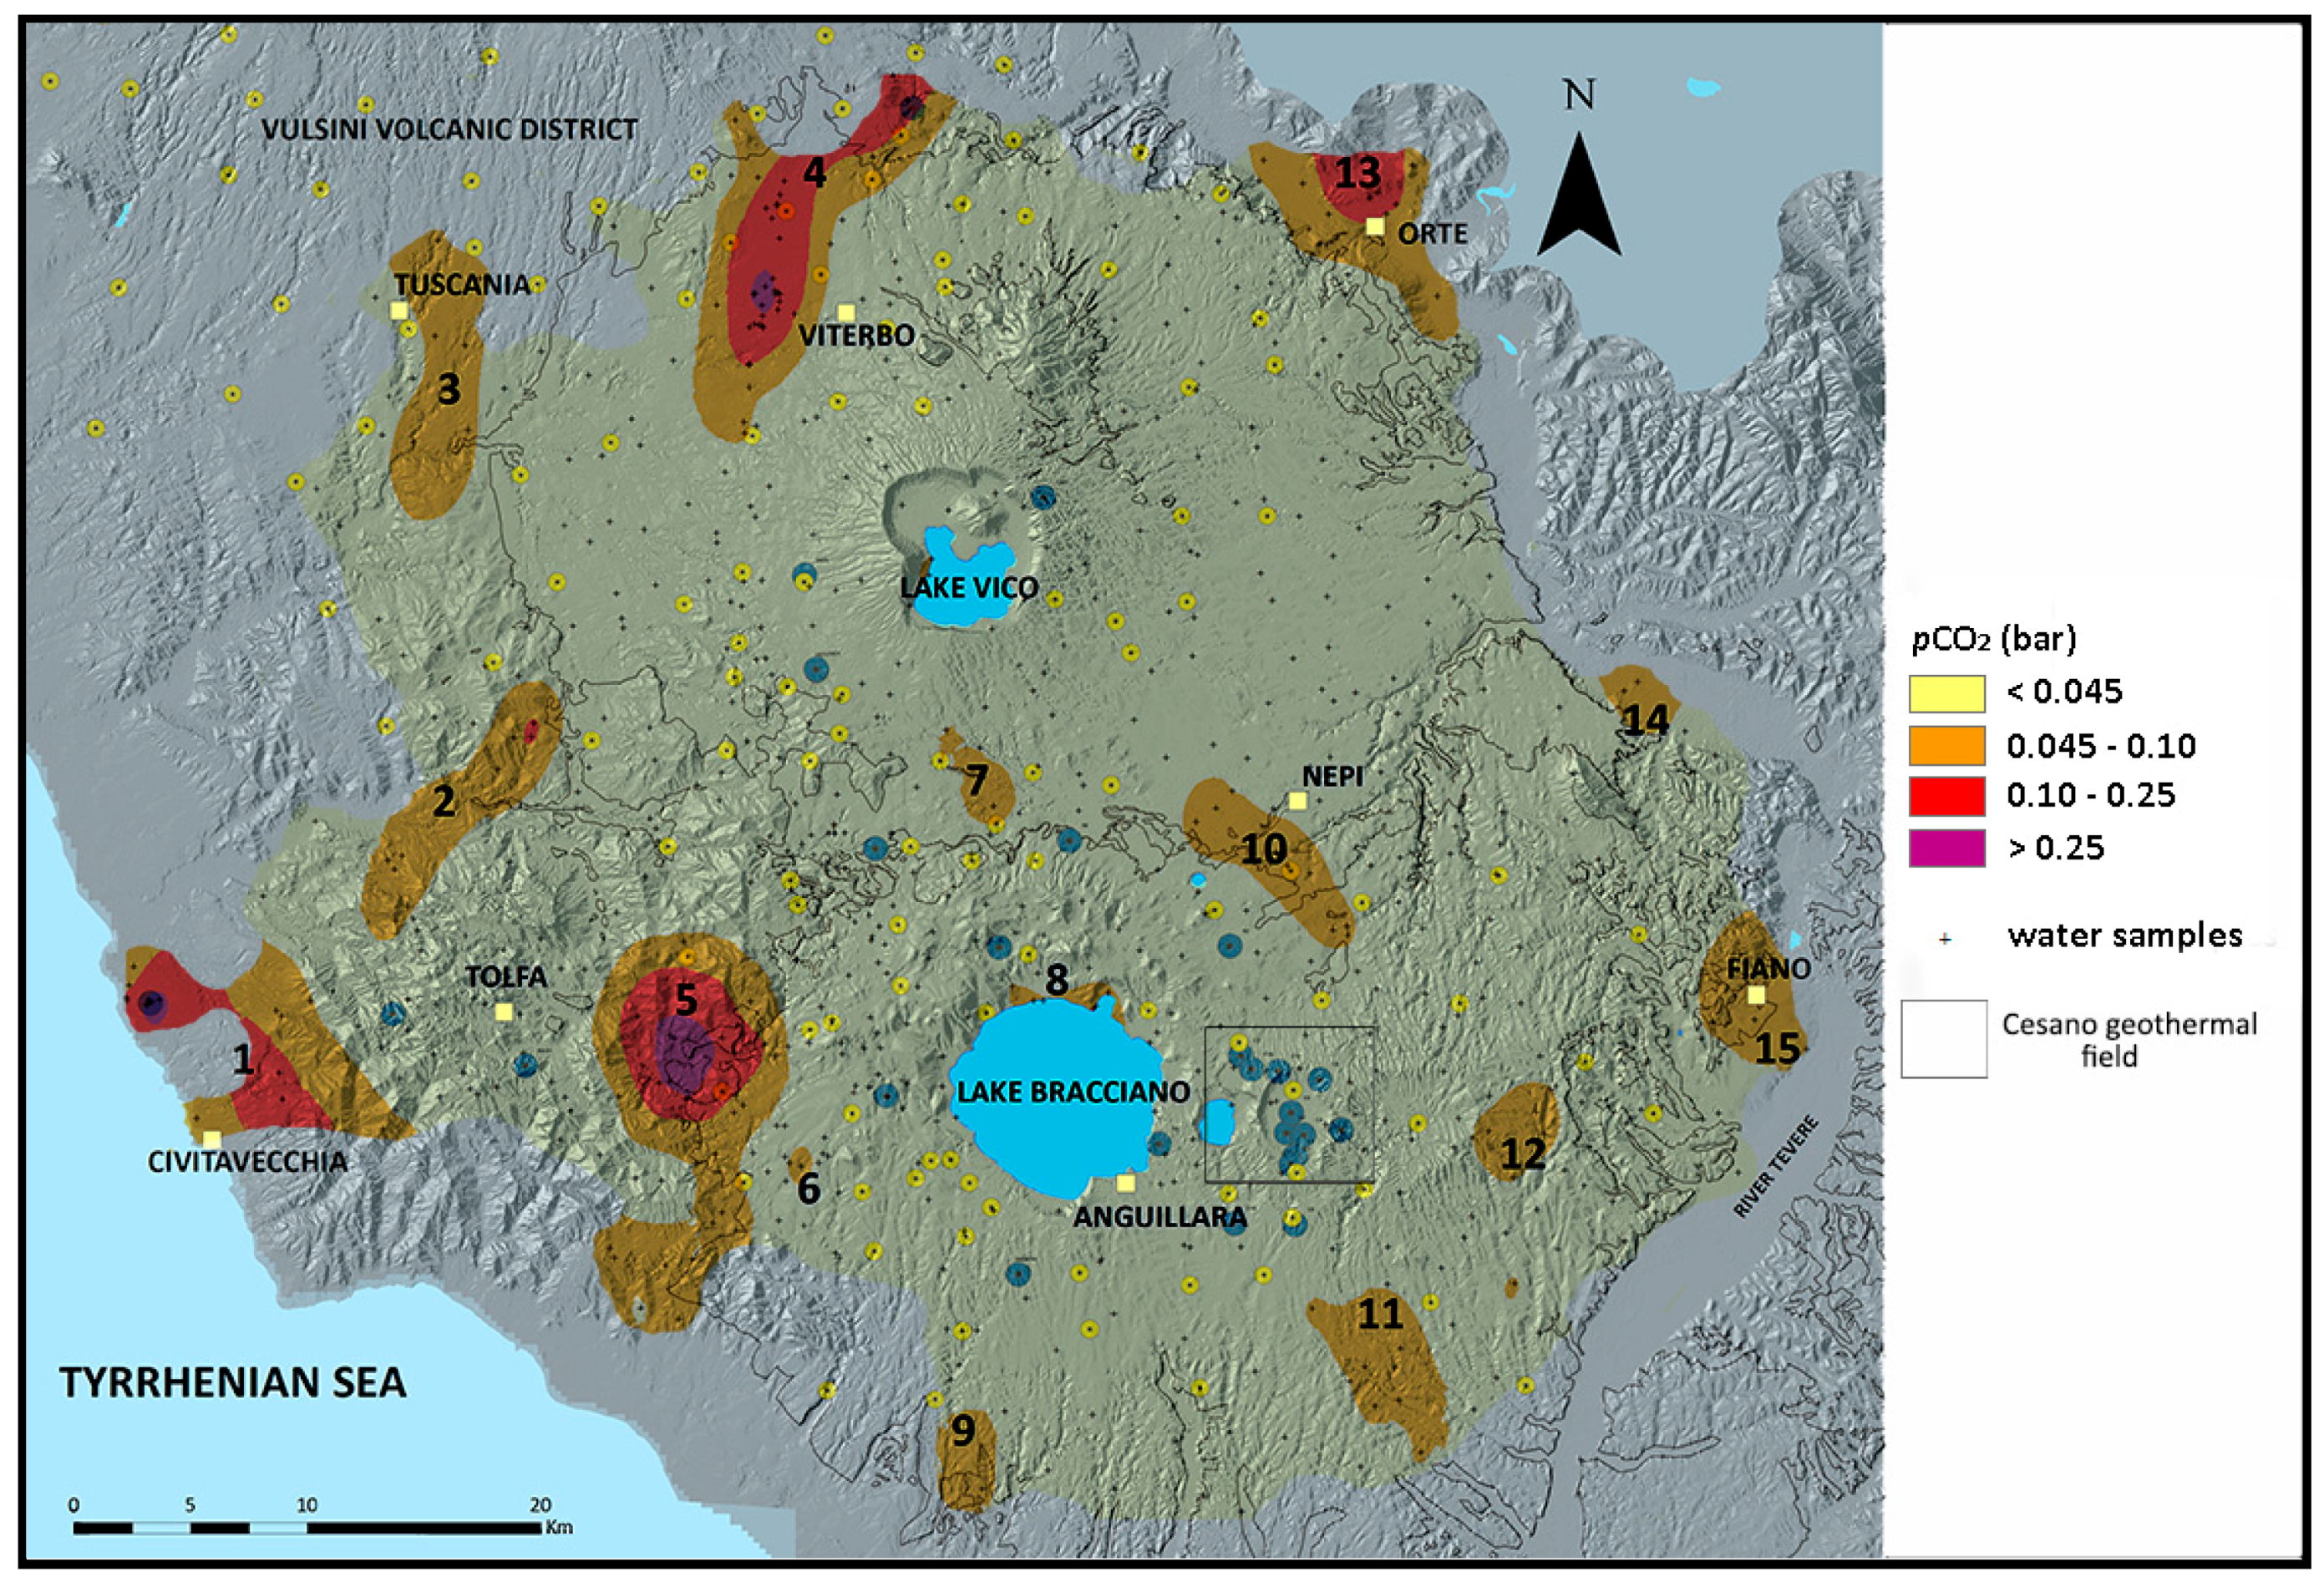
3.2. Application of the Volume Method

The volume (V) of the unexplored geothermal reservoir is computed by multiplying the areal extension (A) and the average thickness (h) of the reservoir itself, according to the equation
V = A × h
where A is evaluated on the basis of the pCO2 distribution of emerging waters (Figure 5) and h is calculated from the difference between the depth of the potential reservoir top and the depth of 3 km, which is usually considered the maximum depth for an economically exploitable geothermal resource (Table 2) [11,14]. All available information on: (1) the geological structure at depth and (2) the depth of the potential reservoir top have been acquired from the Ministry of Economic Development website [12].
The theoretical geothermal potential (W) of the identified geothermal reservoirs (Table 2), which is comparable to the thermal energy in [42], has been computed according to the equation [14]
W = (1000/3600) × Q × Cw × (T − 298.15)
where Cw (in J/kg K) is the specific heat capacity of fluids contained in the geothermal reservoir (data from [43]), (T) is the reservoir temperature (in K), Q (in t/h) is the hourly production rate, and 1000/3600 is a conversion factor (to convert Q from t/h to kg/s). The hourly production rate (Q) of the potential geothermal systems has been computed multiplying the volume of each geothermal reservoir for its specific productivity. The average specific productivity of 40 t/h km3, calculated for the liquid-dominated geothermal systems of Latium by [14] has been used for calculations. Reservoir temperatures have been derived taking into account, hierarchically, data from: (1) deep drilling (i.e., bottom-hole temperatures); (2) geothermometric evaluations based on chemical equilibria of gas species [19,39,40,41]; and (3) the map of temperature of the potential reservoir top [12]. Minimum and maximum temperatures (Table 2) have been considered to obtain the minimum and the maximum theoretical thermal power, respectively.

4. Discussion

The shape of the frequency distribution of logpCO2 (Figure 2) highlights the presence of two distinct populations of: (1) low pCO2 values (≤0.045 bar), which can generally be interpreted as the normal enrichment in soil derived-CO2 of infiltrating waters from zones of low CO2 flux, and (2) medium-to-high pCO2 values (>0.045 bar), reflecting the input of deeply derived CO2. This hypothesis is confirmed by the δ13C-CO2 values of the sampled waters, ranging from −27.6 to +2.3‰ vs. VPDB [19,39,40], which suggest that CO2 has a two-fold origin: relatively negative δ13C-CO2 values of the low pCO2 waters imply dominant CO2 contribution from soil respiration and aerobic decay of organic matter [44]; conversely, less negative δ13C-CO2 values of the medium-to-high pCO2 waters point to CO2 production from thermo-metamorphic reactions involving carbonate formations (δ13C-CO2 values from −2.0 to +2.3‰ vs. VPDB [45]) and minor contribution from mantle degassing (δ13C-CO2 values from −7.0 to −3.0‰ vs. VPDB [46]). Consistent with this hypothesis, the different populations highlighted in the QQ plot (Figure 3) can be interpreted as representative of pCO2 values fed by both biological and endogenous sources. In our interpretation, the populations with the lowest values (A,B) represent the background values (organic CO2) while the other populations (C,D) reflect the input of CO2 derived from depth. In spite of possible different interpretations of the origin of the populations, the pCO2 value of 0.045 bar has been selected as the possible threshold value for the background biological CO2.
The geographic distribution of pCO2 values in the shallow aquifers of the VCVD and the SVD (Figure 5) highlight the presence of areas characterized by medium-to-high pCO2 values, i.e., those reflecting the input of endogenous CO2, whose distribution is not homogeneously affected from the complexity of the structural setting and the fracture-related upwelling of deep-originated fluids from the active hydrothermal system. Those areas, whose size is reported in Table 2, are characterized by pCO2 values > 0.045 bar and are used to define the areal extension of potentially exploitable geothermal systems, as they are interpreted as the surface expressions of geothermal reservoirs located at depth. Fifteen areas with size comprised from 2 to 104 km2 are highlighted in the map of Figure 5. They are both associated with (1) thermal waters upwelling from the deep reservoir, where the CO2-rich gas phase is originally dissolved, and (2) cold waters from the shallow aquifers, which receive the input of endogenous CO2 that separates from the parent deep fluid and upwells as a single gas phase from the deep reservoir. These areas are generally located in correspondence with positive gravity zones, which have been interpreted as buried structural highs of the carbonate basement [19] and represent the sectors where the top of the geothermal reservoir is located at shallower depths. On the other hand, pCO2 values < 0.045 bar, i.e., those reflecting the shallow production of biological CO2, are associated with gravity lows and are typical of cold waters circulating within the shallow aquifers, which have no relation with the tectonic framework and do not receive contributions from the geothermal reservoir. As for the lack of high values of pCO2 in correspondence with the geothermal field of Cesano, one possible explanation is that the Cesano field is a hot brine [5], so self-sealing phenomena of fractures and faults by the highly saline fluids could occur and hinder their upwelling to the surface.
Calculated volumes, discharge rates, and theoretical geothermal potential estimates for the 15 areas are reported in Table 2. However, it is worth noting that the specific productivities obtained in this work represent rough approximations and their use can lead to significant uncertainties, as the factors controlling the productivity of geothermal reservoirs, such as permeability, vary from reservoir to reservoir. The following discussion is a brief description of each area. The Civitavecchia reservoir can be considered as an economically valuable, low-enthalpy geothermal resource, due to the low temperatures (50–85 °C), and the small depth of the reservoir top (~400 m). Both the high expected productivity (~8840 t/h) and the considerable geothermal potential that may be extracted (257–619 MWt), and the presence of potential users (e.g., in the town of Civitavecchia, at the distance of few km) make this site very attractive. The boreholes drilled in the past for geothermal exploitation by ENEL are currently used for greenhouse space heating and public spas. The reservoirs of Monte Romano-Blera and Tuscania have moderate production rates (2280–3192 t/h) and considerable expected theoretical geothermal potentials (up to 527 and 700 MWt, respectively). Based on the depth of the reservoir top (>1000 m) and the temperature (150–200 °C), they can be classified as useful accessible medium-to-high enthalpy geothermal resources for electric production. The Viterbo–Grotte S. Stefano thermal basin shows considerable expected productivity (7216 t/h) and theoretical geothermal potential (310–497 MWt) in an area with low temperatures (60–80 °C) at relatively shallow depths (~400–800 m), suggesting good perspectives for direct geothermal uses, also due to the presence of many potential users (e.g., in the town of Viterbo, at the distance of few km). About Grotte S. Stefano, it is worth noting that wells drilled in the past for geothermal resource exploitation have been soon abandoned after CO2-rich gas phase eruption, with no associated thermal water, at the interception of the reservoir top. The Canale Monterano–Mt. Solferata reservoir can be considered an economically valuable, due to the high temperatures (150–200 °C) and the moderate depth of the reservoir top (~600 m). Both high expected productivity (~9984 t/h) and geothermal potential (1498–2189 MWt) make this site a useful accessible resource both for power production and direct uses. The small Capranica reservoir has temperatures in the range 100–150 °C at a depth of ~500 m, a moderate expected productivity (~600 t/h), but low theoretical geothermal potential (53–90 MWt), suggesting good perspectives for both direct uses of the geothermal resources and power production. Similar to the Capranica reservoir are those of Manziana, Trevignano, and Castel Campanile, in terms of both areal extension (2–9 km2) and temperatures (100–165 °C). Smaller expected productivities (168–360 t/h) and theoretical geothermal potentials (19–43 MW) make those sites useful accessible resources for direct use and power production. The Nepi, Isola Farnese, and Castelnuovo di Porto–Sacrofano reservoirs are characterized by considerable expected productivities (792–1700 t/h) and low-to-moderate geothermal potentials (70–316 MWt). Even though these systems have high temperatures (100–200 °C), based on the high depth at their top (1200–1500 m) they can be classified as useful accessible medium-to-high enthalpy geothermal resources for electric production. Moving eastward, the Orte-Montecchie, Ponzano Romano, and Fiano Romano reservoirs are efficiently cooled by the meteoric water recharge of the hydrothermal system from the nearby Apennine range. This explains the low temperatures (25–100 °C) at the reservoir top, even if at a relatively shallow depth (200–400 m). On the basis of their considerable expected productivity (728–5200 t/h) and low theoretical geothermal potential (up to 163 MWt), these systems can be classified as useful accessible resources for direct uses.

5. Materials and Methods

Up to 664 water samples have been collected over an area of ~2800 km2 from springs and wells fed by (1) the cold and shallow aquifers hosted in the volcanic and sedimentary rocks and (2) the deep hydrothermal reservoir. The sampling sites have been homogeneously distributed all over the investigated area, and the sampling density is high (Figure 1). The pCO2 of the sampled waters has been calculated with the PHREEQC code [47], operating with the Lawrence Livermore National Laboratory database and using as input data the groundwater physico-chemical parameters, whose full dataset is reported elsewhere [19,39,40].
Descriptive statistics and graphical representations have been carried out to characterize the population of water samples with respect to pCO2. After that, experimental data have been processed to produce a pCO2-contour map by applying the techniques of geostatistics (i.e., variogram analysis and kriging estimation; [37,38]). Experimental directional variograms have been constructed to (1) investigate the spatial dependence of the pCO2 values by calculating the variogram parameters (i.e., nugget, range and sill) and (2) determine the directional differences (anisotropy). Kriging has been applied to provide the best local estimate of the mean value of a regionalized variable (i.e., a certain property that varies in the geographic space) by using the measured values and a semi-variogram to determine the scale of variance and estimate the unknown values.
According to [14], the revised volume method has been applied on the produced contour map to compute the volumes of the deep geothermal reservoirs identified on the basis of the anomalies of pCO2.

6. Conclusions

The revised volume method has been used to evaluate the potential productivity and the theoretical geothermal potential of unexploited geothermal reservoirs of the VCVD and the SVD, as identified by the distribution of pCO2 in shallow and deep aquifers. This parameter has allowed the delimitation of areas of potential geothermal interest which have been computed through a geostatistical approach (kriging).
By assuming a specific productivity of 40 t/h km3, a potential productivity of ~45 × 103 t/h and a total theoretical geothermal potential of 3682–5595 MWt has been estimated. This makes the exploitation of the identified geothermal resources in the VCVD and the SVD very suitable for both generation of electric power and direct uses that, due to the presence of many potential users (municipalities, industrial sites, agricultural, and touristic infrastructures), can play a significant role in the reduction of CO2 emissions.

Acknowledgments

We warmly thank two anonymous reviewers for their helpful and useful suggestions on an early version of the manuscript.

Author Contributions

Daniele Cinti collected the water samples, analyzed part of their chemical composition and calculated the pCO2 values; Monia Procesi applied the volume method for evaluation of fluid production rate and theoretical geothermal potential; Pier Paolo Poncia carried out the statistical and geostatistical analysis. All authors contributed to writing the paper.

Conflicts of Interest

The authors declare no conflict of interest.

References

  1. Procesi, M.; Cantucci, B.; Buttinelli, M.; Armezzani, G.; Quattrocchi, F.; Boschi, E. Strategic use of the underground in an Energy mix plan: Synergies among CO2, CH4 geological storage and geothermal Energy. Appl. Energy 2013, 110, 104–131. [Google Scholar] [CrossRef]
  2. Buonasorte, G.; Cameli, G.M.; Fiordelisi, A.; Parotto, M.; Perticone, I. Results of geothermal exploration in central Italy (Latium-Campania). In Proceedings of the World Geothermal Congress, Florence, Italy, 18–31 May 1995; International Geothermal Association, Inc.: Auckland, New Zealand, 1995; pp. 1293–1298. [Google Scholar]
  3. Cataldi, R.; Mongelli, F.; Squarci, P.; Taffi, L.; Zito, G.; Calore, C. Geothermal ranking of Italian territory. Geothermics 1995, 24, 115–129. [Google Scholar] [CrossRef]
  4. Cataldi, R.; Rendina, M. Recent discovery of a new geothermal field: Alfina. Geothermics 1973, 2, 106–116. [Google Scholar] [CrossRef]
  5. Calamai, A.; Cataldi, R.; Dall’Aglio, M.; Ferrara, G.C. Preliminary report on the Cesano hot brine deposit (northern Latium, Italy). In Proceedings of the 2nd U.N. Symposium on the Development and Use of Geothermal Energy, San Francisco, CA, USA, 20–29 May 1975; pp. 305–313. [Google Scholar]
  6. Borghetti, G.; La Torre, P.; Sbrana, A.; Sollevanti, F. Geothermal exploration in Monti Cimini permit (north Latium, Italy). In Proceedings of the 3rd Intern. EC Seminar European Geothermal Update, Munich, Germany, 29 November–1 December 1983; pp. 419–432. [Google Scholar]
  7. Bertrami, R.; Cameli, G.M.; Lovari, F.; Rossi, U. Discovery of Latera geothermal field: Problems of the exploration and research. In Proceedings of the Seminar on Utilization of Geothermal Energy for Electric Power Production and Space Heating, Florence, Italy, 14–17 May 1984; pp. 1–18. [Google Scholar]
  8. Carella, R.; Verdiani, G.; Palmerini, C.G.; Stefani, G.C. Geothermal activity in Italy: Present status and future prospects. Geothermics 1985, 14, 247–254. [Google Scholar] [CrossRef]
  9. Billi, B.; Cappetti, G.; Luccioli, F. ENEL activity in the research, exploration and exploitation of geothermal energy in Italy. Geothermics 1986, 15, 765–779. [Google Scholar] [CrossRef]
  10. Barberi, F.; Buonasorte, G.; Cioni, R.; Fiordalisi, A.; Iaccarino, S.; Laurenzi, M.A.; Sbrana, A.; Vernia, L.; Villa, I.M. Plio-Pleistocene geological evolution of the geothermal area of Tuscany and Latium. Mem. Descr. Carta Geol. D’Italia 1994, 49, 77–134. [Google Scholar]
  11. Giordano, G.; De Benedetti, A.A.; Bonamico, A.; Ramazzotti, P.; Mattei, M. Incorporating surface indicators of reservoir permeability into reservoir volume calculations: Application to the Colli Albani caldera and the central Italy geothermal province. Earth-Sci. Rev. 2014, 128, 75–92. [Google Scholar] [CrossRef]
  12. Ministry of Economic Development—Directorate-General for Safety of Minimg and Energy Activities (DGS-UNMIG). National Mining Office for Hydrocarbons and Georesources. Available online: http://unmig.mise.gov.it/unmig/geotermia/titoli/titoli.asp (accessed on 31 December 2017 ).
  13. Muffler, P.; Cataldi, R. Methods for regional assessment of geothermal resources. Geothermics 1978, 7, 53–89. [Google Scholar] [CrossRef]
  14. Doveri, M.; Lelli, M.; Merini, L.; Raco, B. Revision, calibration, and application of the volume method to evaluate the geothermal potential of some recent volcanic areas of Latium, Italy. Geothermics 2010, 39, 260–269. [Google Scholar] [CrossRef]
  15. Mahon, W.A.J.; McDowell, G.D.; Finlayson, J.B. Carbon dioxide: Its role in geothermal systems. N. Z. J. Sci. 1980, 23, 133–148. [Google Scholar]
  16. Marini, L.; Chiodini, G. The role of carbon dioxide in the carbonate-evaporite geothermal systems of Tuscany and Latium (Italy). Acta Vulcanol. 1994, 5, 95–104. [Google Scholar]
  17. Chiodini, G.; Frondini, F.; Ponziani, F. Deep structures and carbon dioxide degassing in central Italy. Geothermics 1995, 24, 81–94. [Google Scholar] [CrossRef]
  18. Chiodini, G.; Baldini, A.; Barberi, F.; Carapezza, M.L.; Cardellini, C.; Frondini, F.; Granieri, D.; Ranaldi, M. Carbon dioxide degassing at Latera caldera (Italy): Evidence of geothermal reservoir and evaluation of its potential energy. J. Geophys. Res. 2007, 112. [Google Scholar] [CrossRef]
  19. Cinti, D.; Procesi, M.; Tassi, F.; Montegrossi, G.; Sciarra, A.; Vaselli, O.; Quattrocchi, F. Fluid geochemistry and geothermometry in the western sector of the Sabatini volcanic district and the Tolfa Mountains (central Italy). Chem. Geol. 2011, 284, 160–181. [Google Scholar] [CrossRef]
  20. Rybach, L. Classification of geothermal resources by potential. Geotherm. Energy Sci. 2015, 3, 13–17. [Google Scholar] [CrossRef]
  21. Conticelli, S.; Peccerillo, A. Petrology and geochemistry of potassic and ultrapotassic volcanism in central Italy: Petrogenesis and inferences on the evolution of the mantle sources. Lithos 1992, 28, 221–240. [Google Scholar] [CrossRef]
  22. Cimarelli, C.; De Rita, D. Relatively rapid emplacement of dome-forming magma inferred from strain analyses: The case of the acid Latian dome complexes (Central Italy). J. Volcanol. Geotherm. Res. 2006, 158, 106–116. [Google Scholar] [CrossRef]
  23. Acocella, V.; Funiciello, R. Transverse systems along the extensional Tyrrhenian margin of central Italy and their influence on volcanism. Tectonics 2006, 25. [Google Scholar] [CrossRef]
  24. Scrocca, D.; Doglioni, C.; Innocenti, F. Constraints for an interpretation of the Italian geodynamics: A review. Mem. Descr. Carta Geol. D’Italia 2003, 62, 15–46. [Google Scholar]
  25. Della Vedova, B.; Bellani, S.; Pellis, G.; Squarci, P. Deep temperatures and surface heat flow distribution. In Anatomy of an Orogen: The Apennines and Adjacent Mediterranean Basins; Vai, G.B., Martini, P., Eds.; Kluwer Academic Publishers: Norwell, MA, USA, 2001; pp. 65–76. [Google Scholar]
  26. Serri, G.; Innocenti, F.; Manetti, P. Geochemical and petrological evidence of the subduction of delaminated Adriatic continental lithosphere in the genesis of the Neogene-Quaternary magmatism of central Italy. Tectonophysics 1993, 223, 117–147. [Google Scholar] [CrossRef]
  27. Peccerillo, A. Cenozoic Volcanism in the Tyrrhenian Sea Region; Springer International Publishing AG: Cham, Switzerland, 2017. [Google Scholar]
  28. Cioni, R.; Laurenzi, M.A.; Sbrana, A.; Villa, I.M. 40Ar-39Ar chronostratigraphy of the initial activity in the Sabatini Volcanic Complex (Italy). Boll. Soc. Geol. Ital. 1993, 112, 251–263. [Google Scholar]
  29. De Rita, D.; Di Filippo, M.; Rosa, C. Structural evolution of the Bracciano volcano-tectonic depression, Sabatini Volcanic District, Italy. In Volcano Instability on the Earth and Other Planets; Geological Society of London: London, UK, 1996; Volume 110, pp. 225–236. [Google Scholar]
  30. Laurenzi, M.A.; Villa, I.M. 40Ar/39Ar chronostratigraphy of Vico ignimbrites. Period. Miner. 1987, 56, 285–293. [Google Scholar]
  31. Baldi, P.; Decandia, F.A.; Lazzarotto, A.; Calamai, A. Studio geologico del substrato della copertura vulcanica laziale delle zone dei laghi di Bolsena, Vico e Bracciano. Mem. Soc. Geol. Ital. 1974, 13, 575–606. [Google Scholar]
  32. Capelli, G.; Mazza, R.; Gazzetti, C. Strumenti e Strategie per la Tutela e L’uso Compatibile Della Risorsa Idrica Nel Lazio: Gli Acquiferi Vulcanici; Pitagora Group: Bologna, Italy, 1995; p. 191. [Google Scholar]
  33. Curewitz, D.; Karson, J.A. Structural settings of hydrothermal outflow: Fracture permeability maintained by fault propagation and interaction. J. Volcanol. Geotherm. Res. 1997, 79, 149–168. [Google Scholar] [CrossRef]
  34. Faulds, J.E.; Hinz, N.H. Favorable tectonic and structural settings of geothermal systems in the Great Basin region, western USA: Proxies for discovering blind geothermal systems. In Proceedings of the World Geothermal Congress, Melbourne, Australia, 19–25 April 2015; p. 6. [Google Scholar]
  35. Buonasorte, G.; Carboni, M.G.; Conti, M.A. Il substrato plio-pleistocenico delle vulcaniti sabine: Considerazioni stratigrafiche e paleoambientali. Boll. Soc. Geol. Ital. 1991, 110, 35–40. [Google Scholar]
  36. Sinclair, A.J. Selection of threshold values in geochemical data using probability graphs. J. Geochem. Explor. 1974, 3, 129–149. [Google Scholar] [CrossRef]
  37. Matheron, G. The Theory of Regionalized Variables and Its Applications; Cahiers du Centre de Morphologie Mathematique: Fontainbleau, France, 1971. [Google Scholar]
  38. Goovaerts, P. Geostatistics for Natural Resources Evaluation; Oxford University Press: New York, NY, USA, 1997. [Google Scholar]
  39. Cinti, D.; Tassi, F.; Procesi, M.; Bonini, M.; Capecchiacci, F.; Voltattorni, N.; Vaselli, O.; Quattrocchi, F. Fluid geochemistry and geothermometry in the unexploited geothermal field of the Vicano–Cimino volcanic district (central Italy). Chem. Geol. 2014, 371, 96–114. [Google Scholar] [CrossRef]
  40. Cinti, D.; Tassi, F.; Procesi, M.; Brusca, L.; Cabassi, J.; Capecchiacci, F.; Delgado Huertas, A.; Galli, G.; Grassa, F.; Vaselli, O.; et al. Geochemistry of hydrothermal fluids from the eastern sector of the Sabatini Volcanic District (central Italy). Appl. Geochem. 2017, 84, 187–201. [Google Scholar] [CrossRef]
  41. Ranaldi, M.; Lelli, M.; Tarchini, L.; Carapezza, M.L.; Patera, A. Estimation of the geothermal potential of the Caldara di Manziana site in the Sabatini Volcanic District (central Italy) by integrating geochemical data and 3D-GIS modelling. Geothermics 2016, 62, 115–130. [Google Scholar] [CrossRef]
  42. The Australian Geothermal Reporting Code Committee. Australian Code for Reporting of Exploration Results, Geothermal Resources and Geothermal Reserves; The Geothermal Reporting Code, 2nd ed.; Australian Geothermal Energy Group (AGEG): Adelaide, Australia, 2010.
  43. Lemmon, E.W.; McLinden, M.O.; Friend, D.G. Thermophysical properties of fluid systems. In NIST Chemistry Web-Book, NIST Standard Reference Database Number 69; Linstrom, P.J., Mallard, W.G., Eds.; National Institute of Standards and Technology: Gaithersburg, MD, USA, 2003. [Google Scholar]
  44. Cerling, T.E.; Solomon, D.K.; Quade, J.; Bowman, J.R. On the isotopic composition of carbon in soil carbon dioxide. Geochim. Cosmochim. Acta 1991, 55, 3403–3405. [Google Scholar] [CrossRef]
  45. Craig, H. The isotopic geochemistry of water and carbon in geothermal areas. In Nuclear Geology on Geothermal Areas; Tongiorgi, E., Ed.; CNR (Italian Council for Research, Rome): Spoleto, Italy, 1973; pp. 17–54. [Google Scholar]
  46. Rollinson, H. Using Geochemical Data; Longman Group: London, UK, 1993. [Google Scholar]
  47. Parkhurst, D.L.; Appelo, C.A.J. Description of Input and Examples for PHREEQC Version 3—A Computer Program for Speciation, Batch-Reaction, One-Dimensional Transport, and Inverse Geochemical Calculations; U.S.G.S. Techniques and Methods, Book 6; U.S. Geological Survey: Denver, CO, USA, 2013; Chapter A43; p. 497. Available online: http://pubs.usgs.gov/tm/06/a43 (accessed on 1 June 2017).
Figure 1. (a) Geological sketch map of the Vicano–Cimino Volcanic District (VCVD) and Sabatini Volcanic District (SVD) showing the location of the fluid sampling sites; (b) location of test-holes, geothermal wells, and exploration permits (from [12,35]); (c) simplified geological model for the VCVD and SVD geothermal systems (from [1]).
Energies 11 00142 g001
Figure 2. Histogram of logpCO2 values of the collected waters.
Energies 11 00142 g002
Figure 3. QQ plot of logpCO2 values of the collected waters. The black arrow at the logpCO2 value of −1.347 (0.045 bar) separate the background populations (A,B) from those (C,D) where CO2 partially derives from deep sources.
Energies 11 00142 g003
Figure 4. Experimental semi-variogram of the log-transformed pCO2 data.
Energies 11 00142 g004
Figure 5. Map of pCO2 distribution as obtained from ordinary kriging after back-transformation. The assumption is that areas with anomalous pCO2 values represent the potentially exploitable geothermal reservoirs in the VCVD and the SVD (for any detail relative to the numbered areas see Table 2). Test-holes and geothermal wells are also reported in the map (see also Figure 1b).
Energies 11 00142 g005
Table 1. Basic statistics (quantitative data) relative to the whole population of pCO2 values.
StatisticspCO2 (bar)
No. of Observations664
Minimum0.001
Maximum0.98
First Quartile0.008
Median0.017
Third Quartile0.055
Mean0.089
Variance (n − 1)0.034
Standard Deviation (n − 1)0.184
Inter Quartile Range0.046
Skewness3.158
Kurtosis10.386
Table 2. Evaluation of fluid production rate (t/h) and theoretical geothermal potential (MWt) [13,20] calculated through the revised volume method of [14] for the VCVD and the SVD.
AreaIDA (km2)h (km)V (km3)Q (t/h)Tmin (°C)Tmax (°C)W (MWt)
Civitavecchia1852.6221884050 185 1257–619
Monte Romano–Blera2362.0722880150 2175 2432–527
Tuscania3421.9803192175 3200 3584–700
Viterbo–Grotte S. Stefano4822.2180721660 180 1310–497
Canale Monterano–Mt. Solferata51042.42509984150 2200 21498–2189
Manziana622.24176120 4165 420–30
Capranica762.515600100 1150 153–90
Trevignano831.44168120 5140 519–23
Castel Campanile991.09360100 5125 532–43
Nepi10241.5361440150 3200 3216–316
Isola Farnese11251.7431700100 1110 1149–170
Castelnuovo di Porto–Sacrofano12111.820792100 5130 570–99
Orte–Montecchie13502.6130520025 150 10–163
Ponzano Romano1472.61872875 5100 542–64
Fiano Romano15202.856224025 150 10–65
A = area of the geothermal reservoir calculated by kriging; h = average thickness of the geothermal reservoir; V = volume of the geothermal reservoir; Q = discharge rate of the geothermal fluid; Tmin-max = minimum and maximum temperatures of the geothermal reservoir; W = theoretical thermal power.1 [12]; 2 [19]; 3 [39]; 4 [40]; 5 [41].

