Article

Multi-Objective Scheduling Optimization Based on a Modified Non-Dominated Sorting Genetic Algorithm-II in Voltage Source Converter−Multi-Terminal High Voltage DC Grid-Connected Offshore Wind Farms with Battery Energy Storage Systems

Department of Energy System Engineering, Chung-Ang University, 84 Heukseok-ro, Dongjak-gu, Seoul 156-756, Korea
*
Author to whom correspondence should be addressed.
Energies 2017, 10(7), 986; https://doi.org/10.3390/en10070986
Submission received: 18 May 2017 / Revised: 1 July 2017 / Accepted: 10 July 2017 / Published: 12 July 2017
(This article belongs to the Special Issue Battery Energy Storage Applications in Smart Grid)

Abstract

:
Improving the performance of power systems has become a challenging task for system operators in an open access environment. This paper presents an optimization approach for solving the multi-objective scheduling problem using a modified non-dominated sorting genetic algorithm in a hybrid network of meshed alternating current (AC)/wind farm grids. This approach considers voltage and power control modes based on multi-terminal voltage source converter high-voltage direct current (MTDC) and battery energy storage systems (BESS). To enhance the hybrid network station performance, we implement an optimal process based on the battery energy storage system operational strategy for multi-objective scheduling over a 24 h demand profile. Furthermore, the proposed approach is formulated as a master problem and a set of sub-problems associated with the hybrid network station to improve the overall computational efficiency using Benders’ decomposition. Based on the results of the simulations conducted on modified institute of electrical and electronics engineers (IEEE-14) bus and IEEE-118 bus test systems, we demonstrate and confirm the applicability, effectiveness and validity of the proposed approach.

1. Introduction

The paradigm change of power systems has created a need to modify traditional power systems for efficient energy supply [1]. The use of high voltage direct current (HVDC) transmission systems allows for power transfer over longer distances with lower losses and improved power system controllability, and such systems are expected to become an essential technology in integrating renewable energy sources as transmission system backups [2]. In particular, multi-terminal HVDC (MTDC) systems can simultaneously manage both active power and reactive power, and they provides a cost-effective solution for power system operation at each terminal independent of the direct current (DC) power transmission. In contrast to line-commutated converters (LCCs), a voltage source converter (VSC) is more suitable for establishing an MTDC system, because VSCs do not need reactive power demand and are able to control the reactive power to preserve the alternating current (AC) grid voltage as a generator [3]. However, VSC-MTDC power transmission systems cannot be independently adjusted in the steady state owing to the limited active power capability of the VSC-HVDC, even though the output voltage magnitude and phase angle can be controlled. Therefore, a need exists for further research on power system operation to determine a suitable method for supplying additional active power to maintain the stability and reliability of the power system.
Various studies associated with optimal power flow (OPF) in renewable energy systems have been performed, such as those on VSC-HVDC and static synchronous compensator (STATCOM) [4,5,6,7,8]. In [4,5,6], an OPF-based control scheme was proposed to minimize the loss in an MTDC network for large offshore wind farms (WFs). A comprehensive OPF solution for a meshed AC/DC system with an MTDC network for offshore wind power transmission to minimize the transmission loss of the whole system with the grid code has been studied in [7]. In [8], a mixed AC/DC OPF model was developed for incorporating the VSC-MTDC system with a general configuration that can be used for operating and planning an AC transmission system with an embedded VSC-MTDC system. However, these studies only optimized the operation of the DC grid, and the AC system is not considered in the analysis. Therefore, conducting further studies related to WFs with VSC-MTDC systems need to be conducted by considering the entire power system, for an optimal operation of the AC/WF grids.
In addition, some recent works considered multi-objective optimization with renewable energy [9,10,11]. A method has been proposed to optimize the planning of a bundled wind–thermal generation and transmission system taking into account the fuel cost, capital cost, maintenance cost, and loss based on the simulated annealing (SA) algorithm [12]. However, these studies focused only on the transmission expansion planning for multi-objective optimization, and some of the researches still lack in the optimization approach for power system operation. In [13], the authors presented a multi-objective model to find the solution of the optimal schedule of the units’ energy and reserves by integrating a thyristor-controlled series compensator (TCSC) device-based non-dominated sorting genetic algorithm II (NSGA-II) with the optimization problem developed under normal and contingency cases. In [14], a design using a detached net zero-energy house located in Southern Italy to minimize thermal and visual discomfort using NSGA-II was presented. Though the NSGA-II algorithm encompasses several advanced concepts, including elitism, fast non-dominated sorting approach and diversity maintenance along the Pareto-optimal front, it still falls short in maintaining lateral diversity and obtaining the Pareto-front with high uniformity.
Energy-storage systems (ESS), which are capable of receiving energy, storing it for a period of time, and then returning it for use, can play an important role in power system control and significantly improve HVDC performance [15]. An ESS can be used in an electrical grid to balance supply and demand. Compared to other technologies, the battery energy storage system (BESS) is the most cost-effective option coupled with power-electronic devices for an optimal operation of power systems. In recent times, various studies have been conducted on integrated systems for optimal operation [16,17,18]. A control strategy including a hierarchical scheme has been developed for a multi-terminal HVDC network [16]. In [17], the demand response and ESS have been introduced to reduce the influence of wind power output uncertainty on the power system stability using the real-time outputs of thermal units and wind turbines and real-time charging/discharging behavior of energy storage. In [18], the authors presented a new coordination control scheme between an offshore WF and a hydrogen management system for reducing the adverse impacts of wind variability. Even though, most of the studies discussed the advantages of coupling HVDC with ESS, they only focused on the control strategy. Hence, there is a need to investigate the compensation of active and reactive power together with the control scheme of an integrated power system. In particular, the benefits arising from the integration of VSC-HVDC with ESS include the independent control of active and reactive power, fast and reversible control of the power flow, and asynchronous decoupling of existing AC grids.
This paper proposes an economical optimization solution for multi-objective scheduling using the modified NSGA-II (MNSGA-II) in a hybrid network station (HNS) that is installed to regulate the active and reactive power control of meshed AC/WF grids. On using a VSC-MTDC system and the BESS, the HNS becomes capable of independent active and reactive power absorption from the grid and power injection into the grid. The integrated system focuses on the HNS operational capability and the BESS operational strategy for optimal multi-objective scheduling. We apply the optimization process based on the BESS charging/discharging strategy for the multi-objective scheduling while considering realistic demand profiles to arrive at the optimal solution. Moreover, decomposition-based optimization, which is applied as a part of the optimization formulations with the required HNS constraints to mitigate the violation for improving the overall computational efficiency, is also formulated in the proposed approach for meshed AC/WF grids. Using Benders’ decomposition (BD), the determination of the meshed AC.WF grid criteria is essentially decoupled from the multi-objective OPF, and these sub-problems can be solved independently. Therefore, the proposed scheduling solutions for multi-objective OPF are more feasible and economical, and the proposed Pareto solutions indicate the improved performance exhibiting faster convergence and divergence.
The rest of this paper is organized as follows in Section 2, the modeling of the HNS for the meshed AC/WF grids is described, and the control and charging/discharging strategy based on the HNS are discussed. The optimization problem of the meshed AC/WF grids is formulated using parallel processing-based MNSGA-II, and the optimization process for optimal operation is summarized in Section 3. Section 4 presents and discusses the case study, and the conclusions are presented in Section 5.

2. Hybrid AC/WF Network System

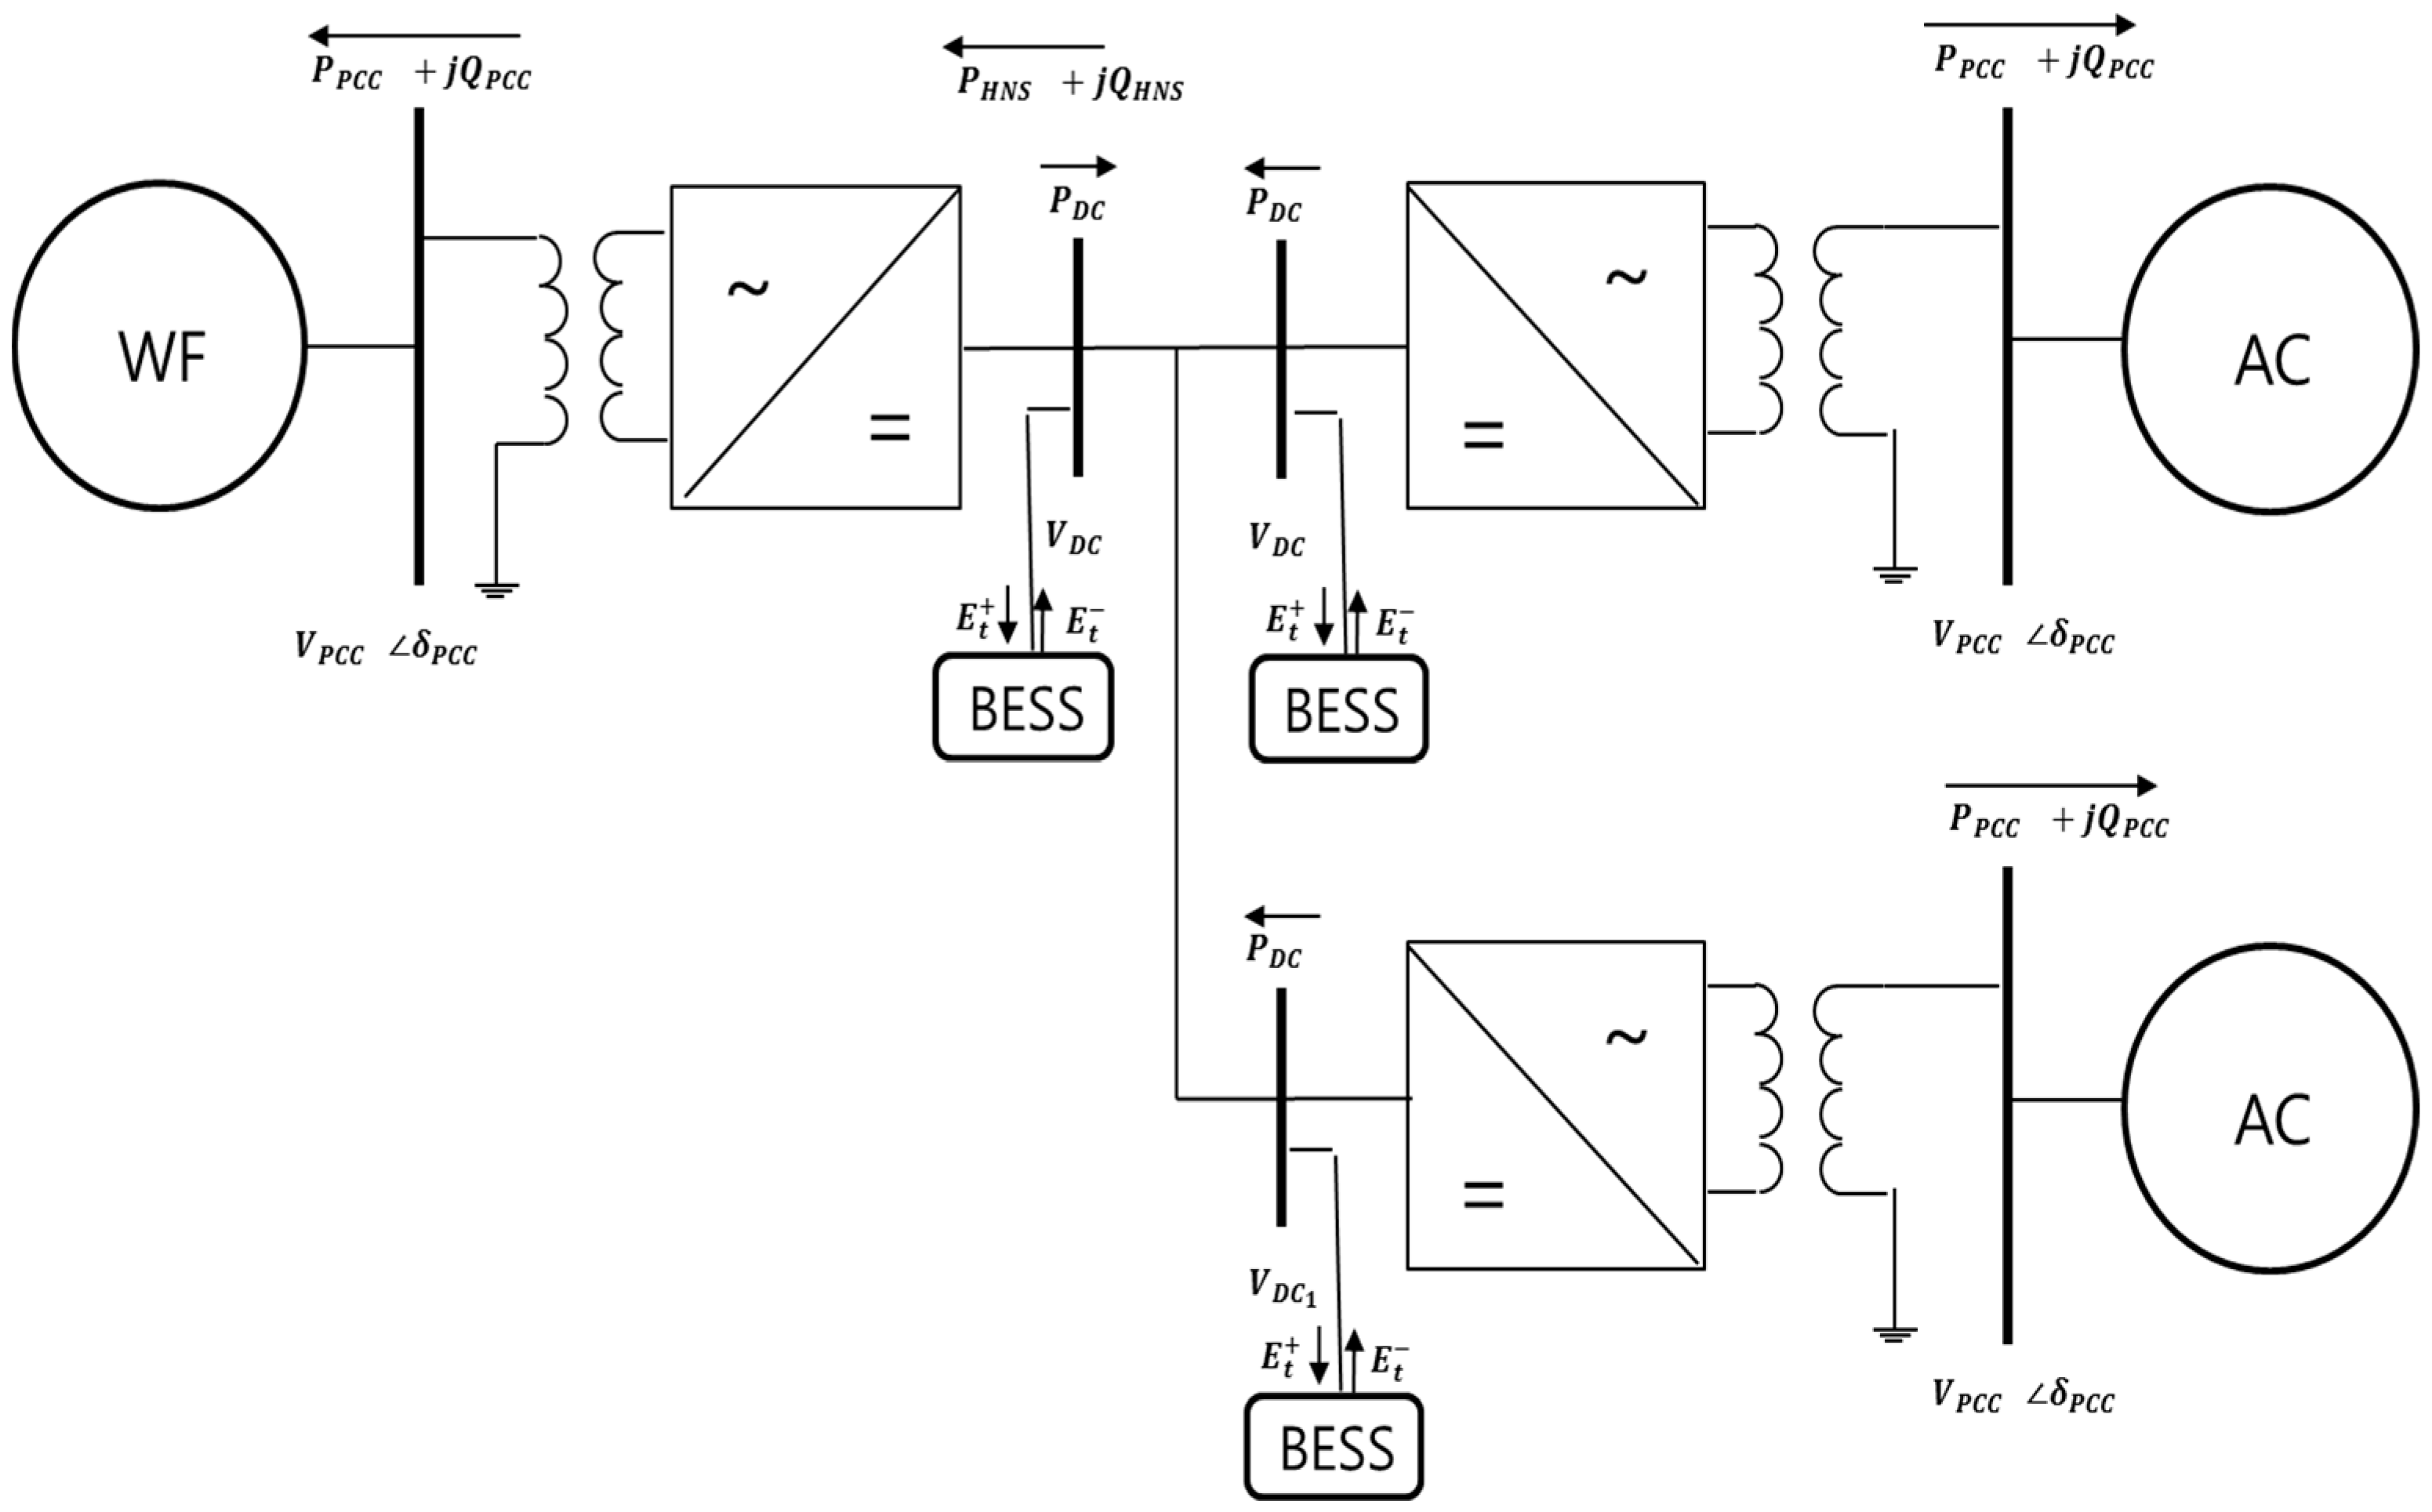
Figure 1 depicts the configuration of the hybrid network system that includes a VSC-MTDC and a BESS linking two different grids (i.e., AC and WF grids). More specifically, the system consists mainly of an AC bus, a coupling transformer, a BESS, a phase reactor, a converter block on the AC and DC sides, a DC bus, DC capacitors, and DC lines. In the system, power can only be transmitted in a unidirectional manner from the rectifier station to the inverter station. In general, the DC capacitor is not a bulk energy-storage device; the VSC-HVDC may not have the ability to provide active power compensation [19]. Thus, this study is aimed at expanding the power regulation ability of the VSC-HVDC to enable both active and reactive power compensation by placing the BESS between the rectifier and inverter stations. Depending on the connected HVDC and BESS, the active/reactive power can be independently absorbed or injected from/to the grid. Consequently, the ability of the HNS to effectively provide extra active power enables the expansion of its compensating actions, thus, reducing transmission losses and improving power system operation of the meshed AC/WF grids.

2.1. Control of the AC/WF Grids

2.1.1. Onshore HNS Control

In an onshore HNS, the control strategy uses the voltage and power regulation mechanism. As shown in Figure 1, the active and reactive powers introduced from the point of common coupling (PCC) bus to the converters in the active and reactive power control modes (PQ mode), are designated as P P C C and Q P C C , respectively. In the PV mode, the magnitude of the voltage at the PCC bus is denoted as V P C C . The converter connected to the DC slack bus regulates the DC voltage around a designated value and compensates the DC line losses. The BESS is also installed at P H N S between the PCC bus and converter. The active power of all converters is identified through the PCC bus, with the exception of the slack converter. The active power of the slack converter can only be decided by the loss of the converter, DC line, and the other converter’s power flow.

2.1.2. Offshore HNS Control

The offshore HNS operates as a rectifier, and all of the AC energy delivered by the WF is transformed to DC and sent to land through the DC cables. However, the conversion must be conducted on an AC grid because this HNS control requires AC voltage to operate properly. To satisfy these requirements, this station is equipped with a control loop that adjusts the AC voltages on the PCC between the WF converter and the offshore HNS.

2.1.3. Wind Farm Converter Control

The WF converter takes the energy generated from the wind and supplies it to the offshore grid. The DC voltage control detects variations in the power owing to the charging and discharging of the DC capacitor. This outer control assigns a certain amount of current proportional to the wind power of the meshed AC/WF grid. Depending on the decouple control in the synchronous reference frame, reactive current can also be injected into the system [20].

2.2. BESS Operational Strategy

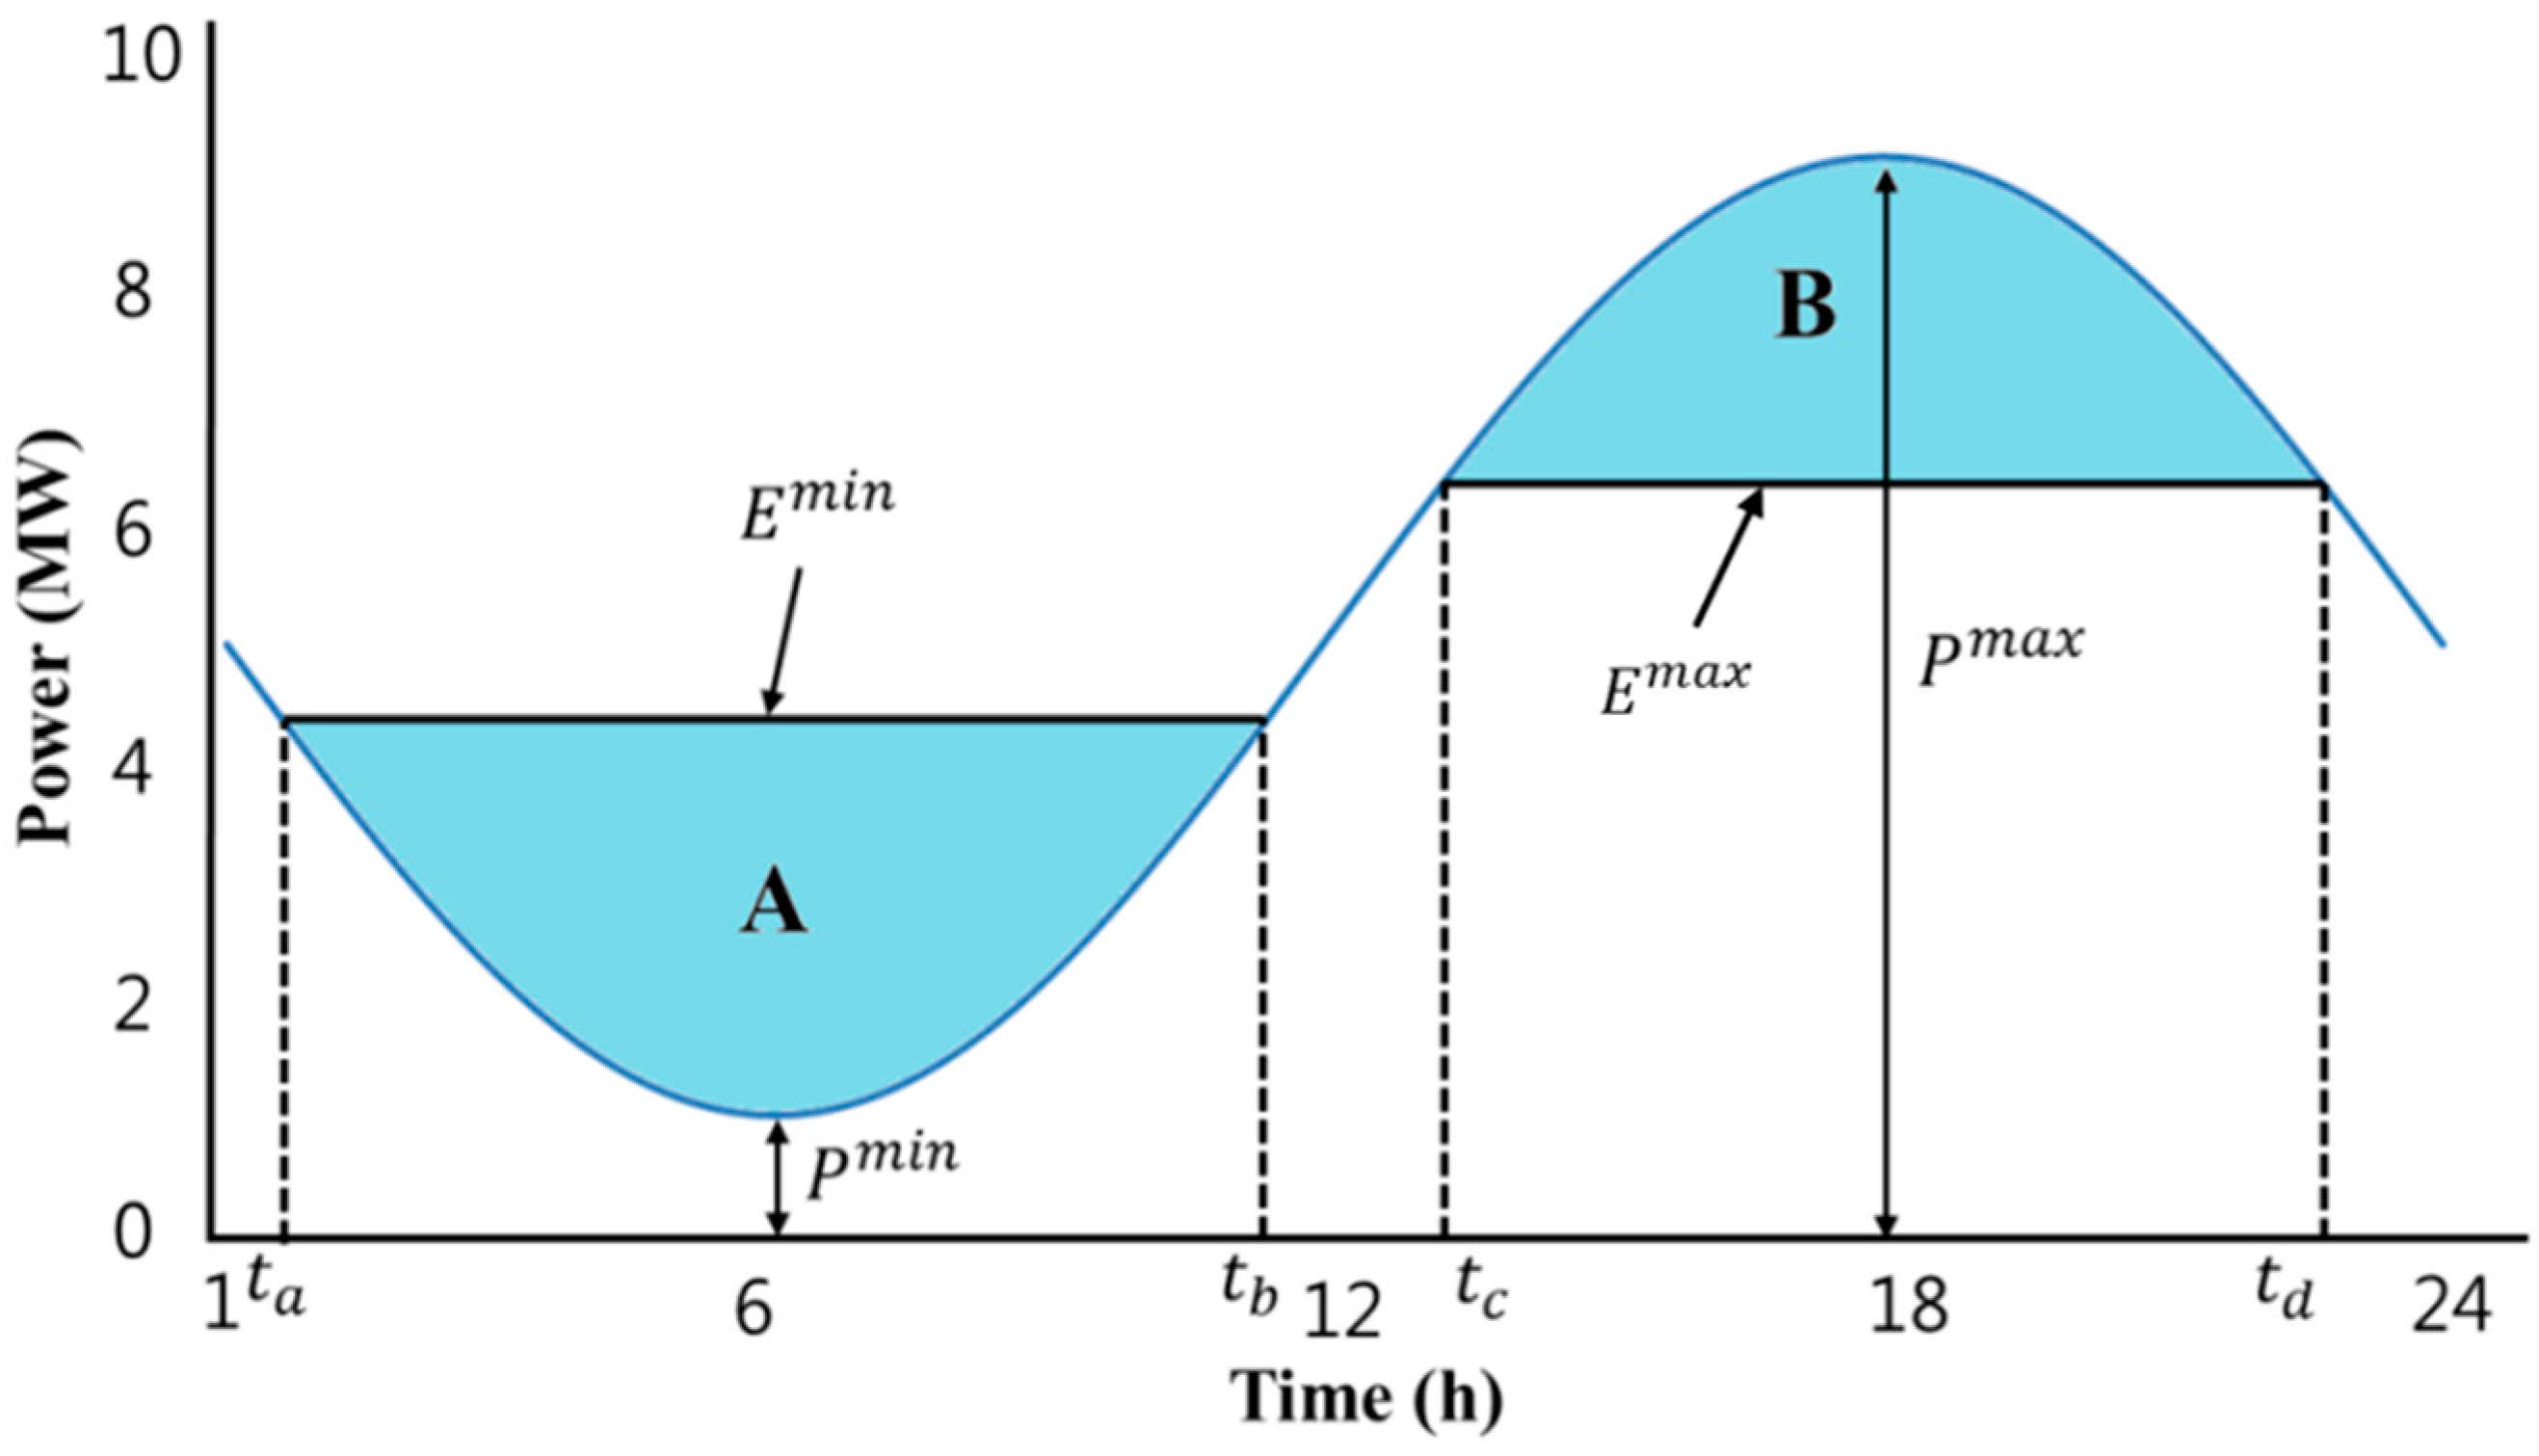
The BESS operational strategy can be explained with the help of Figure 2. The battery strategy can be applied in real time, but the start and stop times should be planned based on the 24 h demand profile prediction.
The impact of the charging/discharging strategy is denoted by the shaded areas, which represent the energy. In the absence of the HNS, the feeder load is represented by a blue line. The feeder load increases as energy is transferred to the grids, which is indicated by the shaded area throughout the charging process. The charging process operates such that to minimize the cost of the energy purchased, Area A occupies a region as close as possible to E min when t a < t < t b . Meanwhile, discharging takes place as close as possible to E max to maximize the price of the energy delivered when t c < t < t d (Area B).

3. Decomposition-Based Multi-Objective OPF Formulation

3.1. Master Problem

In the proposed approach, the master problem computes an optimal solution without considering the BESS, WF, and control constraints to avoid the complication associated with the meshed AC/WF grids, as follows [21]:
M i n U t , X t F ( ω 1 Z 1 , t ω 2 Z 2 , t ) s . t . G t ( U t , X t ) = 0 G D C , t ( U t , X t ) = 0 H t min H t ( U t , X t ) H t max H D C , t min H t ( U t , X t ) H D C , t max S k ( u t ) 0

3.1.1. Objective Functions

In Equation (1), the master problem is computed by minimizing two different objectives for optimal operation before starting BD iterations without any Benders’ cut: the total operating cost, and total power losses of the meshed AC/WF grids. The first objective function is the minimization of the total operating cost. In addition, the cost function of the storage units depends only on the actual storage capacity:
min F 1 = t = 1 24 i = 1 N G ( A c i + B c i P g i , t + C c i P g i , t 2 + c b i ( E t max E t ) )
The second objective function is the minimization of the total power loss:
min F 2 = P A C l o s s , t + P D C l o s s , t + P c o n l o s s , t

3.1.2. AC System Constraints

The set G t corresponds to the power flow equality constraints, i.e., the conventional power flow equations:
G t ( U t , X t ) = G t ( V t , θ t , K G , t , P t , Q t ) = 0
The power flow equations of the AC grid are modified by incorporating the active power injections from the HNS and the converter losses as below:
P i , t = V i , t t = 1 24 i = 1 N A ( g i j , t c o s ( δ i , t δ j , t ) + b i j , t s i n ( δ i , t δ j , t ) ) V j , t P H N S i , t + P c o n l o s s i , i N A
Q i , t = V i , t t = 1 24 j = 1 N A ( g i j , t sin ( δ i , t δ j , t ) b i j , t c o s ( δ i , t δ j , t ) ) V j , t Q H N S i , t    , i N A
The active power loss of the AC transmission line can be expressed as follows:
P A C l o s s , t = 0.5 i N A j N A g i j , t ( V i , t 2 + V j , t 2 2 V i , t V j , t c o s ( δ i , t δ j , t ) )
The inequality constraints in (1) are divided into H t , which represents the physical and security limits of the system. The inequality constraints, H t ( Z t ) , include the following:
Generator active power limits:
P g i min P g i , t P g i max    , i N G
Generator reactive power limits:
Q g i min Q g i , t Q g i max    , i N G
AC bus voltage limits:
V i min V i , t V i max    , i N A
AC transmission line capacity limit:
S i j min S i j , t S i j max    , i N A , j N A

3.1.3. DC System Constraints

In this study, we treated the balanced bipolar VSC configuration as the standard operation mode. When the VSC is considered a lossless power exchanger, P D C is almost equal in magnitude to P V S C but has an opposite direction, as follows:
P V S C = P D C
The active/reactive power of the VSC can be calculated by using the following expressions.
P V S C max = V P C C max V V S C max s i n δ t X V S C , t
Q V S C max = V P C C max ( V V S C max V P C C max c o s δ t ) X V S C , t
When the system is operated in bipole mode, the active power loss on the DC cables is defined as:
P D C l o s s = i D C N D j D C N D g i D C j D C ( V i D C V j D C ) 2
DC power balance equation is written as:
P i D C , t = 2 V i D C , t t = 1 24 j D C N D V j D C , t g i D C j D C , t
The active power loss of the VSCs can also be expressed as a quadratic function of the phase current of the VSC valves:
P c o n l o s s , t = i = 1 N D ( A l i + B l i I v i , t + C l i I v i , t 2 )
The phase current of the VSC valves is represented as:
I v i , t = P V S C i , t 2 + Q V S C i , t 2 3 V V S C i , t    i N D
The power flow of the VSC is given by:
P V S C i = V V S C i 2 g V S C i V V S C i ( g V S C i cos δ V S C i b V S C i cos δ V S C i )
Q V S C i = V V S C i 2 b V S C i + V V S C i ( b V S C i sin δ V S C i + b V S C i cos δ V S C i )
The maximum apparent power range is determined by maximizing the current and the actual AC voltage:
P V S C 2 + Q V S C 2 = | S V S C | | V V S C I v max |
DC bus voltage limits:
V i D C min V i D C , t V i D C max
DC transmission line flow limits:
P i D C j D C min P i D C j D C , t P i D C j D C max

3.2. Benders’ Cut

The last constraint defined in (1) is referred to as a benders’ cut, which is a linear constraint that regulates the feasible area to impose the coordination of the solution of the master problem and the sub-problem, as follows:
S k ( u t ) = S k ( u k , t ) + z c ( u t u k , t ) 0
The Benders’ cut should be produced based on the sub-problem results, where the coefficients of the linear estimation are the Lagrangian multiplier vectors z c , which are related to the constraints at the optimal solution of the sub-problem. These vectors z c denote the sensitivity with respect to the infeasibility, which is mainly caused by the cumulative changes in the operation point of the base case.

3.3. Sub-Problems

To minimize the violations, we transferred the solutions obtained from the master problem to the sub-problems. The objective of the sub-problem is to simultaneously minimize violations regarding the BESS, WF, and control constraints as follows:
S k ( u t ) = t ( S B E S S , t + S W F , t ) s . t . G t ( U t , X t ) = 0 G D C , t ( U t , X t ) = 0 H t min H t ( U t , X t ) H t max H D C , t min H D C , t ( U t , X t ) H D C , t max ( u t u k , t ) S B E S S , t 0 ( u t u k , t ) S W F , t 0 S B E S S , t 0 S W F , t 0
If the objective function S k ( u t ) is equal to zero, we obtain a reasonable solution that will not enforce additional constraints on u k , t . However, if S k ( u t ) is larger than zero, the solution will offer the number of violations entailed in the coupling constraints to the master problem. In the sub-problems, the constraints (5)–(23) must be considered, and then the additional equations considering the BESS and WF constraints are as follows.

3.3.1. BESS Constraints

The balance equation of the charging/discharging and the discrete time model of AC/WF are as follows:
P B E S S ( E 0 + t = 1 24 E t + E t ' ) = t = 1 24 E t
E i , t = E i , t 1 r i , t b i , l o s s
Assuming that the BESS cannot charge and discharge simultaneously, its charging/discharging state should obey the equation:
E t + E t = 0

3.3.2. Wind-Farm Constraints

An algebraic relation between wind speed and mechanical power according to the Rankine–Froude theory [22] is as follows:
P W = 0.5 ρ A ν 3 C p ( α , β )
We used numerical approximations to calculate the power coefficient of rotor efficiency for nonlinear function by using values of the tip speed ratio and the pitch angle [23]. Here, the following approximation:
C p ( α , β ) = 0.53 ( 151 α i 0.58 β 0.002 β 2.14 10 ) exp ( 18.4 α i )
is used with:
α i = 1 1 α 0.02 β 0.003 β 3 + 1
The tip speed ratio for wind turbines is defined as the ratio between the tangential speed of the tip of a blade and the actual speed of the wind. ( α = Tip speed of blade/Wind speed). The tip speed of the blade can be calculated in B r times Ω , as follows:
α = B r Ω ν
Higher tip speeds result in higher noise levels and require stronger blades due to the large centrifugal forces. Once all of the sub-problems become reasonable, all of the problems are solved. On the other hand, when the constraint violations in the sub-problems cannot be eliminated, Benders’ cuts are generated. The master problem is then solved iteratively with the added benders’ cuts to provide information while satisfying all of the constraints.

3.4. Modified NSGA-II

When power systems are under stressed operational conditions with numerous violations and are non-linear in solving scheduling problems, conventional methods are almost impossible to apply because of the tremendous central processing unit (CPU) times required and the divergence of the solution [24]. Mathematically, both the master problem and sub-problems can be solved using any of the advanced techniques for solving multi-objective scheduling problems. In our study, MNSGA-II is adopted to deal with the BD in accordance with multi-objective optimization scheduling. Because of the tradeoff between operating costs and power losses, the system operator is greatly encouraged to consider the “Pareto optimal” for the MNSGA-II while enhancing system operation. This algorithm encompasses advanced concepts including elitism, fast non-dominated sorting and diversity maintenance along with the Pareto-optimal solution.

3.4.1. Controlled Elitism

In controlled elitism, MNSGA-II restricts the number of individuals in the current best non-dominated front adaptively and maintains a predefined distribution number of individuals in each front. First, the combined parent and offspring population R h = P o p h O f f h is sorted for non-domination. Let N f be the number of non-dominated fronts in the combined population (of size 2M). According to the geometric distribution, the maximum number of individual allowed in the y t h front ( y = 1 , 2 , , N f ) in the new population of size M y is given in (33):
M y = M 1 γ 1 γ N f γ y 1
Since γ < 1 , the maximum allowable number of individuals in the first front is the highest. Thereafter, each front is allowed to have an exponentially reducing number of solutions.

3.4.2. Dynamic Crowding Distance

Horizontal diversity is often realized by removing excess individuals in the non-dominated set when the number of non-dominated solutions exceeds the population size. NSGA-II uses crowding distance (CD) measure as given in (34) to remove excess individuals:
C D i = 1 N o b j g = 1 N o b j | f i + 1 g f i 1 g |
All of the previous operators are the main processes of NSGA-II. Although the CD operator is implemented to ensure the diversity along the non-dominated front in NSGA-II, the uniform diversity is lost with the slowing down of the search speed. If the basement CD is applied, individuals that can help to maintain a uniform spread are removed. To overcome the drawback of NSGA-II, a dynamic crowding distance (DCD) is introduced as described in [25]. Above all, the biggest difference between CD and DCD is that CD is just calculated once, but DCD is varied during the selection of offspring generation:
D C D i = C D i l o g ( 1 V a r i )
where C D i is calculated by Equation (36), and V a r i is given as follows:
V a r i = 1 N o b j g N o b j ( | f i + 1 g f i 1 g | C D i ) 2
In this work, the controlled elitism and DCD are used for criteria of the Pareto-optimal solution. Owing to the tradeoff between total operating costs and power losses, the system operator is greatly encouraged by the appreciation of the “Pareto optimal” for the MNSGA-II while improving the stability of power system. The two-stage convergence criterion is then applied in multi-objective scheduling optimization by checking the u k + 1 , t while taking into account s k ( u t ) = 0 . Therefore, the criterion of multi-objective optimization process must be satisfied with the two-stage convergence, based on the criterion of Pareto-optimal solution assessment including the controlled elitism and DCD of the MNSGA-II.

3.5. Solution Procedure

The optimization approach for multi-objective scheduling of meshed AC/WF grids is performed in the following sequential manner:
Step 1:
Set the input parameters and the lower and upper limits of each variable of the power system.
Step 2:
Choose population size M , crossover and mutation probability, crossover and mutation index, and maximum number of generations.
Step 3:
Determine the apparent power parameter for the HNS, the storage capacity for the BESS, and the update of control modes.
Step 4:
Calculate the 24 h average load through the base case results. Subsequently, the obtained 24 h average load can be used as a reference for the BESS operational strategy.
Step 5:
Compare the average load with the total load, which is obtained through the 1 hour OPF. If the total load is higher than the average load, the BESS will proceed to discharge; otherwise, if the total load is less than the average load, the BESS will proceed to charge.
Step 6:
Solve the master problem without the bender’s cut and obtain the initial base-case solution.
Step 7:
After the base-case u t is obtained by solving the master problem without the BESS constraints, the sub-problems are solved to find a new base-case u k , t . Here the u k , t values from the different sub-problems are simultaneously returned to the master problem.
Step 8:
Once the violations are detected in the sub-problems, the master problem is solved with all the benders’ cuts included. This creates a new base-case u k + 1 , t .
Step 9:
Solve the sub-problem in parallel with the new base case u k + 1 , t .
Step 10:
The two-stage process is repeated until u k + 1 , t is found, for which all s k ( u t ) = 0 .
Step 11:
If the objective function s k ( u t ) is equal to zero in all the sub-problems, then the process stops; otherwise, it is repeated from Step 5.
A flowchart of the detailed approach is shown in Figure 3.

4. Case Study

4.1. Data Setting

The proposed approach was examined using the modified IEEE-14 bus and IEEE-118 bus test system. The generation cost coefficients and system data are obtained from [26]. The characteristics of each DC line and converter are listed in Table 1. The capacity of each HNS is 200 MVA. The maximum limitations of the storage energy and charging/discharging power rate in the BESS are 100 MWh and 20 MW, respectively. The cost of power purchased/sold from/to the meshed AC/WF grid through the PCC can be found in [27], where the linear cost coefficient C b for the BESS is equal to $1/MWh.
Convergence metric, spread/diversity metric (SD), inverted generational distance (IGD) and minimum spacing metric (MS) were calculated for the obtained non-dominated solutions using NSGA-II and MNSGA-II [28]. To select the appropriate parameter setting for these parameters, 100 independent trials were conducted and the optimal parameters selected are given in Table 2. Here, the initial weight factor ω 1 was set at 0.4.

4.2. Simulation Results

We performed simulations using the MATLAB software (Natick, MA, USA) and the general algebraic modelling system (GAMS). A bridge between GAMS and MATLAB, namely the GAMS-MATLAB interface [29], is used as an innovative technique in the proposed method. To realize the superior performance of the proposed approach, we considered the following four cases: Case 1: Conventional AC/WF grids; Case 2: Case 1+VSC-MTDC; Case 3: Case 1+BESS; and Case 4: Case 1+HNS. In the following subsections, we discuss the results of these cases.

4.2.1. Modified IEEE-14 Bus System

A three-terminal HNS is embedded in the modified IEEE-14 bus system as illustrated in Figure 4. This system consists of 14 AC buses, three DC buses, five generators, 20 AC branches, three DC branches, three HNSs, one WF, and 11 load sides. The converter HNS 1 that is connected to bus 9 controls the DC voltage at DC bus 1 in the meshed AC/WF grids. The other two converters, i.e., HNS 2 and HNS 3, are connected to AC bus 11 and the WF, respectively.
The effect of the charging/discharging strategy of the HNS is depicted in Figure 5. Figure 5a illustrate the hourly generator output with the HNS. In general, the power injected by the generator is equal to the load curve in the base condition without the charging/discharging strategy. However, it can be seen from Figure 5a that unit outputs become smooth after the charging/discharging of the HNS to realize peak shaving and energy savings.
Figure 5b also shows the advantages of using the HNS. The storage unit avoids peaks (from 6:00 p.m. to 7:00 p.m.) and thereby reduces the cost value to $27,263. Figure 6 shows a comparison of the voltage profile results in different cases. It can be observed that the voltage levels of all DC converters should be within the possible voltage range (between 0.9 and 1.1 p.u). Moreover, all the voltage results in Case 4 are smoother than those in the other cases, because the HNS supports active/reactive power compensation and maintain a constant frequency. Thus, the proposed approach can reduce the variation and provide a stable voltage profile within operational performance.
Detailed results of the proposed approach for each case are summarized in Table 3. We observe that the operating cost in Case 4 is lower than that of all the others, although the total power loss in Case 4 is higher than that in Case 1. This is because the additional HNS constraints are excluded in Case 1. However, the operational cost obtained for Case 4 is reduced by $75,662/h compared to Case 1. Therefore, it should be noted that the proposed approach provides the best balance between economical and reliable operation.

4.2.2. Modified IEEE-118 Bus System

To validate the practicability of the proposed approach for large-scale power systems, we used the modified IEEE-118 bus system as shown in Figure 7. The DC voltage at DC bus 1 is also controlled by the converter HNS 1, which is connected to WF 1. The other five converters, i.e., HNS 2, HNS 3, HNS 4, HNS 5, and HNS 6, are connected to AC buses 8, 10, 16, 117, and WF 2, respectively. Then the capacity of the converter for this test system is 300 MVA.
Figure 8 shows a comparison of the voltage profile results for each case. Taking into consideration the results of the IEEE-14 bus test system that was discussed earlier, the voltage profile is smoother and better in Case 4 than in the other cases because of the active/reactive power compensation. As shown in Figure 8, the voltage levels of all DC buses have been included in the possible voltage range (between 0.9 and 1.1 p.u). Moreover, the storage unit decreased the cost value to $341,826. These results indicate that the proposed approach can effectively enhance the performance of the power-system operation.
Table 4 shows the optimization results of the operation solutions. Note that the total power loss in Case 1 is the lowest when compared to the other cases because the VSC-MTDC or BESS constraints are not considered. However, the operating cost in Case 4 is the lowest of all the cases. Overall, the results obtained in Case 4 are superior to those obtained in the other cases. The total operating cost is $2,477,376/h which is $590,164/h (or 19.24%) lower than that of Case 1, and the total power loss is 118.34MW. These results indicate that the proposed approach can effectively enhance the performance in terms of operating cost and power loss minimization for optimal operation.

4.3. Performance Test

To validate the multi-objective performance of MNSGA-II, the Pareto solutions with NSGA-II and MNSGA-II are compared with the results of 100 simulations on the IEEE-14 and IEEE-118 bus test systems. The best obtained Paretosolutions are illustrated in Figure 9. As shown in Figure 9a,b when the weighting factors are ω 1 = 0.91 and ω 2 = 0.09, the convergence points of NSGA-II and MNSGA-II are obtained at the 20th iterations and the 18th iterations, respectively.
Meanwhile, when the weighting factors are ω 1 = 0.49 and ω 2 = 0.51, the convergence points of NSGA-II and MNSGA-II in Figure 9c,d are determined at 89th iterations and 85th iterations, respectively. Therefore, it can be observed that there is an improvement in the performance of the MNSGA-II as it exhibits a faster convergence speed and lower number of iterations. Table 5 presents the statistical analysis for consistency of the performance measures such as convergence, spread, IGA and minimum spacing. On comparing the two algorithms, it is observed that the standard deviation is less in MNSGA-II for both test systems. The obtained statistical result clearly shows a better performance of MNSGA-II over NSGA-II.
For each test system, the computational times taken by the proposed approach with and without BD are compared in Table 6. In Case 4, the run times with BD require approximately 3.04 min and 7.18 min which are 11.17 min (or 78.6%) and 37.64 min (or 83.98%) faster than those without BD for the modified IEEE-14 and IEEE-118 bus system, respectively. From the results obtained from the distributed computing technique, we see that there is a significant improvement in the speeds of the computational times. The parallel processing nature that is expected to reduce the computational burden is reiterated, and the results show that the running time of the proposed approach can readily meet the requirements of realistic power system operation. Therefore, overall efficiency can be improved by parallel processing that can easily achieve scalable computational performance.
To show the better performance of the proposed approach, Table 7 presents the comparison results of Pareto-optimal solutions obtained in Case 4. The optimization parameters may be set through experiment because the multi-objective optimization techniques are sensitive to proper selection of the control parameter. In our work, genetic algorithm (GA), particle swarm optimization (PSO), and NSGA-II parameters for each system were applied from [30,31,32], respectively. As shown in Table 7, it can be seen that the total operating cost and total power loss are less in MNSGA-II than in other algorithms for both test systems. Thus, the proposed approach provides an optimal operation solution to assist in decision making, whenever there is a trade-off between operating cost and power loss in the power systems. The run time of the proposed approach is also highly reduced than others, especially for large power systems because of the parallel processing based on a BD. Moreover, MNSGA-II can be made a lower number of iterations and a faster convergence speed according to the crowded tournament selection and Pareto ranking. These results show that the proposed approach can be suitable for the requirements of realistic power system operation.

5. Conclusions

In this paper, an optimization approach for solving the multi-objective scheduling problem using the MNSGA-II algorithm in meshed AC/WF grids was proposed. This approach involved employing voltage and power control modes based on VSC-MTDC and a BESS in the entire power system. By installing the BESS between an HNS and a PCC bus, the power regulation capability of a VSC-MTDC was expanded to both active and reactive power compensation. The integrated system focused on HNS control and the BESS operational strategy for achieving optimal multi-objective scheduling. Furthermore, we formulated the optimization problem taking into account HNS constraints using BD. The effectiveness of the proposed approach was verified by simulation results in the test system. The simulation results show that the proposed approach can effectively enhance the performance in terms of operation cost and power loss minimization for optimal operation. We determined that the DC voltages were stable at an available level and were compared with NSGA-II and MNSGA-II using various multi-objective performance measures. Thus, the proposed approach offers economic benefits for power systems and overall a better performance of power system operation by stabilizing the voltage as well as minimizing the loss in the meshed AC/WF and the cost involved.

Acknowledgments

This research was supported by the Chung-Ang University Research Scholarship Grants in 2017. This research was also supported by Basic Science Research Program through the National Research Foundation of Korea (NRF) funded by the ministry of Education (2017R1D1A1B03029308).

Author Contributions

Ho-Young Kim proposed the main idea of this paper and Mun-Kyeom Kim coordinated the proposed approach in the manuscript. San Kim provided essential information and supported in manuscript preparation. All authors read and approved the manuscript.

Conflicts of Interest

The authors declare no conflict of interest.

Nomenclature

Sets
N A Set of all AC buses
N D Set of all DC buses
N G Set of all generators
N O Set of all objectives
T Set of all time (hour)
Indices
D C Index of DC system
g Index of objectives
i , j Index of AC bus, generator, VSC station
i D C , j D C Index of DC bus
t Index of time
Constants
A c i , B c i , C c i Cost coefficient of generator i [$]
A l i , B l i , C l i VSC loss coefficient of VSC i [p.u.]
B r Blade radius of wind turbine [m]
b i j Susceptance element of AC network admittance matrix [p.u.]
c b i Cost coefficient of storage of BESS i [$]
C p Power coefficient of rotor efficiency [p.u.]
D Q VSC reactive power lower limit factor
g i D C j D C Conductance element of DC network admittance matrix [p.u.]
g i j Conductance element of AC network admittance matrix [p.u.]
M Population size
M y New population size
i Nominal rating of VSC station [MVA]
P B E S S Energy conversion efficiency coefficient of BESS
R r Resistance of VSC phase reactor [p.u.]
V n o m D C Nominal DC bus voltage [kV]
X V S C Reactance of VSC phase reactor [p.u.]
η DC voltage utilization ratio
ρ Air density [1.22 kg·m−3]
Variables
F ( ) Objective function
G ( ) Vector function representing the equality constraints
G D C ( ) Vector function for DC representing the equality constraints
H ( ) Vector function representing the inequality constraints
H D C ( ) Vector function for DC representing the inequality constraints
E 0 Initial SOC of BESS [p.u.]
E t SOC of BESS at time t
E t + Charging power of BESS at time t
E t Discharging power of BESS at time t
I v Phase current of VSC valve [p.u.]
f c Objective function for the total operating cost
f l Objective function for the total power loss
f g k + 1 g t h objective of the k + 1 t h individual
f g k 1 g t h objective of the k 1 t h individual
K G Scalar variable used to account for the system losses by means of either a unique or distributed slack bus
P c o n l o s s Total active losses of HNSs [p.u.]
P DC power at VSC DC bus [p.u.]
P H N S Active power at HNS AC bus [p.u.]
P d i Active load at bus i [p.u.]
P g i Active power output form generator i [p.u.]
P i Active power at AC bus i [p.u.]
P i j Active power flow between nodes i and j
P i D C , P j D C DC power at DC bus i D C , j D C [p.u.]
P i D C j D C DC power flow of DC cable i D C - j D C [p.u.]
P P C C Active power at PCC bus [p.u.]
P V S C Active power at VSC AC bus [p.u.]
Q d i Reactive load at bus i [p.u.]
Q g i Reactive power output form generator i [p.u.]
Q H N S Reactive power at HNS AC bus [p.u.]
Q i Reactive power at AC bus i [p.u.]
Q P C C Reactive power at PCC bus [p.u.]
Q V S C Reactive power at VSC AC bus [p.u.]
S i j Power flow of AC transmission line i - j [p.u.]
S V S C Apparent power at VSC AC bus [p.u.]
U Vector of the control (independent) variables
u 0 Base-case control vector
V a r i Variance of CDs
V D C DC Voltage at VSC DC bus [p.u.]
V i D C , V j D C Voltage magnitude at DC bus i D C and j D C [p.u.]
V i , V j Voltage magnitude at AC bus i and j [p.u.]
V P C C Voltage magnitude at PCC bus [p.u.]
V V S C Voltage magnitude at VSC AC bus [p.u.]
X Vector of states (dependent) variables
Z = [ U X ] T Vector of the decision variables
α Tip speed ratio
β Pitch angle
γ Reduction rate
θ Bus voltage of angle [p.u.]
δ i , δ j Voltage angle at AC bus i and j [degree]
δ V S C i Voltage angle at VSC AC bus i [degree]
ν Wind speed [m/s]
Ω Rotational speed
ω Weighting factor of operating cost and power loss
μ Barrier parameter

References

  1. Kim, M.K.; Hur, D. Decomposition-coordination strategy to improve power transfer capability of interconnected systems. Int. J. Electr. Power Energy Syst. 2011, 33, 1638–1647. [Google Scholar] [CrossRef]
  2. Heo, J.H.; Kim, M.K.; Park, G.P.; Lee, S.S.; Kim, D.H. A Reliability-Centered Approach to an Optimal Maintenance Strategy in Transmission Systems Using a Genetic Algorithm. IEEE Trans. Power Deliv. 2011, 26, 2171–2179. [Google Scholar] [CrossRef]
  3. ABB Power Technologies AB. It’s Time to Connect Technical Description of HVDC Light Technology. Available online: http://www.abb.com (accessed on 6 March 2013).
  4. Hingorani, N.G.; Gyugyi, L. Understanding FACTS: Concepts and Technology of Flexible AC Transmission Systems; IEE Press: Piscataway, NJ, USA, 1999. [Google Scholar]
  5. Higgins, P.; Foley, A.M.; Douglas, R.; Li, K. Impact of offshore wind power forecast error in a carbon constraint electricity market. Energy 2014, 76, 187–797. [Google Scholar] [CrossRef]
  6. Sahu, R.K.; Panda, S.; Padhan, S. A novel hybrid PSO-PS optimized fuzzy PI controller for AGC in multi area interconnected power system. Int. J. Electr. Power Energy Syst. 2015, 64, 9–23. [Google Scholar] [CrossRef]
  7. Cao, J.; Du, W.; Wang, H.F.; Bu, S.Q. Minimization of transmission loss in meshed ac/dc grids with VSC-MTDC networks. IEEE Trans. Power Syst. 2013, 28, 3047–3055. [Google Scholar] [CrossRef]
  8. Wang, F.; Le, A.T.; Lina, B.T.; Anders, M.; Anders, B. A new approach for benefit evaluation of multiterminal VSC-HVDC using a proposed mixed AC/DC optimal power flow. IEEE Trans. Power Deliv. 2014, 29, 432–443. [Google Scholar]
  9. Ming, M.; Wang, R.; Zha, Y.; Zhang, T. Multi-objective optimization of hybrid renewable energy system using an enhanced multi-objective evolutionary algorithm. Energies 2017, 10, 674. [Google Scholar] [CrossRef]
  10. Gholamalizadeh, E.; Kim, M.H. Multi-objective optimization of a solar chimney power plant with inclined collector roof using genetic algorithm. Energies 2016, 9, 971. [Google Scholar] [CrossRef]
  11. Ko, M.J.; Kim, Y.S.; Chung, M.H.; Jeon, H.C. Multi-objective optimization design for a hybrid energy system using the genetic algorithm. Energies 2015, 8, 2924–2949. [Google Scholar] [CrossRef]
  12. Xie, K.; Dong, J.; Tai, H.M.; Hu, B.; He, H. Optimal planning of HVDC-based bundled wind-thermal generation and transmission system. Energy Convers. Manag. 2016, 115, 71–79. [Google Scholar] [CrossRef]
  13. Sardou, I.G.; Ameli, M.T. ANGIS-based non-dominated sorting genetic algorithm II for scenario-based joint energy and reserves market clearing considering TCSC devise. Int. Trans. Electr. Energy Syst. 2015, 25, 3349–3373. [Google Scholar] [CrossRef]
  14. Carlucci, S.; Cattarin, G.; Causone, F.; Pagliano, L. Multi-objective optimization of a nearly zero-energy building based on thermal and visual discomfort minimization using a non-dominated sorting genetic algorithm (NSGA-II). Energy Build. 2015, 104, 378–394. [Google Scholar] [CrossRef]
  15. Ribeiro, P.F.; Johnson, B.K.; Crow, M.L.; Arsoy, A.; Liu, Y. Energy Storage Systems for Advanced Power Applications. Proc. IEEE 2001, 89, 1744–1756. [Google Scholar] [CrossRef]
  16. Carrizosa, M.J.; Navas, F.D.; Damm, G.; Lagarrigue, F.L. Optimal power flow in multi-terminal HVDC grids with offshore wind farms and storage devices. Int. J. Electr. Power Energy Syst. 2015, 65, 291–298. [Google Scholar] [CrossRef]
  17. Tan, Z.; Li, H.; Ju, L.; Song, Y. An Optimization Model for large-scale Wind Power Grid Connection Considering Demand Response and Energy Storage Systems. Energies 2014, 7, 7282–7304. [Google Scholar] [CrossRef]
  18. Melo, D.F.R.; Chang, C.L.R. Synergiestic control between hydrogen storage system and offshore wind farm for grid operation. IEEE Trans. Sustain. Energy 2014, 5, 18–27. [Google Scholar] [CrossRef]
  19. Tao, Z.; Francois, B. Energy management and power control of a hybrid active wind generator for distributed power generation and grid integration. IEEE Trans. Ind. Electron. 2011, 58, 95–104. [Google Scholar]
  20. Badihi, H.; Youmin, Z.; Hong, H. Active power control design for supporting grid frequency regulation in wind farms. Ann. Rev. Control. 2015, 40, 70–81. [Google Scholar] [CrossRef]
  21. Kim, M.K.; Park, J.K.; Nam, Y.W. Market-clearing for pricing system security based on voltage stability criteria. Energy 2011, 36, 1255–1264. [Google Scholar] [CrossRef]
  22. Heier, S. Grid Integration of Wind Energy Conversion Systems; Wiley: Hoboken, NJ, USA, 1998. [Google Scholar]
  23. Slootweg, J.G.; Haan, S.W.H.; Polinder, H.; King, W.L. General model for representing variable speed-wind turbines in power system dynamics simulations. IEEE Trans. Power Syst. 2003, 18, 144–151. [Google Scholar] [CrossRef]
  24. Deb, K. Multi-Objective Optimization Using Evolutionary Algorithms; Wiley: Chichester, UK, 2001. [Google Scholar]
  25. Luo, B.; Zheng, J.; Xie, J.; Wu, J. Dynamic crowding distance-A new diversity maintenance strategy for MOEAs. In Proceedings of the IEEE international conference on natural computation, Jinan, China, 18–21 October 2008; pp. 580–585. [Google Scholar]
  26. Zimmeman, R.D.; Murillo, S.C.E. Matpower: A Matlab Power System Simulation Package. 2015. Available online: http://www.pserc.cornell.edu/matpower/ (accessed on 16 December 2016).
  27. Maffei, A.; Meola, D.; Maragloti, G.; Palmieri, G.; Iannelli, L.; Mathisen, G.; Bjerkan, E.; Glielmo, L. Optimal Power Flow model with energy storage, an extension towards large integration of renewable energy sources. IFAC Proc. Vol. 2014, 47, 9456–9461. [Google Scholar] [CrossRef]
  28. Sato, H.; Aguirre, H.E.; Tanaka, K. Controlling dominance area of solutions and its impact on the performance of MOEAs. In EMO 2007, Lecture Notes in Computer Science; Springer: Berlin/Heidelberg, Germany, 2007; Volume 4403, pp. 5–20. [Google Scholar]
  29. Ferris, M.C. MATLAB and GAMS: Interfacing Optimization and Visualization Software; Computer Sciences Department, University of Wisconsin-Madison: Madison, WI, USA. Available online: http://www.cs.wisc.deu/math-prog/matlab.html (accessed on 26 May 2005).
  30. Gerbex, S.; Cherkaoui, R.; Germond, A.J. Optimal location of multi-type FACTS devices in a power system by means of Genetic Algorithms. IEEE Trans. Power Syst. 2001, 16, 537–544. [Google Scholar] [CrossRef]
  31. Mondai, D.; Chakrabarti, A.; Sengupta, A. Optimal placement and parameter setting of SVC and TCSC using PSO to mitigate small signal stability problem. Int. J. Electr. Power Energy Syst. 2012, 42, 334–340. [Google Scholar] [CrossRef]
  32. Marouani, I.; Guesmi, T.; Abdallah, H.H.; Ouali, A. Application of NSGA-II approach to optimal location of UPFC devices in electrical power systems. J. Sci. Res. 2011, 10, 592–603. [Google Scholar]
Figure 1. Configuration of AC/WF grids.
Energies 10 00986 g001
Figure 2. Charging/discharging strategy for the 24 h load.
Energies 10 00986 g002
Figure 3. Flowchart of the proposed approach.
Energies 10 00986 g003
Figure 4. Modified IEEE-14 bus system.
Energies 10 00986 g004
Figure 5. (a) Hourly generator output with HNS; (b) Storage active power capacity. Effect of charging/discharging strategy in the modified IEEE-14 bus system.
Energies 10 00986 g005
Figure 6. Comparison of the voltage deviation for each case in the modified IEEE-14 bus system.
Energies 10 00986 g006
Figure 7. Modified IEEE-118 bus system.
Energies 10 00986 g007
Figure 8. Comparison of the voltage deviation for each case in the modified IEEE-118 bus system.
Energies 10 00986 g008
Figure 9. (a) Operating cost for IEEE-14 bus system; (b) Power loss for IEEE-14 bus system; (c) Operating cost for IEEE-118 bus system; (d) Power loss for IEEE-118 bus system. Comparison of the Pareto-solutions with NSGA-II and MNSGA-II.
Energies 10 00986 g009
Table 1. Parameters of VSC-MTDC.
ParameterValueParameterValue
Orat1000 MVARr0.0001 p.u.
VnomDC±300 kVAli0.0625
Iv10 p.u.Bli0.00165
Xr10 p.u.Cli0.00021
Table 2. Parameter selection for NSGA-II and MNSGA-II.
ParameterIEEE 14 Bus SystemIEEE 118 Bus System
NSGA-IIMNSGA-IINSGA-IIMNSGA-II
Population size200200500500
Max. no. of generations100100100100
Crossover probability0.80.80.90.9
Mutation probability1/121/121/751/75
Crossover index1122
Mutation index10102020
Table 3. Detailed results for each case in the modified IEEE-14 bus system.
Case 1Case 2Case 3Case 4
Active power (MW)268.42270.81275.27278.42
Reactive power (MVAR)100.96116.32111.65118.17
Total power loss (MW)51.3456.9959.1853.85
Total operating cost ($/h)393,274338,618374,687317,612
Table 4. Detailed results for each case in the modified IEEE-118 bus system.
Case 1Case 2Case 3Case 4
Active power (MW)4263.424282.174286.764291.25
Reactive power (MVAR)302.68326.38318.13338.94
Total power loss (MW)118.16123.76128.39118.34
Total operating cost ($/h)3,067,5402,641,2232,922,5662,477,376
Table 5. Statistical results of performance measures.
Test SystemMeasureAlgorithmBestMeanWorstStandard Deviation
IEEE-14 busConvergenceNSGA-II0.00070.00890.00110.0032
MNSGA-II0.000690.00100.00090.0001
SDNSGA-II1.04041.14991.31360.1052
MNSGA-II0.85130.88160.89850.0103
MSNSGA-II0.014130.01540.01680.0011
MNSGA-II0.00680.00870.01050.0011
IGDNSGA-II0.00170.00190.00230.0004
MNSGA-II0.00180.00190.00200.0001
IEEE-118 busConvergenceNSGA-II0.00160.00160.00170.00005
MNSGA-II0.00130.00160.00180.0007
SDNSGA-II0.48240.49910.53250.0289
MNSGA-II0.39530.39570.39640.0005
MSNSGA-II0.02290.02450.02760.0027
MNSGA-II0.02140.02270.02540.0023
IGDNSGA-II0.00160.00170.00200.0002
MNSGA-II0.00130.00150.00190.0030
Table 6. Run time for each case with test systems.
IEEE-14 Bus System (min)IEEE-118 Bus System (min)
Without BDWith BDWithout BDWith BD
Case 111.422.4142.716.17
Case 212.872.6843.126.43
Case 312.352.7443.036.37
Case 414.213.0444.827.18
Table 7. Comparison result among GA, PSO, NSGA-II and MNSGA-II for Case 4.
Test SystemAlgorithmTotal Operating Cost ($/h)Total Power Loss (MW)Run Time (min)
IEEE-14 bus systemGA338,11464.1812.38
PSO332,37162.4112.87
NSGA-II321,84655.1414.61
MNSGA-II317,61253.853.04
IEEE-118 bus systemGA2,624,341164.3142.73
PSO2,587,742147.7243.16
NSGA-II2,492,627124.8648.67
MNSGA-II2,477,376118.347.18

