
The Optimal Configuration Scheme of the Virtual Power Plant Considering Benefits and Risks of Investors

1
School of Economics and Management, North China Electric Power University, Baoding 071003, China
2
State Grid Longyan Electric Power Company, Longyan 364000, China
3
School of Electrical and Electronic Engineering, North China Electric Power University, Baoding 071003, China
*
Authors to whom correspondence should be addressed.
Energies 2017, 10(7), 968; https://doi.org/10.3390/en10070968
Submission received: 2 May 2017
/
Revised: 6 July 2017
/
Accepted: 6 July 2017
/
Published: 11 July 2017
(This article belongs to the Section F: Electrical Engineering)
Abstract
:A virtual power plant (VPP) is a special virtual unit that integrates various distributed energy resources (DERs) distributed in the generation and consumption sides. The optimal configuration scheme of the VPP needs to break the geographical restrictions to make full use of DERs, considering the uncertainties. First, the components of the DERs and the structure of the VPP are briefly introduced. Next, the cubic exponential smoothing method is adopted to predict the VPP load requirement. Finally, the optimal configuration of the DER capacities inside the VPP is calculated by using portfolio theory and genetic algorithms (GA). The results show that the configuration scheme can optimize the DER capacities considering uncertainties, guaranteeing economic benefits of investors, and fully utilizing the DERs. Therefore, this paper provides a feasible reference for the optimal configuration scheme of the VPP from the perspective of investors.
1. Introduction
The economic level and energy demand have continually increased, leading to deterioration of the ecological environment, global warming, fossil energy depletion, and many other serious problems for human survival and development. Such problems have become increasingly prominent. Thus, countries around the world have introduced innovative policies to encourage enterprises and units to optimize their energy structure and actively promote energy conservation and emission reduction to achieve sustainable development of the economy. In this new situation, the penetration of distributed energy resources (DERs) in the distribution network is increasing, attracting worldwide attention [1]. DERs are composed of distributed power generations, distributed energy storages, demand side resources, etc. These DERs have the advantages of environmental protection, low energy consumption, investment savings, and improved power system flexibility [2].
The output characteristics of DERs are different, and their scales are generally small and scattered. The ability of a distribution network to absorb DER capacity is limited, and scheduling and control strategies are relatively scarce. If a large amount of DERs are directly connected to the network, it would cause a very large impact on the system, which could not meet the higher standards of power supply quality requirements [3]. To solve the absorption problem of DERs, the development of virtual power plants (VPPs) has been given more attention by academics and industry at home and abroad [4,5,6,7,8]. A VPP is not a true power plant but, instead, gathers all DERs inside its service region, including photovoltaic units, wind turbines, micro-gas turbines, and other distributed power generators, as well as interruptible loads, energy storage equipment, and electric vehicles, as a whole, for participation in the power system operation and electricity market transactions. Therefore, all kinds of DERs can be fully utilized to achieve the goal of energy conservation and emission reduction.
The development of VPP projects has grown recently, such as the VPP project based on power-matching technology in Stirling (developed by the Netherlands Energy Research Center) [9], the flexible electricity network to integrate expected energy solution projects (FENIX project) of the European Union [10], Germany’s professional virtual power plant (Pro-VPP) project [11], and Denmark’s EDISON project [12]. The internal control of the VPP, based on a mathematical programming model and a multi-agent system, has three different structures (centralized structure, centralized-decentralized structure, and decentralized structure) with similar purposes of optimizing the DER’s placement and sizing in a distribution system [8]. The objectives of such an optimal configuration usually contains real power loss, voltage deviation, average voltage total harmonic distortion, and system average voltage dip magnitude, which could all be transferred into economic indices of VPP operations and stand for the benefits of VPP operators [13,14,15,16,17]. To maximize the profits or minimize the operating treatment costs of the VPP, a dynamic programming search method and practical intelligence algorithms, such as genetic algorithms, gravitational search algorithms, particle swarm optimization, and the relatively-improved algorithms are usually employed to calculate the optimization model [13,14,15,16,17].
The uncertainties of various DERs, including price uncertainty, forecasting error of DERs, and load fluctuation, would inevitably affect the benefits of VPPs, the research on which has been carried out [18,19,20,21]. In order to maximize the profits while minimizing the risks, a satisfaction function that can reflect the VPP’s preference, including conservative, neutral, and adventurous, has been introduced in [18]. According to [19], uncertain factors in VPPs could be characterized by fuzzy parameters, which could be expressed by the trapezoidal membership function. Unlike the previous studies on VPP operations considering uncertainties that almost exclusively use the stochastic programming approach [20], reference [21] requires a deterministic uncertainty set, rather than the hard-to-obtain probability distribution on the uncertain data, which could result in a smaller computational cost, as well as better economic benefits of VPPs.
However, the above studies mostly analyze the profits and uncertainties from the perspective of the technical application of the VPP, which is not familiar to investors [13,14,15,16,17,18,19,20,21]. In this paper, the investment benefits and risks of the investors are emphasized, and the strategy to allocate the DER capacities inside the VPP in the long-term will be further studied.
With the development of micro-grids and their increasing practical application, research on distributed power generation capacity allocation of micro-grids is growing as well. Therefore, most of the research on the DER optimal configuration in VPPs mainly draws on the capacity allocation methods of micro-grids.
The VPP logically aggregates diverse DERs, such as distributed generation, controllable load and energy storage devices, based on information and communication technology, enhancing the controllability of DERs in the power grid and making full use of various DERs distributed in the generation and consumption sides [8]. The micro-grid is a combined network with a typical topological structure of several distributed generations and relative loads, which could connect to the power grid or separately operate [22]. The VPP and the micro-grid both deal with the problem of DER consumption in the power system. However, their design ideas and constituted conditions are different. The VPP focuses on attracting and aggregating multiple DERs, participating in the dispatch of the power grid and trades in the power market, while the micro-grid mainly concentrates on regional autonomy, including grid-connected operation in a normal condition and isolated island operation in a network fault condition. Additionally, the distribution range of DERs inside the VPP is much larger than the micro-grid, including various generators in the generation side and demand side resources in the customer side. However, the micro-grid usually accepts distributed generators that are geographically close to the customer side with fewer DERs [23,24,25].
Currently, grid-connected and independent modes are the two main operating modes of micro-grids [26,27]. To make full use of DERs and guarantee the reliability of the power supply, the operation mode of VPPs in this paper draws on the combined operation pattern of the independent mode, which indicates that the VPP could be an individual unit or serve the power grid if necessary. In this mode, the DER capacity allocation methods in the micro-grid usually focus on controllability, economic benefits, environmental protection and reliability, based on strategies of load analysis and optimal control [28]. The objectives are minimizing the operation costs [29] and maximizing the permeation rate of clean DERs [30], and the constraints include reliability and security indices [31]. Analytical methods, heuristic algorithms, and stochastic optimization algorithms are usually adopted to optimize the solution of the above configuration. However, micro-grids cannot be easily separated and reorganized, and their configuration scheme and operation strategy mostly concentrate on local application of DERs, which has certain limitations on the aggregation of large-scale and scattered DERs of VPPs.
The remainder of this paper is organized as follows: In Section 2, a variety of DERs are encapsulated into the VPP based on the information and communication technology to be coordinated and controlled. In Section 3, the exponential smoothing method is adopted in the forecast of the VPP sub-area yearly load density per hour in the long-term, and the optimal configuration of the DER capacities inside the VPP is calculated by using the portfolio theory. In Section 4, the case analysis provides an application example of the above models. In Section 5, a short conclusion is made, which shows that the mentioned optimal configuration scheme with portfolio theory can optimize the DER capacities inside the VPP considering the uncertainties of DER.
2. The Components of DERs
The DERs that form the VPP could be the same or different and may be centralized in a certain area or decentralized over a broad region. The various DERs with different characteristics could be divided into three classes, including distributed generation, demand-side resources, and distributed energy storage, as shown in Figure 1.
The external features of the VPP include the overall characteristics of all DERs, and the control center ensures the coordinated operation inside. The information and communication technology, together with the high level software architecture, is employed by the VPP control center to centrally aggregate all types of DERs. The grid-connected structure and the distributed topology of DERs can remain the same, and it is unnecessary to build more power tie lines. Furthermore, the characteristics of different DERs, such as wind power and photovoltaic power, could be complementary, and the uncertainties could be offset to some degree.
3. The Optimal Configuration Scheme of the VPP
The service regions of the VPP are divided based on the region types and load density characteristics, and the exponential smoothing method is adopted in the forecast of the sub-area yearly load density per hour in the long-term, which can be used to obtain the total load requirement of the VPP’s service regions. On that basis, the optimal configuration of the DER capacities inside the VPP is calculated by the portfolio theory.
3.1. The Division of the Service Regions of the VPP
The major factors of the division include the region space, administrative level, load density, and user types. First, the rough ranges are decided by the region space and administrative level. Then, the refinement of the division is completed according to load density and user types. Some applicable protocols are used to guarantee the power distribution reliability and improve the economic and environmental benefits.
On the above basis, the service regions of the VPP can be divided into 11 classes, including residential, industrial, commercial, administrative, cultural, medical, educational, municipal, warehouse, traffic, and agricultural, as shown in Figure 2.
3.2. The Forecast of Yearly Load Density per Hour
The optimal configuration of the DER capacities inside the VPP must consider the growth of load requirements in the long-term. Therefore, E(βk) is a vital factor. According to the development tendency of the economic level and developmental characters of the load, the cubic exponential smoothing method of the time sequence model, which overcomes the disadvantages of the single rising tendency and lag [32], is adopted to predict E(βk) to simulate the development of the load.
where yt is the time series; R is the number of yt; α ∈ (0, 1) is the weighting coefficient (default: 0.2); and dt(1), dt(2), and dt(3) are values of single, double, and cubic exponential smoothing.
The forecast model of the cubic exponential smoothing method is shown in Equation (4):
where Yt+l is the lth forecast value; and L is the total number of forecast values.
Select several forecast values of each βk to obtain its mean value, which could represent E(βk), and calculate the Pa of all the regions of the VPP according to Equation (2).
3.3. The Optimal Configuration of the VPP Based on the Portfolio Theory
The Markowitz portfolio theory of modern finance is introduced to allocate the DER capacities inside the VPP in the long-term, and the expectation and variance of the rate of return are the metrics of benefits and risk. Based on the average value-variance model, the optimal configuration of the VPP intends to minimize the variance while maintaining the expected revenue or maximize the expected revenue while maintaining the variance [33].
The fluctuation of the expected revenue is mainly generated by the uncertainties of various DERs inside the VPP. Therefore, thermal power units are needed to stabilize the fluctuation caused by the DERs and fulfill the total load requirement.
From the macroscopic perspective, the uncertainties of different DERs are mapped to the price fluctuations in the portfolio problem:
where ϕv is the rate of return of unit capacity of the VPP; m is the number of DERs inside the VPP; ηi is the capacity ratio of DERi; and pi, gi and ai are the output, electrovalence, and cost of unit capacity of DERi.
The expected value and variance of ϕv are E(ϕv) and σv2, shown in Equations (6) and (7).
If the ratio of the load requirement fulfilled by the VPP is µ, then the ratio of the thermal power units is 1 − µ. The optimal total capacity ratio of the VPP is µ*, and the optimal capacity proportions of the DERs inside the VPP are µ*·ηi* (I = 1, 2, ..., m), which could be calculated by Equations (8)–(11):
where ϕG is the rate of return of unit capacity of the thermal power unit (unit G); pG, gG and aG are the output, electrovalence, and cost of unit capacity of unit G; aGf is the generating cost; aGe is the penalty cost of pollution emission; aGc is the cost of carbon emission; aGe0 is the basic emission cost; and αF-H is the proportionality coefficient of the emission penalty considering fog and haze, which is an empirical value established by the air quality and government policy:
where kv is the Sharpe Ratio, which reflects the extraneous income of risk.
The objective of the investor is to achieve the utility maximization:
where A ∈ [2, 6] reflects the aversion degree of the investor toward risk. A < 4 indicates a preference for risk, A > 4 indicates an aversion to risk, and A = 4 indicates risk neutral. The default value of A is 6 in this paper, which indicates risk aversion in the model.
The result of Equation (10) is shown in Equation (11):
Therefore, µ*, 1 − µ* and µ*·ηi* (I = 1, 2, ..., m) can be obtained.
4. Case Analysis
4.1. The Solving Procedure
First, the yearly load density is forecast by the cubic exponential smoothing method, and then the portfolio theory is adopted to calculate the optimal configuration of the DER capacities inside the VPP, as shown in Figure 3.
4.2. Parameters Setting of the GA
Parameters of the GA optimization refer to the default values of the GA toolbox, mainly listed as follows:
- (1)
- Population: population type (double vector), population size (50), creation function (constraint dependent), initial population (default), initial scores (default), initial range ([−10, 10]).
- (2)
- Fitness scaling: scaling function (rank).
- (3)
- Selection: selection function (stochastic uniform).
- (4)
- Reproduction: elite count (0.05 × population size), crossover fraction (0.8).
- (5)
- Mutation: mutation function (constraint dependent).
- (6)
- Crossover: crossover function (constraint dependent).
- (7)
- Migration: direction (forward), fraction (0.2), interval (20).
- (8)
- Constraint parameters: initial penalty (10), penalty factor (100).
- (9)
- Stopping criteria: generations (100 × number of variables), time limit (default: +∞), fitness limit (default: −∞), stall generations (50), stall time limit (default: +∞), stall test (average change), function tolerance (10−6), constraint tolerance (10−6).
4.3. The Forecast of Yearly Load Density of Each Service Region of the VPP
Based on the historical data of the 11 service regions of the VPP in a certain city from 2005 to 2015, the forecast values from 2016 to 2018 are obtained, as shown in the curves in Figure 4.
Here, the left of the black vertical line in Figure 4 is the region of historical data and the right is the region of forecast data.
4.4. The Optimal Configuration of DER Capacities inside the VPP
Take a VPP demonstration project as an example, which contains wind turbine (WT), photovoltaic unit (PV), and interruptible load (IL). The basic data are shown in Table 2.
The cost of a thermal power unit in Table 2 includes the generating cost, the cost of pollution emission taking into account the effects of fog and haze, and the cost of carbon emission. Thus, the value is higher than that of conventional thermal power units. In addition, the covariances of unit output of WT-PV, WT-IL, and PV-IL are −0.0003, 0.0002, and −0.0005, respectively.
According to the above model shown in Equations (5)–(11), and the above benchmark data, the GA toolbox of MATLAB R2014a (The MathWorks; Natick, MA, USA) is employed to calculate the results, which are shown in Table 3 (Case 0). The optimal ratio of load supplied by the VPP is µ* = 48.04%.
Assume that µ = 48.04% remains unchanged and only the standard deviations of the unit capacity output of WT, PV, and IL are reduced to 0.0396, 0.0262, and 0.0273 (single control variable, corresponding to Cases 1, 2, and 3, respectively). The results are then recalculated, as shown in Table 3 (Cases 1, 2, and 3).
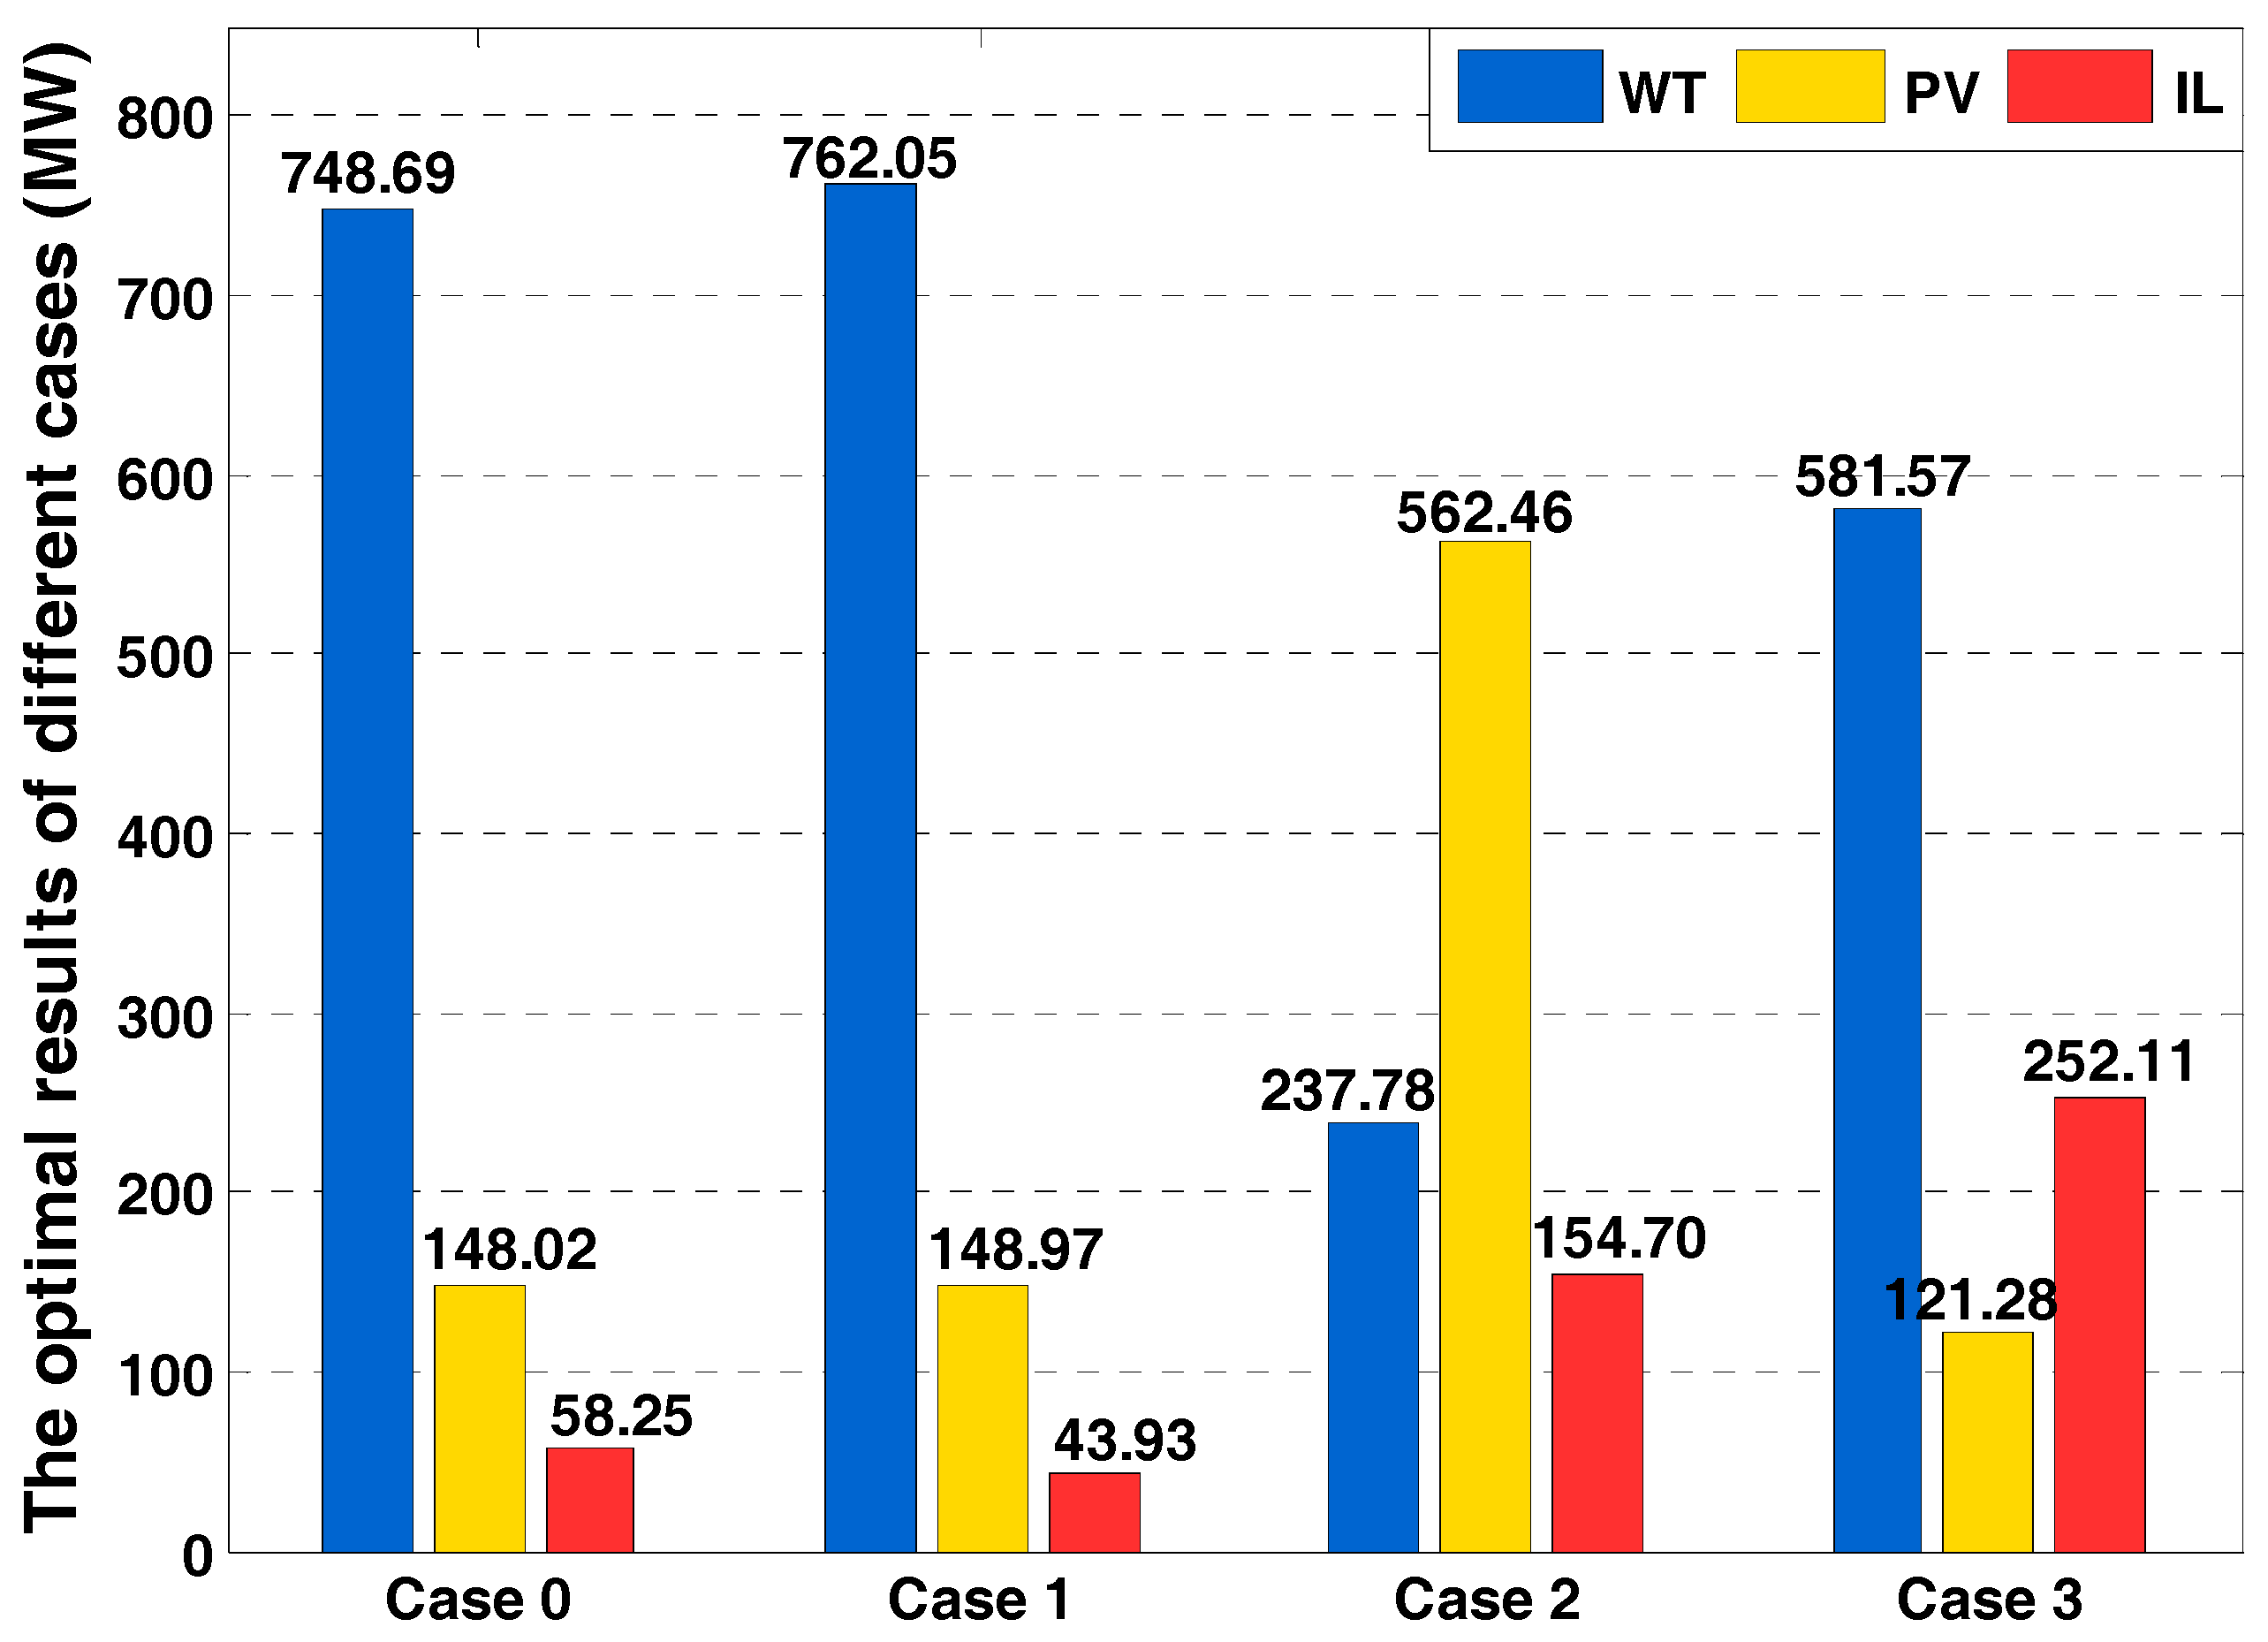
The optimal configuration values of the DER capacities are shown in Figure 5.
Case 1: The standard deviation of the WT in Case 0 is larger (0.0800), second only to PV. In recent years, the development of wind power is better than that of photovoltaic power. One of the reasons for this is that the uncertainty controllability of WT is stronger than that of PV. Therefore, when the standard deviation of WT unit capacity output is significantly reduced (−50.50%), its capacity ratio increases slightly (by only +0.67%). However, the E(ϕv) and σv2 of the VPP increase to a larger degree with respect to Case 0 (+1.75% and +3.22%), while U remains unchanged.
Case 2: PV output has more uncertainty than WT and IL in Case 0, and the standard deviation of the unit capacity is the largest (0.0960). Investors are more inclined to opt for WT and IL in decision-making. When the PV unit capacity output standard deviation is significantly reduced (−72.71%), that is, its risk is obviously decreased, the benefits of investment in PV become prominent, and investors tend to choose PV (capacity increased by 20.84%). However, the uncertainty of PV is still large, and the σv2 of VPP is the largest (0.1528). Therefore, the E(ϕv) is small (0.2647) and the investor’s utility is smaller (0.0032) when the PV ratio is large.
Case 3: IL, itself, has a small output variance, less uncertainty, and less impact on investor decision-making. When the standard deviation of IL output decreased (−58.00%), the capacity ratio of WT and PV decreased (−8.40% and −1.35%), and the capacity of IL increased significantly (+9.75). The use of IL in VPPs is mainly to implement the corresponding optimal control strategy at the load end when WT and PV uncertainties are difficult to control, mainly for auxiliary service. Therefore, when the IL capacity increases, the uncertainty risk is more effectively controlled, and σv2 can be significantly reduced (−34.66%). However, the economic benefits are not obvious when IL is used for auxiliary services, resulting in the minimum E(ϕv) (only 0.2529).
5. Conclusions
Based on the brief introduction of the classification of DERs and the construction of the VPP, this paper first divides the VPP service regions according to the region space, administrative level, load density, and user types, and employs the cubic exponential smoothing method to forecast the annual average hourly load density of each VPP to obtain the average hourly load demand of the entire area. Based on this, the optimal capacity configuration of various DERs inside the VPP is calculated by using the portfolio theory. The results show that the uncertainties of DERs are the key factors that affect their ratios of capacity allocation. When the uncertainty of a certain DER is reduced, its capacity will increase correspondingly. The configuration scheme can optimize the DER capacities from the perspective of investors, guarantee the economic benefits, make full use of clean DERs, and satisfy the load requirement.
Acknowledgments
The authors would like to acknowledge the Beijing National Science Foundation (3164051).
Author Contributions
The authors Jingmin Wang and Wenhai Yang carried out the main research tasks and wrote the full manuscript; the authors Huaxin Cheng and Yajing Gao proposed the original idea, analyzed, and double-checked the results and the entire manuscript; and the author Lingyu Huang contributed to the data processing and the writing and summarizing of the proposed ideas.
Conflicts of Interest
The authors declare no conflict of interest.
Abbreviations
The following abbreviations are used in this manuscript:
| DERs | Distributed energy resources |
| VPP | Virtual power plant |
| GA | Genetic algorithm |
| WT | Wind turbine |
| PV | Photovoltaic unit |
| IL | Interruptible load |
References
- Kazmi, S.A.A.; Shahzad, M.K.; Shin, D.R. Multi-objective planning techniques in distribution networks: A composite review. Energies 2017, 10, 208. [Google Scholar] [CrossRef]
- Dabbagh, S.R.; Sheikh-El-Eslami, M.K. Risk-based profit allocation to DERs integrated with a virtual power plant using cooperative Game theory. Electr. Power Syst. Res. 2015, 121, 368–378. [Google Scholar] [CrossRef]
- Baek, J.; Choi, W.; Chae, S. Distributed control strategy for autonomous operation of hybrid AC/DC microgrid. Energies 2017, 10, 373. [Google Scholar] [CrossRef]
- Cao, C.; Xie, J.; Yue, D.; Huang, C.; Wang, J.; Xu, S.; Chen, X. Distributed economic dispatch of virtual power plant under a non-ideal communication network. Energies 2017, 10, 235. [Google Scholar] [CrossRef]
- Nosratabadi, S.M.; Hooshmand, R.A.; Gholipour, E. Stochastic profit-based scheduling of industrial virtual power plant using the best demand response strategy. Appl. Energy 2016, 164, 590–606. [Google Scholar] [CrossRef]
- Gong, J.; Xie, D.; Jiang, C.; Zhang, Y. Multiple objective compromised method for power management in virtual power plants. Energies 2011, 4, 700–716. [Google Scholar] [CrossRef]
- Kardakos, E.G.; Simoglou, C.K.; Bakirtzis, A.G. Optimal offering strategy of a virtual power plant: A stochastic bi-level approach. IEEE Trans. Smart Grid 2016, 7, 794–806. [Google Scholar] [CrossRef]
- Gao, Y.; Cheng, H.; Zhu, J.; Liang, H.; Li, P. The optimal dispatch of a power system containing virtual power plants under fog and haze weather. Sustainability 2016, 8, 71. [Google Scholar] [CrossRef]
- Bliek, F.W.; van den Noort, A.; Roossien, B.; Kamphuis, R.; de Wit, J.; van den Velde, J.; Eijgelaar, M. The role of natural gas in smart grids. J. Nat. Gas Sci. Eng. 2011, 3, 608–616. [Google Scholar] [CrossRef]
- Wille-Haussmann, B.; Erge, T.; Wittwer, C. Decentralised optimisation of cogeneration in virtual power plants. Sol. Energy 2010, 84, 604–611. [Google Scholar] [CrossRef]
- Barszcz, T.; Czop, P. Presentation of a virtual power plant environment and its application with combined first-principle and data-driven models intended for the diagnostics of a power plant-Part 2. Simulation 2012, 88, 167–179. [Google Scholar] [CrossRef]
- Binding, C.; Gantenbein, D.; Jansen, B.; Sundstrom, O.; Andersen, P.B.; Marra, F.; Poulsen, B.; Traholt, C. Electric vehicle fleet integration in the Danish EDISON project–a virtual power plant on the island of Bornholm. In Proceedings of the 2010 IEEE Power and Energy Society General Meeting, Providence, RI, USA, 25–29 July 2010; IEEE: Piscataway, NJ, USA, 2010; pp. 1–8. [Google Scholar]
- Daud, S.; Kadir, A.F.A.; Gan, C.K.; Mohamed, A.; Khatib, T. A comparison of heuristic optimization techniques for optimal placement and sizing of photovoltaic based distributed generation in a distribution system. Sol. Energy 2016, 140, 219–226. [Google Scholar] [CrossRef]
- Esmaili, M.; Firozjaee, E.C.; Shayanfar, H.A. Optimal placement of distributed generations considering voltage stability and power losses with observing voltage-related constraints. Appl. Energy 2014, 113, 1252–1260. [Google Scholar] [CrossRef]
- Ali, E.S.; Elazim, S.M.A.; Abdelaziz, A.Y. Ant Lion Optimization Algorithm for optimal location and sizing of renewable distributed generations. Renew. Energy 2017, 101, 1311–1324. [Google Scholar] [CrossRef]
- Shahzad, M.; Ahmad, I.; Gawlik, W.; Palensky, P. Load concentration factor based analytical method for optimal placement of multiple distribution generators for loss minimization and voltage profile improvement. Energies 2016, 9, 287. [Google Scholar] [CrossRef]
- Mahesh, K.; Nallagownden, P.; Elamvazuthi, I. Advanced Pareto front non-dominated sorting multi-objective particle swarm optimization for optimal placement and sizing of distributed generation. Energies 2016, 9, 982. [Google Scholar] [CrossRef]
- Fan, S.; Ai, Q. Day-ahead scheduling strategy of virtual power plant under uncertainties. In Proceedings of the 2015 IEEE PES Asia-Pacific Power and Energy Engineering Conference (APPEEC), Brisbane, Australia, 15–18 November 2015; IEEE: Piscataway, NJ, USA, 2015; pp. 1–5. [Google Scholar]
- Fan, S.; Ai, Q.; Piao, L. Fuzzy day-ahead scheduling of virtual power plant with optimal confidence level. IET Gener. Trans. Distrib. 2016, 10, 205–212. [Google Scholar] [CrossRef]
- Nguyen, D.T.; Nguyen, H.T.; Le, L.B. Coordinated dispatch of renewable energy sources and HVAC load using stochastic programming. In Proceedings of the 2014 IEEE International Conference on Smart Grid Communications (SmartGridComm), Venice, Italy, 3–6 November 2014; IEEE: Piscataway, NJ, USA, 2014; pp. 139–144. [Google Scholar]
- Liang, Z.; Guo, Y. Robust optimization based bidding strategy for virtual power plants in electricity markets. In Proceedings of the Power and Energy Society General Meeting (PESGM), Boston, MA, USA, 17–21 July 2016; IEEE: Piscataway, NJ, USA, 2016; pp. 1–5. [Google Scholar]
- Dolara, A.; Grimaccia, F.; Magistrati, G.; Marchegiani, G. Optimization models for islanded micro-grids: A comparative analysis between linear programming and mixed integer programming. Energies 2017, 10, 241. [Google Scholar] [CrossRef]
- Pudjianto, D.; Ramsay, C.; Strbac, G. Microgrids and virtual power plants: Concepts to support the integration of distributed energy resources. Proc. Inst. Mech. Eng. Part A J. Power Energy 2008, 222, 731–741. [Google Scholar] [CrossRef]
- Asmus, P. Microgrids, virtual power plants and our distributed energy future. Electr. J. 2010, 23, 72–82. [Google Scholar] [CrossRef]
- Palizban, O.; Kauhaniemi, K.; Guerrero, J.M. Microgrids in active network management—Part I: Hierarchical control, energy storage, virtual power plants, and market participation. Renew. Sustain. Energy Rev. 2014, 36, 428–439. [Google Scholar] [CrossRef]
- Jiang, Q.; Xue, M.; Geng, G. Energy management of microgrid in grid-connected and stand-alone modes. IEEE Trans. Power Syst. 2013, 28, 3380–3389. [Google Scholar] [CrossRef]
- Wang, S. Design and operation of micro-grid based on distributed generation. Electr. Power Autom. Equip. 2011, 31, 120–123. [Google Scholar]
- Yang, W.; Li, C.; Luan, J.; Zhang, B. Microgrid capacity allocation scheme based on load analysis and optimization control. Electr. Meas. Instrum. 2014, 51, 13–16. [Google Scholar]
- Morais, H.; Kadar, P.; Faria, P.; Vale, Z.A.; Khodr, H.M. Optimal scheduling of a renewable micro-grid in an isolated load area using mixed-integer linear programming. Renew. Energy 2010, 35, 151–156. [Google Scholar] [CrossRef]
- Rezvani, A.; Gandomkar, M.; Izadbakhsh, M.; Ahmadi, A. Environmental/economic scheduling of a micro-grid with renewable energy resources. J. Clean. Prod. 2015, 87, 216–226. [Google Scholar] [CrossRef]
- Chen, J.; Fu, C.; Chen, R.; Liu, Y. The stability of islanded-operation microgrid with various types of distributed energy sources. South. Power Syst. Technol. 2013, 7, 71–74. [Google Scholar] [CrossRef]
- Brown, R.G. Smoothing, Forecasting and Prediction of Discrete Time Series; Courier Corporation: North Chelmsford, MA, USA, 2004. [Google Scholar]
- Huang, X.; Li, J.; Yang, L.; Jiang, J.; Feng, C. Investment portfolio based multi energy capacity allocation of virtual power plant. Autom. Electr. Power Syst. 2015, 39, 75–81. [Google Scholar]
Figure 1.
The components of DERs.
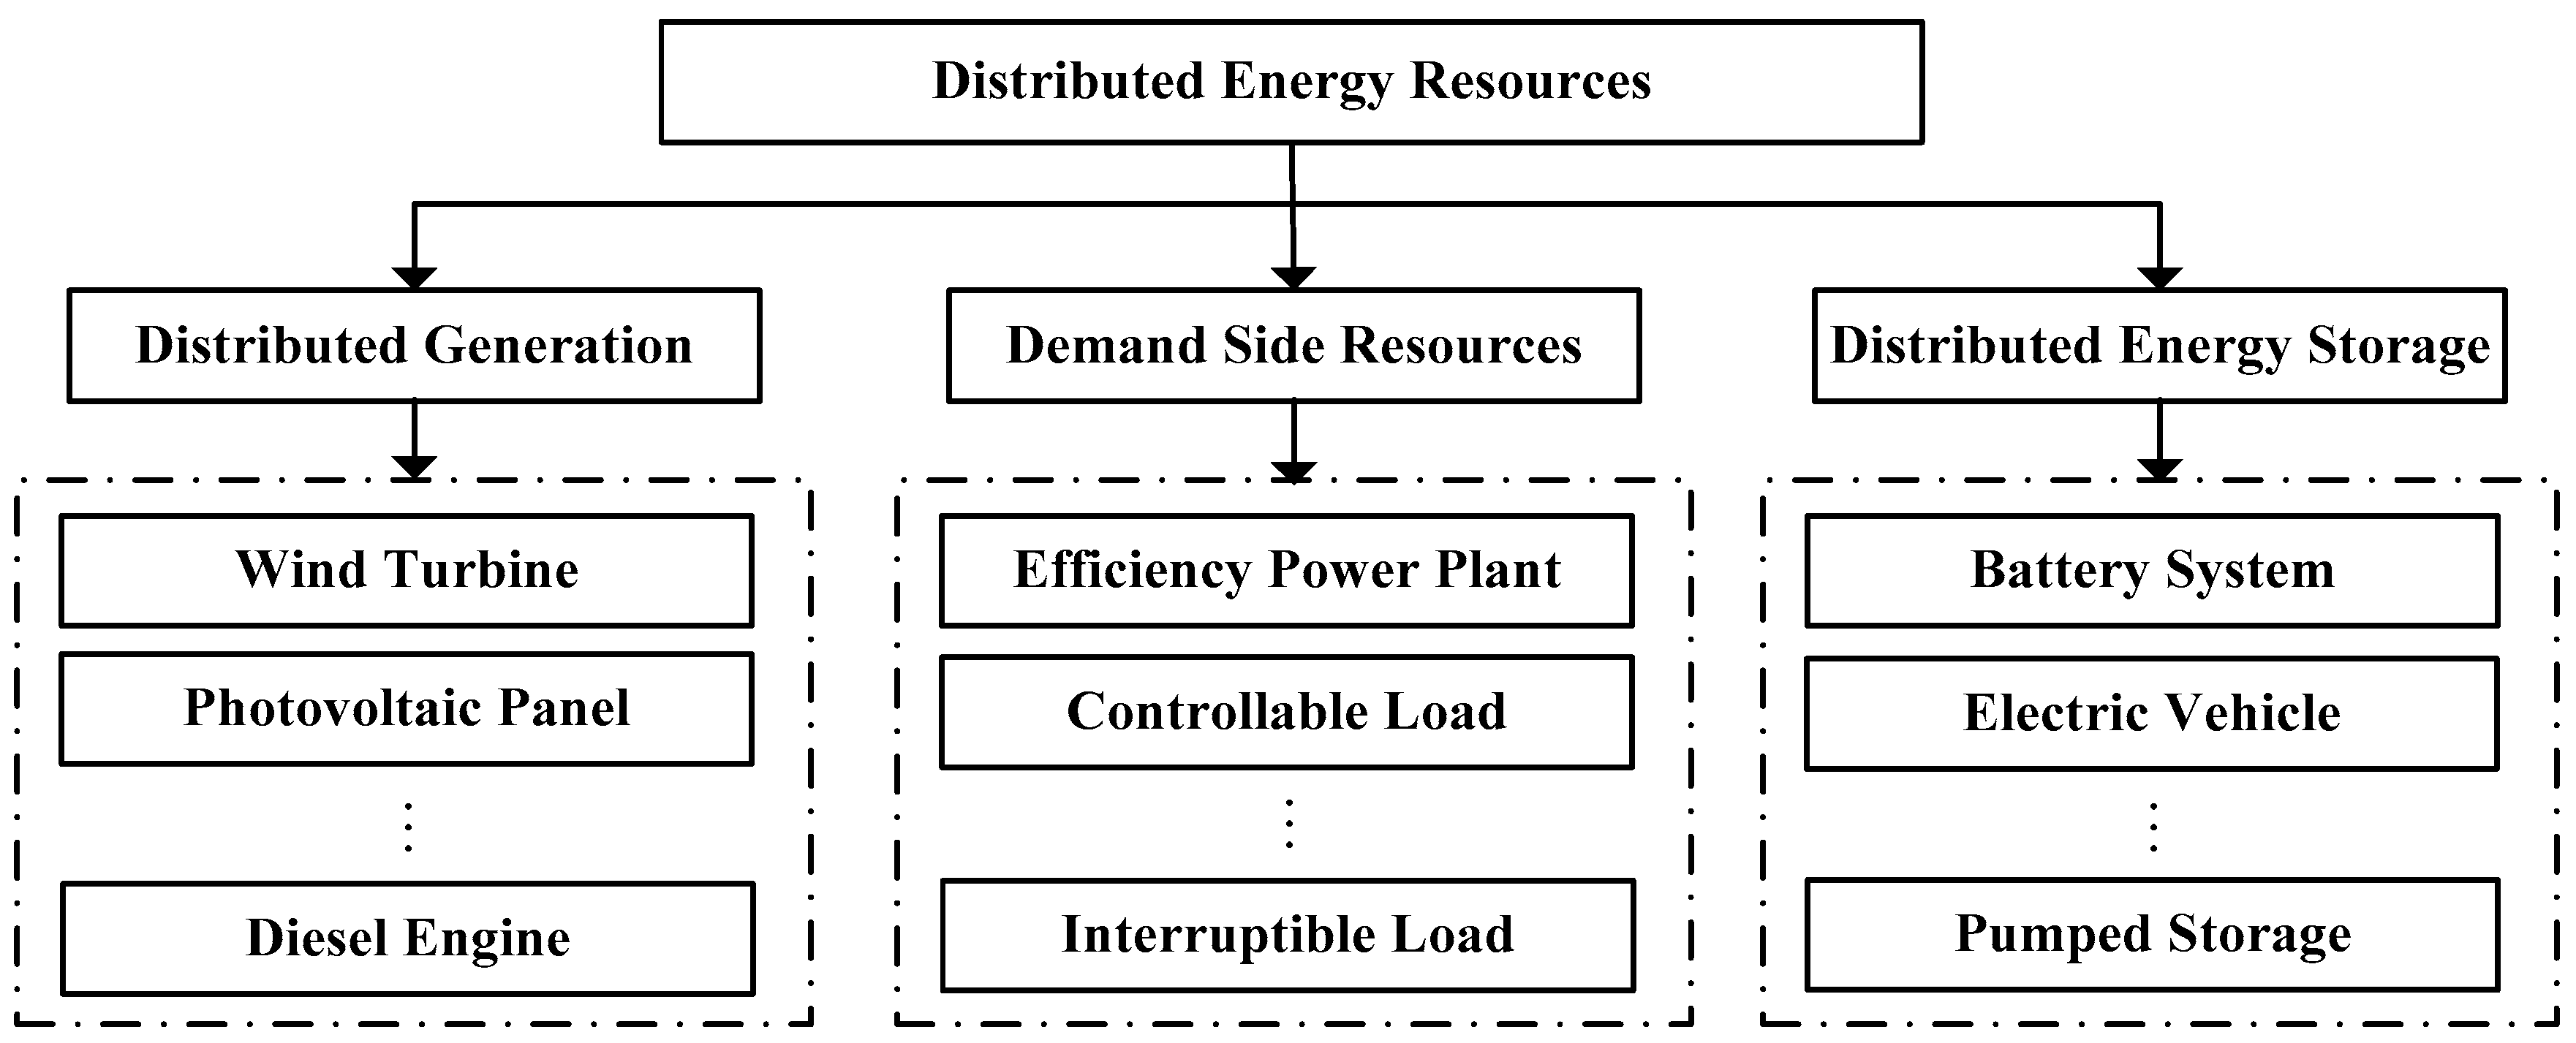
Figure 2.
The division of the service regions of the VPP.

Figure 3.
The flowchart of the solving procedure.
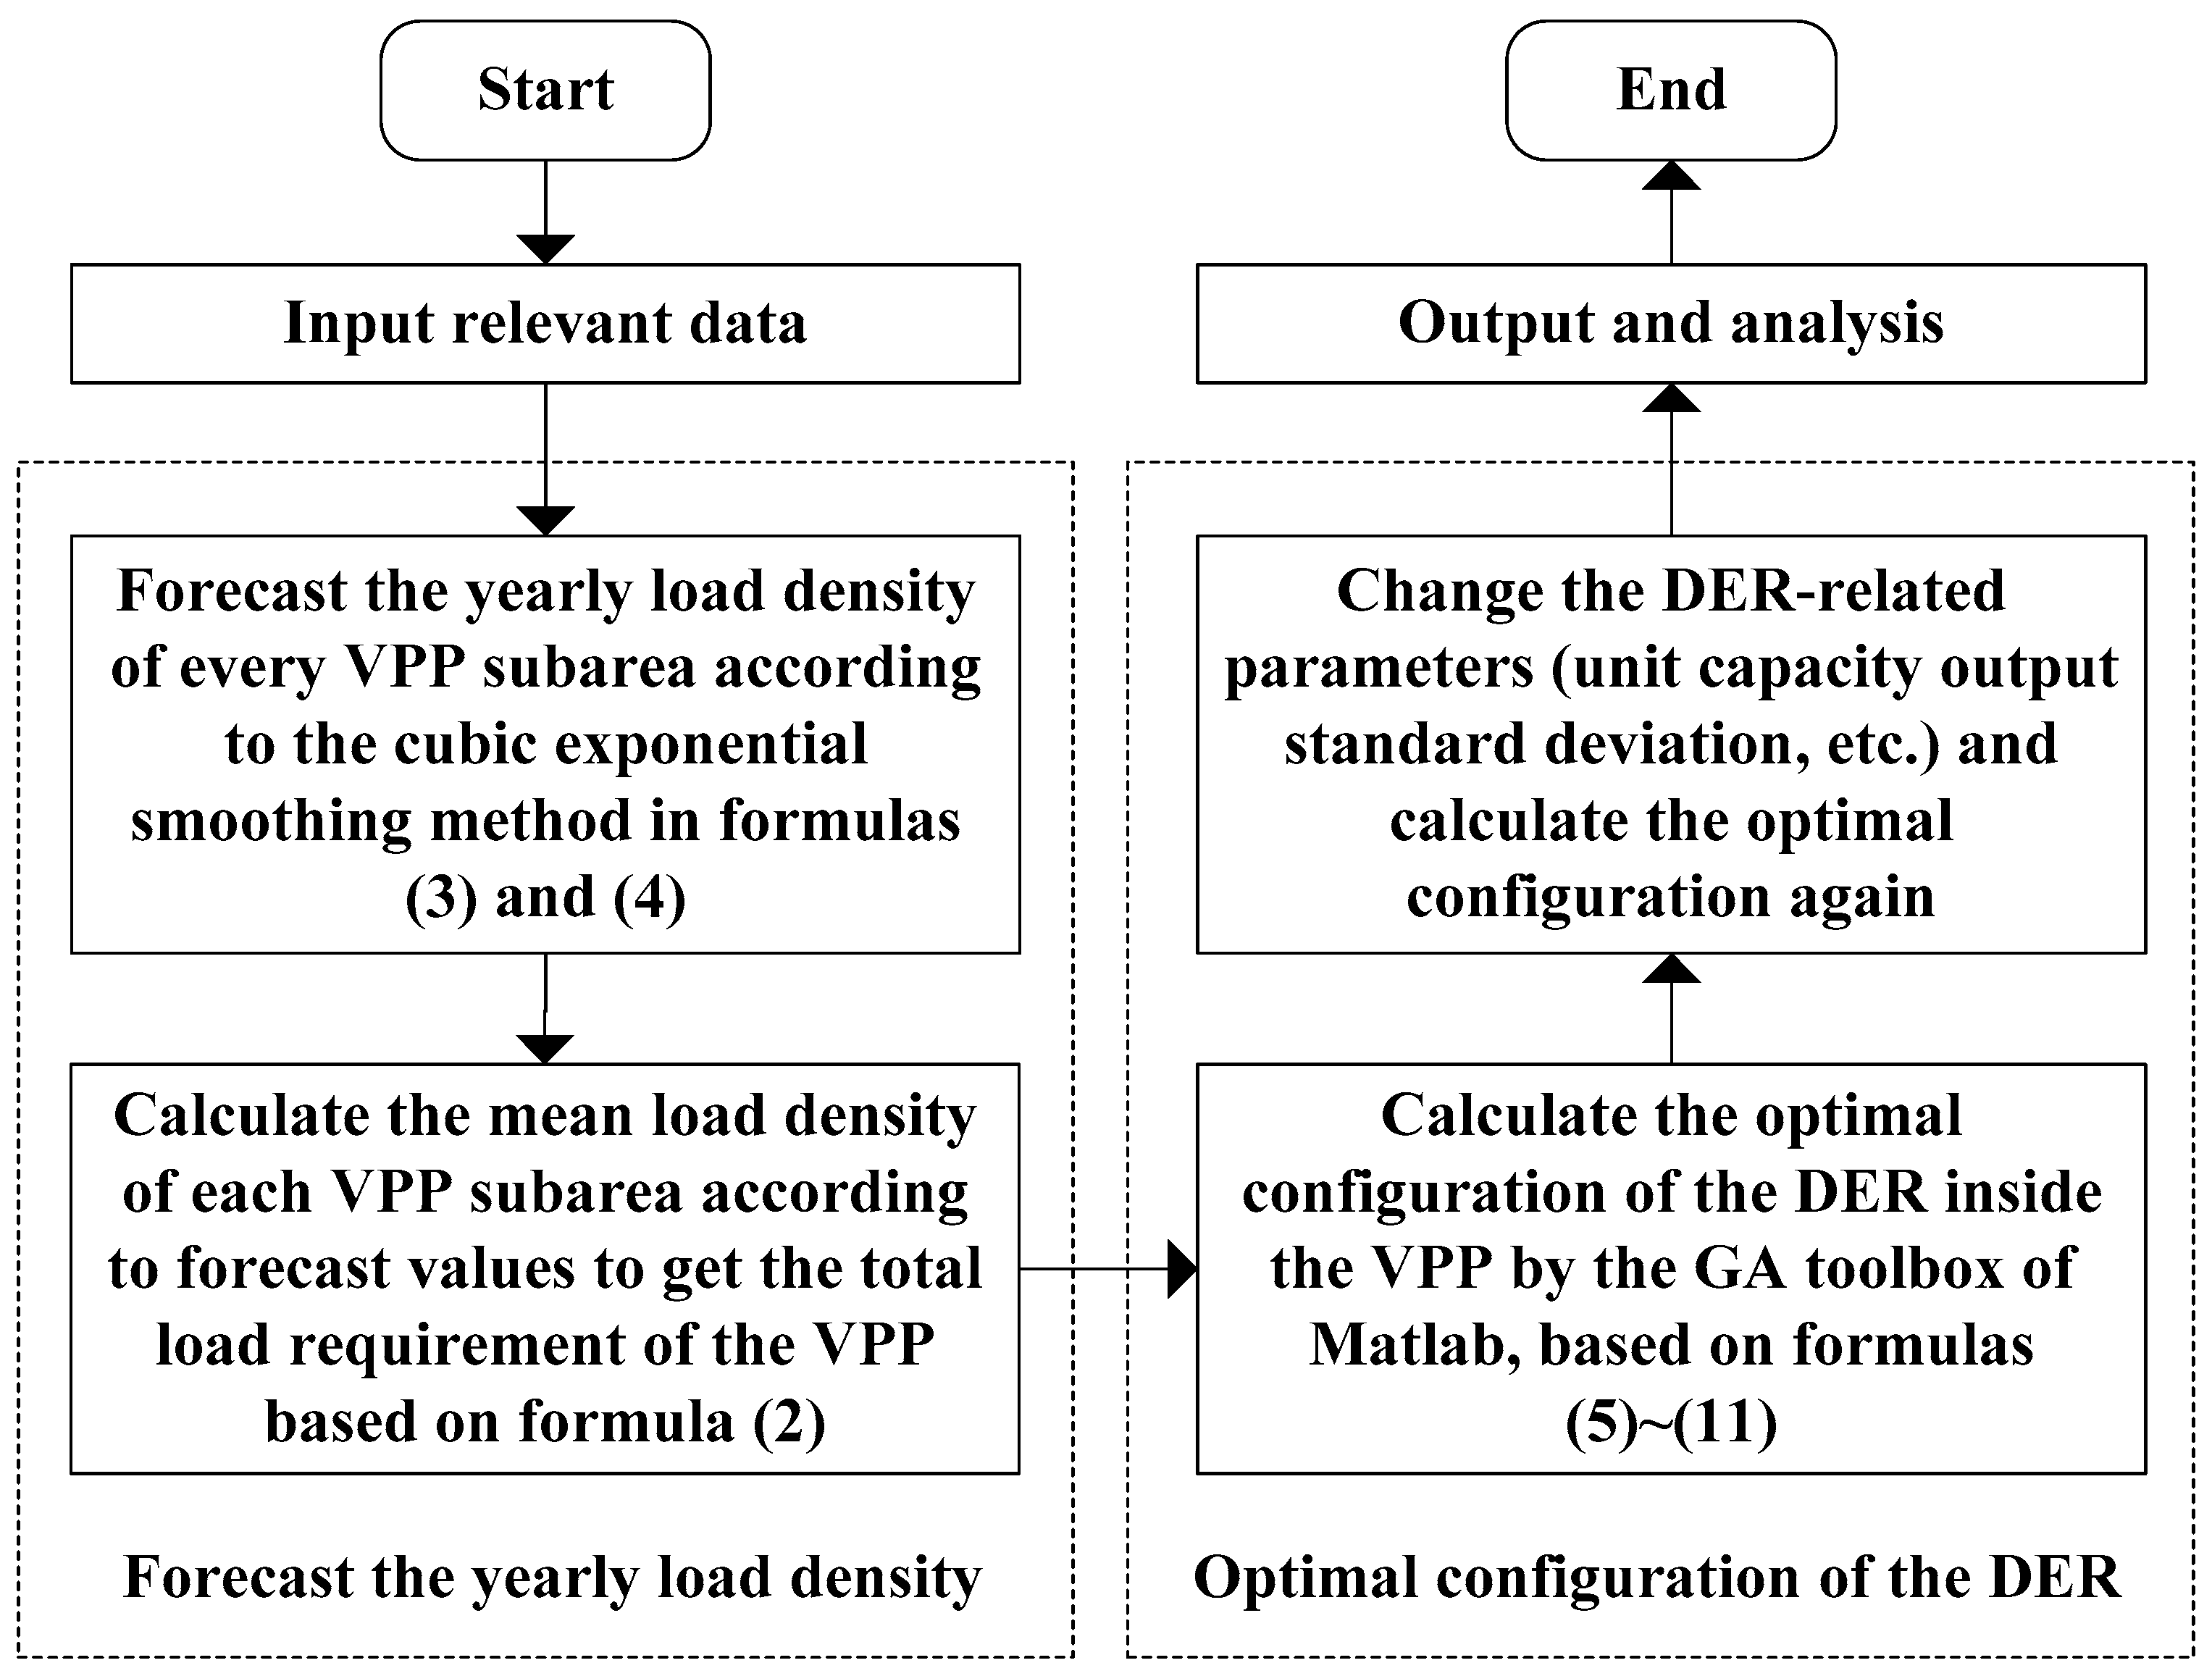
Figure 4.
The forecast curves of the load density of each service region of the VPP.
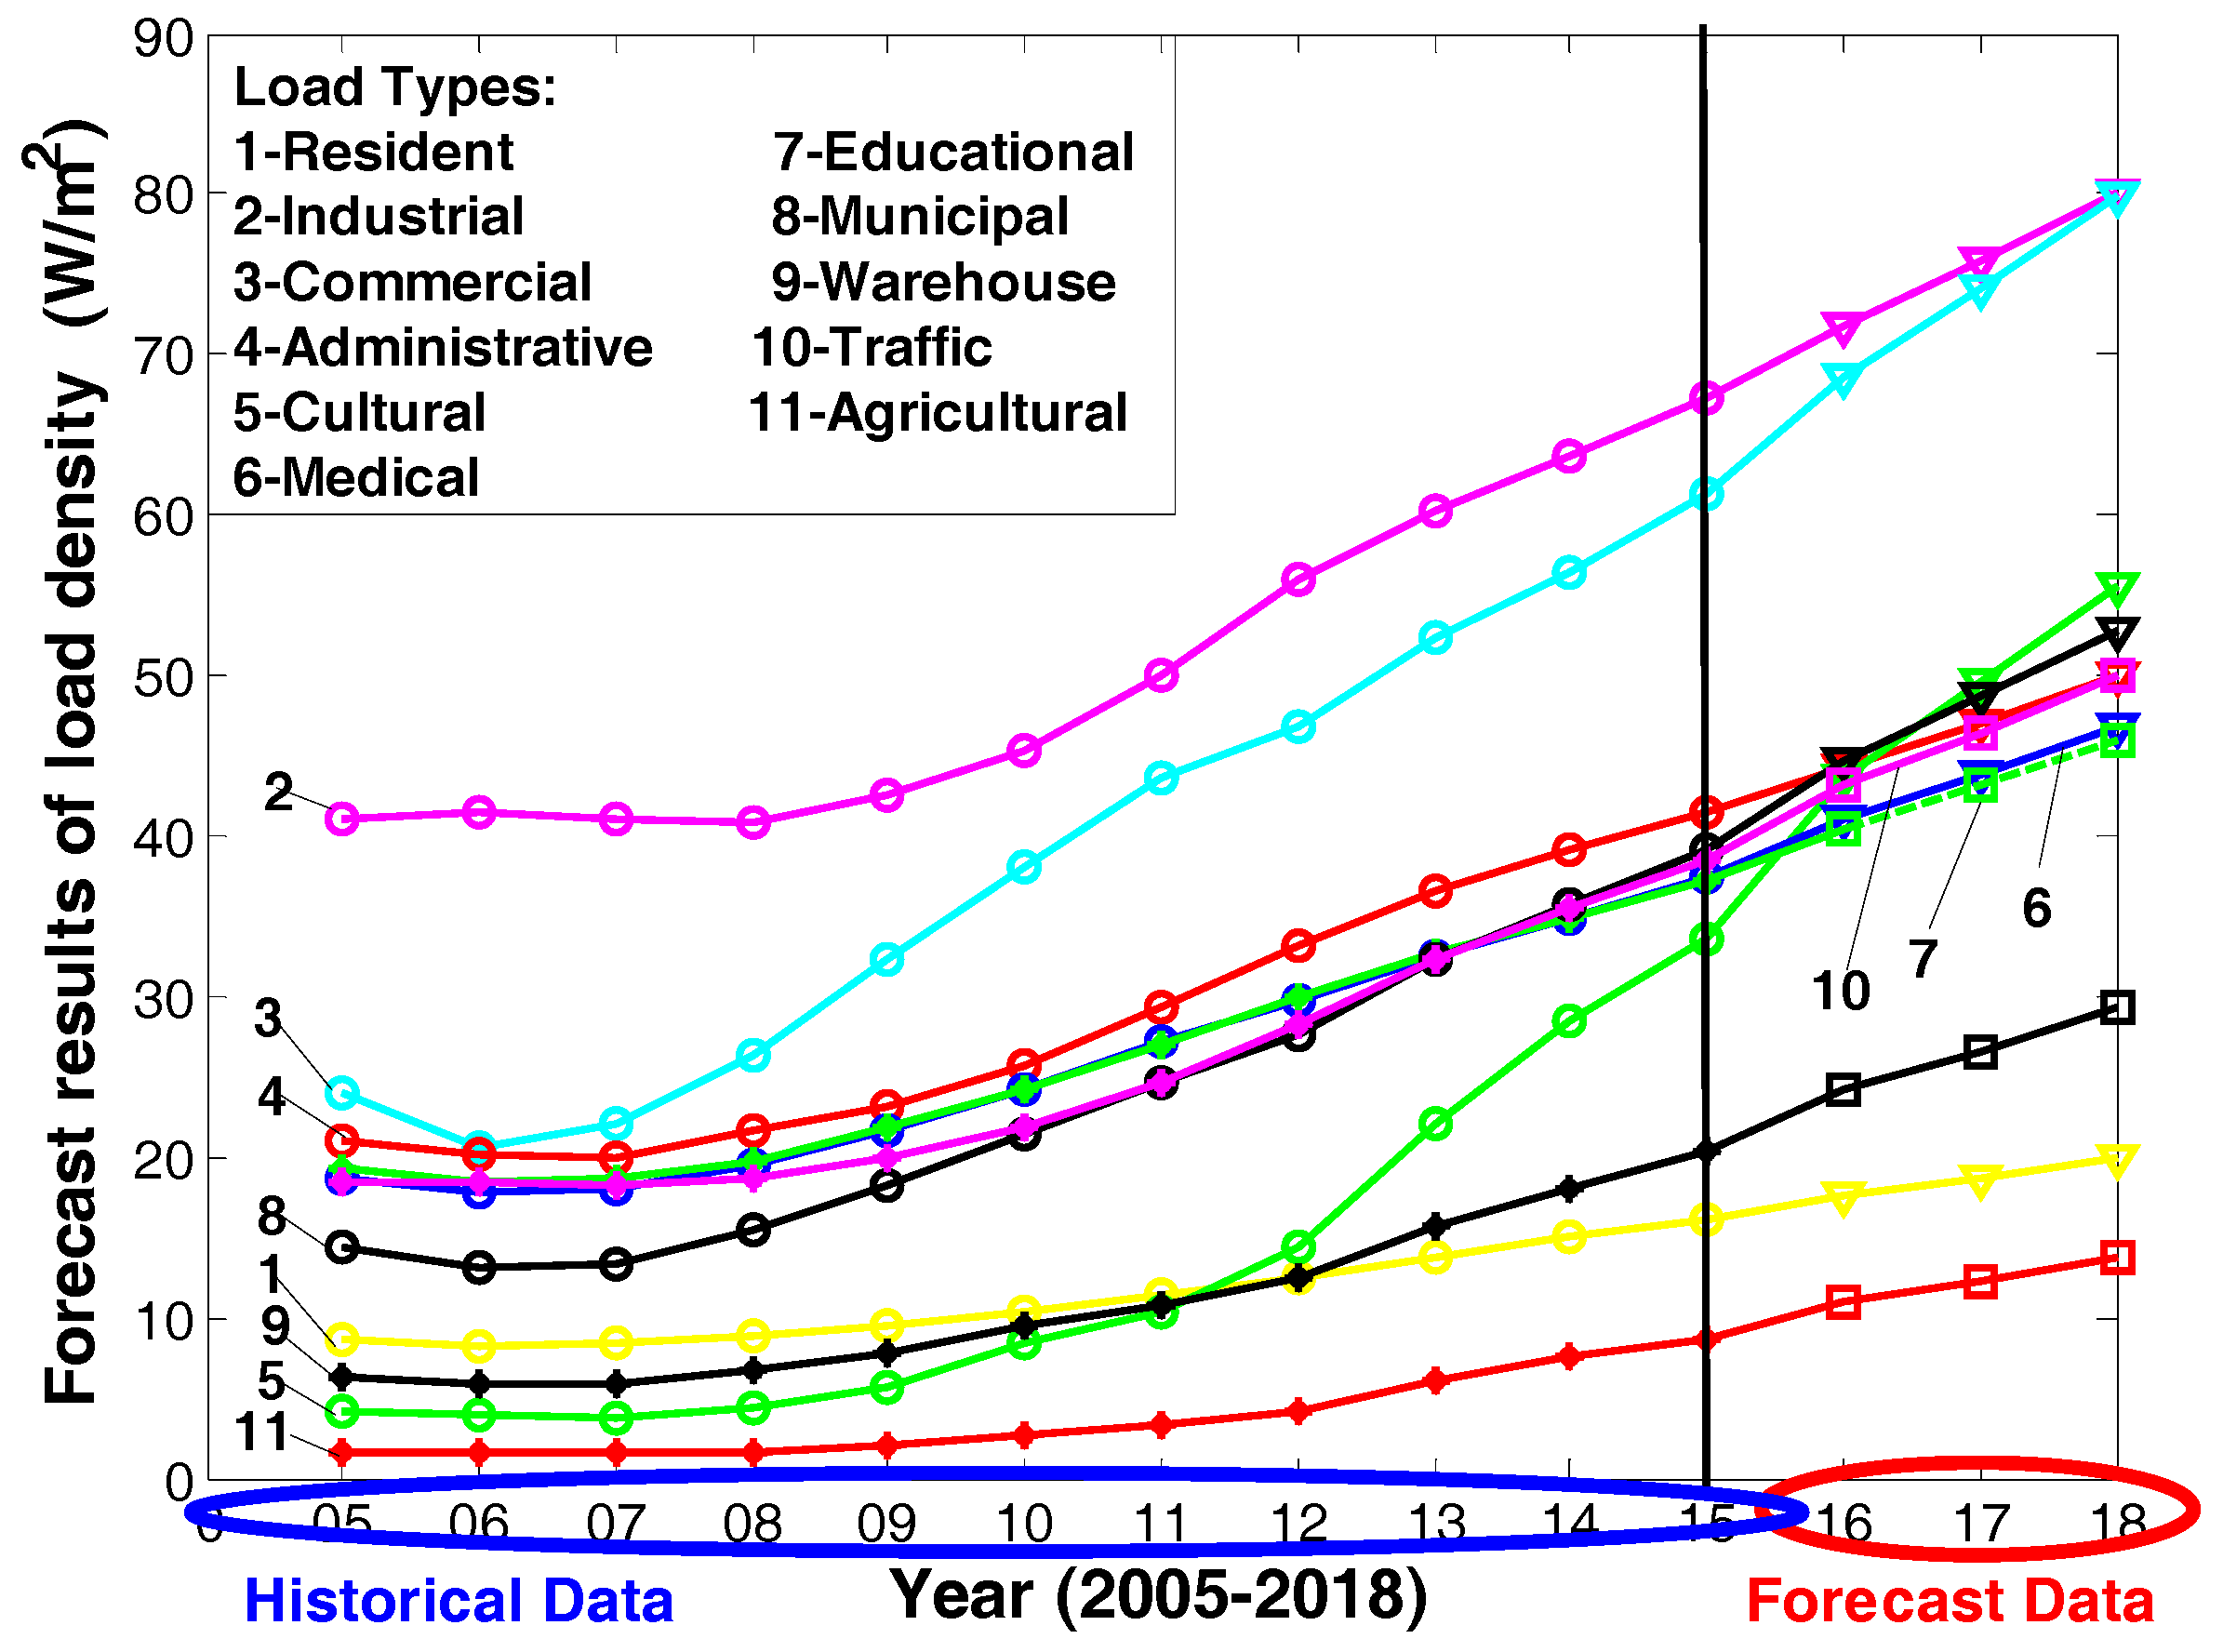
Figure 5.
The values of the configuration capacity for different cases.

Table 1.
The acreage, mean values of load density, and load requirement of each service region of the VPP.
Table 1.
The acreage, mean values of load density, and load requirement of each service region of the VPP.
| Serial Number | Service Region | Acreage/(km2) | Mean Value of Load Density/(w/m2) | Load Requirement/(MW) |
|---|---|---|---|---|
| 1 | Residential | 22.8900 | 18.6700 | 427.3563 |
| 2 | Industrial | 5.1400 | 75.9000 | 390.1260 |
| 3 | Commercial | 4.9900 | 74.2000 | 370.2580 |
| 4 | Administrative | 2.0200 | 47.1100 | 95.1622 |
| 5 | Cultural | 1.6400 | 49.5900 | 81.3276 |
| 6 | Medical | 0.8100 | 43.8600 | 35.5266 |
| 7 | Educational | 3.2100 | 43.1200 | 138.4152 |
| 8 | Municipal | 7.3700 | 48.7700 | 359.4349 |
| 9 | Warehouse | 0.5400 | 26.6800 | 14.4072 |
| 10 | Traffic | 1.0900 | 46.4800 | 50.6632 |
| 11 | Agricultural | 2.0500 | 12.3000 | 25.2150 |
| Sum | — | 51.7500 | — | 1987.8922 |
Table 2.
Basic data of the DERs inside the VPP and the thermal power unit.
| Unit Capacity | WT | PV | IL | Thermal Power Unit (Miniature Gas Turbine) |
|---|---|---|---|---|
| Electrovalence/(yuan/MW) | 580 | 1660 | 540 | 420 |
| Cost/(yuan/MW) | 153 | 242 | 178 | 255 |
| Expected output | 0.3600 | 0.1900 | 0.3200 | 0.5800 |
| Standard deviation of output | 0.0800 | 0.0960 | 0.0650 | — |
Table 3.
The configuration results of different cases.
| Case | Optimal Configuration Results | WT | PV | IL |
|---|---|---|---|---|
| 0 | Configuration ratios | 37.66% | 7.45% | 2.93% |
| Expectation and variance of ϕv The investor utility | E(ϕv) = 0.3312, σv2 = 0.0652 U = 0.1208 | |||
| 1 | Configuration ratios | 38.33% | 7.49% | 2.21% |
| Expectation and variance of ϕv The investor utility | E(ϕv) = 0.3370, σv2 = 0.0673 U = 0.1208 | |||
| 2 | Configuration ratios | 11.96% | 28.29% | 7.78% |
| Expectation and variance of ϕv The investor utility | E(ϕv) = 0.2647, σv2 = 0.1528 U = 0.0032 | |||
| 3 | Configuration ratios | 29.26% | 6.10% | 12.68% |
| Expectation and variance of ϕv The investor utility | E(ϕv) = 0.2529, σv2 = 0.0426 U = 0.1140 | |||
© 2017 by the authors. Licensee MDPI, Basel, Switzerland. This article is an open access article distributed under the terms and conditions of the Creative Commons Attribution (CC BY) license (http://creativecommons.org/licenses/by/4.0/).
Share and Cite
MDPI and ACS Style
Wang, J.; Yang, W.; Cheng, H.; Huang, L.; Gao, Y. The Optimal Configuration Scheme of the Virtual Power Plant Considering Benefits and Risks of Investors. Energies 2017, 10, 968. https://doi.org/10.3390/en10070968
AMA Style
Wang J, Yang W, Cheng H, Huang L, Gao Y. The Optimal Configuration Scheme of the Virtual Power Plant Considering Benefits and Risks of Investors. Energies. 2017; 10(7):968. https://doi.org/10.3390/en10070968
Chicago/Turabian StyleWang, Jingmin, Wenhai Yang, Huaxin Cheng, Lingyu Huang, and Yajing Gao. 2017. "The Optimal Configuration Scheme of the Virtual Power Plant Considering Benefits and Risks of Investors" Energies 10, no. 7: 968. https://doi.org/10.3390/en10070968
Note that from the first issue of 2016, this journal uses article numbers instead of page numbers. See further details here.