1. Introduction
Emissions of carbon dioxide have become a global issue of the World’s common concerns nowadays, not only because this issue has a significant impact on the global ecological environment, but also because it is closely related to humans’ work and life through its influence on the global economy [
1]. By decomposing the carbon productivity, it can be found that due to the energy consumption growth, increased carbon emissions have become an increasingly important factor which threatens the success of countries all over the world to achieve sustainable development goals due to the energy consumption growth [
2]. At present, energy consumption carbon emissions (ECCE) are a practical issue which runs through the political, economy, social and other fields more than a scientific problem. In this context, carrying out systematic studies on ECCE has become a priority research areas and research hotspot disciplines for domestic and overseas scholars in the fields of geography, environmental science, economy and others [
3].
In recent years, research on ECCE has mainly focused on the following aspects: the relationship between carbon emissions and economic development, efficiency assessment of carbon emissions, analysis of carbon emissions influencing factors, carbon emissions and urban planning, and the calculation and assessment of carbon emissions. Bekhet et al. [
4] studied the dynamic causal the relationship among carbon emissions, financial development, economic growth, and energy consumption for Gulf Cooperation Council countries from 1980 to 2011. Liu et al. [
5] discussed the issues concerning Chinese provincial carbon dioxide emission efficiency by using a slacks-based measure model. In order to analyze the impacts of population, affluence and technology were applied on the carbon emission of 125 countries at different income levels during the period 1990–2011. Shuai et al. [
6] combined the STIRPAT model and used the panel and time-series data. Zubelzu and Álvarez [
7] calculated the carbon footprint of the industrial sector during the urban planning stage for clearly developing and implementing preventive measures. Chang et al. [
8] investigated the performance estimation of energy consumption and carbon dioxide emissions for sustainable development in the Baltic Sea countries. These studies have formed a systematic research framework of ECCE, and their research methods have been relatively enriched and completed to a certain extent, which provide a strong theoretical support towards promoting the construction of low-carbon city and the regulation of ECCE in practice.
From the perspective of sustainable development, studying the security of ECCE conforms to historical background that humankind together pursues the coordinated development of regional population, resources, environment, economy and society complex system. The security of ECCE can be understood that under the premise of human’s necessary needs being met, ECCE should be coordinated with the regional population, resources, economy and social system. However, at present, there are few studies on the security of ECCE. Carbon emissions, which are considered an important environmental problem, can be regarded as an important component of the ecological environment. Thus, results of ecological security research can be borrowed to study the issue of ECCE security. Han et al. [
9] undertook an urban ecological security assessment for cities in the Beijing-Tianjin-Hebei metropolitan region based on the pressure-state-response (P-S-R) conceptual model. Pei et al. [
10] constructed Beijing’s ecological security assessment index system based on P-S-R model and used comprehensive index method to evaluate Beijing’s ecological security condition. Neri et al. [
11] applied P-S-R model to establish Bai Autonomous Prefecture of Dali’s land ecological security assessment index system, then they used entropy method to evaluate Dali Prefecture’s land ecological security comprehensive index. Therefore, the P-S-R model is widely applied in the ecological security assessment. The P-S-R model, which is proposed by the OECD and the UNEP, uses the thinking logic of the P-S-R and reflects the interaction relationship between humans and environment. Human beings acquire the necessary resources from the natural environment for their survival and development through various activities and discharge waste into the environment. Therefore, it changes the reserves of natural resources and environmental quality. Conversely, due to the changes in the state of nature and the environment that affect human society-economic activities and welfare, society responds to changes in the state of nature and the environment through environmental policy, economic policy and sectoral policy, and changes in consciousness and behavior. In such a circulation, the P-S-R relationship between humans and the environment is formed [
11,
12,
13]. Thus, in the assessment of security early warning of ECCE, the evaluation index system of the security early warning can be built through the framework of the P-S-R model.
In the study of the security early warning assessment of ECCE, carbon emissions security early warning forecasting, as another focus, can change the lag of carbon emission safety control policy and carry out dynamic and advanced management of carbon emissions security. Furthermore, it can propose a new idea of carbon emissions security control to provide scientific basis for carbon emissions control and reduction decisions. Forewarning and forecasting, which is more applied in ecological environment, natural disaster and so on, such as river drought and pollution [
14,
15], air quality [
16], earthquake [
17] and floods [
18], mainly include the following methods: Markov model [
19], Gray model (GM) [
20], support vector machine [
21], neural networks [
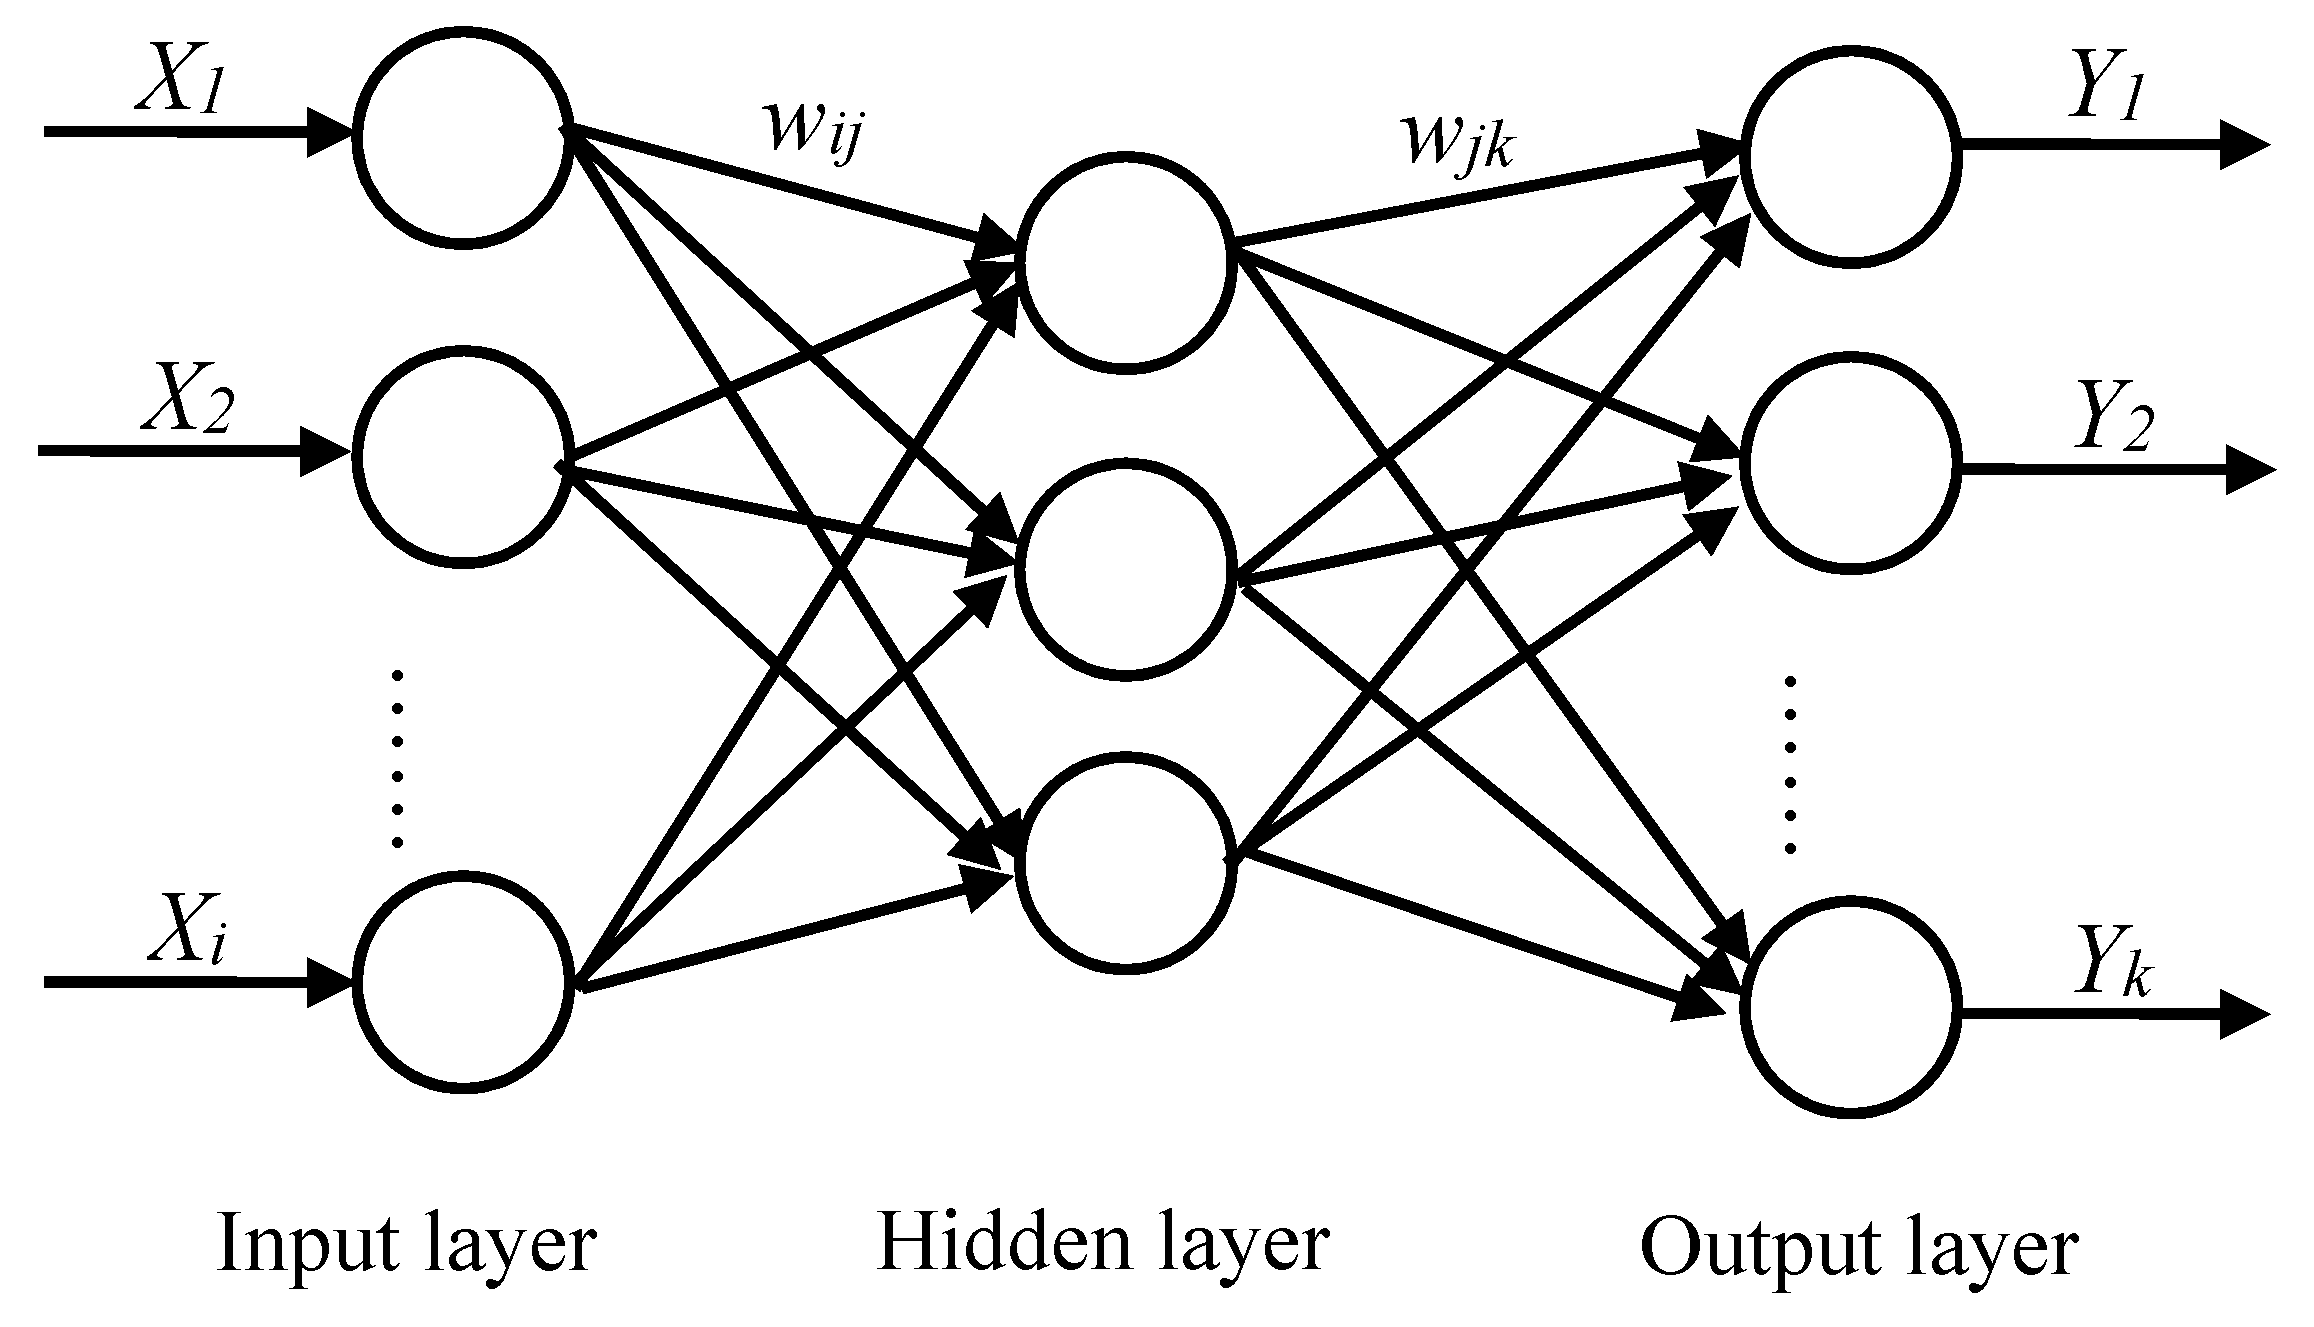
22] and so forth. Among these methods, the back propagation neural network (BPNN) which was proposed based on a neural network put forward by Rumelhart and McClelland [
22], has better performance in forecasting with its strong non-linear mapping ability, high self-learning and self-adaptability [
23,
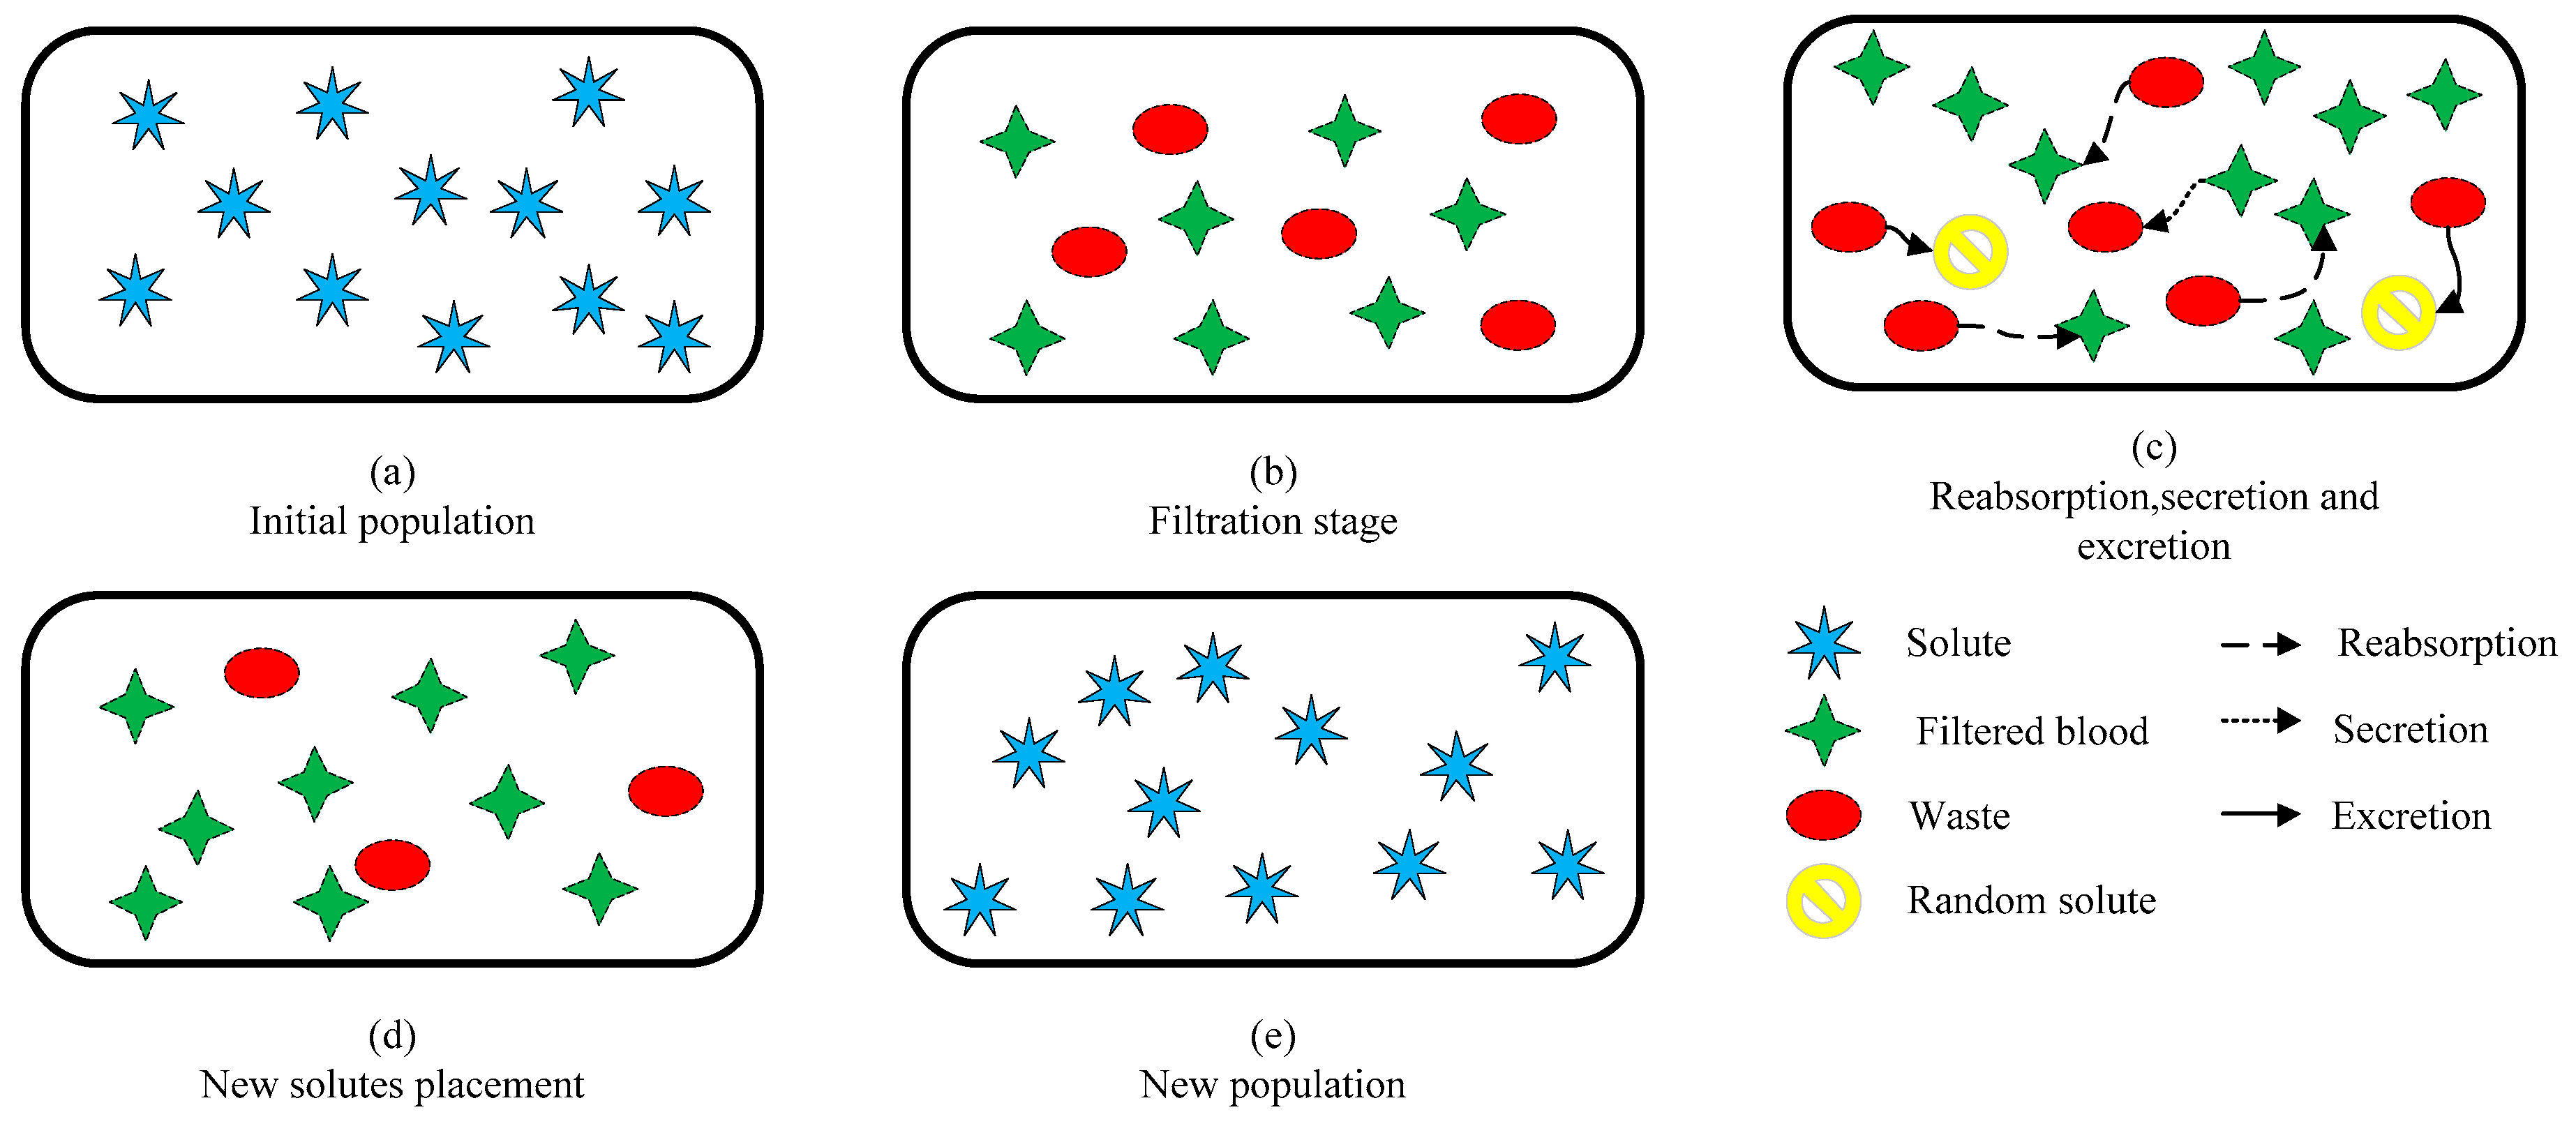
24]. Because the BPNN connection weights structure and threshold are randomly set during initialization, it is undeniable that the BPNN has the potential to fall into local optima, has slow convergence and other shortcomings. The kidney-inspired algorithm (KA), which is a kind of population theory proposed by Jaddi et al. in 2016, is a new heuristic algorithm that mimics the functioning of the kidneys’ biological systems [
25]. Through the test function operation, KA’s optimization ability is superior to that of the genetic algorithm (GA) [
26], particle swarm optimization (PSO) [
27], bat algorithm (BA) [
28] and other optimization algorithms. Therefore, KA can be used to optimize the connection weights and thresholds of BPNN, in order to improve the convergence rate of BPNN and avoid it from falling into a local optimum.
China is one of the countries with the highest CO
2 emissions in the world [
29]. From the CO
2 emissions structure, due to China’s coal-dominated energy structure, CO
2 emissions mainly come from the energy sector at present [
30]. Hebei Province, abbreviated as HB, which is located in the north of China, near the capital of Beijing, with iron and steel, equipment manufacturing, petroleum and chemical industries as pillar industries, has a large quantity of ECCE. Large population base, low forest coverage, and the more serious environmental pollution in HB hinder the coordinated development between ECCE and population, resources, economy and social system. In recent years, the central government has focused on the environment governance of HB and set a goal summarized as “two insurances, two declines and two promotions”. Two insurances are to ensure obvious and decisive progress in air quality improvement and excess capacity dissolution. Two declines mean that the total discharges of major pollutants and the proportion of coal consumption decrease significantly. Two promotions represent that water quality and greening continue to improve steadily. Besides, the renewable energy sources of the HB grid continued to maintain a rapid development trend in 2016, with the year-on-year growth of 80.2%. This year there were 31 new inputs of photovoltaic power stations and the power generating capacity increased by 1.253 million kW. Wind farms increased by two, with 270,000 kW capacity. The total installed wind power and photovoltaic capacity was up to 3.255 million kW, among which the installed wind power capacity was 1.0618 million kW with the year-on-year growth of 34.4% and the installed photovoltaic capacity was 1.111 million kW with a year-on-year growth of 112.8%. From the information above, we can conclude that clean energy has accounted for 13.1% of the total installed capacity of the HB grid with a year-on-year increase of 3.7%. Therefore, it is important to evaluate and forecast the security early warning of ECCE in HB as this is of much practical significance.
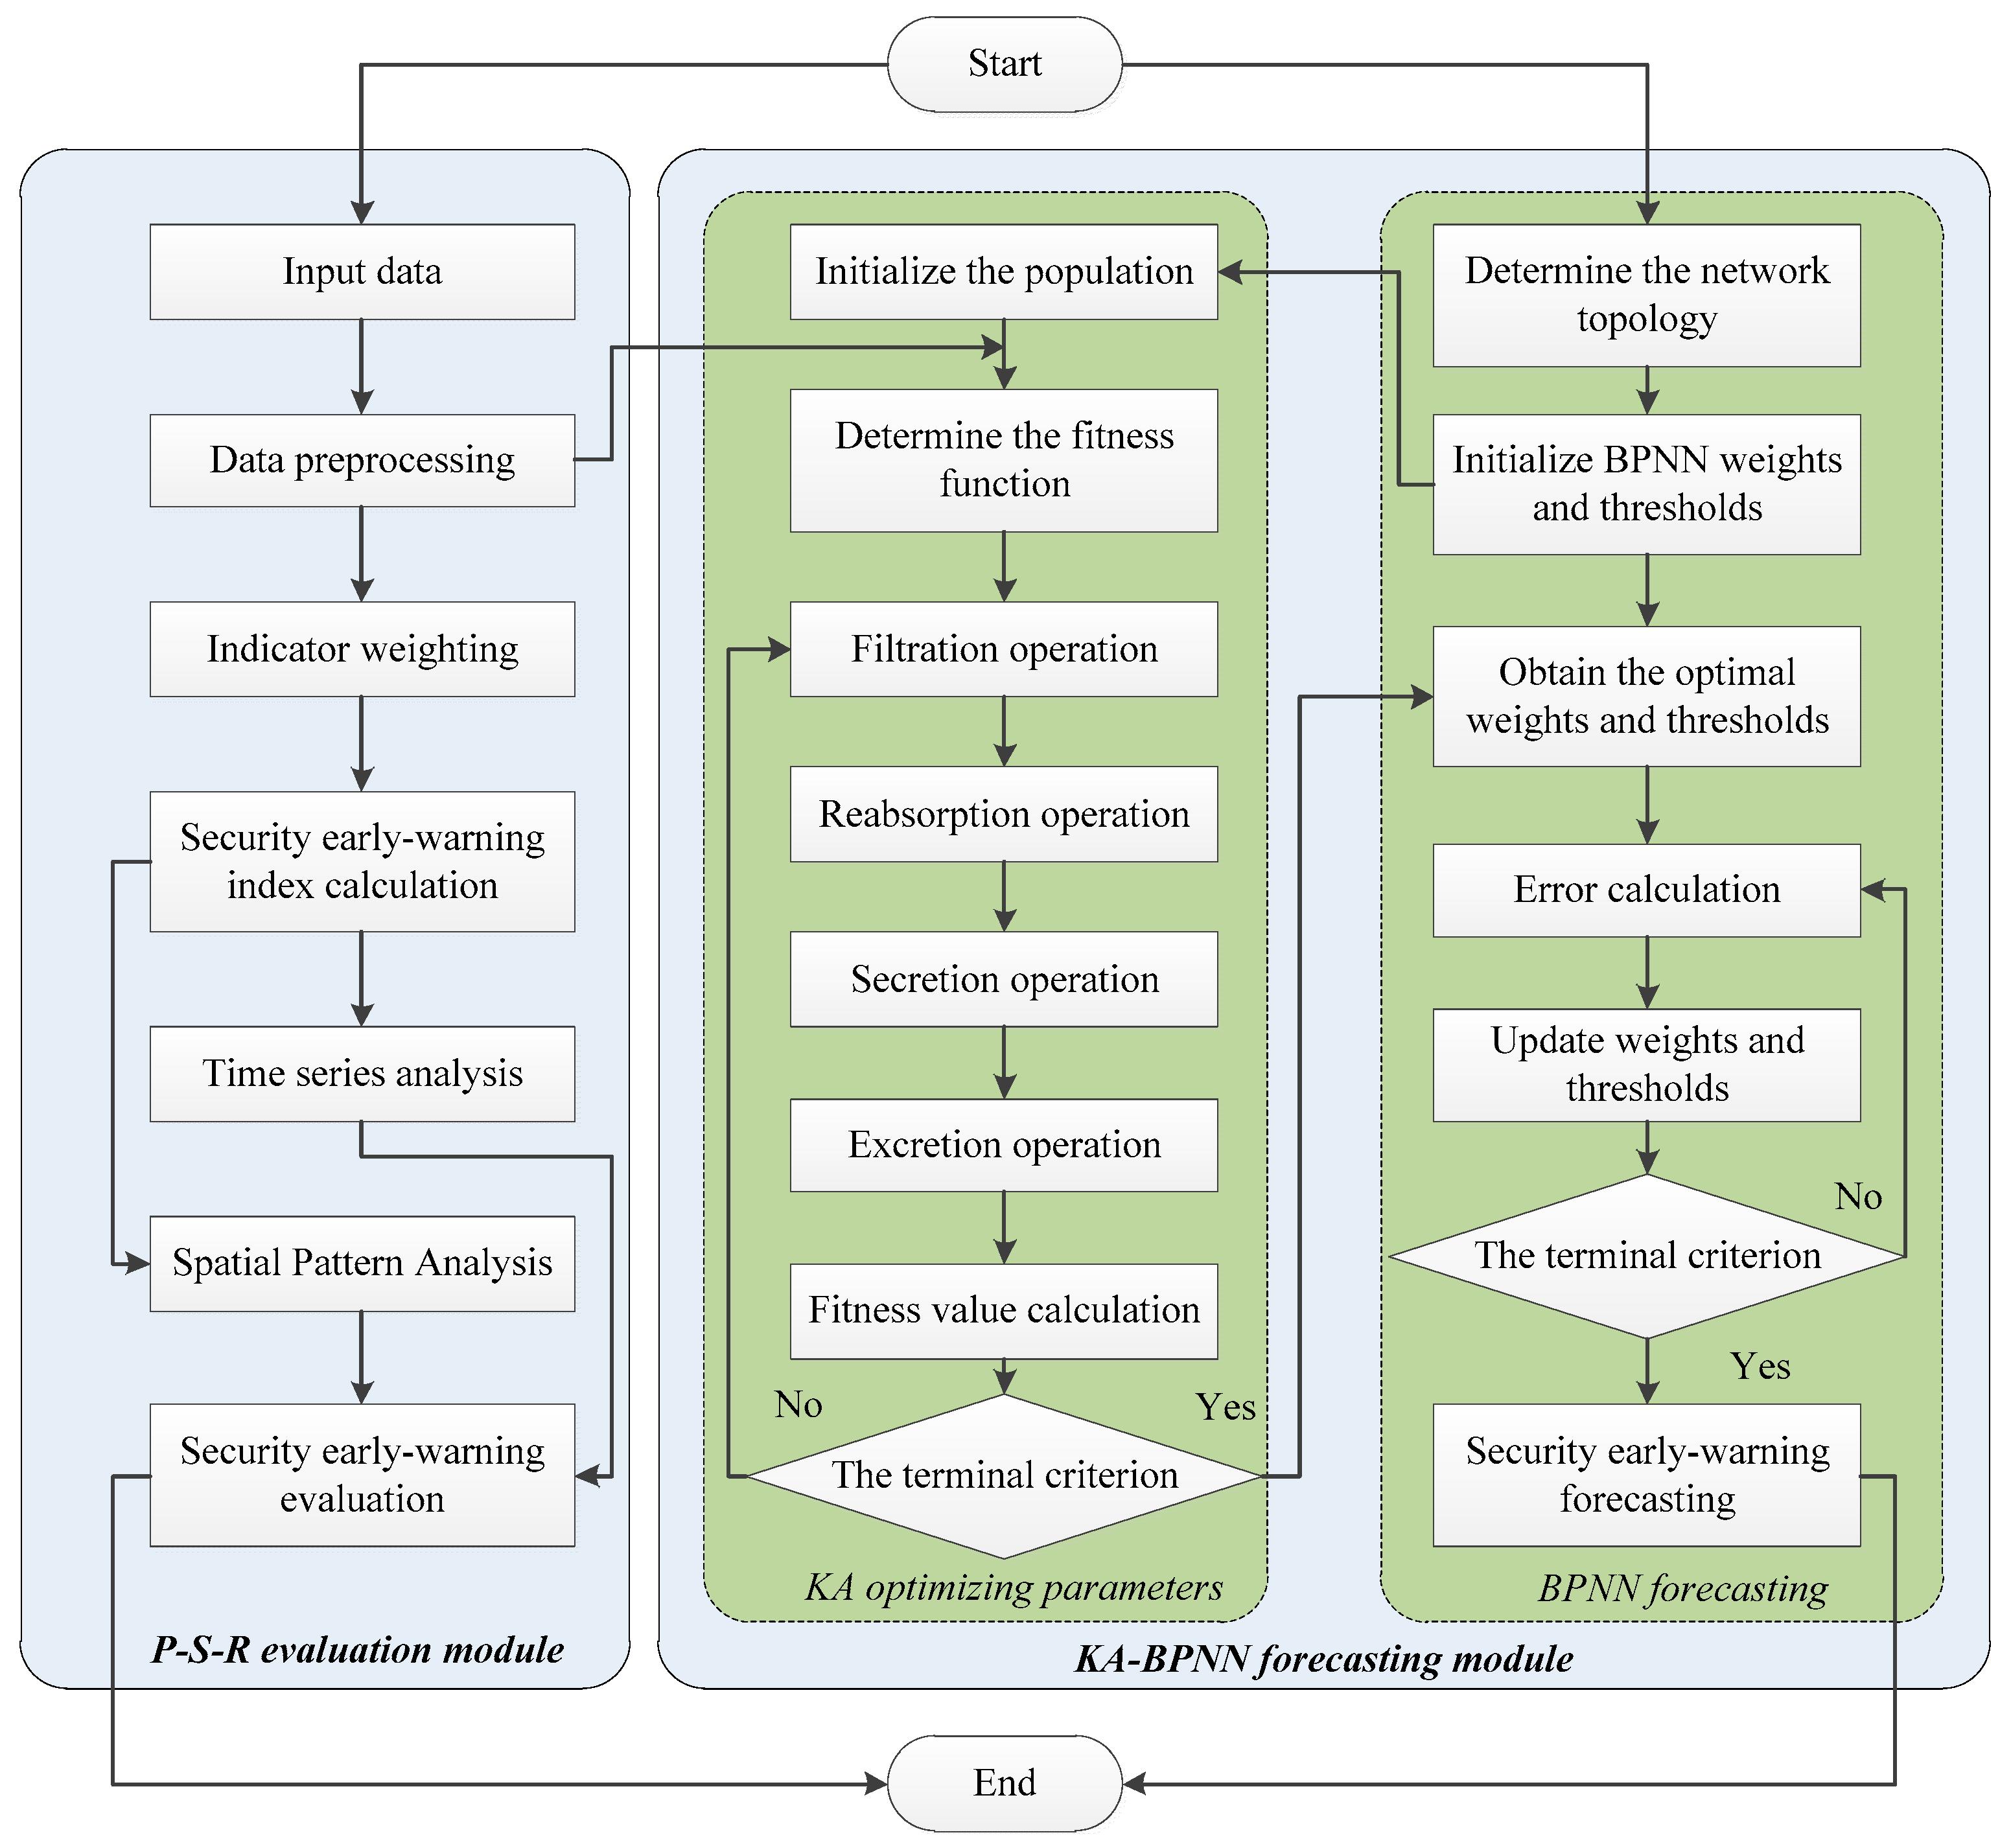
In summary, this paper will analyze the assessment and forecasting of the security early warning of ECCE in HB. First, based on the P-S-R model framework, an evaluation index system is established to assess the security early warning of ECCE in HB. Then, during 2000–2014, from two dimensions of time series and spatial patterns, the synthetic index and subsystem index of the security early warning of ECCE are analyzed and evaluated in HB. Finally, the model of BPNN optimized by the KA is utilized to predict and analyze the security early warning of ECCE in HB. The rest of the paper is structured as follows:
Section 2 introduces the algorithms used in this paper, including the calculation method of the ECCE security index, BPNN and KA. The construction process of the evaluation index system of the security early warning of ECCE is introduced in
Section 3. In
Section 4, two dimensions of the time series and spatial pattern are used to analyze the security early warning of ECCE in HB from 2000 to 2014.
Section 5 provides predictive analysis concerning the security early warning of ECCE in HB during the period 2015–2020.
Section 6 summarizes the research results.
4. Time Series and Spatial Pattern Assessment Analysis of the Security Early Warning of ECCE
4.1. Data Selection
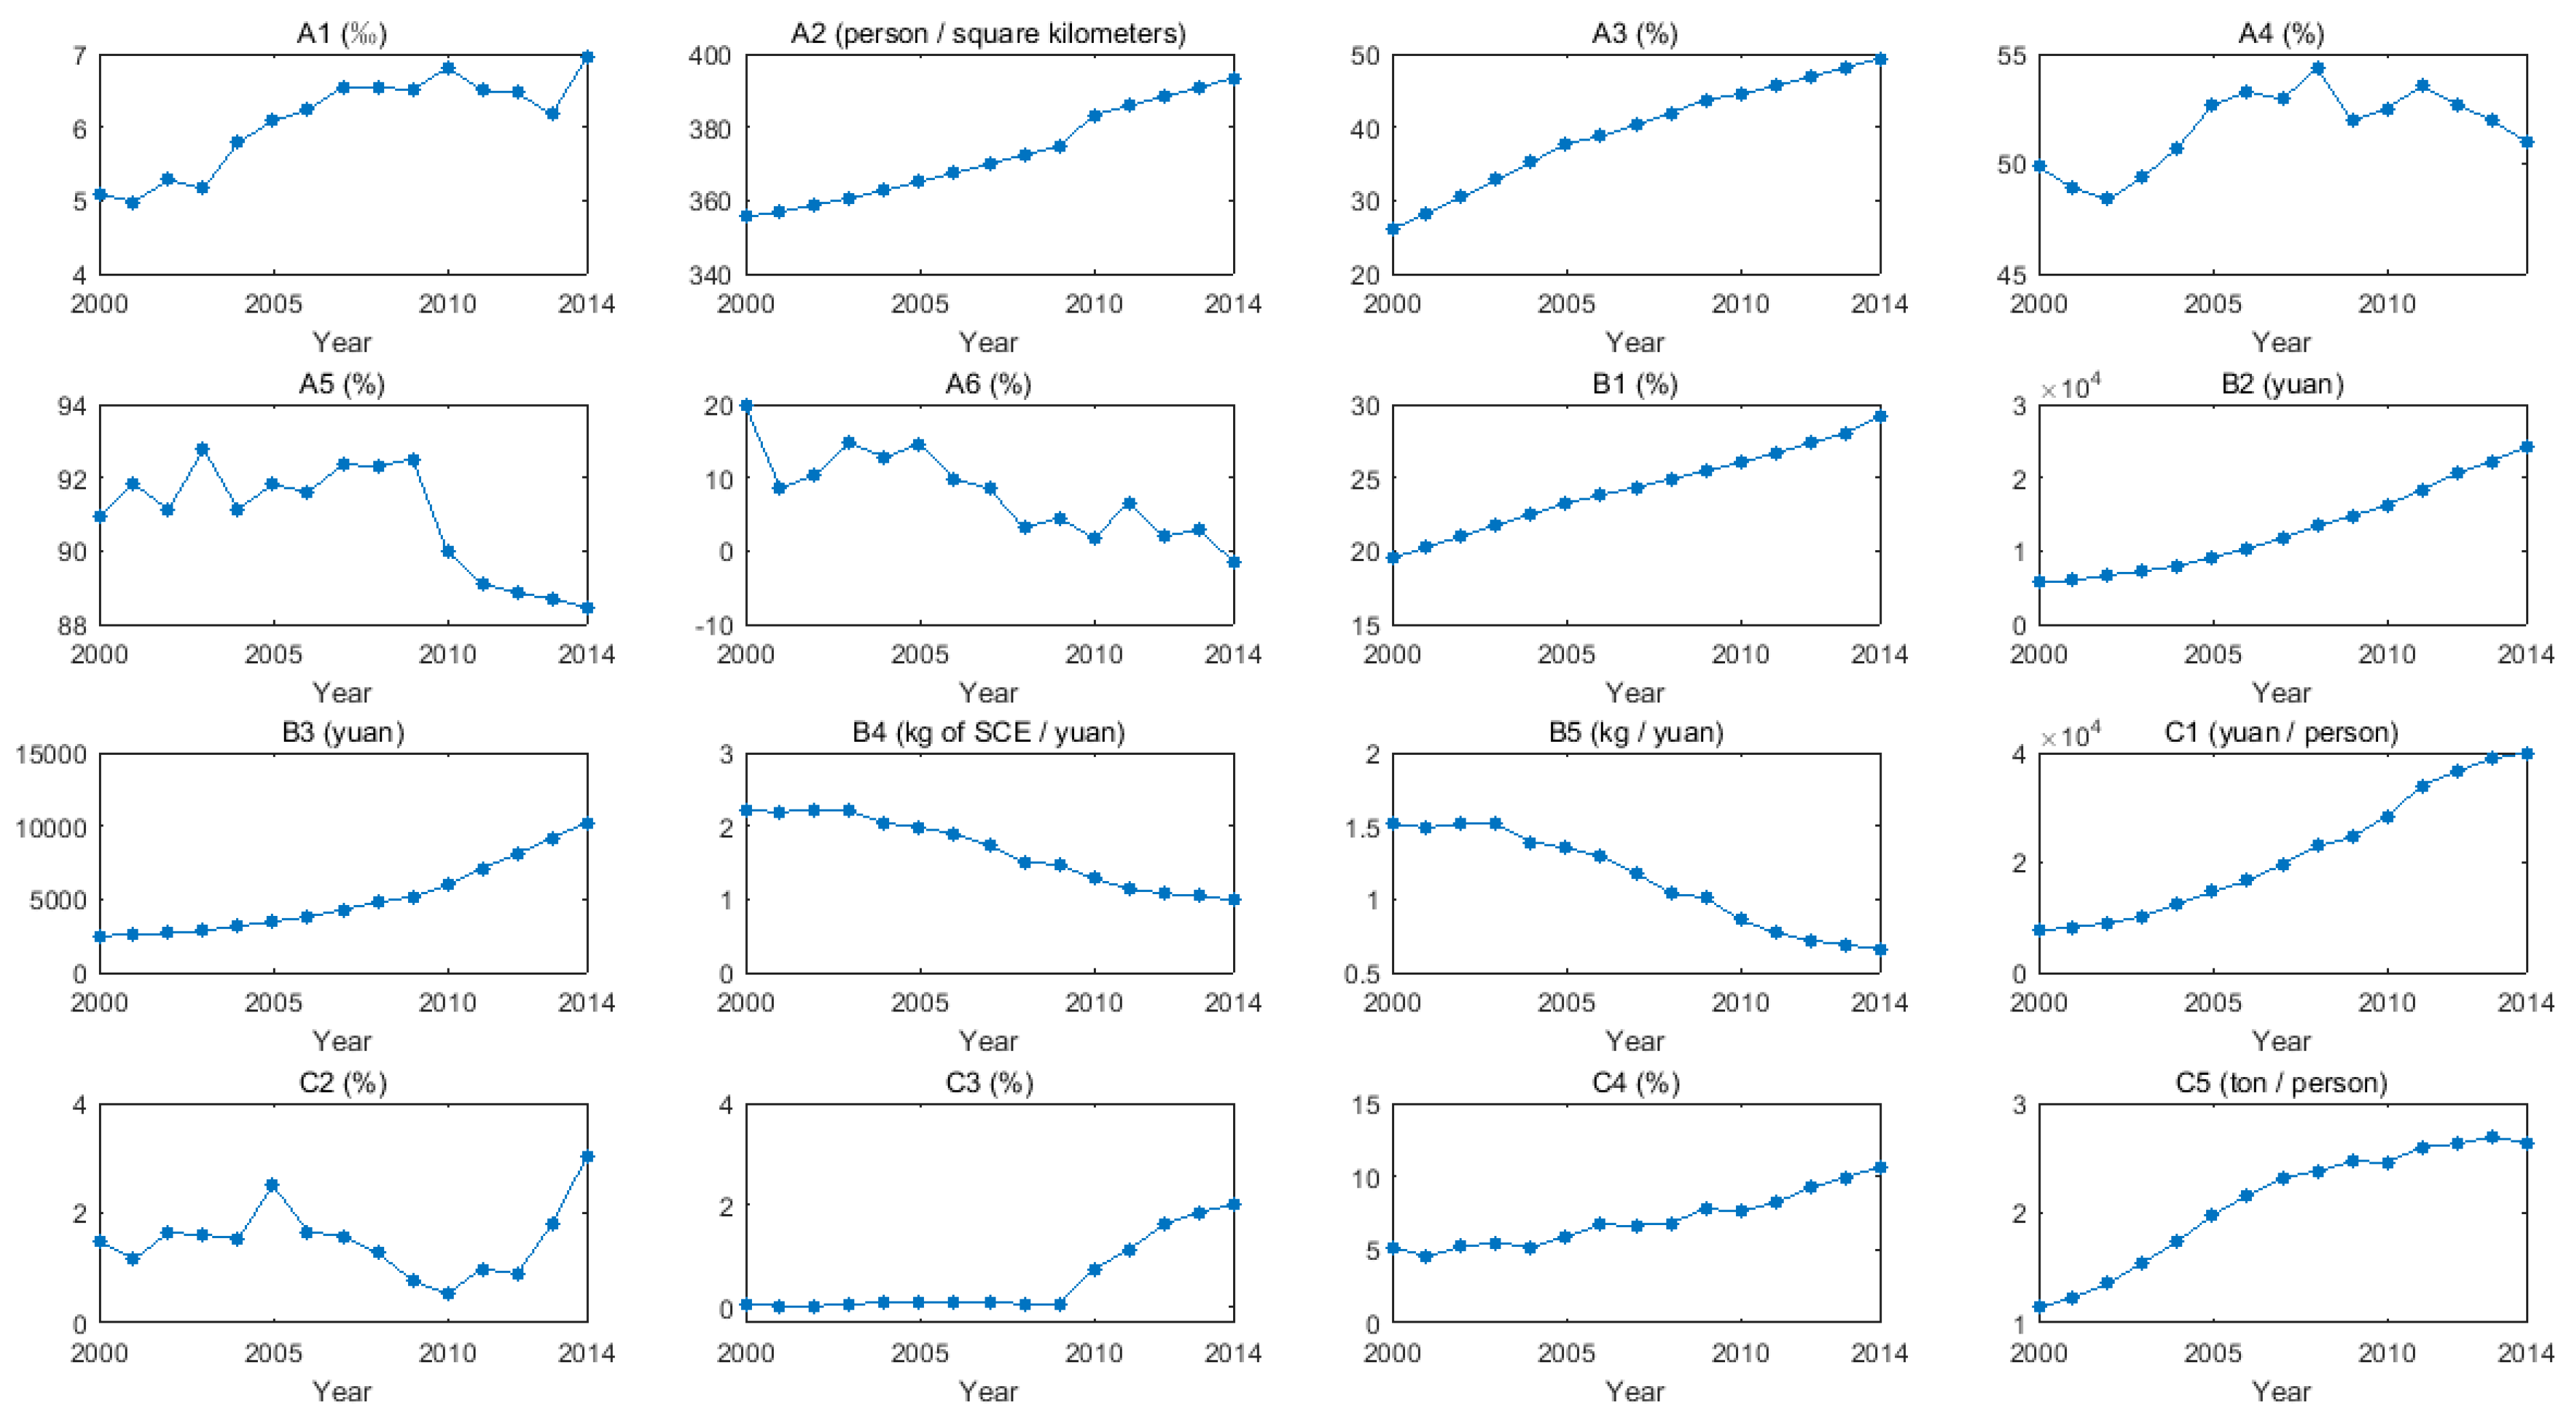
In this section, the security early warning of ECCE is analyzed in HB from 2000 to 2014. The original data comes from the Hebei Economic Yearbook (2001–2015) and the China Urban Statistical Yearbook (2015). After data reprocessing, the trend of the indicators is presented in
Figure 4.
4.2. Time Series Assessment Analysis
The original data are standardized according to Equations (1) and (2), and the Equation (3) is used to give the weight of each index, as is shown in
Table 3. Meanwhile, the Equation (4) is utilized to calculate the security early warning index of ECCE during 2000–2014 in HB. And the results are shown in
Table 4.
Then, this part will make a timing analysis about the comprehensive index of the early warning of carbon emissions and the index of each subsystem.
(1) Comprehensive index analysis
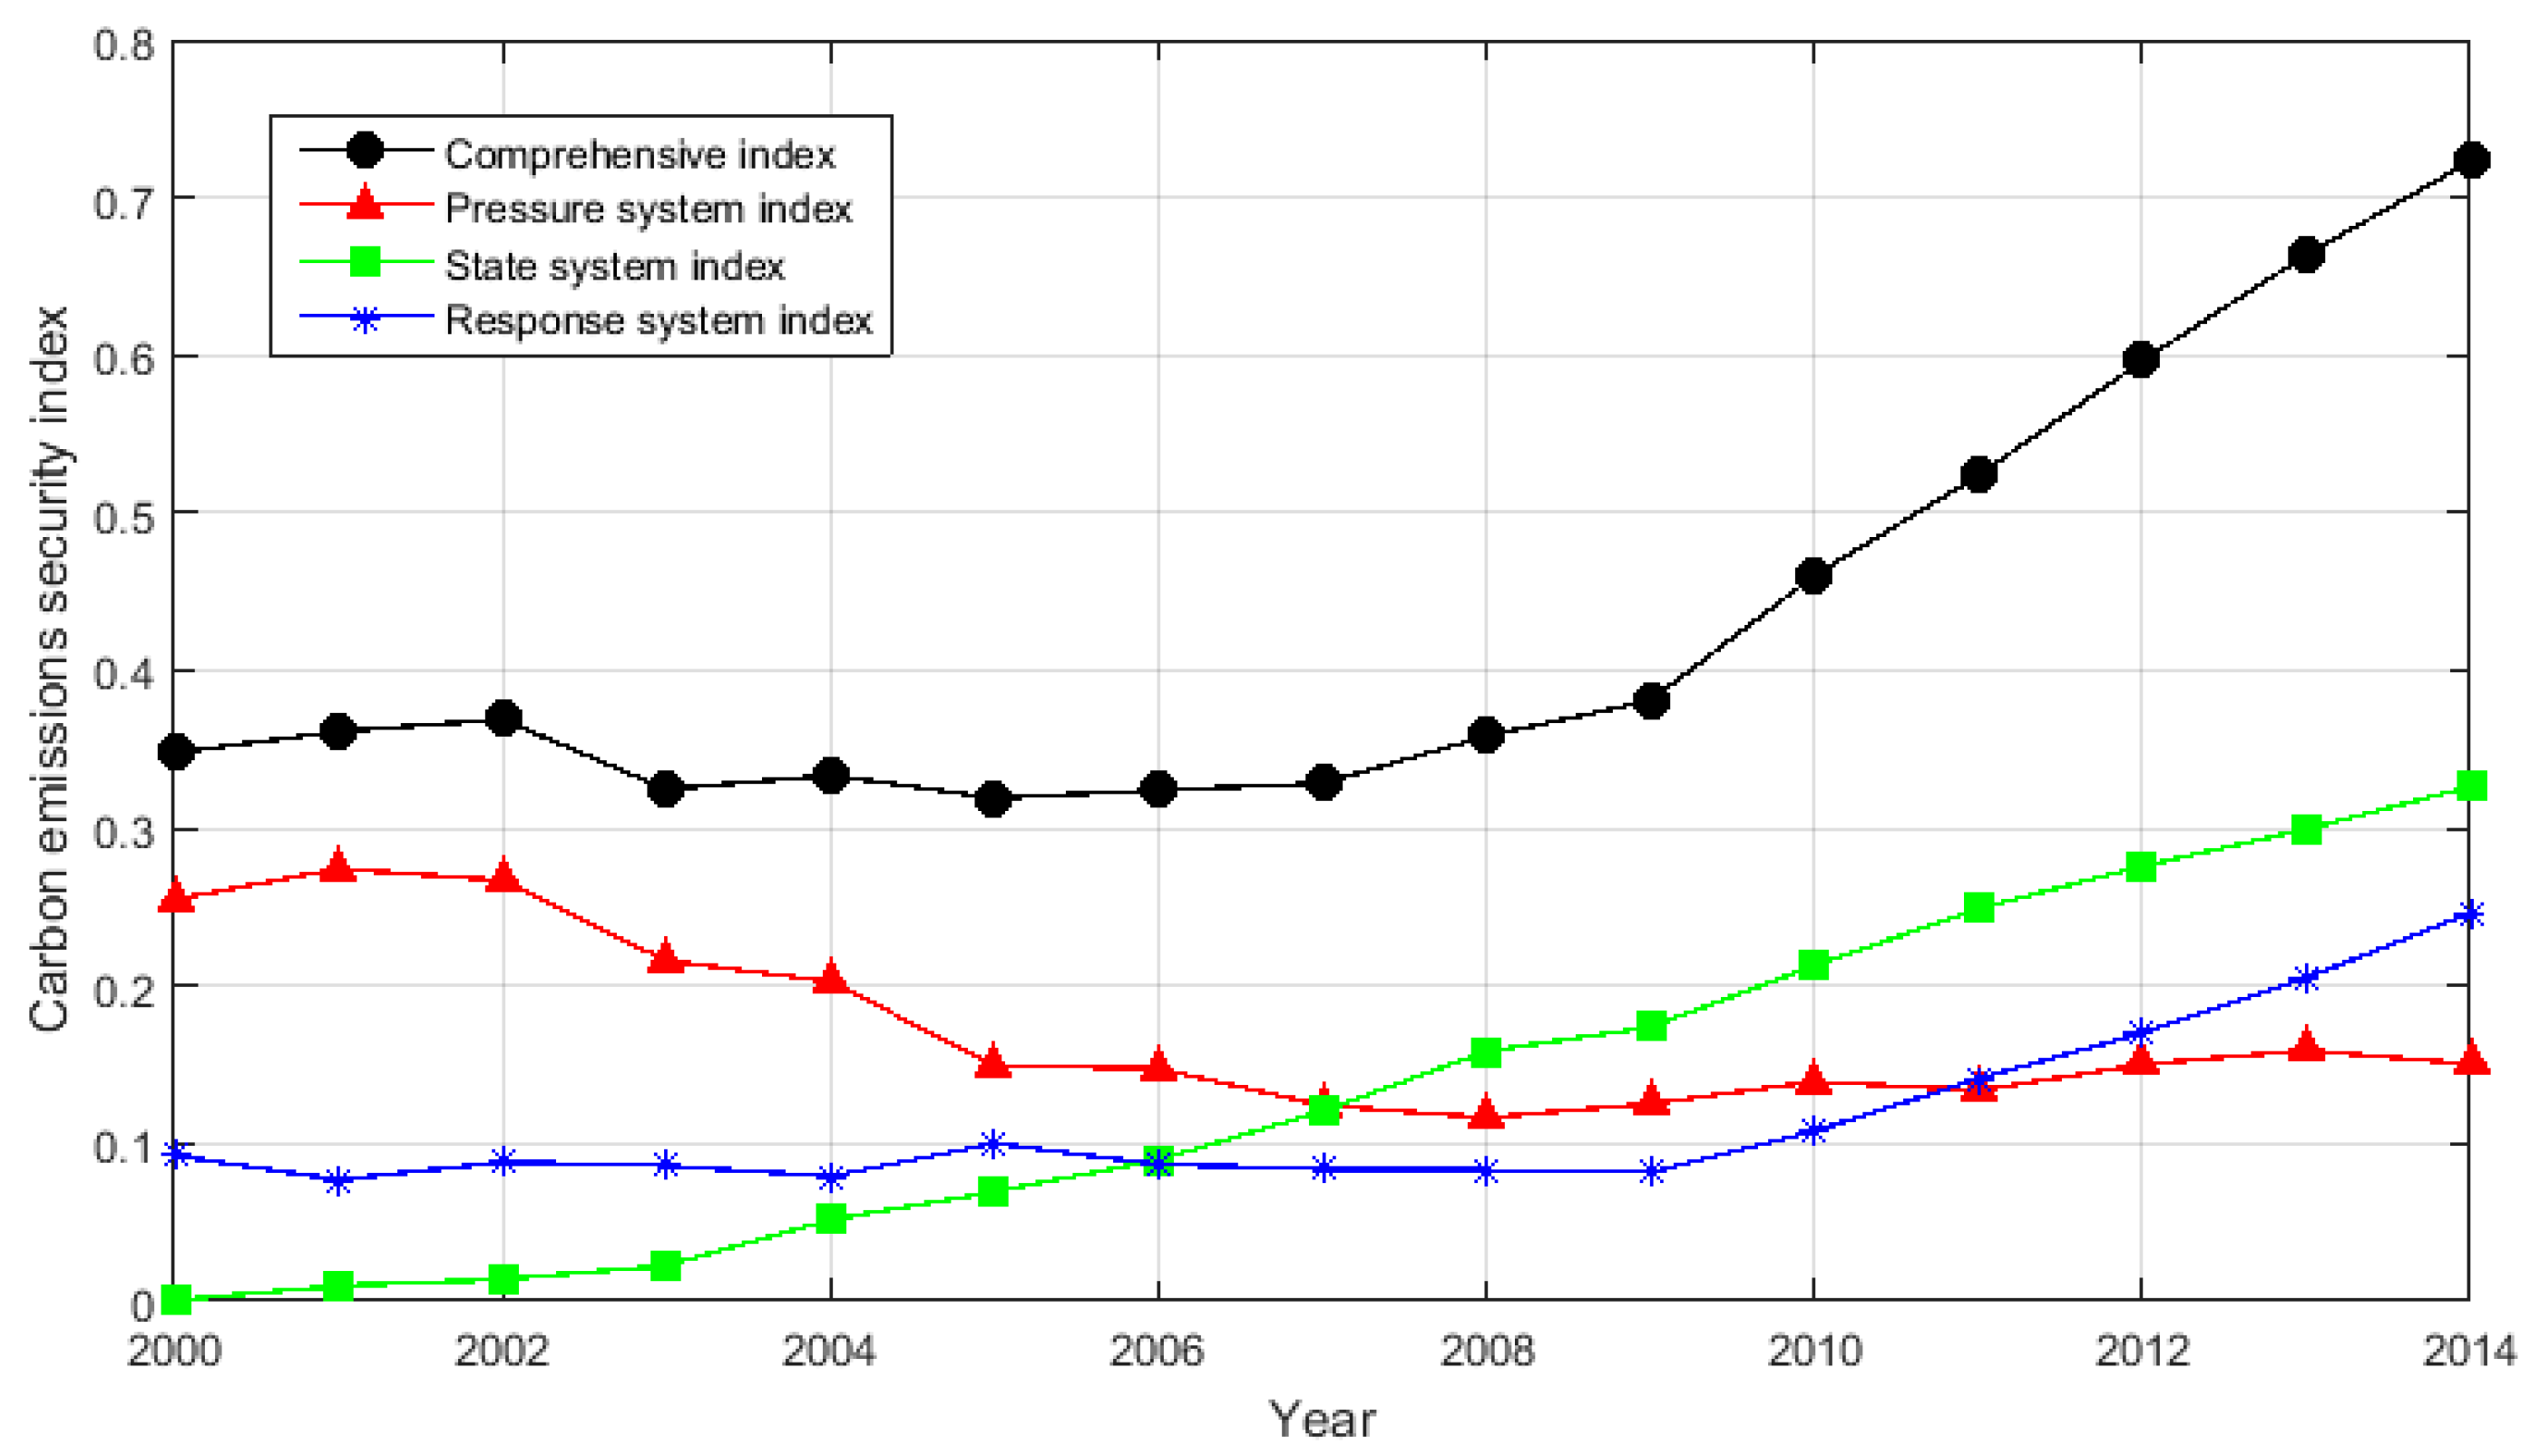
It can be seen from
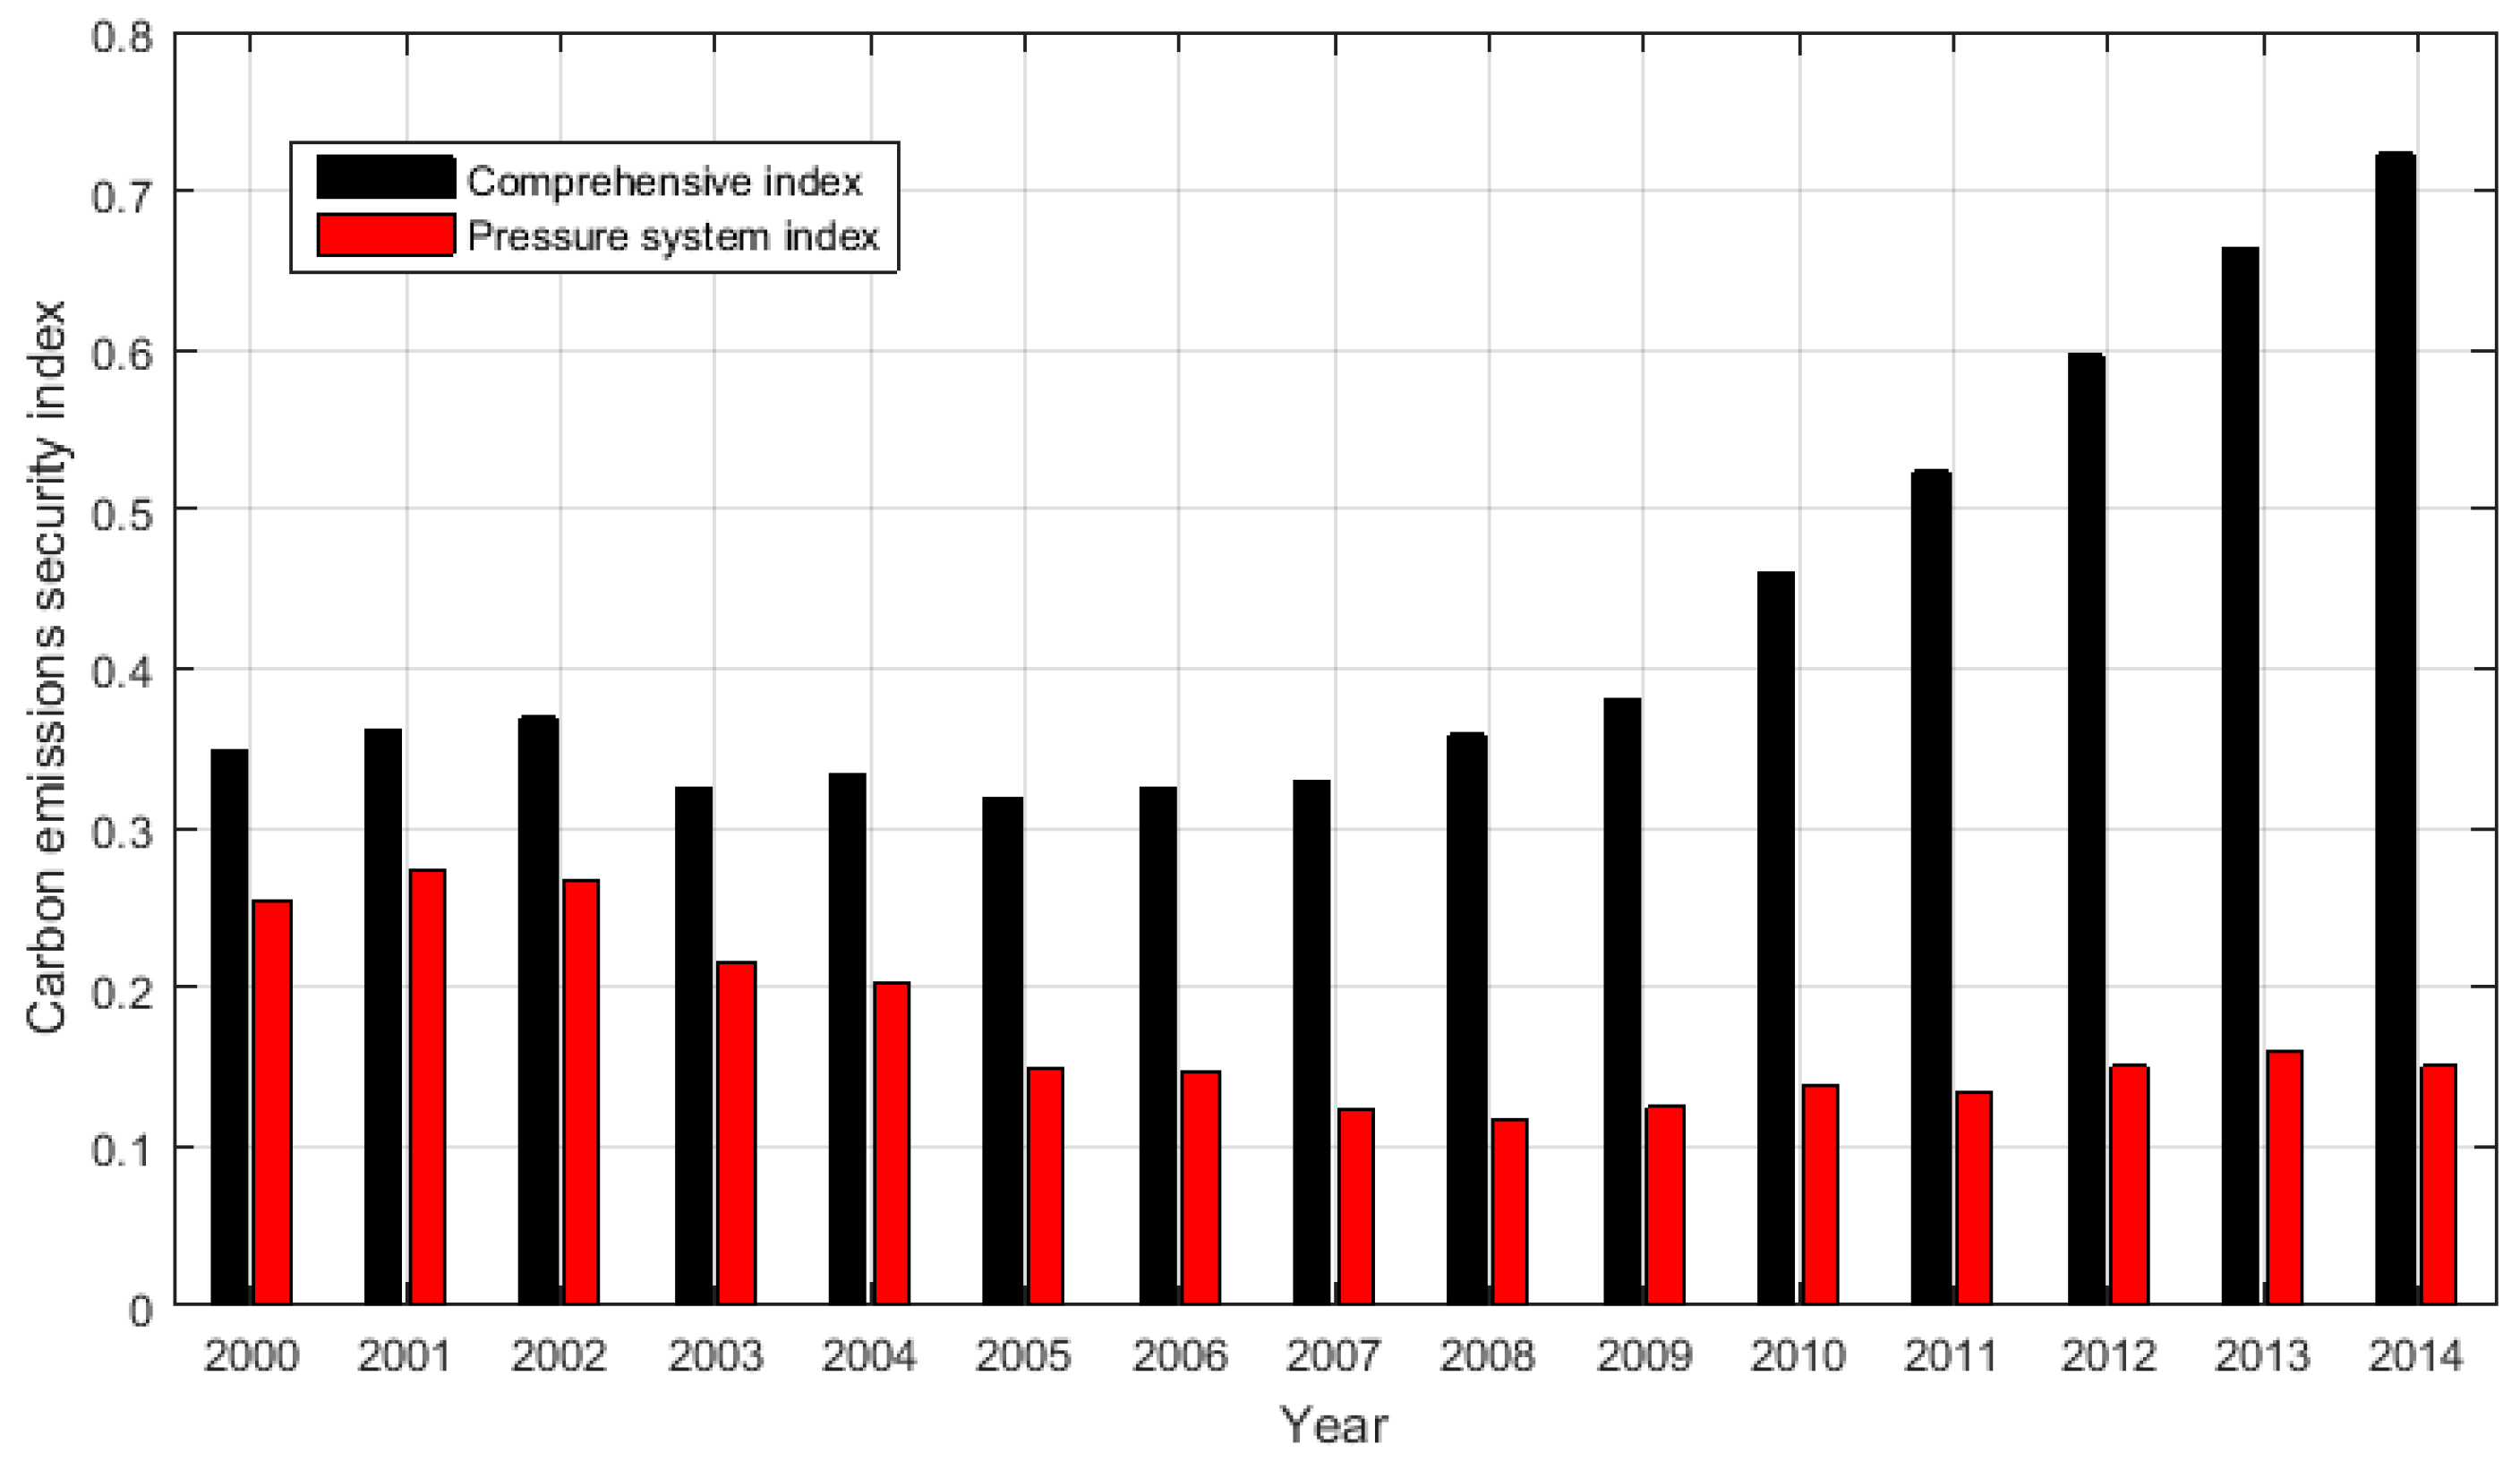
Figure 5 that the security index of ECCE shows a fluctuating upward trend in general in HB from 2000 to 2014. Its trend is “Insecurity” (2000–2009)–“Critical state” (2010–2012)–“Semi-secure” (2013–2014), while the trend of the alarm level is “Severe warning” (2000–2009)–“Moderate warning” (2010–2012)–“Slight warning” (2013–2014).
The comprehensive index of ECCE tended to rise in HB from 2000 to 2002, which rose from 0.3478 in 2000 and 0.3614 in 2001 to 0.3690 in 2002. During the period 2003–2007, the security situation of ECCE tended to fluctuate in a deteriorating state and the security index fell from 0.3690 in 2002 to 0.3247 in 2003. During 2008–2009, the comprehensive index, which was on an upward trend, rose from 0.3285 in 2007 to 0.3584 in 2008 and 0.3810 in 2009, demonstrating that the security situation of ECCE has improved. In 2009, HB government implemented the energy-saving and emission-reduction demonstration project named “Double Thirty”, established the green credit system, and carried out the evaluation of green credit policy, highlighting the one-vote veto of environmental protection in the credit approval system. On the construction of legal system, “Regulations of HB on Reducing Pollutant Discharge and Supervision” and “Management Measures of HB on Preventing and Controlling Environmental Pollution” were issued, providing a strong legal guarantee to strengthen environmental law enforcement and deepen pollution reduction. Thus, since then, the security status of ECCE has changed significantly, during which the security index increased at an average annual rate of 13.73%, from 0.3810 in 2009 to 0.7229 in 2014. Considering the change trend, it is indicated that the work of energy-saving and emission-reduction has achieved some success in recent years in HB. Moreover, it can be demonstrated that HB has made great efforts to the efficiency of energy consumption since 2008, especially with the Beijing Olympic Games as well as the 2014 APEC (Asia-Pacific Economic Cooperation) conference held in Beijing.
(2) Pressure system index analysis
Figure 6 shows that, the pressure system index presented a trend of fluctuant reduction during 2000–2004 in HB. Among these, the maximum value, 0.2743, appeared in 2001, and it remained above 0.2000 with an average of 0.2430 from 2000 to 2004. In 2005, the pressure system index decreased significantly and remained at an average of 0.1396 since then.
In this period, not only the natural population growth rate increased from 5.09 per thousand in 2000 to 6.95 per thousand in 2014, but also the population density increased from 355.58 people per square kilometer in 2000 to 393.41 people per square kilometer in 2014, which illustrated that the pressure of population was increasing in HB. Meanwhile, due to the accelerated urbanization (the urbanization rate increased from 26.09% in 2000 to 49.33% in 2014), the propulsion of heavy-industrialization (the second industry share remained at more than 48% throughout), and the proportion of traditional fossil energy consumption remaining high, the security early warning of ECCE bored a greater pressure, which leaded to a downward trend in the overall pressure system index.
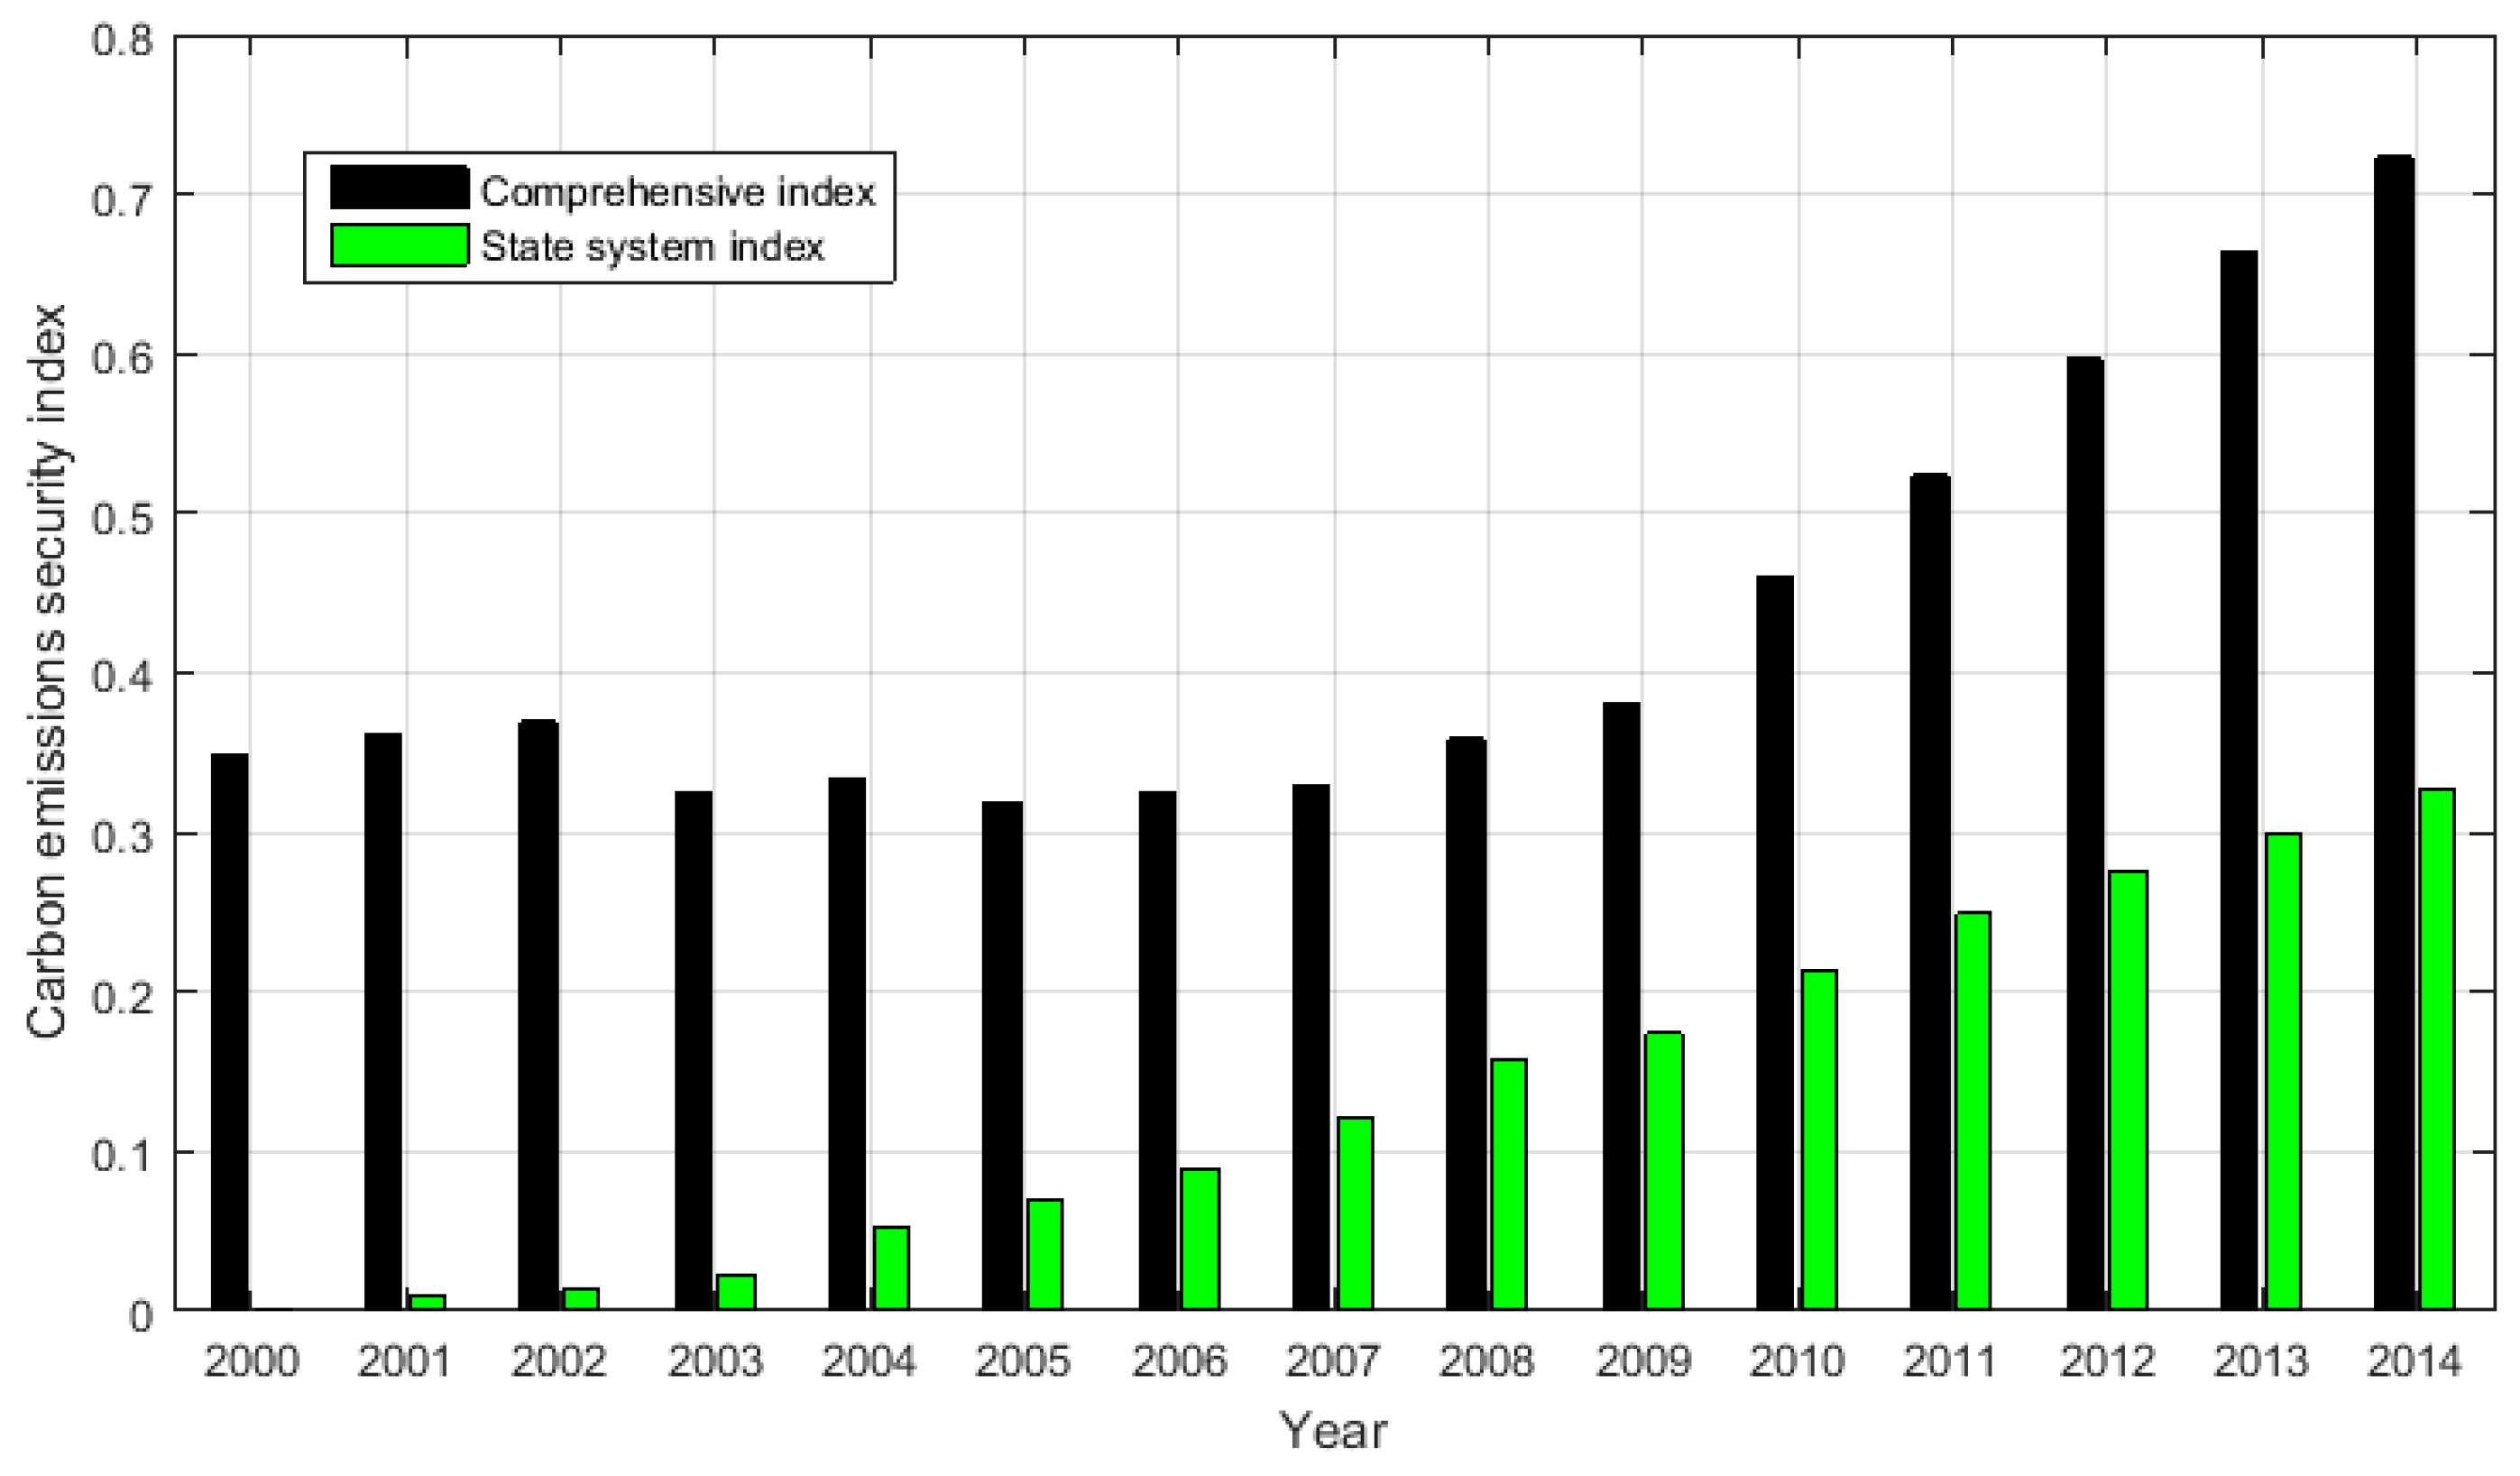
(3) State system index analysis
As presented in
Figure 7, the state system index basically implied a straight upward trend from 2000 to 2014 in HB. It grew from 0.0006 in 2000 to 0.3264 in 2014. However, the annual growth rate of the state system index has dropped and maintained at an average of 12.84% since 2009.
In this period, the forest coverage has been greatly improved, from 19.5% in 2000 to 29.2% in 2014. The urban per capita disposable income and the rural per capita pure income also grew rapidly. Energy efficiency has been greatly improved and the energy consumption per unit of GDP dropped from 2.21 kg of standard coal/yuan in 2000 to 0.99 kg of standard coal/yuan, leading to a continuous improvement for the state system index of the same period. Nevertheless, more energy consumption will be produced when the income level of urban and rural residents increases. And the energy consumption per unit of GDP will also be more difficult to continue to decline after it falls to a certain extent. Especially with the acceleration of urbanization, the forest land, agricultural land and other carbon sink resources will likely reduce, which will undoubtedly increase the pressure that the state system index of the security early warning of ECCE will rise in HB.
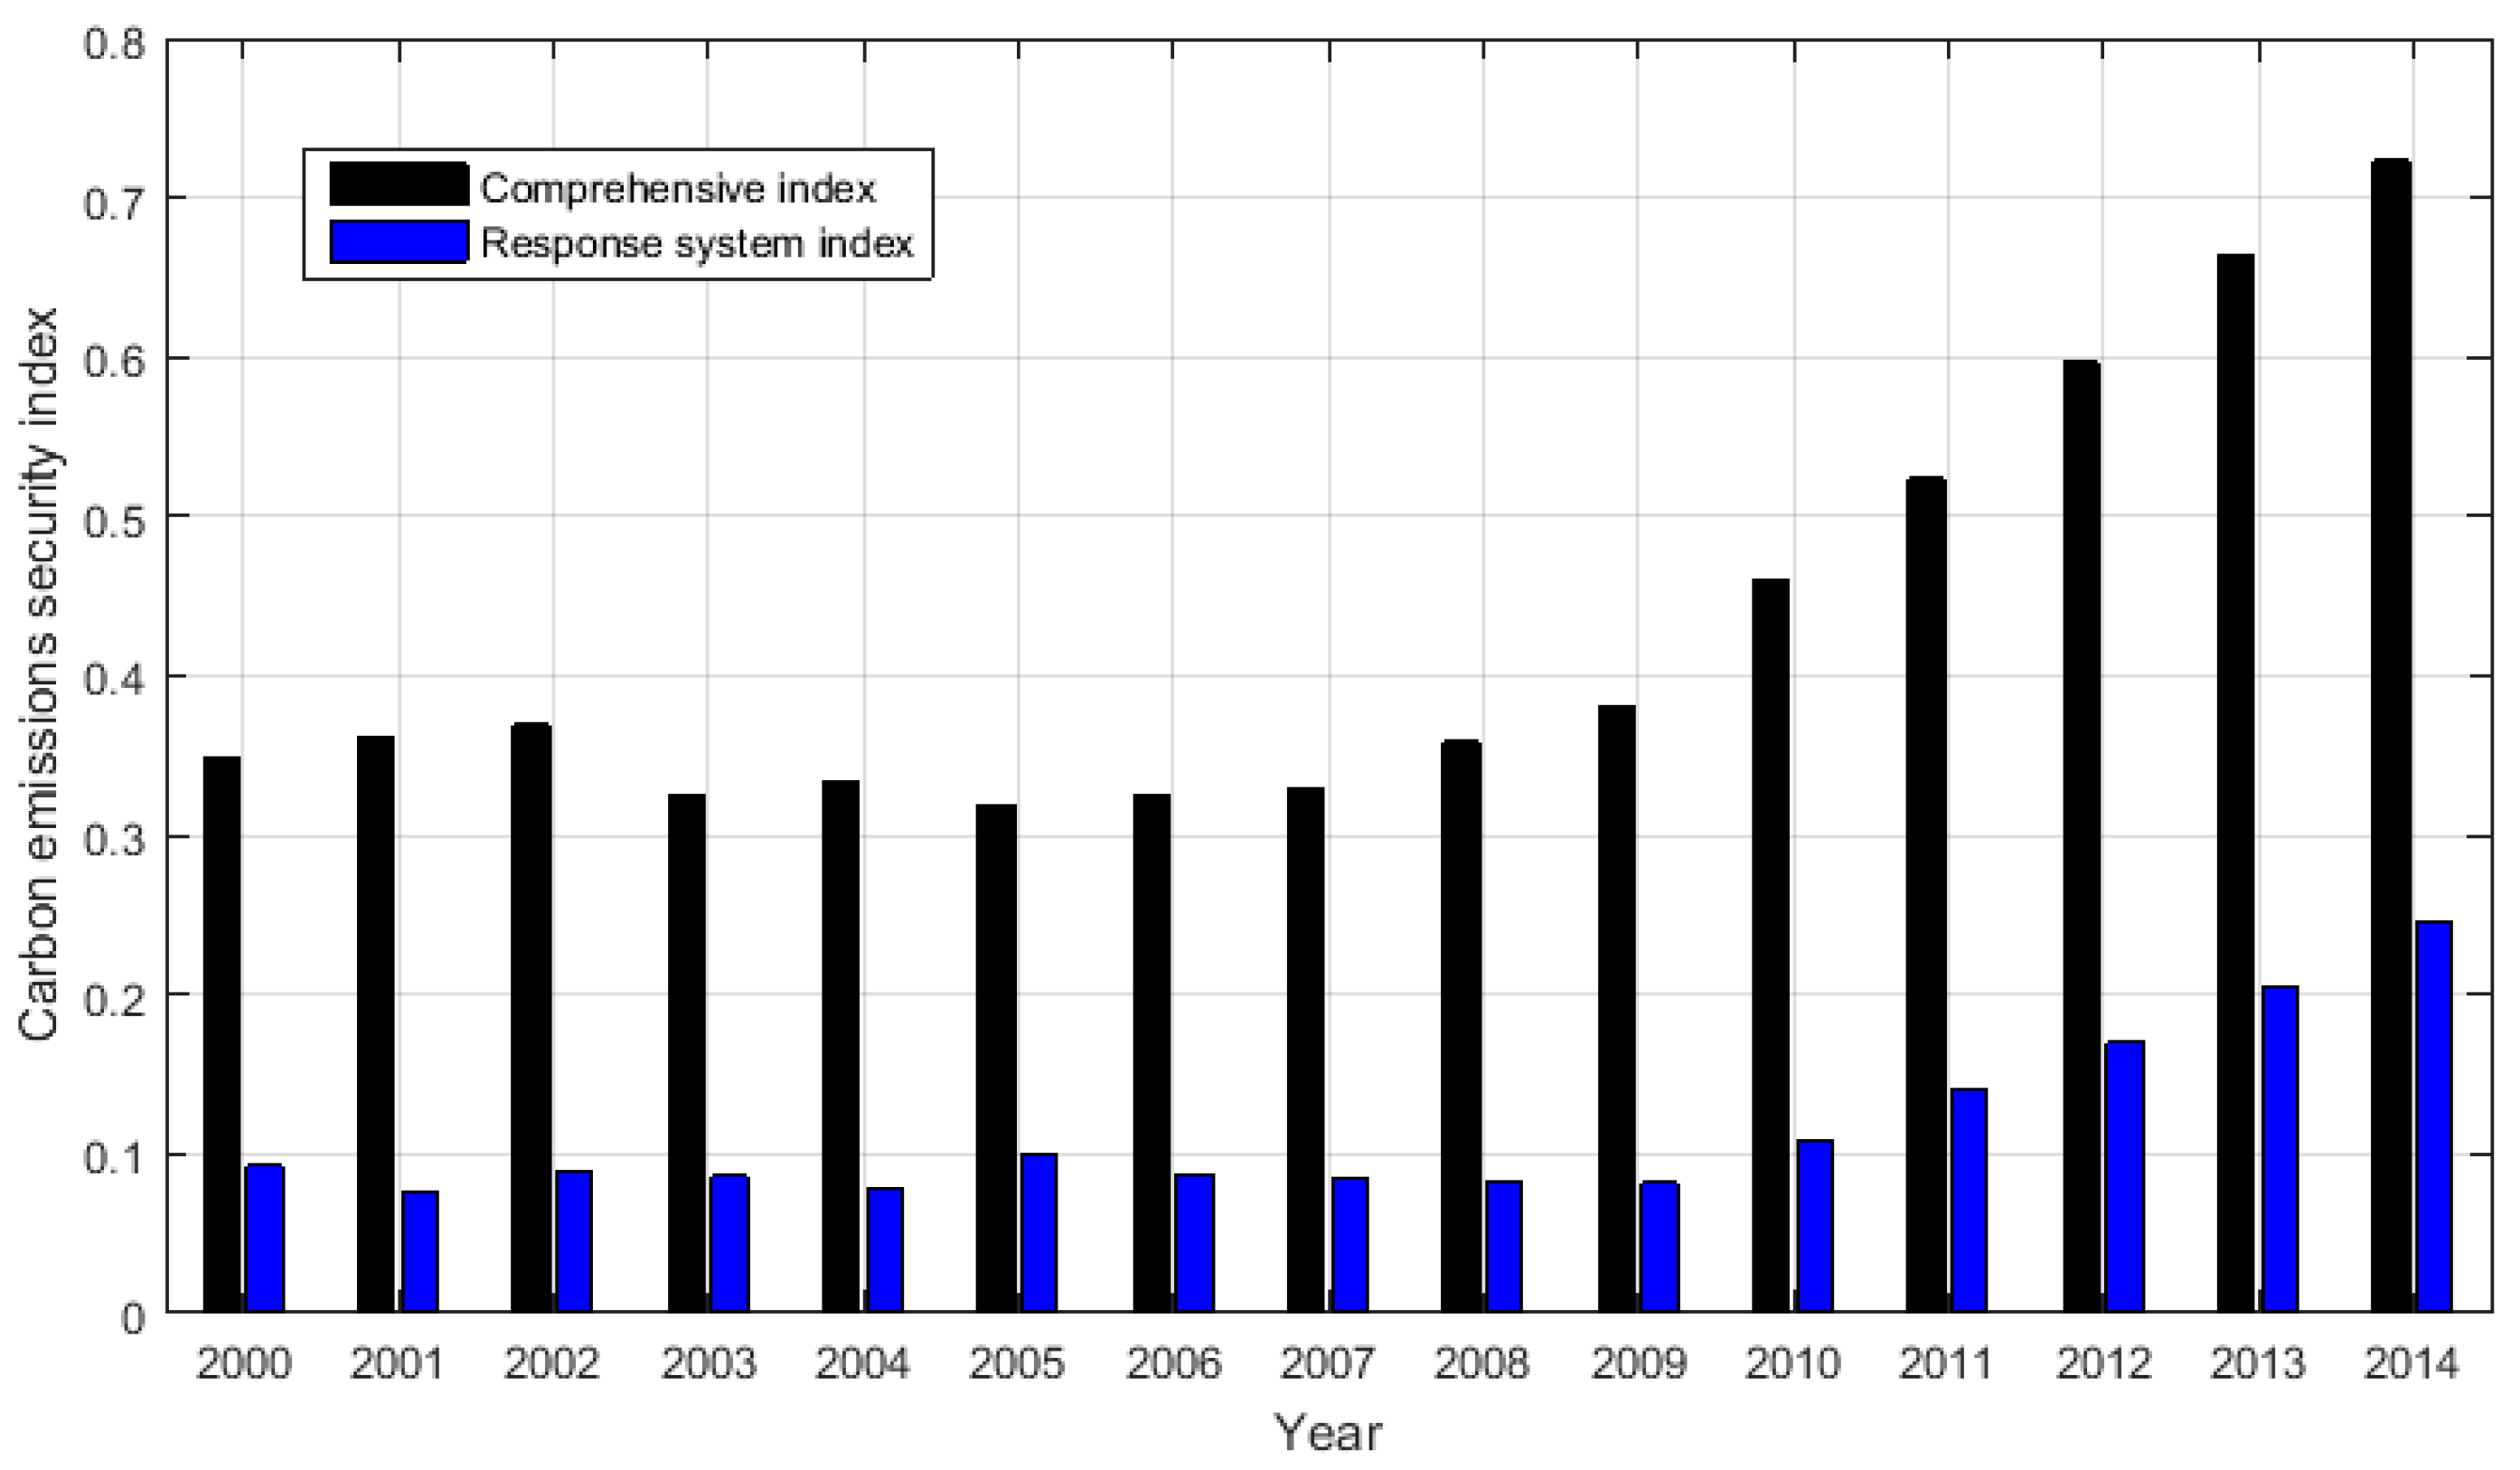
(4) Response system index analysis
From
Figure 8, it can be found that the response system index generally showed a fluctuating growth trend as same as the growth trend of the comprehensive index. The response system index was at a low level with an average of 0.0859 from 2000 to 2009. After 2009, the growth rate increased significantly with an annual growth rate of 22.95%.
In order to strengthen the environmental pollution control in Beijing-Tianjin-Hebei region, HB increased investment in environmental protection every year, during which the proportion of environmental governance investment accounted for GDP increased from 1.48% in 2000 to 3.02% in 2014. HB has accelerated the development of new energy projects so as to optimize the energy structure and improve the energy structure dominated by coal consumption. Especially in Zhangjiakou, Chengde and other cities, a lot of photovoltaic power generation pilot bases have been built. The proportion of R&D investment accounted for GDP increased from 5.19% in 2000 to 10.65% in 2014, which promoted the improvement of response system index of security early warning of ECCE to a large extent.
4.3. Spatial Pattern Assessment Analysis
According to the relevant data of HB in 2014, the comprehensive index and each subsystem index in 2014 are calculated, applying the aforementioned calculation method.
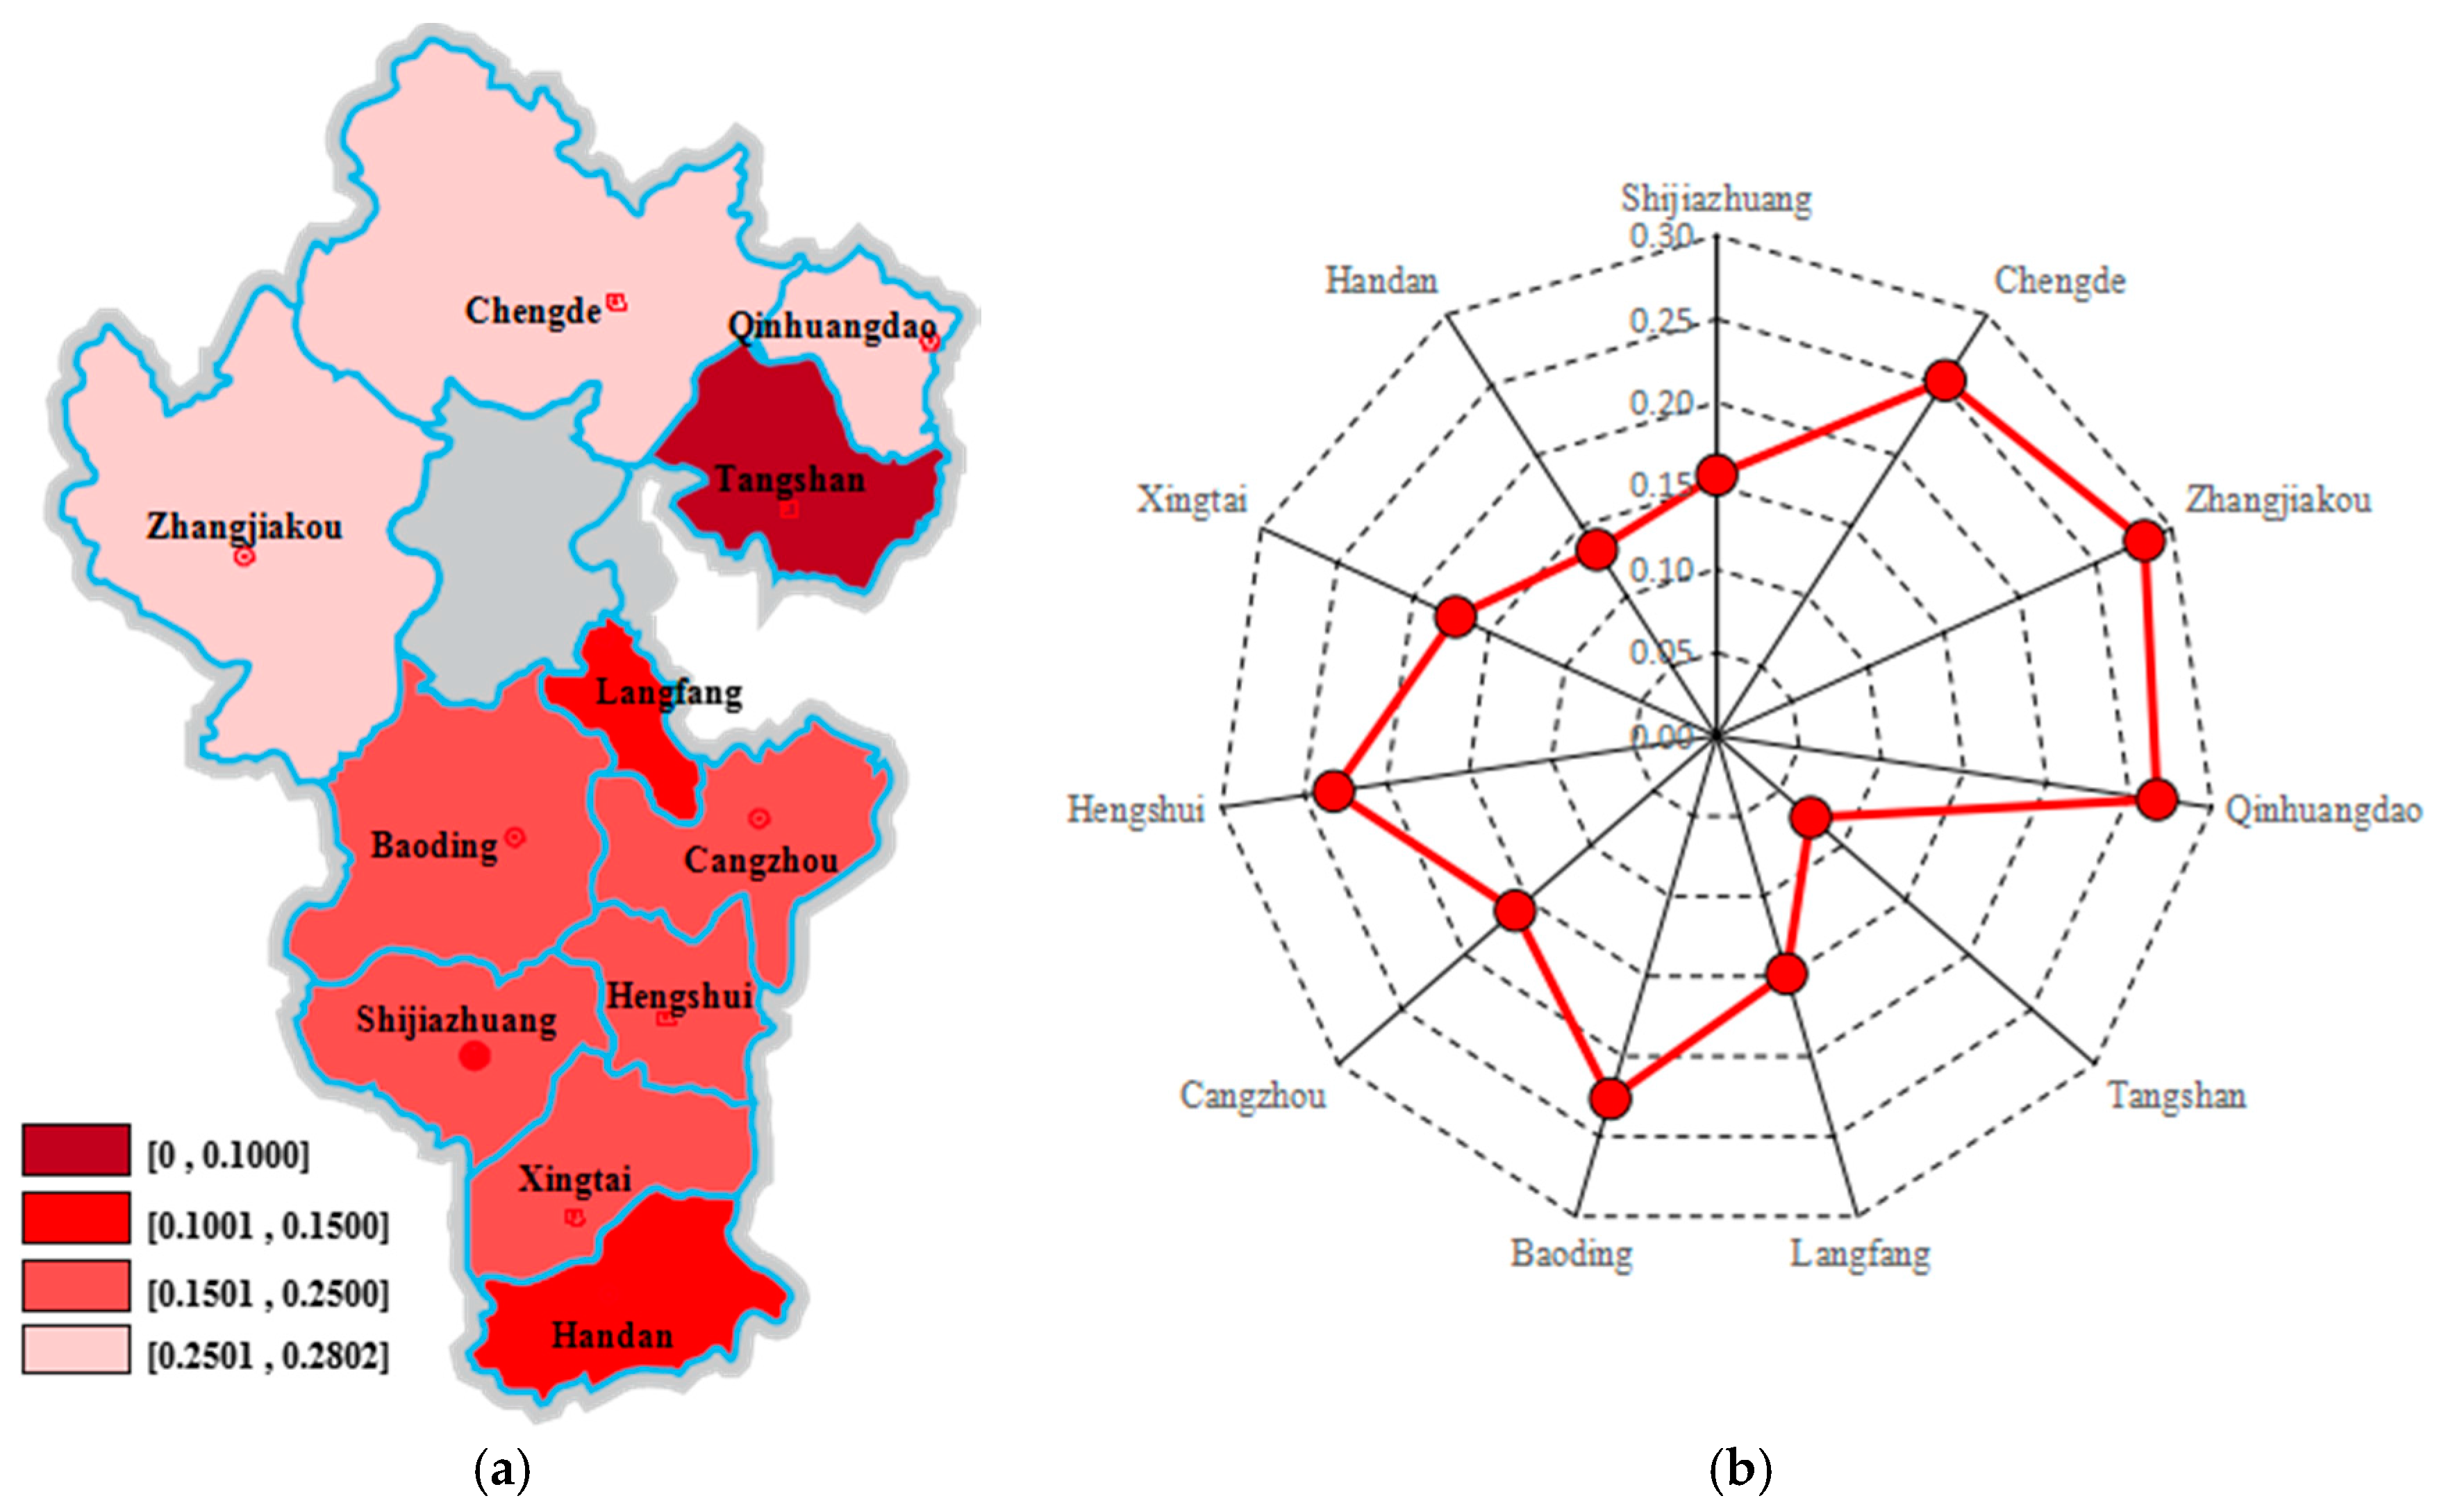
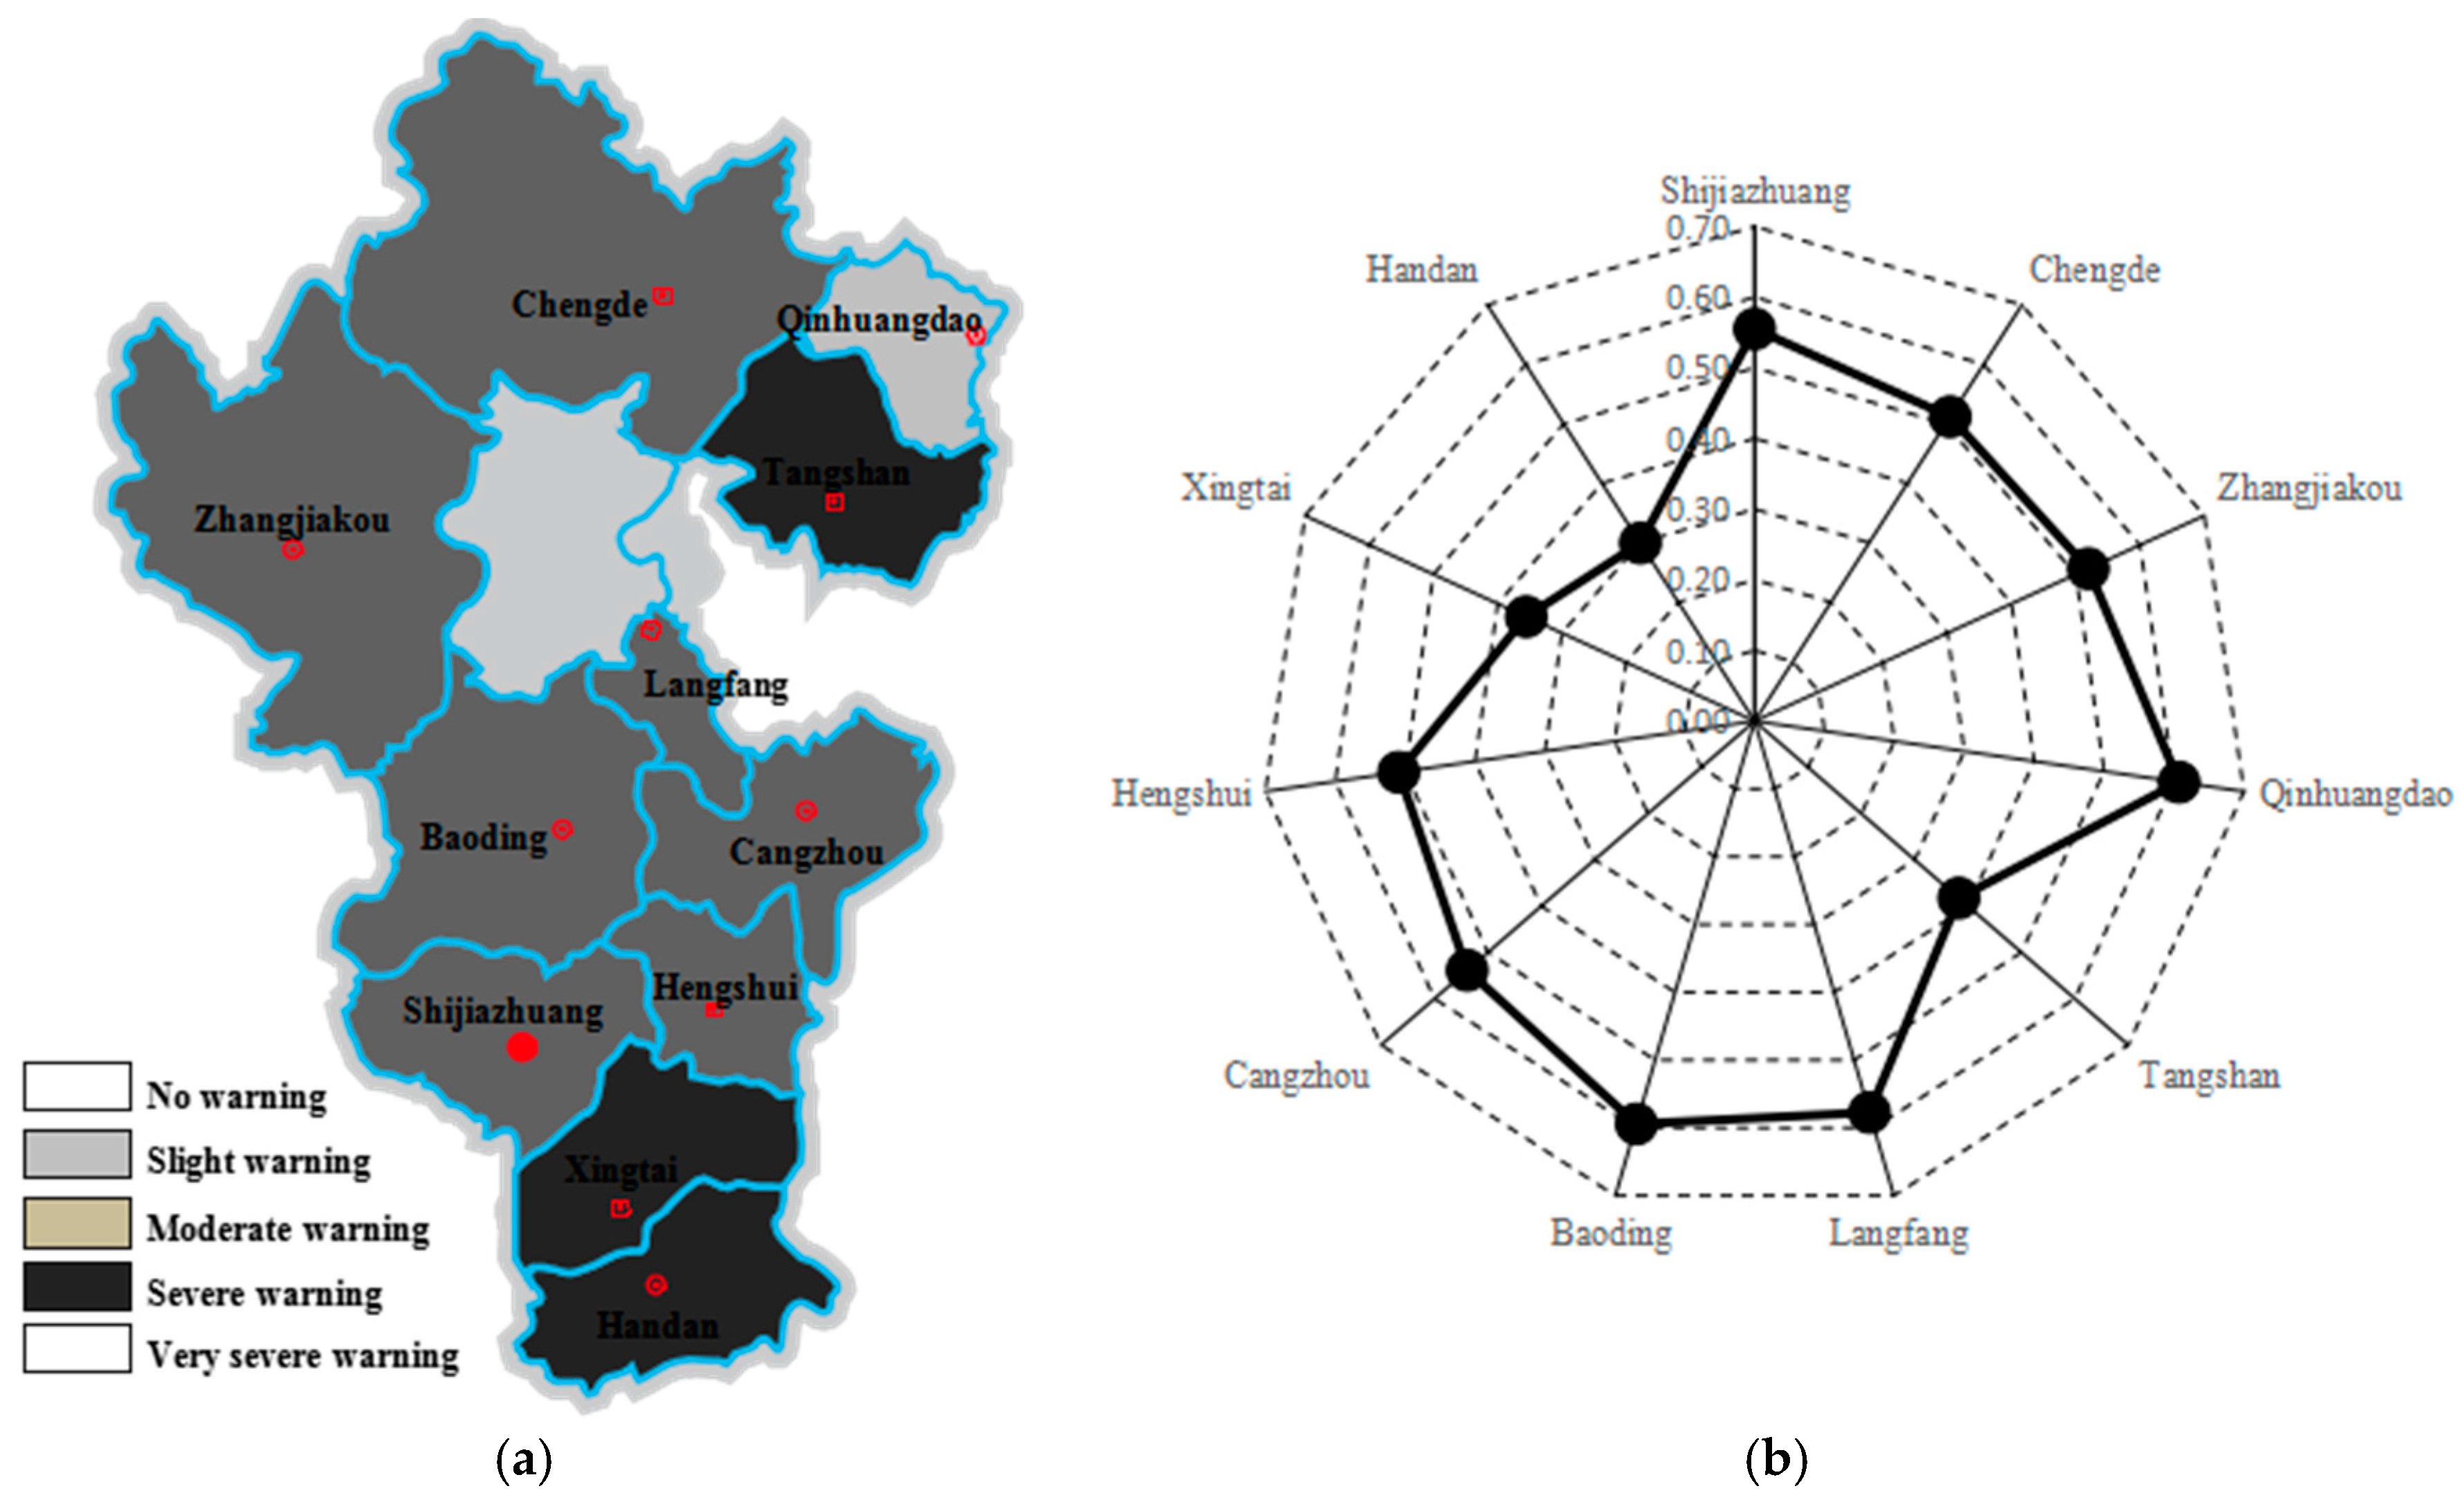
(1) Comprehensive index analysis
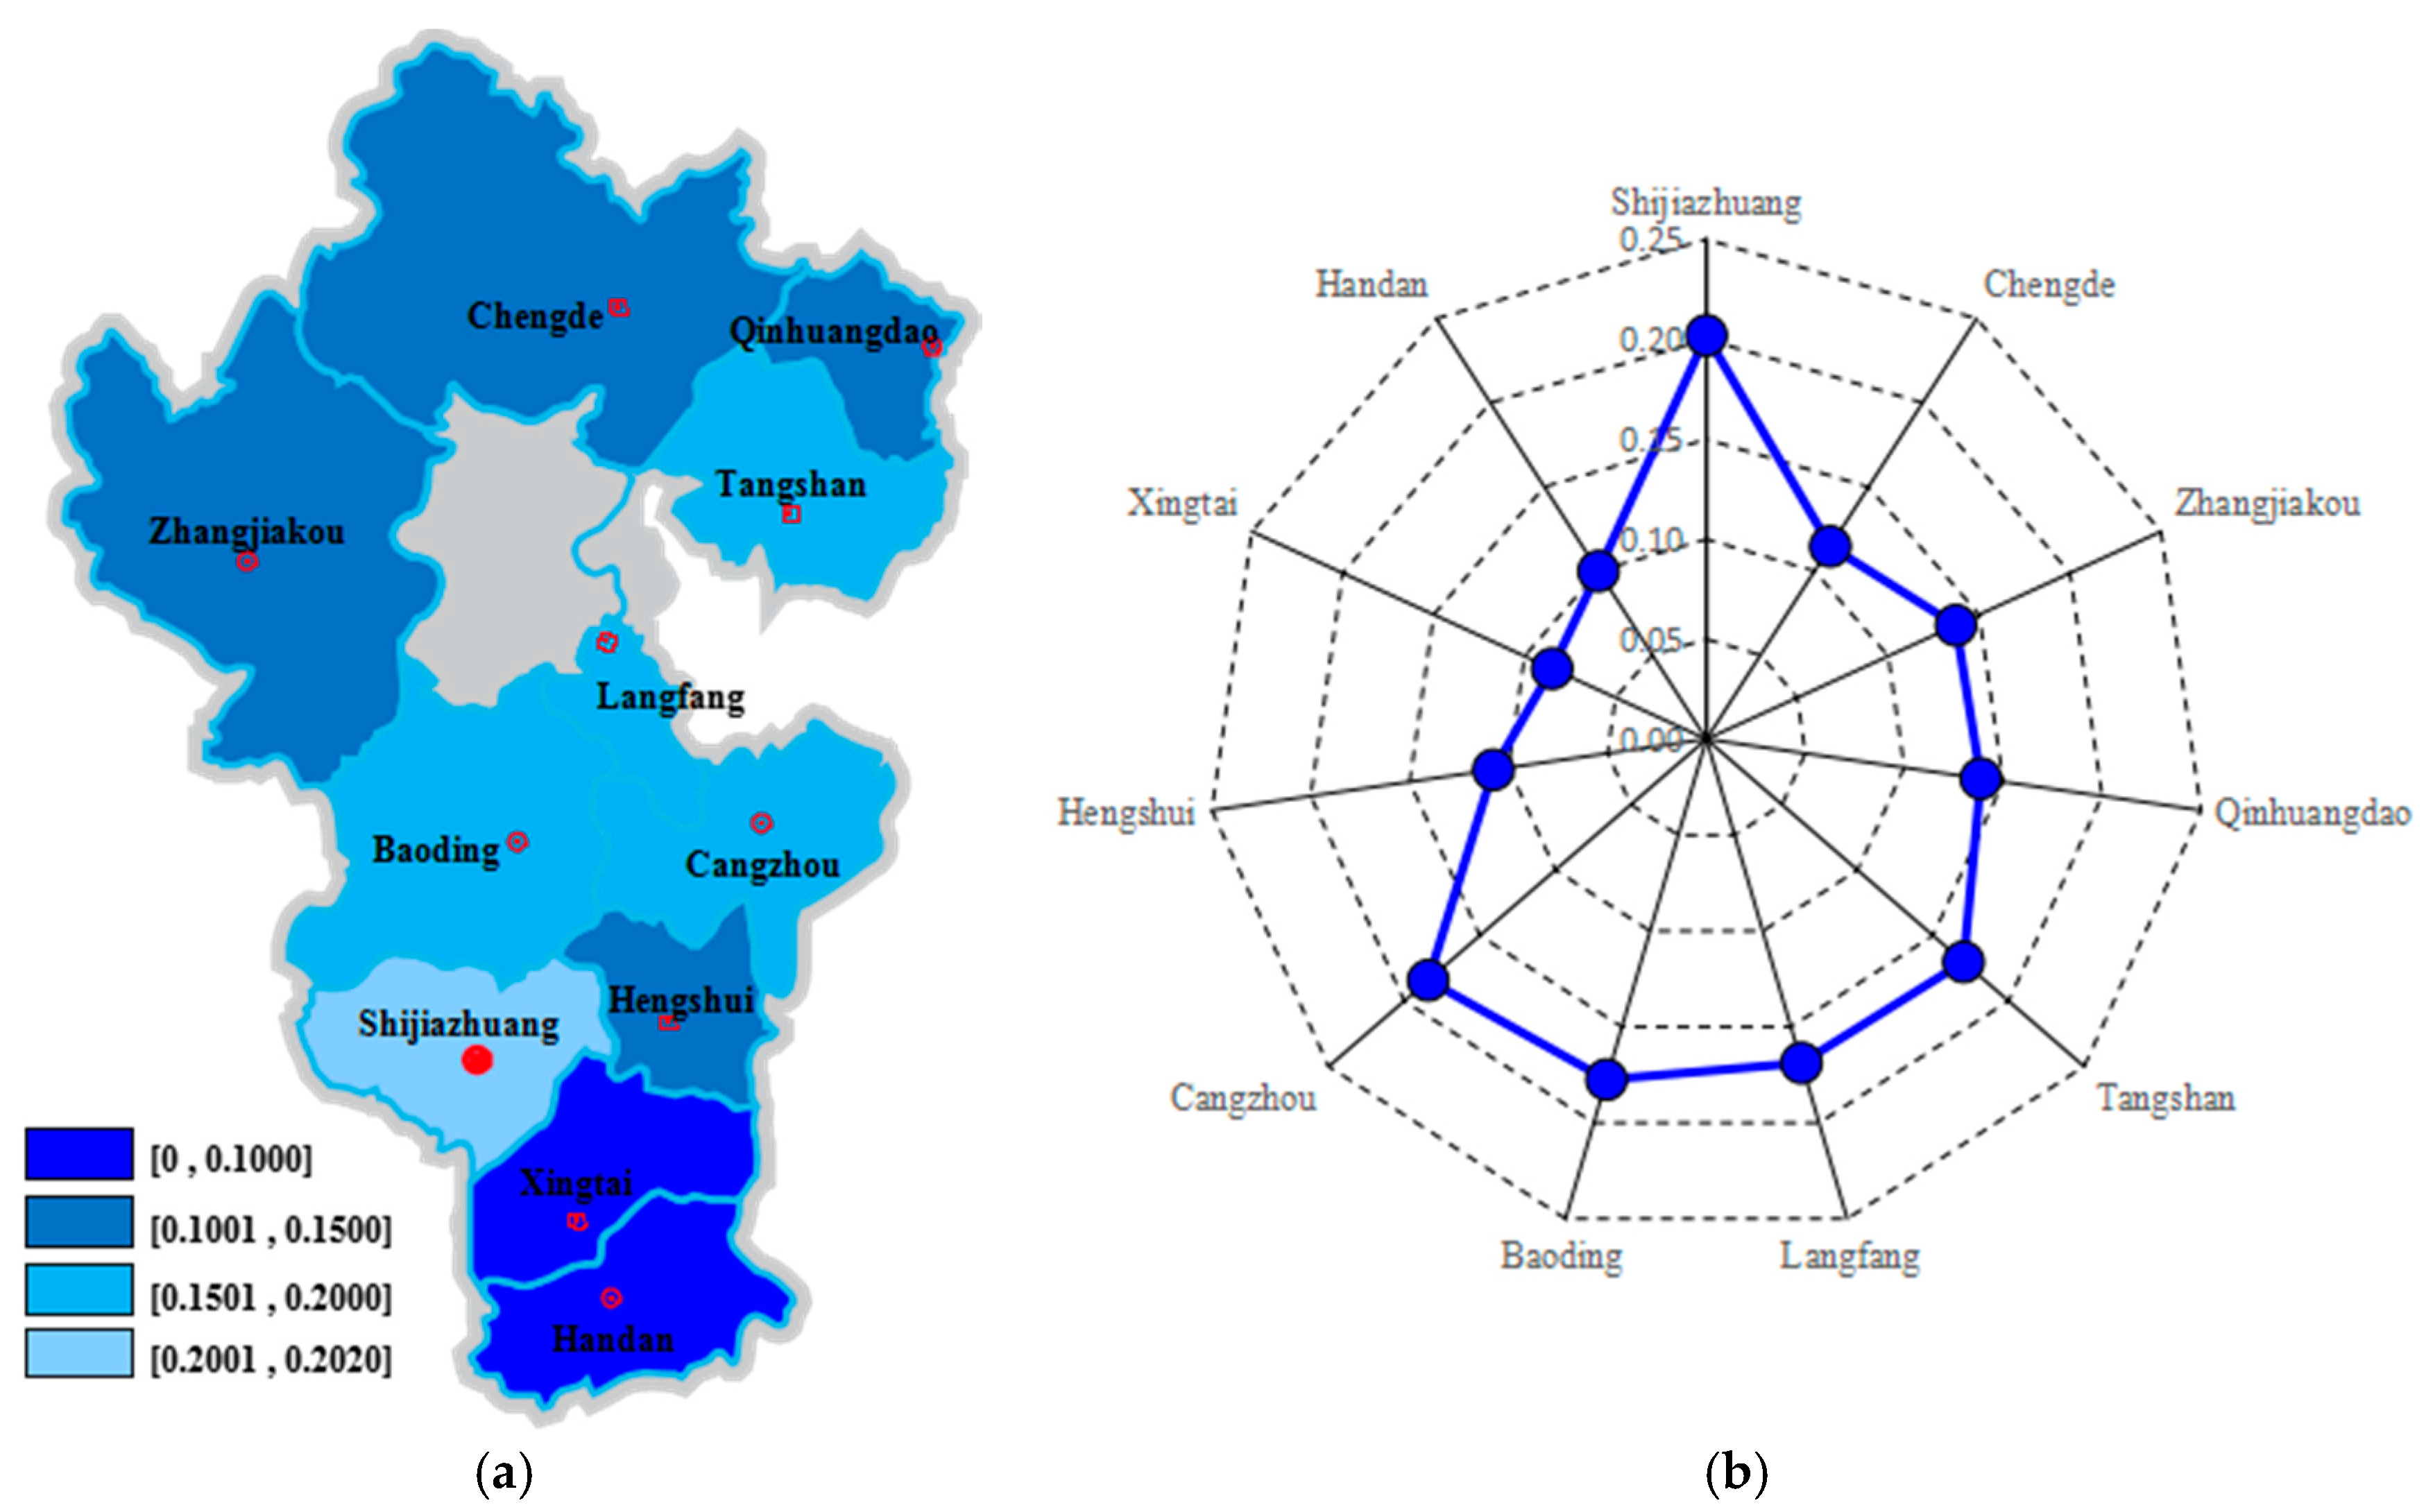
It can be seen from
Figure 9 that the security alarm of ECCE was relatively high in north HB, while it was relatively low in the other areas.
Qinhuangdao (0.6072) belonged to “light warning”. As an excellent tourist city and low-carbon pilot city, whose tourism and port trade revenue accounted for a relatively large proportion of GDP, and it was in a “semi-secure” state in terms of security of ECCE. Shijiazhuang (0.555), Chengde (0.5120), Zhangjiakou (0.5194), Langfang (0.5773), Baoding (0.5943), Cangzhou (0.5386) and Hengshui (0.5093) all belonged to “moderate warning”. Among them, the economic development level of Shijiazhuang, Baoding and Cangzhou, whose pillar industries were textile, automobile manufacturing and petrochemical, was relatively good, while the other cities presented relatively low levels of economic development. This reveals that the security of ECCE is not entirely related to the level of regional economic development, but the comprehensive effect of manifold causes. Tangshan (0.3825), Xingtai (0.3557) and Handan (0.2995) all belonged to “severe warning”. These three cities are all heavy industrial cities and especially in Tangshan and Handan, the heavy industrialization degree is higher. To some extent, it is necessary to enhance regional industrial structure adjustment to promote the security of regional ECCE.
(2) Pressure system index analysis
As shown in
Figure 10, in the pressure system, the security index of the ECCE was relatively high in north HB, while it was relatively low in the central and southern regions.
The pressure system index of Tangshan was 0.0745, which was the lowest in the 11 cities. Tangshan is a typical traditional heavy industry city in HB, whose natural population growth rate was 7.13 per thousand, ranking third in the province; the second industry accounted for 58.7%, ranking first in the province. As a result, its security pressure of the ECCE was relatively large. The pressure system index in Handan and Langfang were 0.1328 and 0.1484 respectively, which were slightly higher than Tangshan. Among them, Handan is also a heavy industrial city with steel smelting as the pillar industry and its natural population growth rate was 7.73 per thousand, ranking first in the province and resulting in its relatively low pressure index system. Langfang, adjacent to Beijing, is the main residence of migrant workers in Beijing, whose population density reached 695.04 people per square kilometer ranking first in the province, leading to a relatively low pressure system index in Langfang. The pressure index in Baoding (0.2265), Cangzhou (0.1598), Shijiazhuang (0.1565), Hengshui (0.2320) and Xingtai (0.1722) was between 0.1501~0.2500, belonging to a relatively high level. Among them, Shijiazhuang is the capital city of HB. Its level of urbanization ranked first in the province, while its population density and the proportion of secondary industry were in the middle level, and the average annual growth rate of carbon emissions was negative, indicating that its energy saving and emission reduction measures have achieved remarkable results. The pressure system index in Zhangjiakou (0.2820), Chengde (0.2534) and Qinhuangdao (0.2668) was the highest. In these three northern cities of HB, the land area is broad, the population is relatively scarce and the urbanization level is also low, taking some pressure off for the security of ECCE.
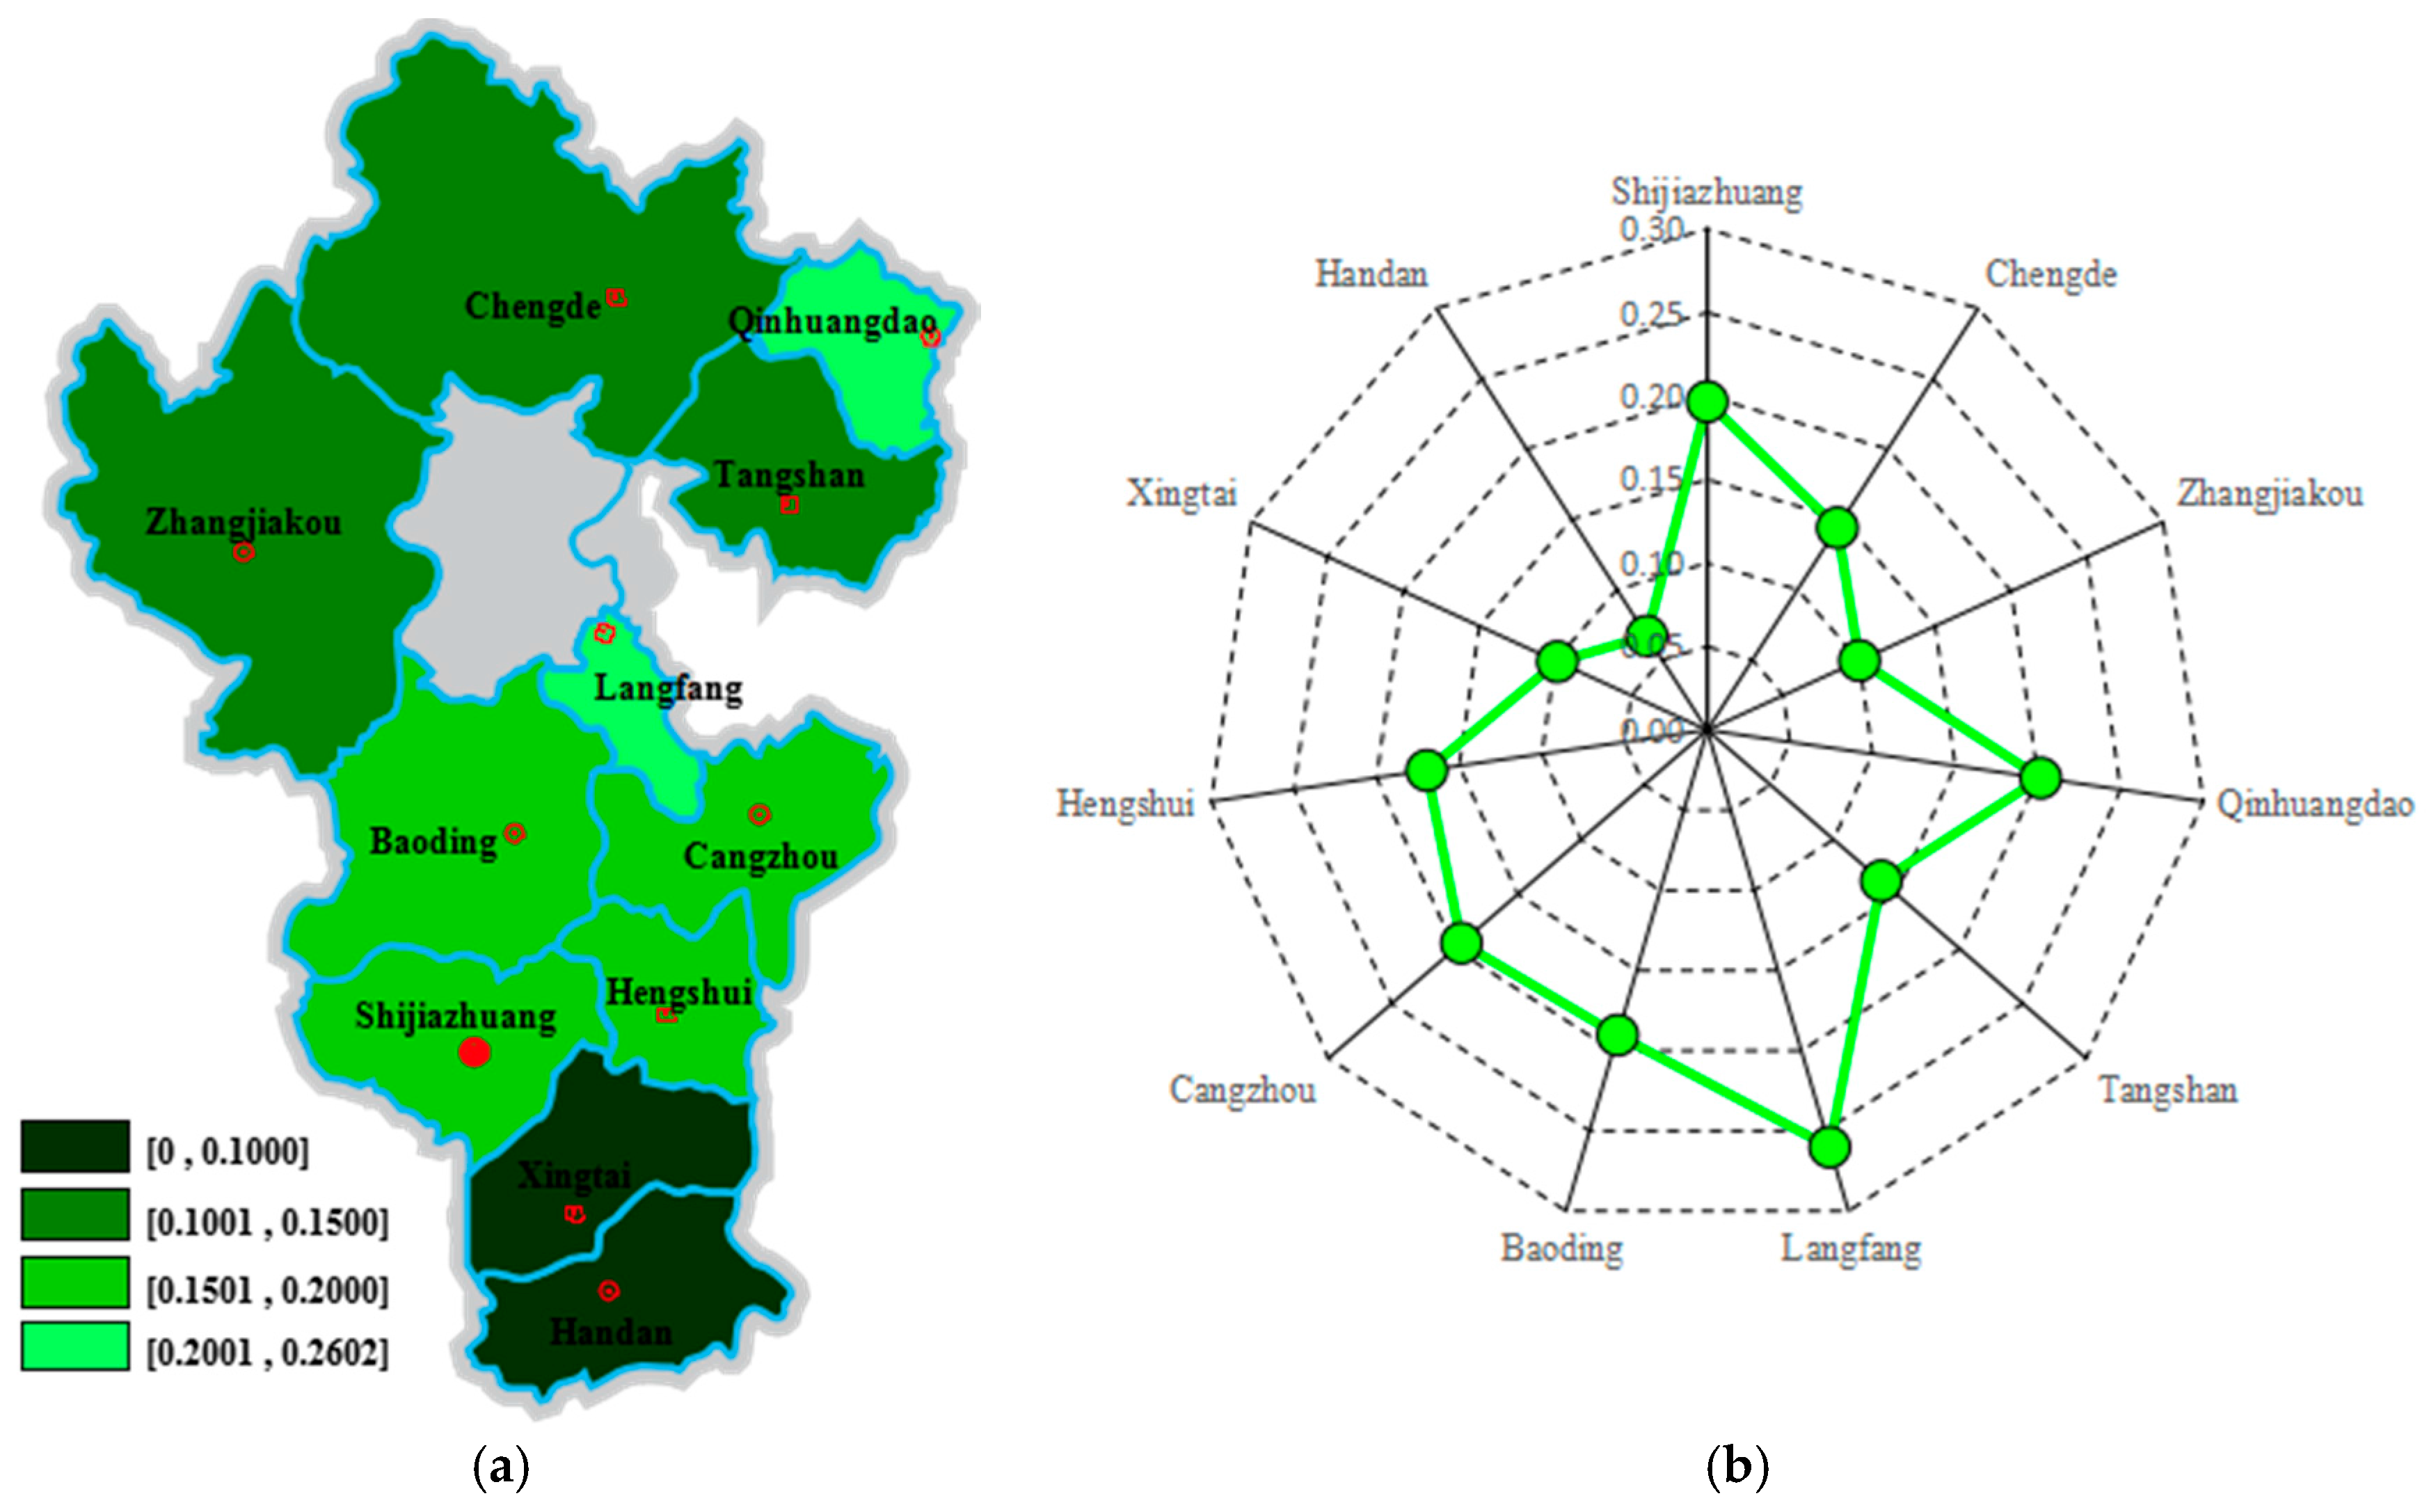
(3) State system index analysis
Figure 11 illustrates that in the state system, the security index of ECCE was relatively high in the central region, was at a moderate level in the northern region and was relatively low in the southern region.
The state system index in Langfang and Qinhuangdao were 0.2602 and 0.2017 respectively, which was rang 0.2001 to 0.2602 and ranked the top two in the province. This was mainly because Langfang and Qinhuangdao's economic level was relatively high, whose urban per capita disposable income and rural per capita pure income were at the forefront of the province, but the energy consumption per unit of GDP and carbon emissions per unit of GDP were in the low level. The state system index in Baoding (0.1903), Cangzhou (0.1947), Shijiazhuang (0.1966), Hengshui (0.1696) was between 0.1501 and 0.2000. Although they were below 0.2000, they were in the upper reaches of HB. The state system index in Zhangjiakou (0.1001), Chengde (0.1440), and Tangshan (0.1378) was between 0.1001 and 0.1500. The forest coverage in Zhangjiakou and Chengde was relatively high, but the relatively low urban per capita disposable income, especially the lower rural per capita pure income affected the improvement of their state system index. On the contrary, Tangshan’s economic development level was high, but the forest coverage, energy consumption per unit of GDP and carbon emissions were not ideal, resulting in a lower score of the state system index. The state system index in Xingtai (0.0986) and Handan (0.0669) were at the lowest level and the two cities are characterized by low forest coverage, income, energy consumption per unit of GDP and carbon emissions with unsatisfactory scores.
(4) Response system index analysis
As shown in
Figure 12, the response system index was relatively high in the central region, was at a moderate level in the northern region and was relatively low in the southern region.
The state system index in Shijiazhuang was 0.2020, which was the highest in the province. This was mainly due to the high level of economic development in Shijiazhuang, the correspondingly high per capita GDP, and more investment in environmental governance. The response system index in Tangshan (0.1702), Langfang (0.1688), Baoding (0.1775), Cangzhou (0.1842) was between 0.1501 and 0.2000. The per capita GDP in Tangshan, Langfang and Hengshui was relatively high, but the per capita carbon emissions and proportion of R&D investment accounted for GDP were not ideal. On the contrary, the per capita GDP level in Baoding was low, yet the proportion of environmental governance investment accounted for GDP and the per capita carbon emissions were ideal, thus making up for its economic disadvantage. The state system index in Zhangjiakou (0.1372), Chengde (0.1146), Qinhuangdao (0.1387) and Hengshui (0.1077) was between 0.1001~0.1500. The state system index in Xingtai (0.0849) and Handan (0.0999) was lowest, which was mainly because the proportion of environmental governance investment accounted for GDP and the proportion of R&D investment accounted for GDP was at a low level with the relatively high per capita carbon emissions.
5. The Security Early Warning Forecasting of ECCE
In this section, KA-BPNN model is utilized to forecast the security early warning of ECCE from 2015 to 2020 in HB. The subsystem indexes of the security of ECCE from 2000 to 2014 in HB are considered as the basic data. Since the amount of the sample data is small, the neural network can not be adequately trained. Thus, the annual data is disassembled into monthly data to expand the amount of sample data. The specific procedures are shown as follows:
(1) Suppose the energy consumption value of each month in annual year as
,
,
, where
represents year and
means month. The proportion of energy consumption in each month can be obtained, and the unified treatment format is shown in Formula (9).
In which, is the proportion coefficient of energy consumption in year , and represents the multiple of proportion coefficient in month , year .
(2) Set the security value of month
in year
as
, and it can be obtained from Formula (10).
where
is the security value of ECCE in year
.
At this point, the annual data has been disassembled into monthly data. Similarly, the monthly data of subsystem can also be calculated based on the above process.
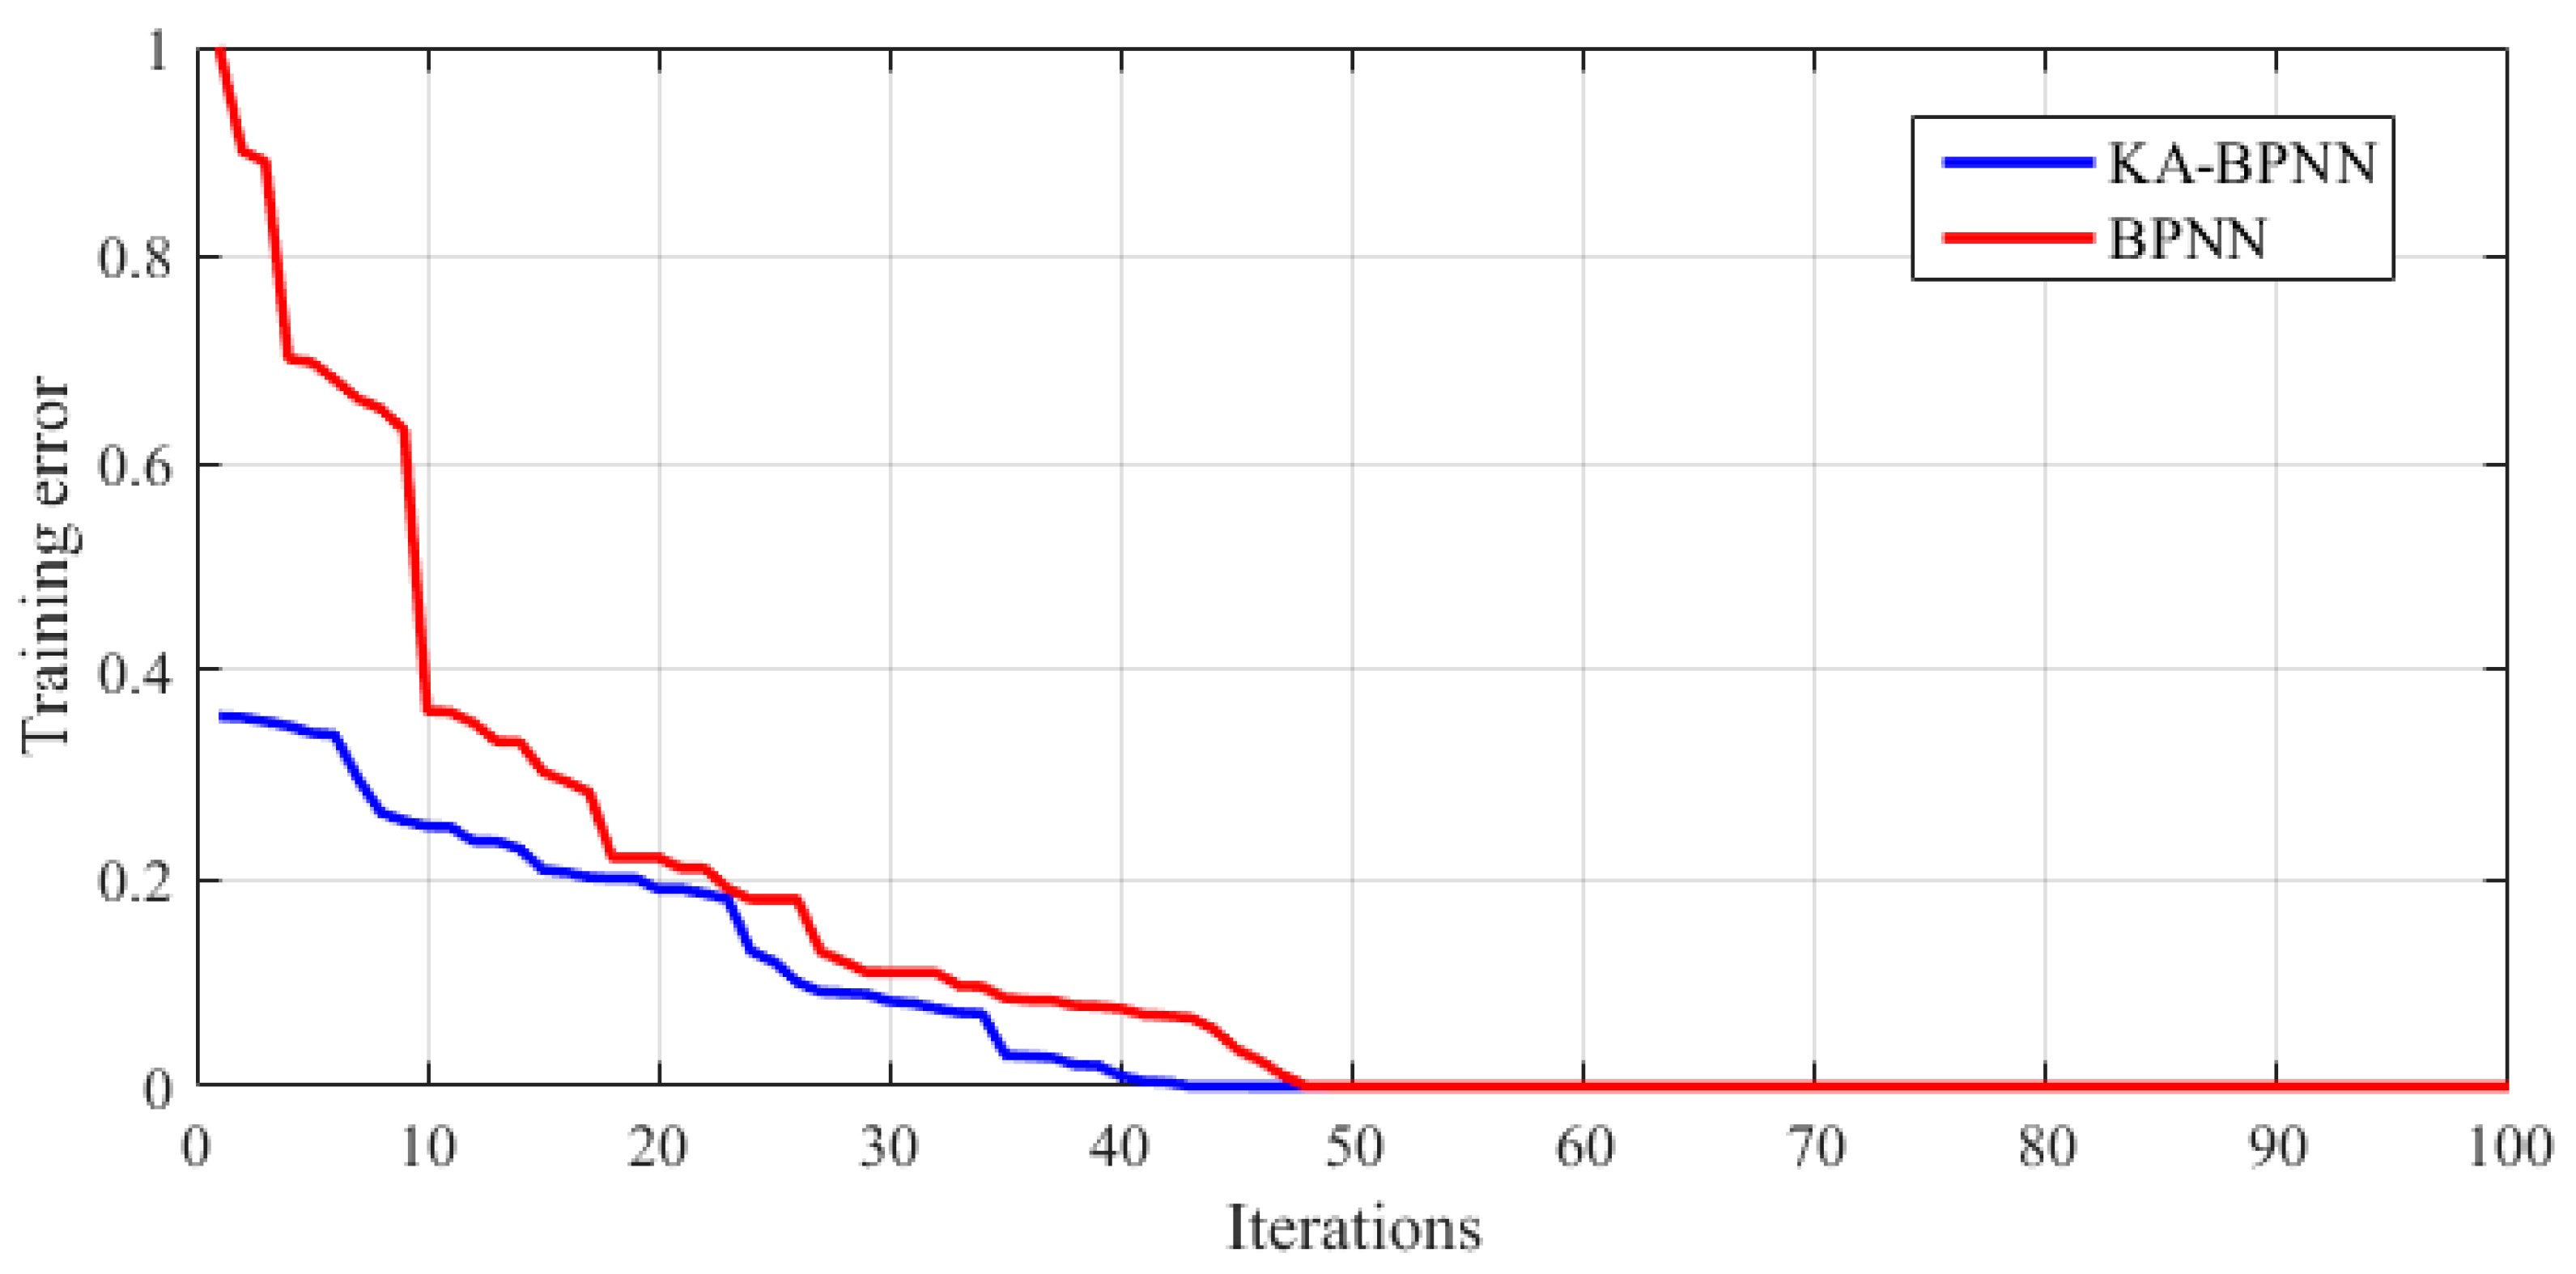
Therefore, we can get 180 monthly samples of 15 years. Then, the data of the first five months and the month label are taken as input samples. The month label is used to strengthen the classification ability of neural network, and its value range is . At present, there are 175 sets of samples in total, of which the first 125 groups are as training samples and the latter 50 groups are as testing samples. In this paper, a classical three-layer mode of BPNN is selected. It is composed of one input layer with 6 inputs, one hidden layer with 3 hidden neurons, and one output layer with one output. Then the max iteration is set to 100, error precision to 0.001 and learning rate to 0.05. In KA, the number of the iteration is 100 and the population size of this paper is 20. In order to fully account for the advantages of the proposed model, the standard BPNN algorithm is compared with the traditional GM (1, 1) algorithm, and the parameter settings are the same.
The first 125 groups of samples are put into the proposed model for training. Then the iterative process of the KA-BPNN model and the standard BPNN model is shown in
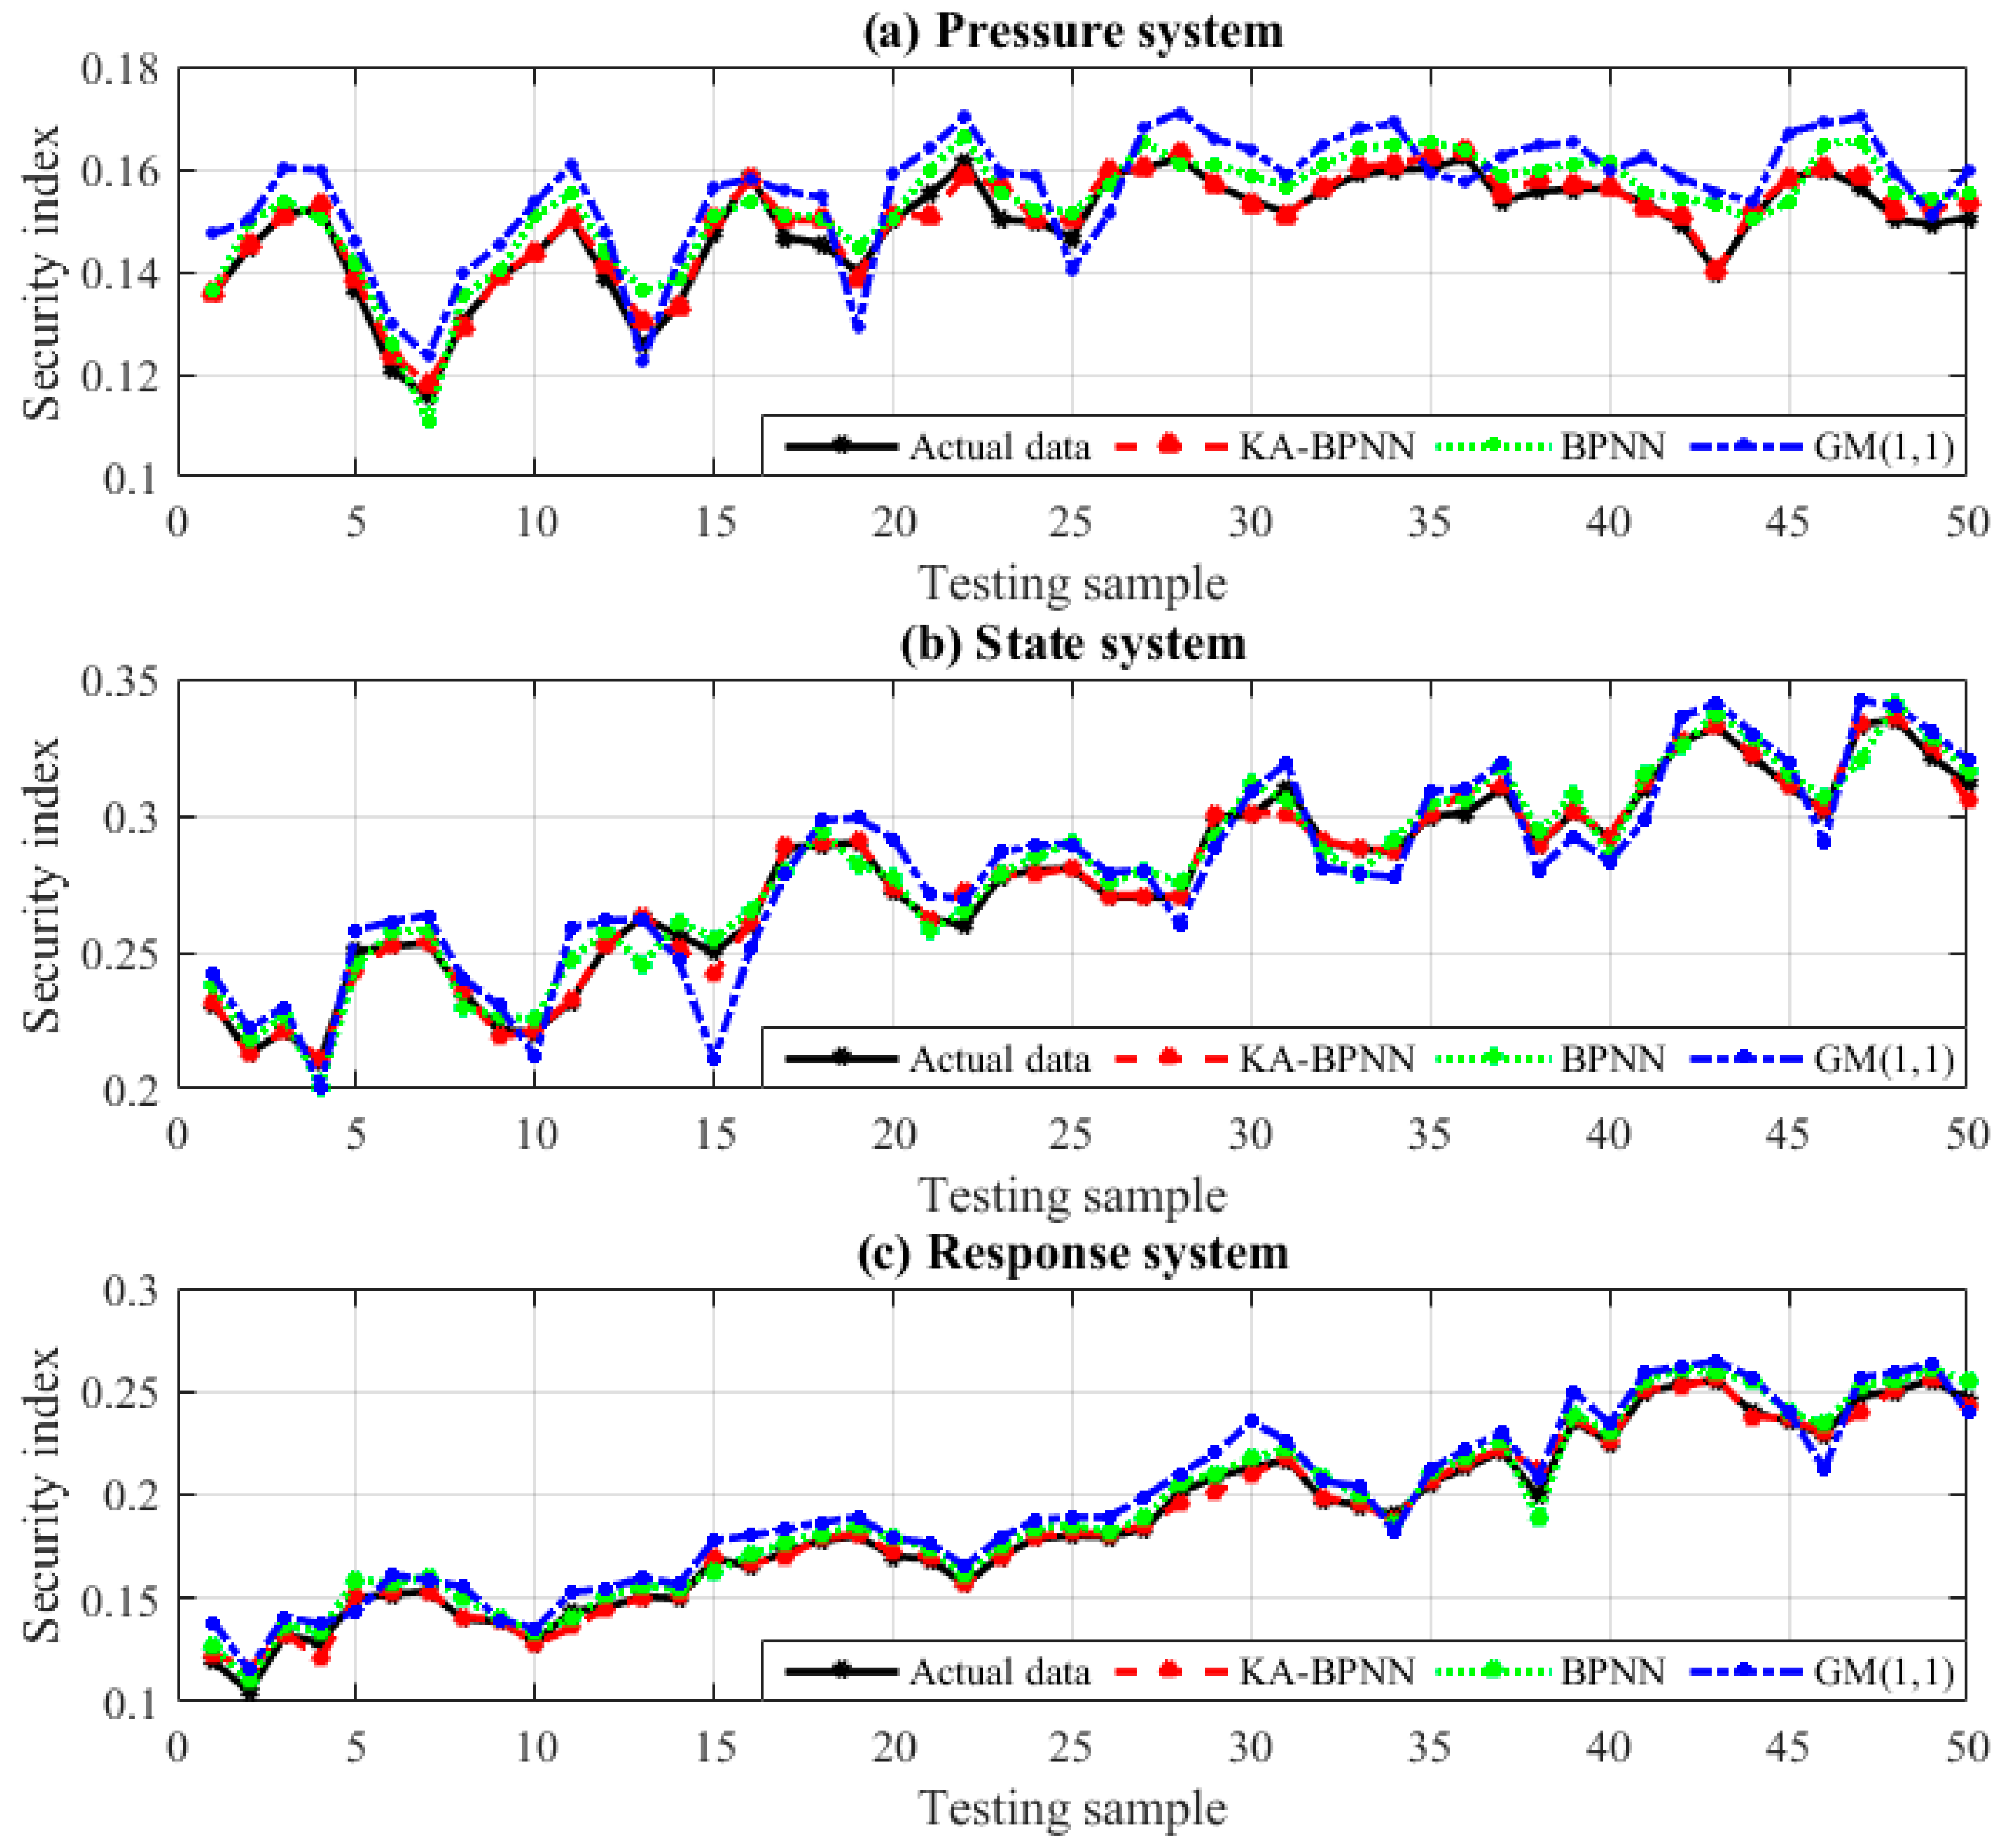
Figure 13, from which it can be seen that the initial training error of the BPNN model after KA optimization is much lower than that of the standard BPNN model, and the proposed model converges after 46 iterations. Finally, the last 50 groups of samples are put into the trained model to test and the testing results are displayed in
Figure 14.
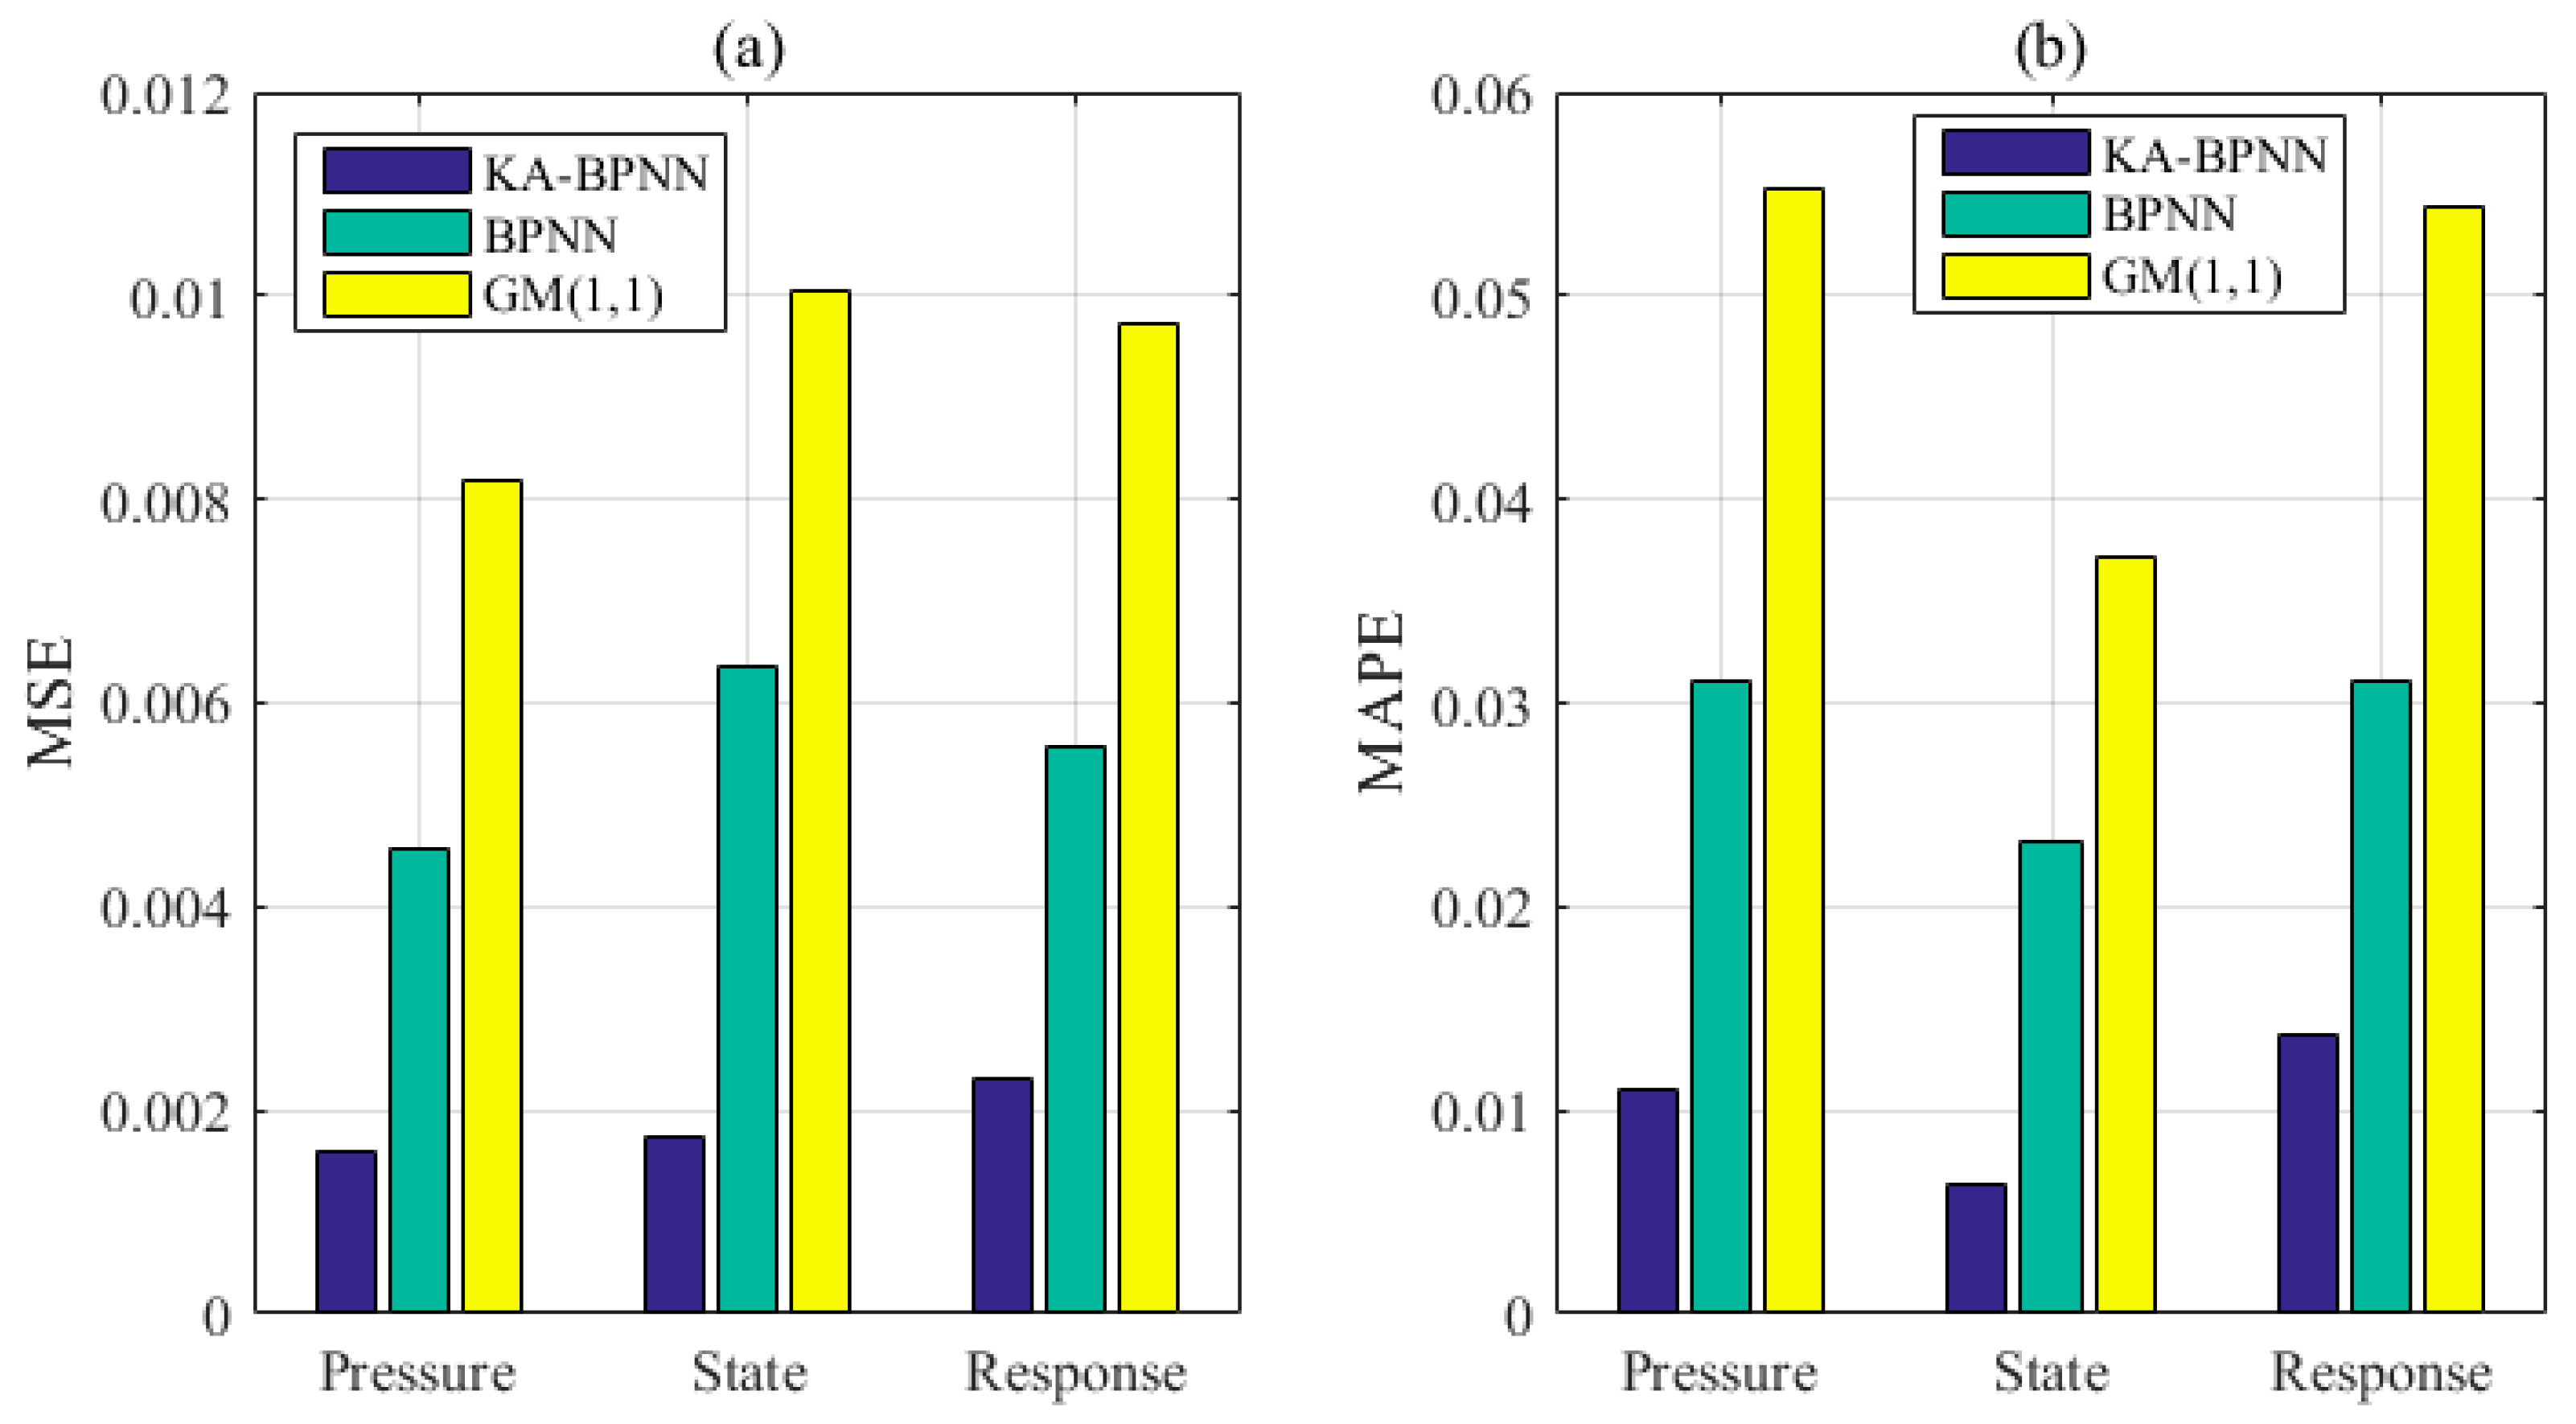
MSE (mean square error) and MAPE (mean absolute percentage error) are selected to evaluate and compare the forecasting performance of those models in this paper. The calculation equation of these two kind of errors are shown as follows:
where
denotes the actual value and
represents the forecasting value.
The errors results are shown in
Figure 15. As can be seen, KA-BPNN has the highest forecasting accuracy for the three subsystem index, followed by the standard BPNN model and the GM (1, 1) model has the worst forecasting effect, which indicates that the model proposed in this paper can accurately and steadily predict the security early warning of ECCE.
According to the above-mentioned trained models, the subsystem index from September 2014 to December, 2014 and the month label are used as input to predict the value of each subsystem index in January 2015, which will be used as the input sample for predicting the value of each subsystem index in February 2015, and so on until the values of the subsystem index in December 2020 are predicted. Then, the annual subsystem indexes are respectively obtained by summing up the whole twelve months’ values.
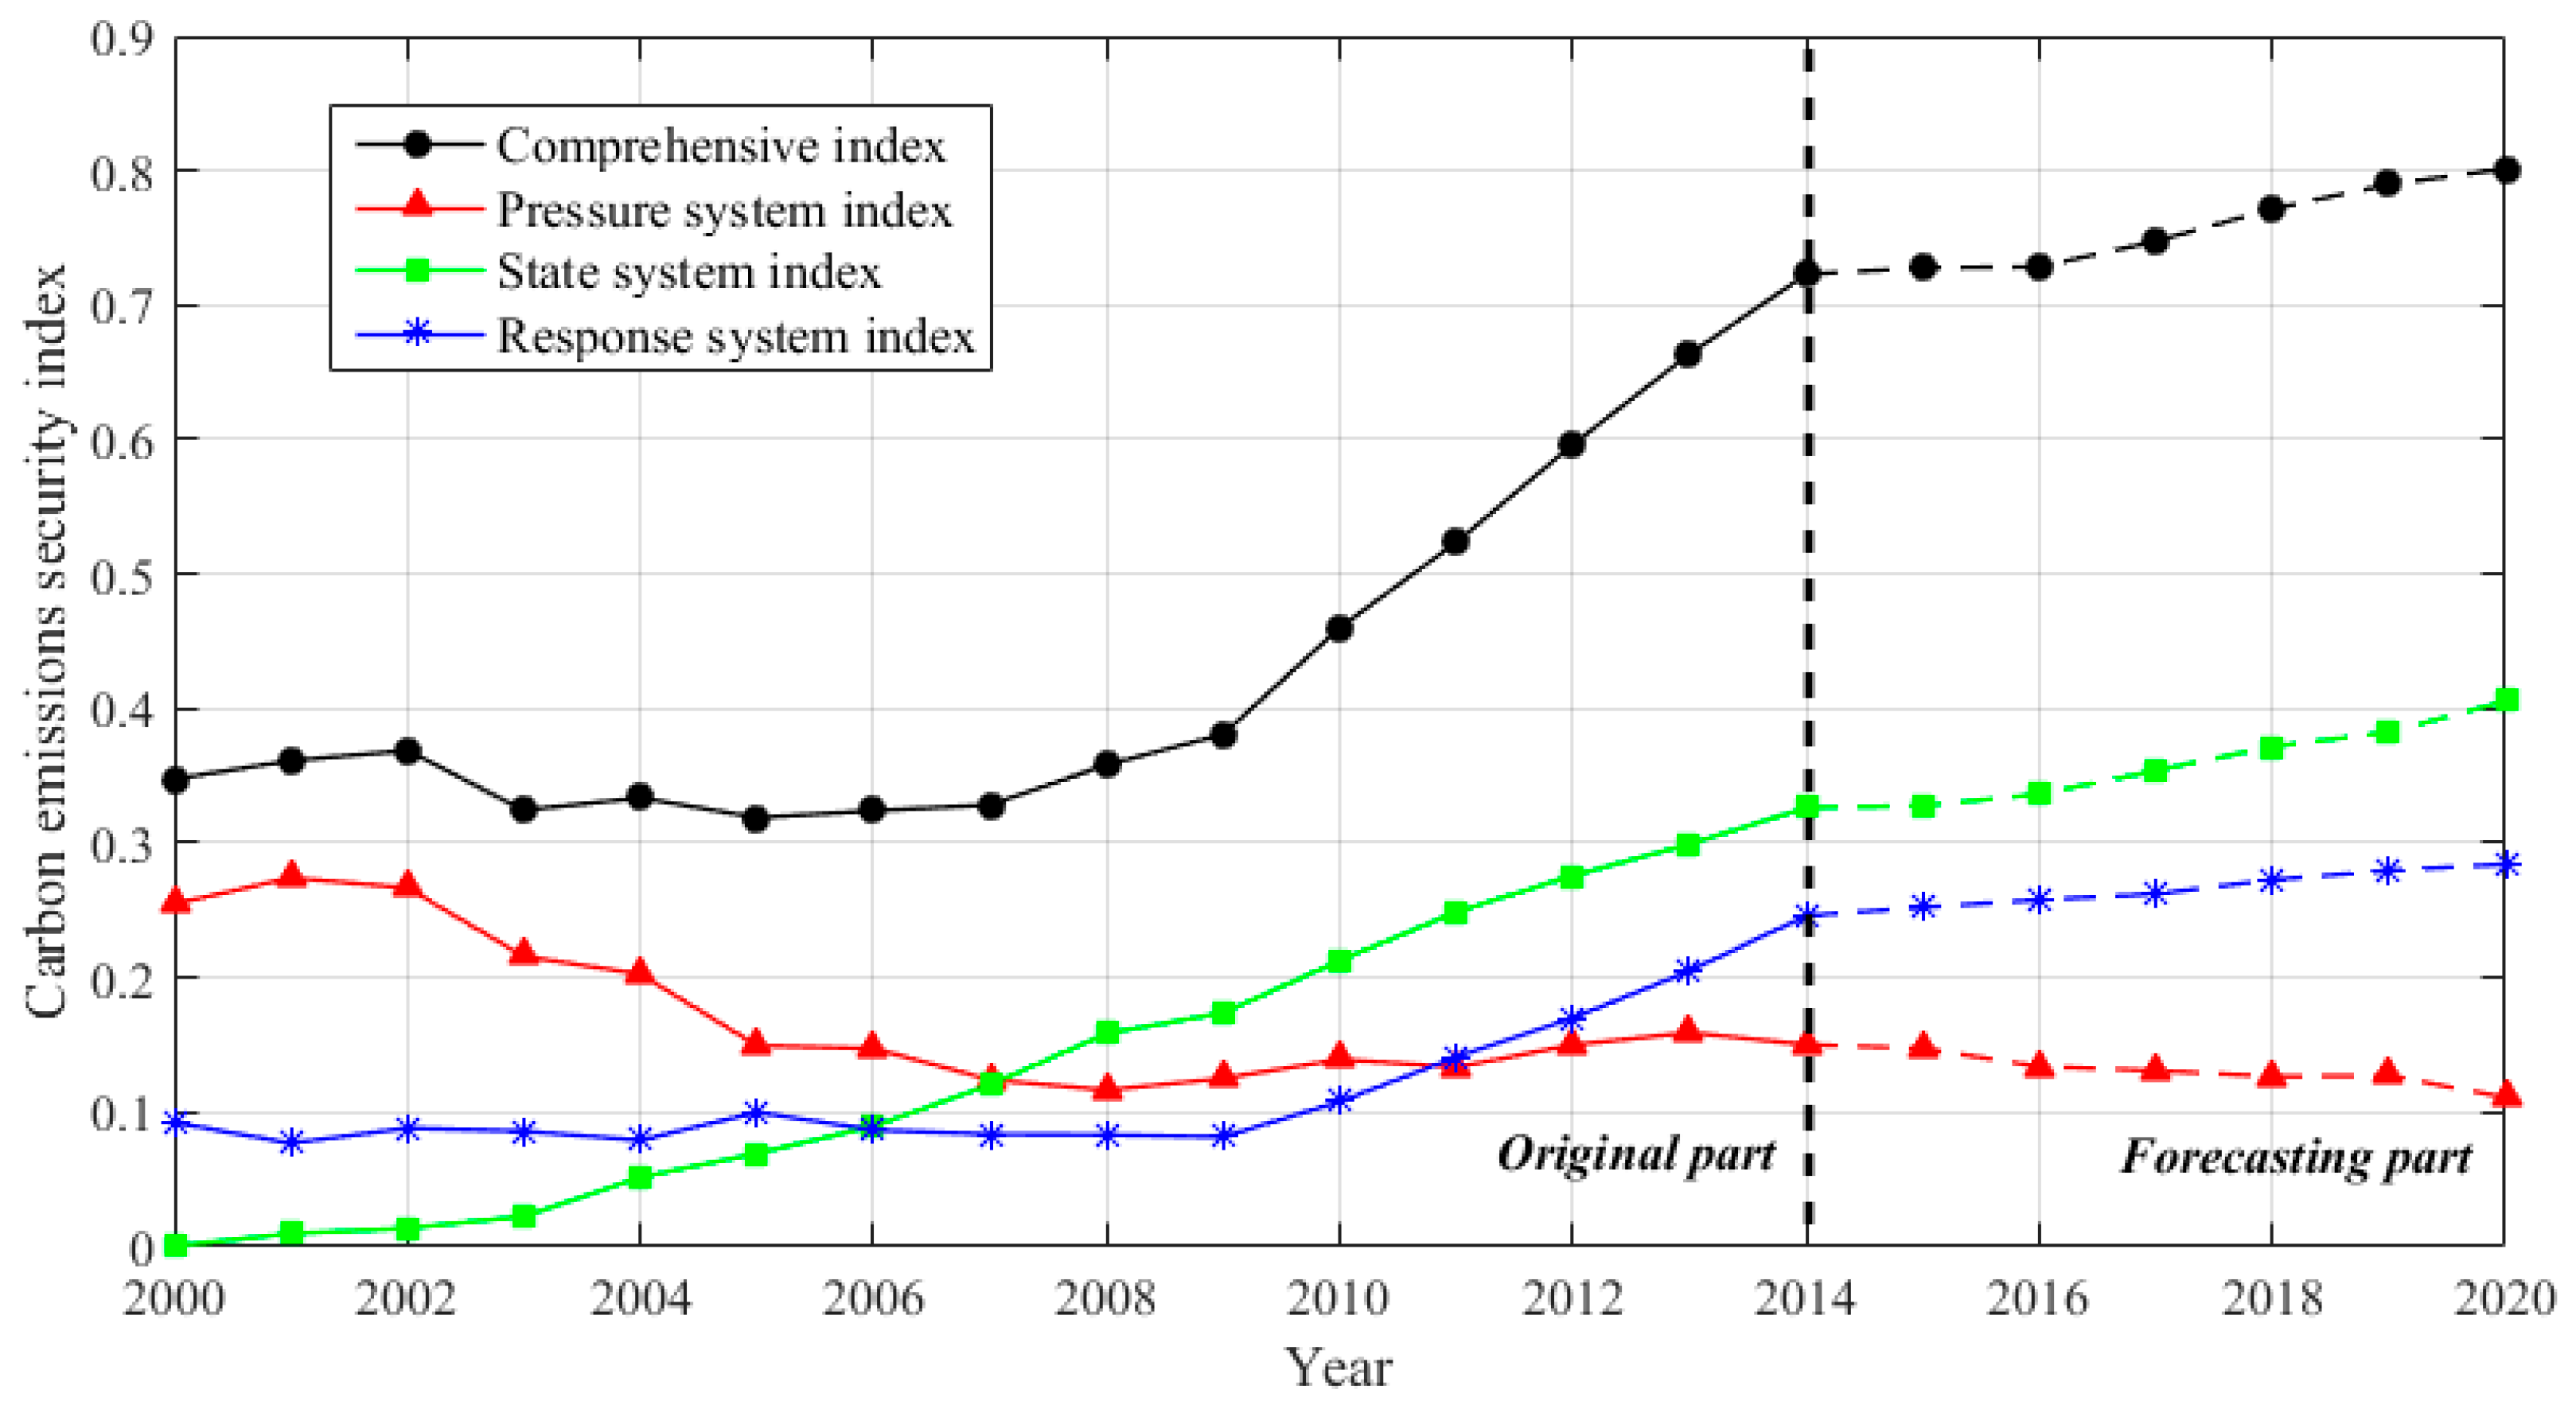
The forecasting values of each subsystem index are added as the predictive values of the comprehensive index, and the forecasting results are revealed in
Table 5 and
Figure 16.
From
Table 5 and
Figure 16, it can be found that the security of ECCE will indicate the state of continued improvement in HB in the next period of time. Its comprehensive index will gradually increase, meanwhile the security level will remain in the state of “Semi-secure” for a long time and the corresponding alarm is still in the state of “Slight warning”, which shows that the security situation of ECCE is still not optimistic. Then detailed analysis are as follows:
(1) Forecasting analysis of pressure system index
The pressure system index of the security of the ECCE decreases from 0.1476 in 2015 to 0.1112 in 2020, which will bring greater pressure on the security of ECCE in HB. From a practical point of view, the natural population growth rate and the city population density will be further increased with the implementation of the “second-child” policy, leading to a new round of population growth pressures and population density pressures in HB. The acceleration of urbanization will also lead to excessive urbanization pressure; industrial structure is difficult to evolve to the late stages of industrialization in the short term and the middle stage of industrialization that takes heavy industrialization as the leading growth feature will bring pressure on industrial structure that the proportion of high energy consuming industries is too high. It is also difficult for coal consumption to have a large degree of improvement in the short term, which will also bring greater pressures for energy consumption; and due to the whole advancement of population growth, urbanization, industrial structure and energy structure pressure, HB will also face greater growth pressures of ECCE. The above factors are also the main reasons for the further decline of the security pressure system index of ECCE in HB from 2015 to 2020.
(2) Forecasting analysis of state system index
The state system index showed an upward trend, which played a certain role in promoting the comprehensive index of security early warning of energy consumption carbon emissions in HB from 2015 to 2020. The forest coverage will be further improved and the economic development will grow at a steady pace, which can promote the steady improvement of living standards of urban and rural residents in HB in the next few years. Meanwhile, energy consumption per unit of GDP and carbon emissions per unit of GDP will also show a downward trend due to the technological progress, making the state system index steadily improve.
(3) Forecasting analysis of response system index
The response system index shows a slow upward trend from 2015 to 2020. Specifically, with the intensification of haze problem, the government will pay more attention to environmental protection, so there will be more funds to invest in the research and development of environmental governance and energy saving technology in HB. Meanwhile, with the upgrading of industrial structure, the use of wind energy, solar energy and other new energy will expand, thereby enhancing the proportion of renewable energy. However, with the increase of ECCE, the per capita carbon emissions will be further improved in HB, thus hindering the improvement of the response system index.
Based on the forecasting results of security early warning of ECCE in HB, the following three policy suggestions can be implemented in the future: (1) The government should speed up the transformation and upgrading of the industrial structure, actively adjust the energy structure, strengthen regional ecological management, increase the carbon sink capacity, build a low-carbon planning system, and strengthen policy support; (2) Enterprises should accelerate low-carbon technological innovation, improve energy efficiency, and promote the development of low-carbon finance; (3) Residents should build a low carbon consumption model to reduce energy consumption.


