Article

Used Cooking Oils in the Biogas Chain: A Technical and Economic Assessment

Department of Agricultural and Food Sciences, University of Bologna, Viale Giuseppe Fanin 50, 40127 Bologna, Italy
*
Author to whom correspondence should be addressed.
Energies 2017, 10(2), 192; https://doi.org/10.3390/en10020192
Submission received: 29 November 2016 / Revised: 23 January 2017 / Accepted: 24 January 2017 / Published: 9 February 2017
(This article belongs to the Collection Bioenergy and Biofuel)

Abstract

:
The current concerns on global energy security, climate change, and environmental pollution represent some of the major elements of the growing interest on renewable energy. In this framework agro-food energy systems are at the center of a twofold debate: on the one hand they represent a key option for energy production while on the other their sustainability is threatened by the expansion of the bioenergy market that could lead to negative social and environmental consequences. The aim of this work is to evaluate—through a case study—the technical and economic feasibility of the replacement of energy crops (ECs) with used cooking oil (UCO) in an anaerobic digestion (AD) full-scale plant. At this purpose, a full-scale plant performing AD was monitored for two years. Three scenarios were developed and compared to evaluate the impacts and the potential benefits in terms of land saving in case of a substitution of ECs with UCO. Results highlighted a reduction of land use of over 50% if UCO is introduced in co-digestion with ECs. The lack of an appropriate legislative framework limits the utilization of used cooking oils (UCOs) in AD with a consequently missed opportunity for biogas owners that could find an important alternative in UCO.

1. Introduction

The global energy demand is growing under the pressure of the current context of increasing food demand, diffusion of diets based on products with a high density of energy (livestock products, vegetable oils, sugar), globalization of food production and trade, growing intensity of agricultural practices, competition on land use, exacerbation of global warming, and environmental concerns [1,2,3].
These factors are leading national governments and the international community to increase the support and the investments to stimulate a reduction from the dependency on fossil fuels and a transition to a low-carbon society [4,5,6]. These commitments represent key elements for several international protocols, such as the Kyoto Protocol [7] and the European Climate-Energy Package “202020” [8,9], that aim at regulating emissions, cutting waste, and reducing the use of energy.
Agriculture represents a focus sector since it is, at the same time, an important energy consumer and bioenergy producer [10]. Dedicated crops and agricultural byproducts have been used to generate energy through thermo-chemical conversion processes, such as combustion, gasification, and pyrolysis [11], or bio-chemical conversion, such as fermentation and anaerobic digestion (AD) [12]. This work focuses on AD due to its rapid development in several EU (European Union) countries—including Italy—as a consequence of high renewable energy subsidies [13].
Along with the general recognition of the potential of biogas production, there is a growing debate on its sustainability due its impact on land use [14]. Land use change potentially leads to a variety of direct and indirect effects in agrarian systems. Direct effects include environmental degradation and the loss of biodiversity. Indirect effects comprise those related to economic changes as rising rents for land leases and growing commodity prices, and to social changes caused by the violation of land rights [15,16].
Within this context, the identification of solutions to ensure the sustainability of biogas production represents a crucial step to exploit the full potential of AD. An option is represented by the use of dedicated energy crops (ECs) associated with waste organic materials, by-products, and residues from agricultural and agro-industrial production [17] both in AD and in co-digestion processes.
Such practices could mitigate the environmental consequences of the production of ECs and increase the capacity of energy generation in rural areas.
Literature shows high energy efficiency values in the co-digestion of barley, molasses, industrial bakery products, and sludge crushers [18], pomace, tomato puree by-products [19], tomato skin, seeds and whey [20], artichokes [21], and fruit products, such as pineapple skin and pulp [22]. Additional by-products are derived from olive oil extraction as skin pieces, pulp, stone, and kernel olive [23].
As any agricultural product, by-products are also characterized by seasonality and yield fluctuations so that planning tools and supply analysis are particularly important [24].
As kitchen waste, used cooking oil (UCO) is not affected by seasonality or yield fluctuations as other by-products and is characterized by a relatively high availability: in Europe 5 kg per person corresponds to an overall potential of 2.5 × 10⁶ Mg per year [25].
Before the entry into force of the European Commission Regulation 1774/2002 [26], which outlines the health rules concerning animal by-products not intended for human consumption, UCO was reused mainly as animal feed. With the introduction of this limitation, the attention on vegetable waste oils and its sub-products (glycerin and raw-biodiesel) increased significantly. Additionally, this attention was also raised by the potential profit opportunities generated by the exploitation of UCO [8,27] and the application of the Decree 152 of 3 April 2006 [28], which introduces the obligation for its collection.
The 22 × 106 Mg of biodiesel produced with vegetable oil in the EU-27 in 2011 stimulated the development of a number of projects aimed to improve UCO collection [29,30,31,32]. Additionally, several studies were carried out to assess its potential utilization in the biodiesel industry [33,34,35] and the valorization of its sludge by co-digestion with swine manure [36]. Positive results have been obtained also with the anaerobic digestion of glycerol and co-digestion of glycerol and pig manure underlying its versatility [37]. The 1.4 × 10⁶ Mg produced annually in Italy are, in large part, collected and reused from C.O.N.O.E. (Italian National Consortium for Mandatory Collection and Processing of Waste Vegetable and Animal Oils and Fat) as vegetable waste oil [38]. Other uses are limited by the national and European regulatory framework that is currently prohibiting the use of UCO in the biogas sector.
The aim of this work is to assess the technical and economic feasibility of the substitution of energy crops with UCO in AD, with particular emphasis on the potential implications on land use.

2. Materials and Methods

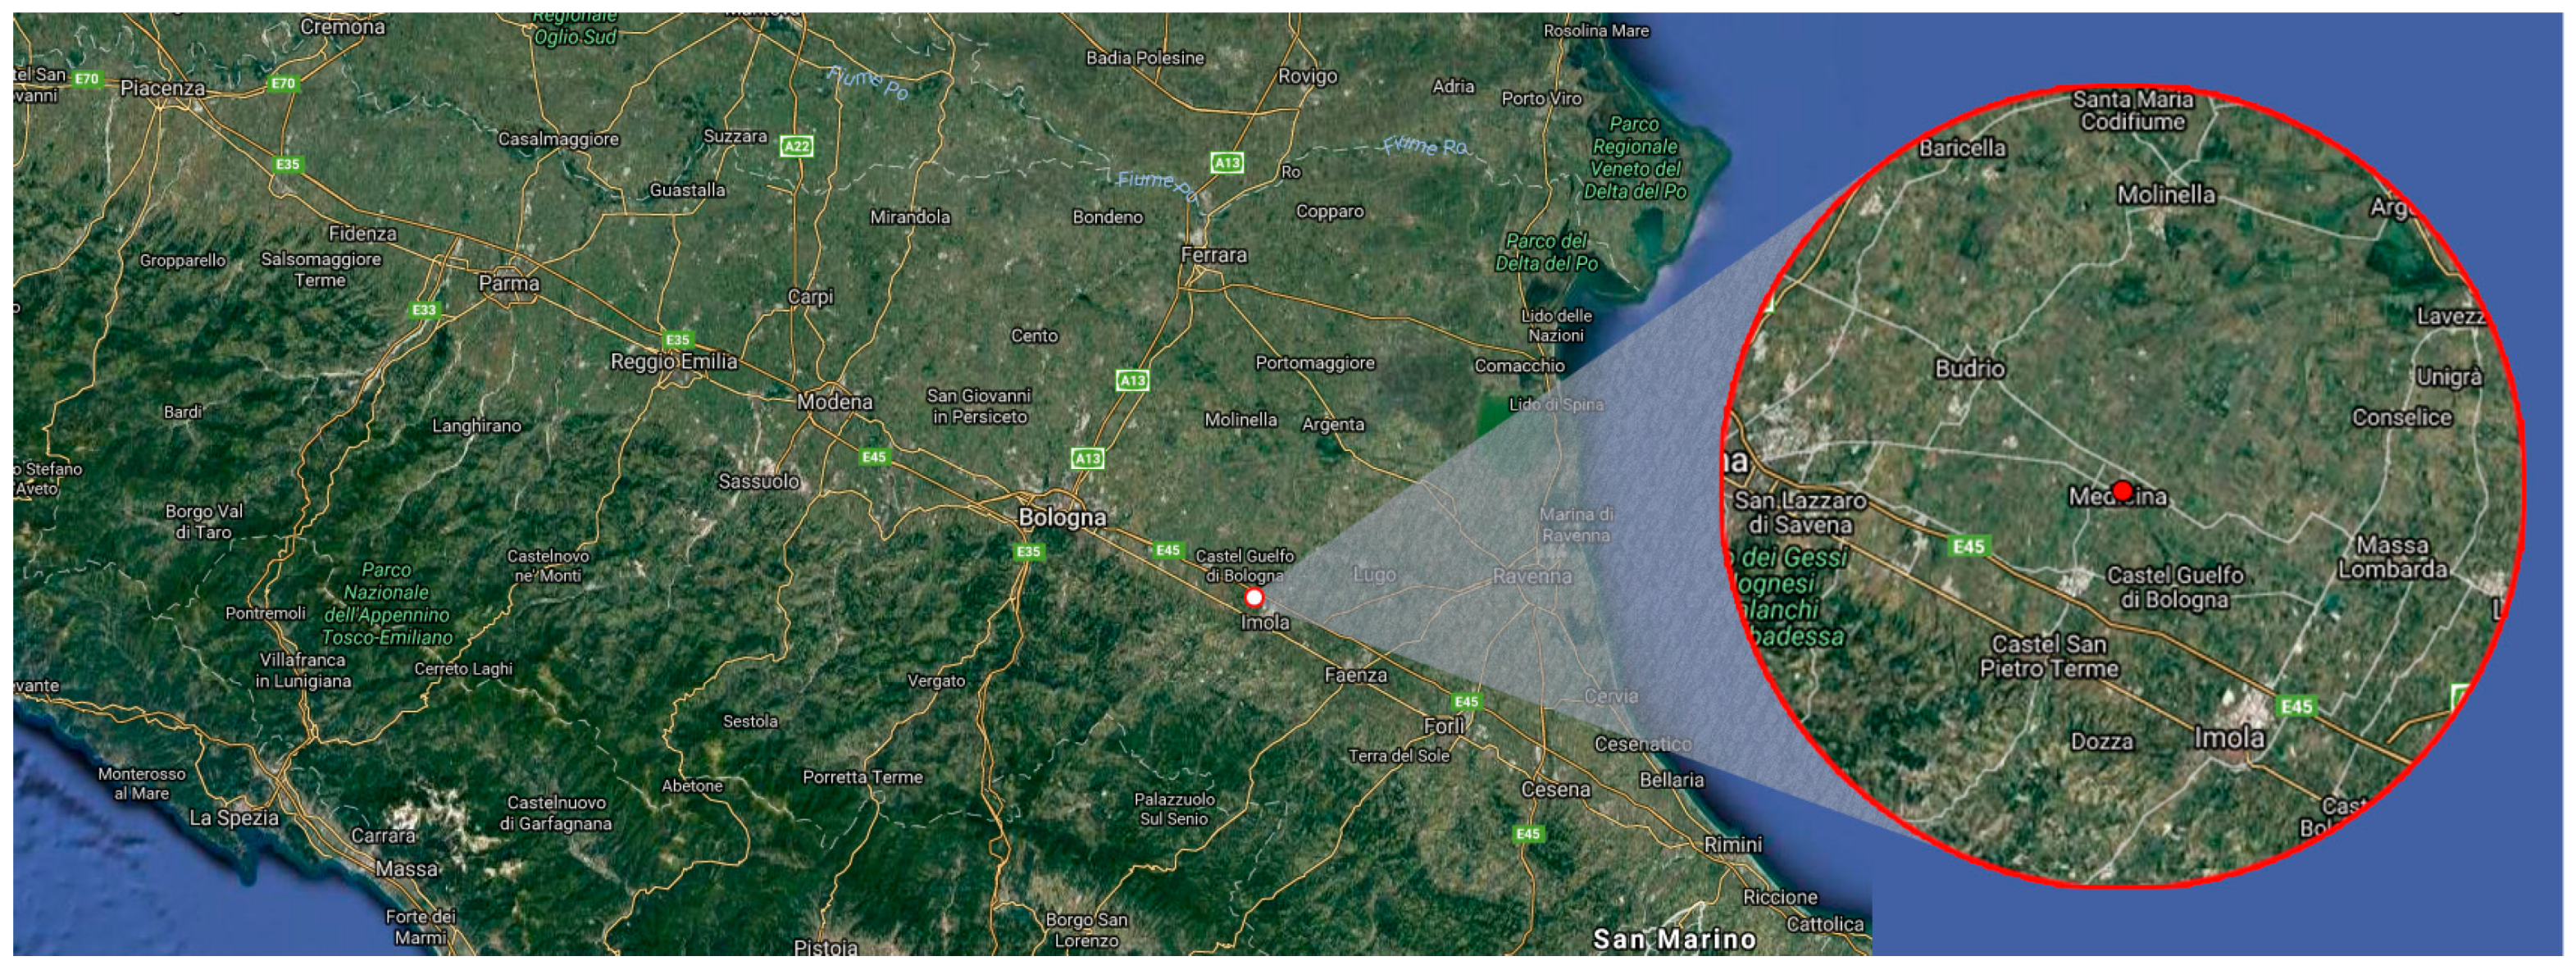
2.1. Case Study Area

The case study area is represented by the Emilia-Romagna region, which is located in the southern part of the Pianura Padana and is characterized by a highly developed agricultural sector [39] where the introduction of the feed-in tariff at the beginning of 2009 stimulated a rapid diffusion of biogas with consequent implications on biomass availability and land rental rates [40].
Six of Emilia Romagna’s biogas plants out of 24 are located in the municipality of Medicina that, for this reason, has been identified as the center of the study area.
The identification of the case study area was then based on the principle of short chain, which authorizes biomass-based biogas plants to procure within an area of 35 km [41] to facilitate the potential development of local energy districts. Such a mileage restriction allows significant benefits for reducing the emissions and the costs of biomass transportation.
Following this approach UCO is collected in a circle that has 50 km diameter, with Medicina at its center, and includes other 17 small municipalities plus the city of Bologna (Figure 1).
Five of the biogas plants of Medicina operates with a mix of agricultural by-products and dedicated energy crops, while the remaining one has a mixed feeding system that includes animal waste. The research was carried out in one of the plants operating with agricultural by-products and dedicated energy crops.

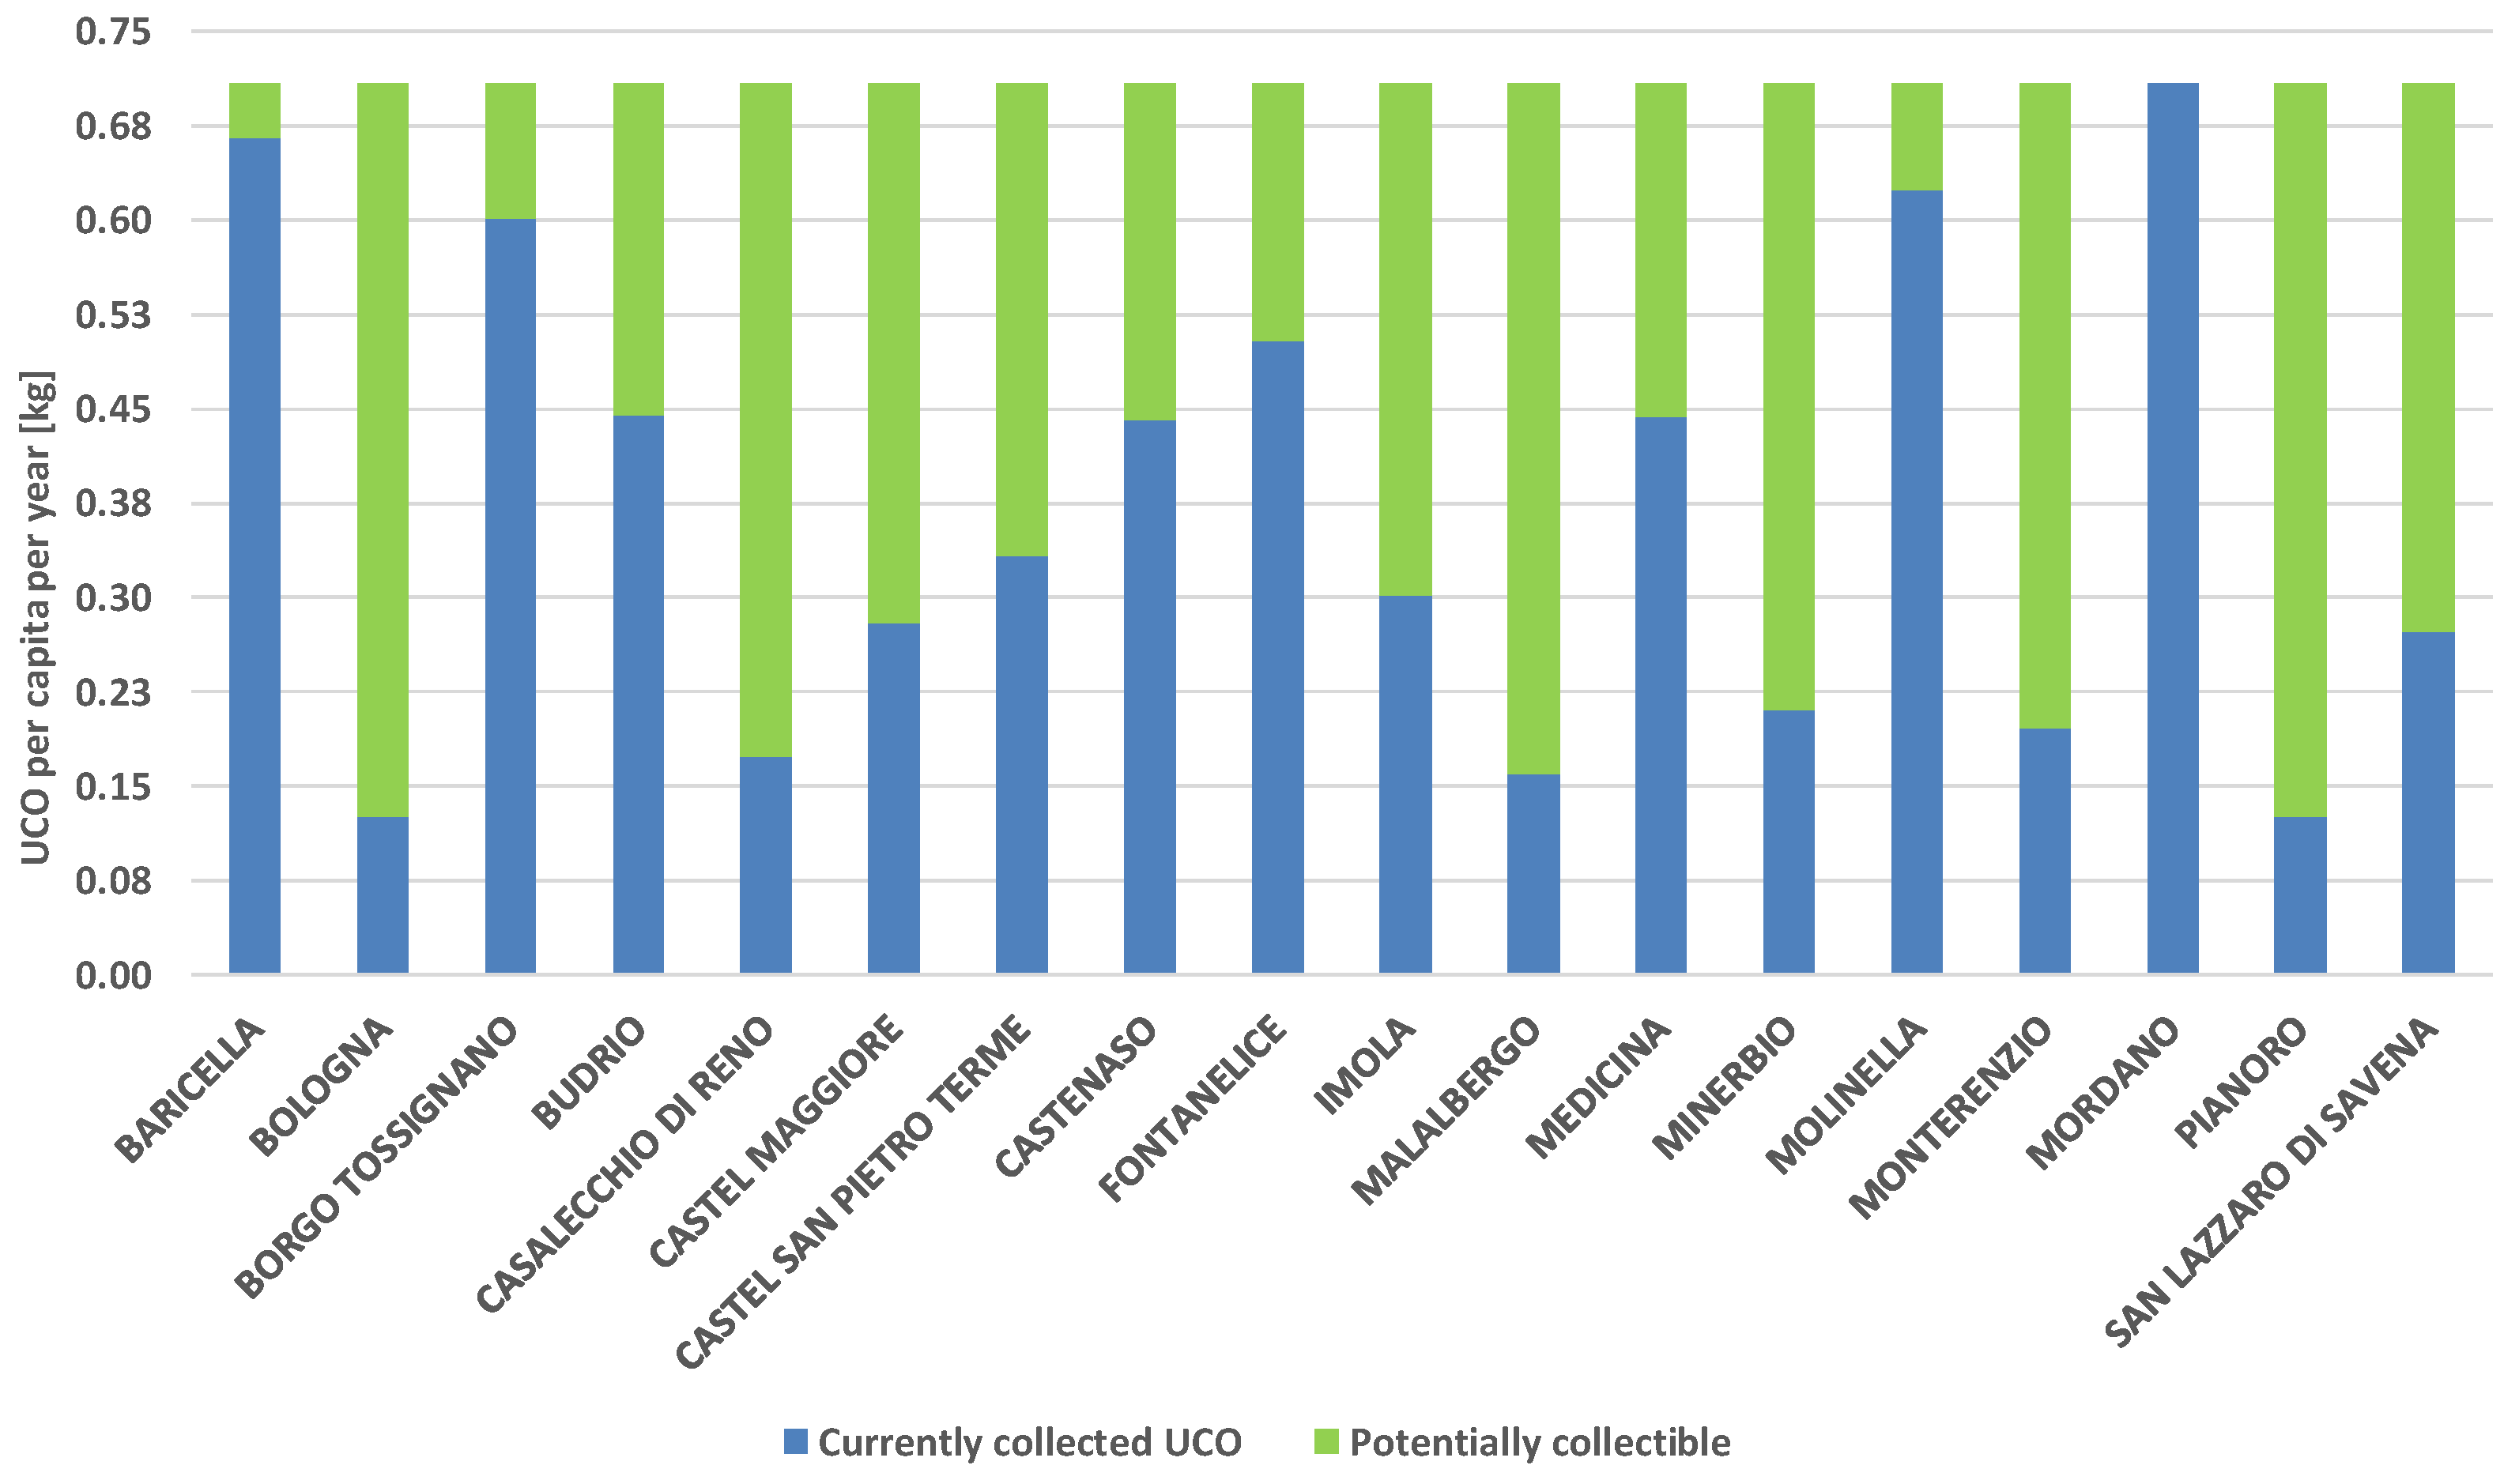
2.2. Data Gathering and Used Cooking Oil Collection

UCO quantification was based on a two-step methodology. Firstly, questionnaires were sent to A.R.P.A (Regional Agency for Prevention and the Environment) and C.O.N.O.E. to quantify the amount of UCO at local level (UCO is collected by the multi-utility H.E.R.A. (Energy Resource Environment Holdings), with the exception of the municipality of Castel Maggiore, where the collection is managed by Geovest Environmental Services.), identify the trends over time and collect market price data.
With the second step the information retrieved with the questionnaires were integrated and cross-checked with those available on the ISTAT (National Statistics Institute) databases.

2.3. Biogas Plant Description

The biogas installation analyzed in this study is located 8 km outside the town of Medicina. The plant has a potential power of 999 kW and started its operations in 2012 taking full advantage of the comprehensive tariff (incentive + electric energy produced) of 0.28 €/kWh that allows paying off the investment in a particularly short time (the legislative decree “Sviluppo” (Development) 1141 (approved on 1 July 2009) ensure a comprehensive tariff of 0.28 €/kWh for the plants entering into operation in 2012 and with a potential power of less than 1 MW). AD is a wet process with an average percentage of feed dry matter (DM) lower than 10%. It takes place in a mesophilic digester with a hydraulic retention time (HRT) ranging between 55 and 65 days, a temperature range of 44–47 °C, and a reuse of 30% of the energy produced by the combined heat and power (CHP).
The digester is composed of two reactors of 3000 m3 each where the DM is mixed by stirrer blades. The CHP is based on an internal combustion engine modified by natural gas with an electric power of 1063 kW and an electrical efficiency of 40.1%. The volumetric load of about 37 Mg·day−1 of the total mass (wet basis) is charged without any pretreatment of the biomass.

2.4. Scenario Analysis

To analyze the substitution of ECs with UCO three different scenarios were developed: baseline (S1), intermediate (S2), and best case (S3).

2.4.1. Scenario S1: Baseline

The baseline scenario was developed along the real diet of the biogas plant for the 2013–2014 biennium. The daily load of each biomass qx,i [Mg] was averaged over a week to obtain the average daily load Qx [Mg] where:
Q x = i = 0 7 q x , i 7
The load was calculated in terms of corn silage equivalent tons (CSET) to allow a comparison among the energy potential of the different biomass utilized as feeding material and divided for simplicity into corn and byproducts.
CSET was calculated as the ratio between the biochemical methane potential of corn (BMPc) assumed equal to 95 Nm3CH4·Mg−1 wet basis (considering a 30% of volatile solids on the load) and the biochemical methane potential of each biomass used in co-digestion (BMPx) multiplied for the load of each biomass Qx [42,43,44]. The use of the BMP [Nm3CH4·Mg−1] value as references allows the identification of the most appropriate feedstock to achieve the optimum biogas yield.
CSET was defined as:
CSET [ Mg ] = BMP c BMP x Q x
A cumulative regression of the used corn was introduced to ensure a better data analysis. The 2013–2014 biennium has been divided in periods of four months to obtain six different trends, three per each year. The linear functions show the highest weekly energy corn consumption.
The amount of hectares needed to produce the quantity of corn required to feed the plant (LU) was calculated after the estimation of the total load plant diet per year (as average of the two years), in terms of corn (CTOT,c) and biomass (CTOT,b),:
L U [ ha year ] = C T O T , c A A Y
where AAY Mg·ha−1 represents the corn average annual yield estimated in 55 Mg·ha−1. The same corn yield was also maintained for S2 and S3.

2.4.2. Scenario S2: Intermediate

The intermediate scenario (S2) builds on the dataset of the baseline scenario (S1) replacing corn with the real amount of UCO collected in the 2013–2014 biennium.
Corn was replaced with UCO when the corn quantity was exceeding the threshold value of 30 Mg·day−1 (CTOT,c). The amount of LU needed to produce the requested quantity of corn was calculated using a new value of CSET assuming UCO’s BMP as 10.21 times BMPc [45].

2.4.3. Scenario S3: Best Case

The best case scenario (S3) assumes the potential collection of UCO in all the municipalities to be at the same rate of the one with the higher collected amount of UCO for 2013–2014 biennium. This new hypothetical quantity of UCO (QIUCO) was calculated as the UCO per capita collected in the municipality with the higher UCO collection multiplied for the resident population of all of the municipalities. QIUCO is supposed to be used to replace corn in the weeks with a total use over the fixed threshold.
Finally, the utilized land and the Mg day−1 of corn needed to feed the biogas plant were calculated utilizing the same methodology used in S2.

2.5. Revenue Account

The average market price of the UCO matrix during the 2013–2014 biennium was approximately €490 per Mg [38]. The price refers to the regenerated UCO utilized in different sectors.
The net present value (NPV) was estimated calculating the potential profit opportunities for the power contractor in a scenario where the entire amount of collected UCO is allocated to the production of energy. NPV was calculated as:
N P V = t = 0 R t ( 1 + i ) t
where Rt are the inflow and outflow discounted back to the actual value and then added up.
The total cost (CT) was valued as the sum of three different categories of costs/inflows: initial investment costs (Ci), management costs (CG), and procurement costs (CA). Ci is equivalent to 4 M based on a constant payment [46]; CG represents an annual cost and depends on the amount of working hours corresponding to 8760 h·year−1 and an output of 999 kWh. Moreover, the energy produced has been paid as a management cost at a price of €0.03 per kWh. CA represents the sum of the amount of each biomass used to feed the plant at its specific market price. Price changes depending on whether the biomass is purchased on the market or self-produced.
Revenues are calculated as the sale on the electricity market multiplied for the annual incentive before 2012, equivalent to €0.28 per kWh. Financial costs depend on the overall amount, on the interest rate (r) and on the mortgage term ( q n ) . The value of r is fixed and it is equal to 5%. The annual installment is calculated through the multiplier (k), which is defined as:
k = ( r q n ) ( q n 1 )
Within each scenario the specific NPV was calculated as the difference between the total revenue (RT) and CT. The annual money save (MS) was based on the difference between the NPV of the three different scenarios indicated respectively as NPVS1, NPVS2, and NPVS3.
The profit opportunity (PO), that represents the potential market price that the UCO should have in a new energy chain, was estimated as:
P O = ( N P V S 2 ; S 3   N P V S 1 ) Q I U C O , c

3. Results and Discussion

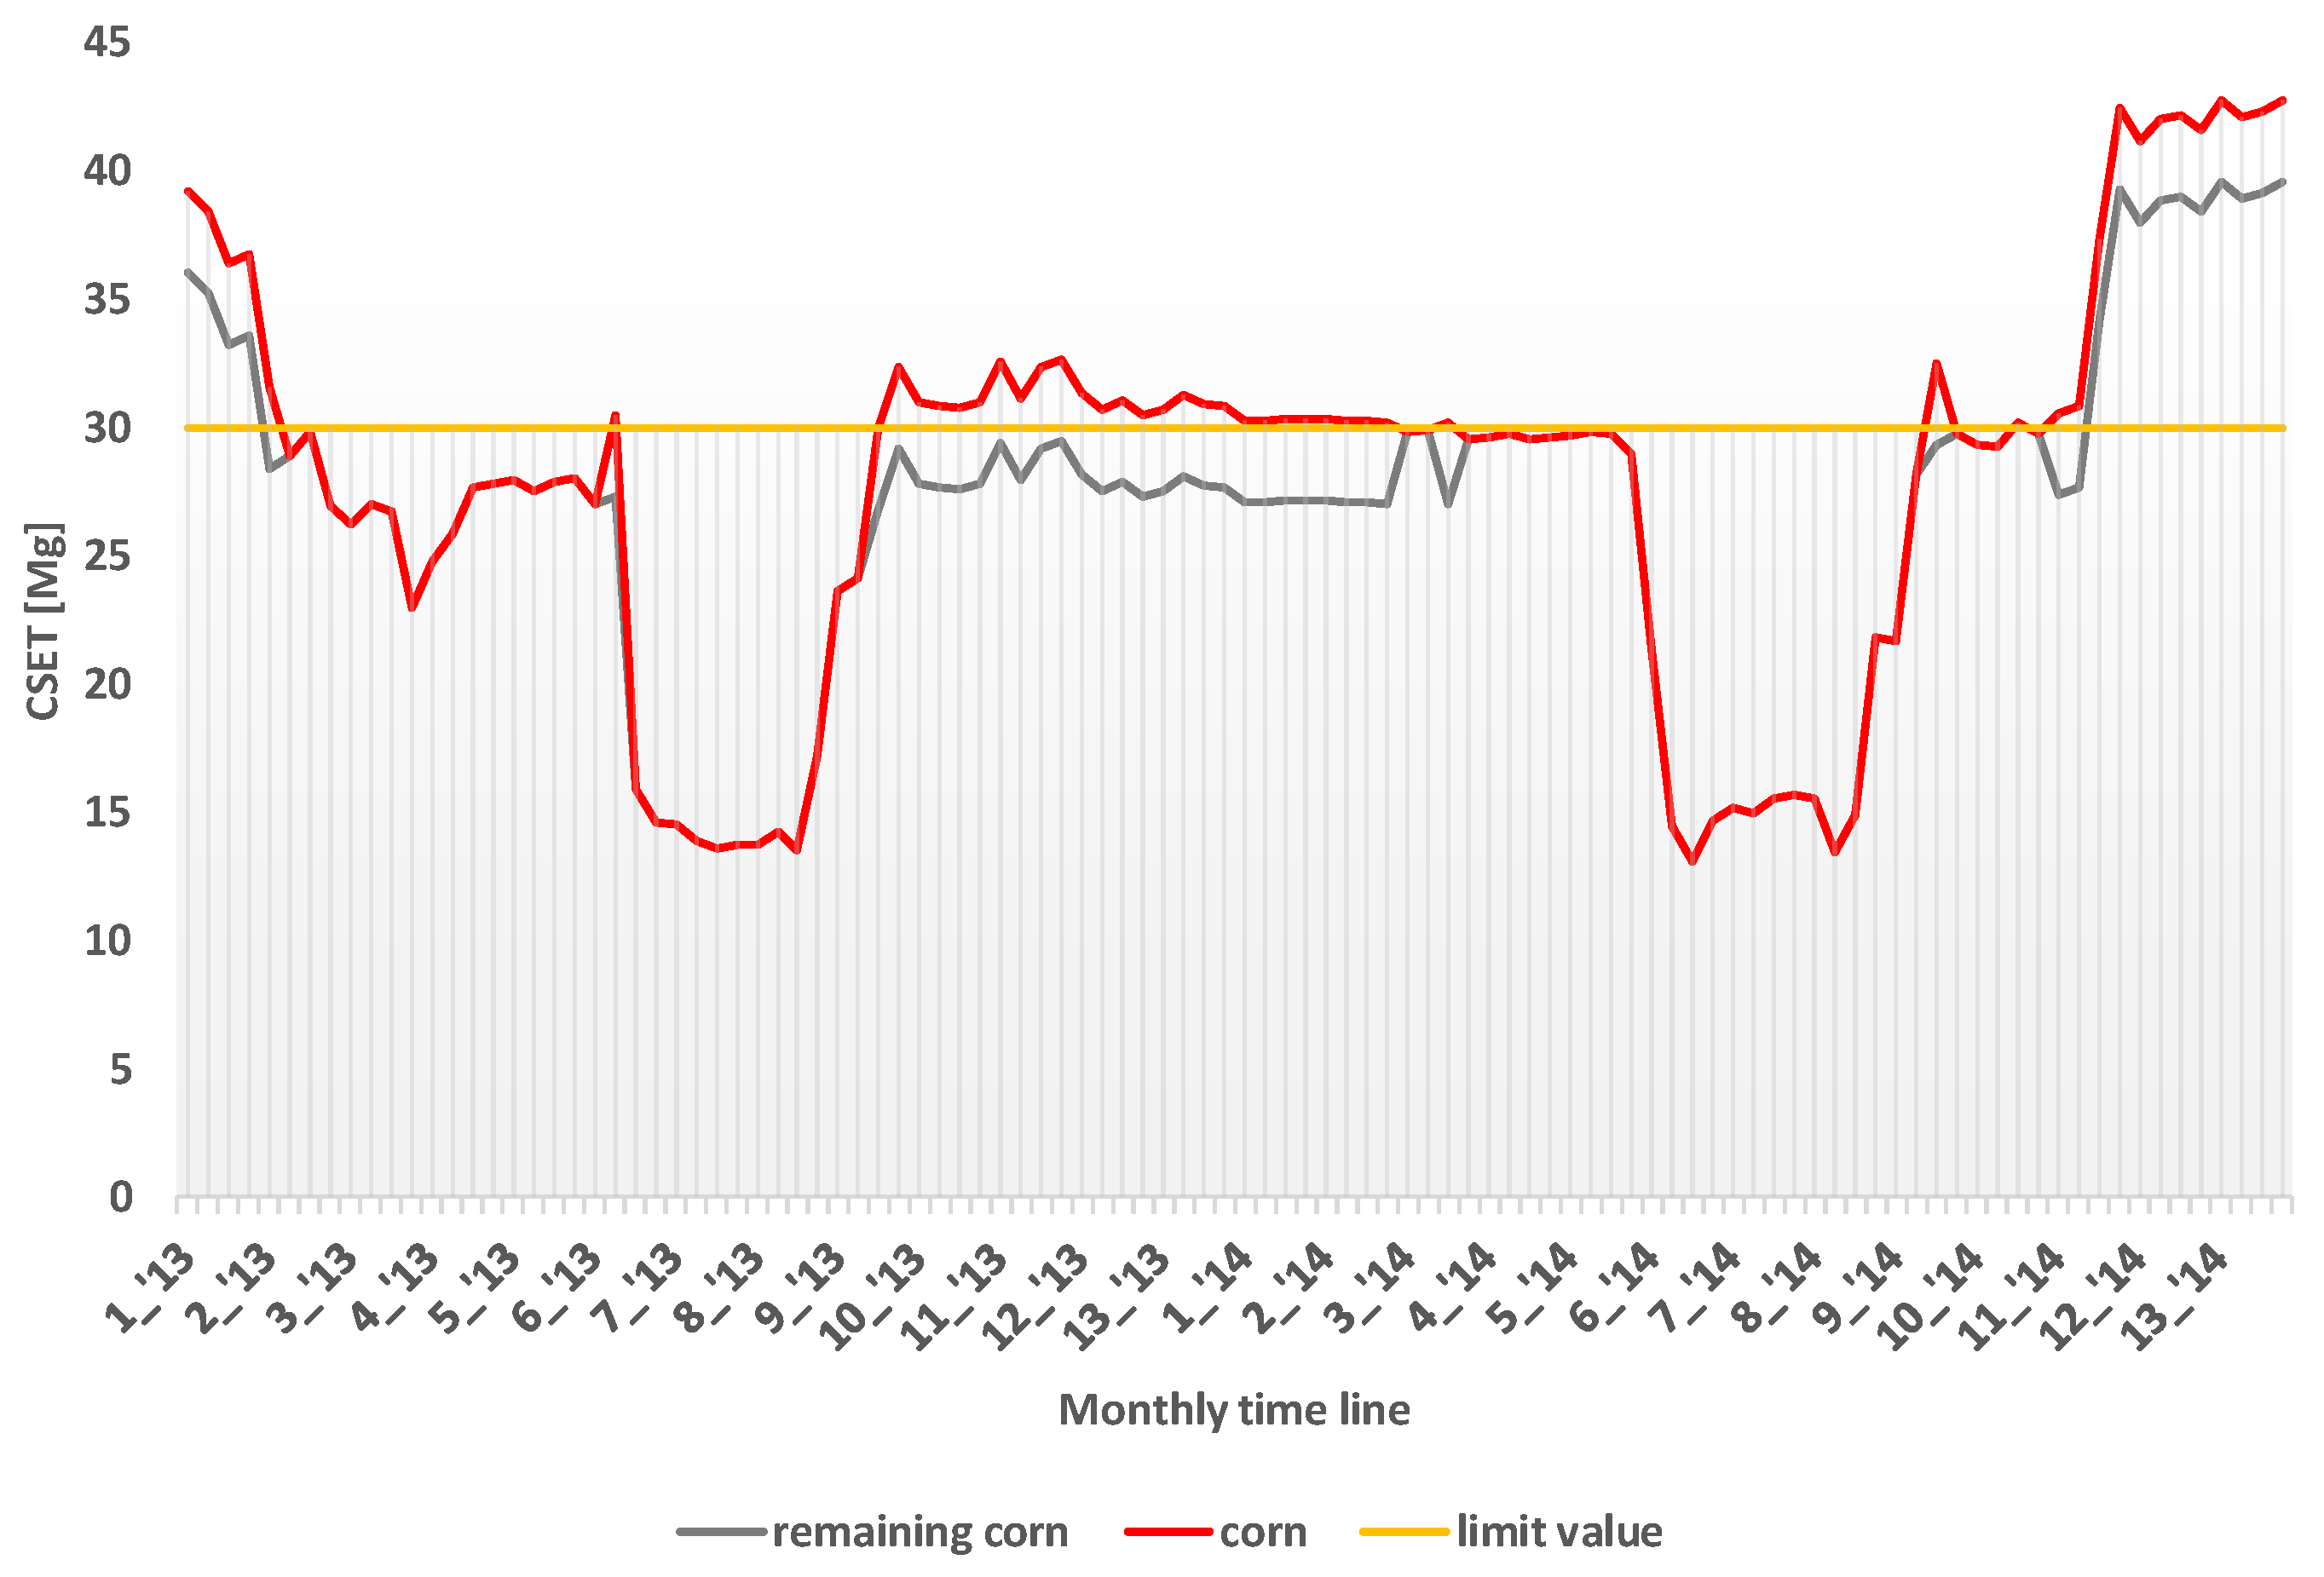
3.1. Scenario S1: Baseline

The average composition of the feed-in matrices to be utilized in the digestion process are reported in Figure 2. Data are expressed in months, indicated as numbers (1, 2, 3, etc.), with each month composed of four periods (weeks) of seven days and the subsequent month starting at the end of the fourth period (i.e., Month 2_’13 is starting at day 29). Remaining days are included in months 13_’13 and 13_’14.
The total load is composed by corn (69.92%) and agricultural by-products (30.08%) with the generic term “by-products” including coffee beans, pomace, blueberries, flours, wheats, husk spelt, cocoa, and sorghum. By-products are characterized by a quite diversified mix and a relatively limited quantity of organic matter.
The diet includes also wheat that was not considered as an energy crop since it was originally produced for human consumption and was then reallocated to energy use only if it was degraded or affected by diseases.
Additionally, a reduction in the use of corn was registered between months 6 and 10 of the two years under analysis mainly due to the seasonality of the corn production cycle.
Considering corn yield per hectare the average annual land consumption was 182.20 ha·year−1 equal to 0.84 ha·day−1.
Figure 3 highlights the surplus in the use of corn with the six series representing the periods of four months within the biennium under analysis.
R2, the value of the coefficient of determination representing the average cumulative consumption of corn in the two years for all six series, is close to one, suggesting a good explanatory capacity of the model.
UCO was introduced in the weeks with a higher intensity in the use of ECs corresponding to the time series with a higher slope (3, 4, 6).

3.2. Scenario S2: Intermediate

The average annual amount of UCO collected by authorized companies was approximately 146.28 Mg. Figure 4 shows the breakdown of the UCO collected in the selected municipalities. As predictable the municipality with the higher resident population (Bologna) presented the higher share of collected UCO.
The replacement of corn with UCO was assumed to ensure unaltered values for the total load, the electrical power, and the energy production.
During the 2013–2014 biennium, UCO has been introduced in all 46 weeks—out of 104—when the threshold value of 30 Mg·year−1 of corn was exceeded.
The 146.28 Mg of UCO were equally distributed along the 46 weeks for a weekly average of 3.18 Mg. The real plant diet has been reset for the new feedstock maintaining constant values for the production of electrical energy and for the total load. Figure 5 suggests that the introduction of this matrix ensured a reduction of the quantity of corn maintaining the same electrical system power.
In this scenario the overall amount of corn decreases of about 1480 Mg per year. This reduction corresponds to significant land savings: the corn area decreased from 182.20 ha in scenario S1 to 155.3 ha·year−1 in scenario S2 corresponding to the 14.8%.

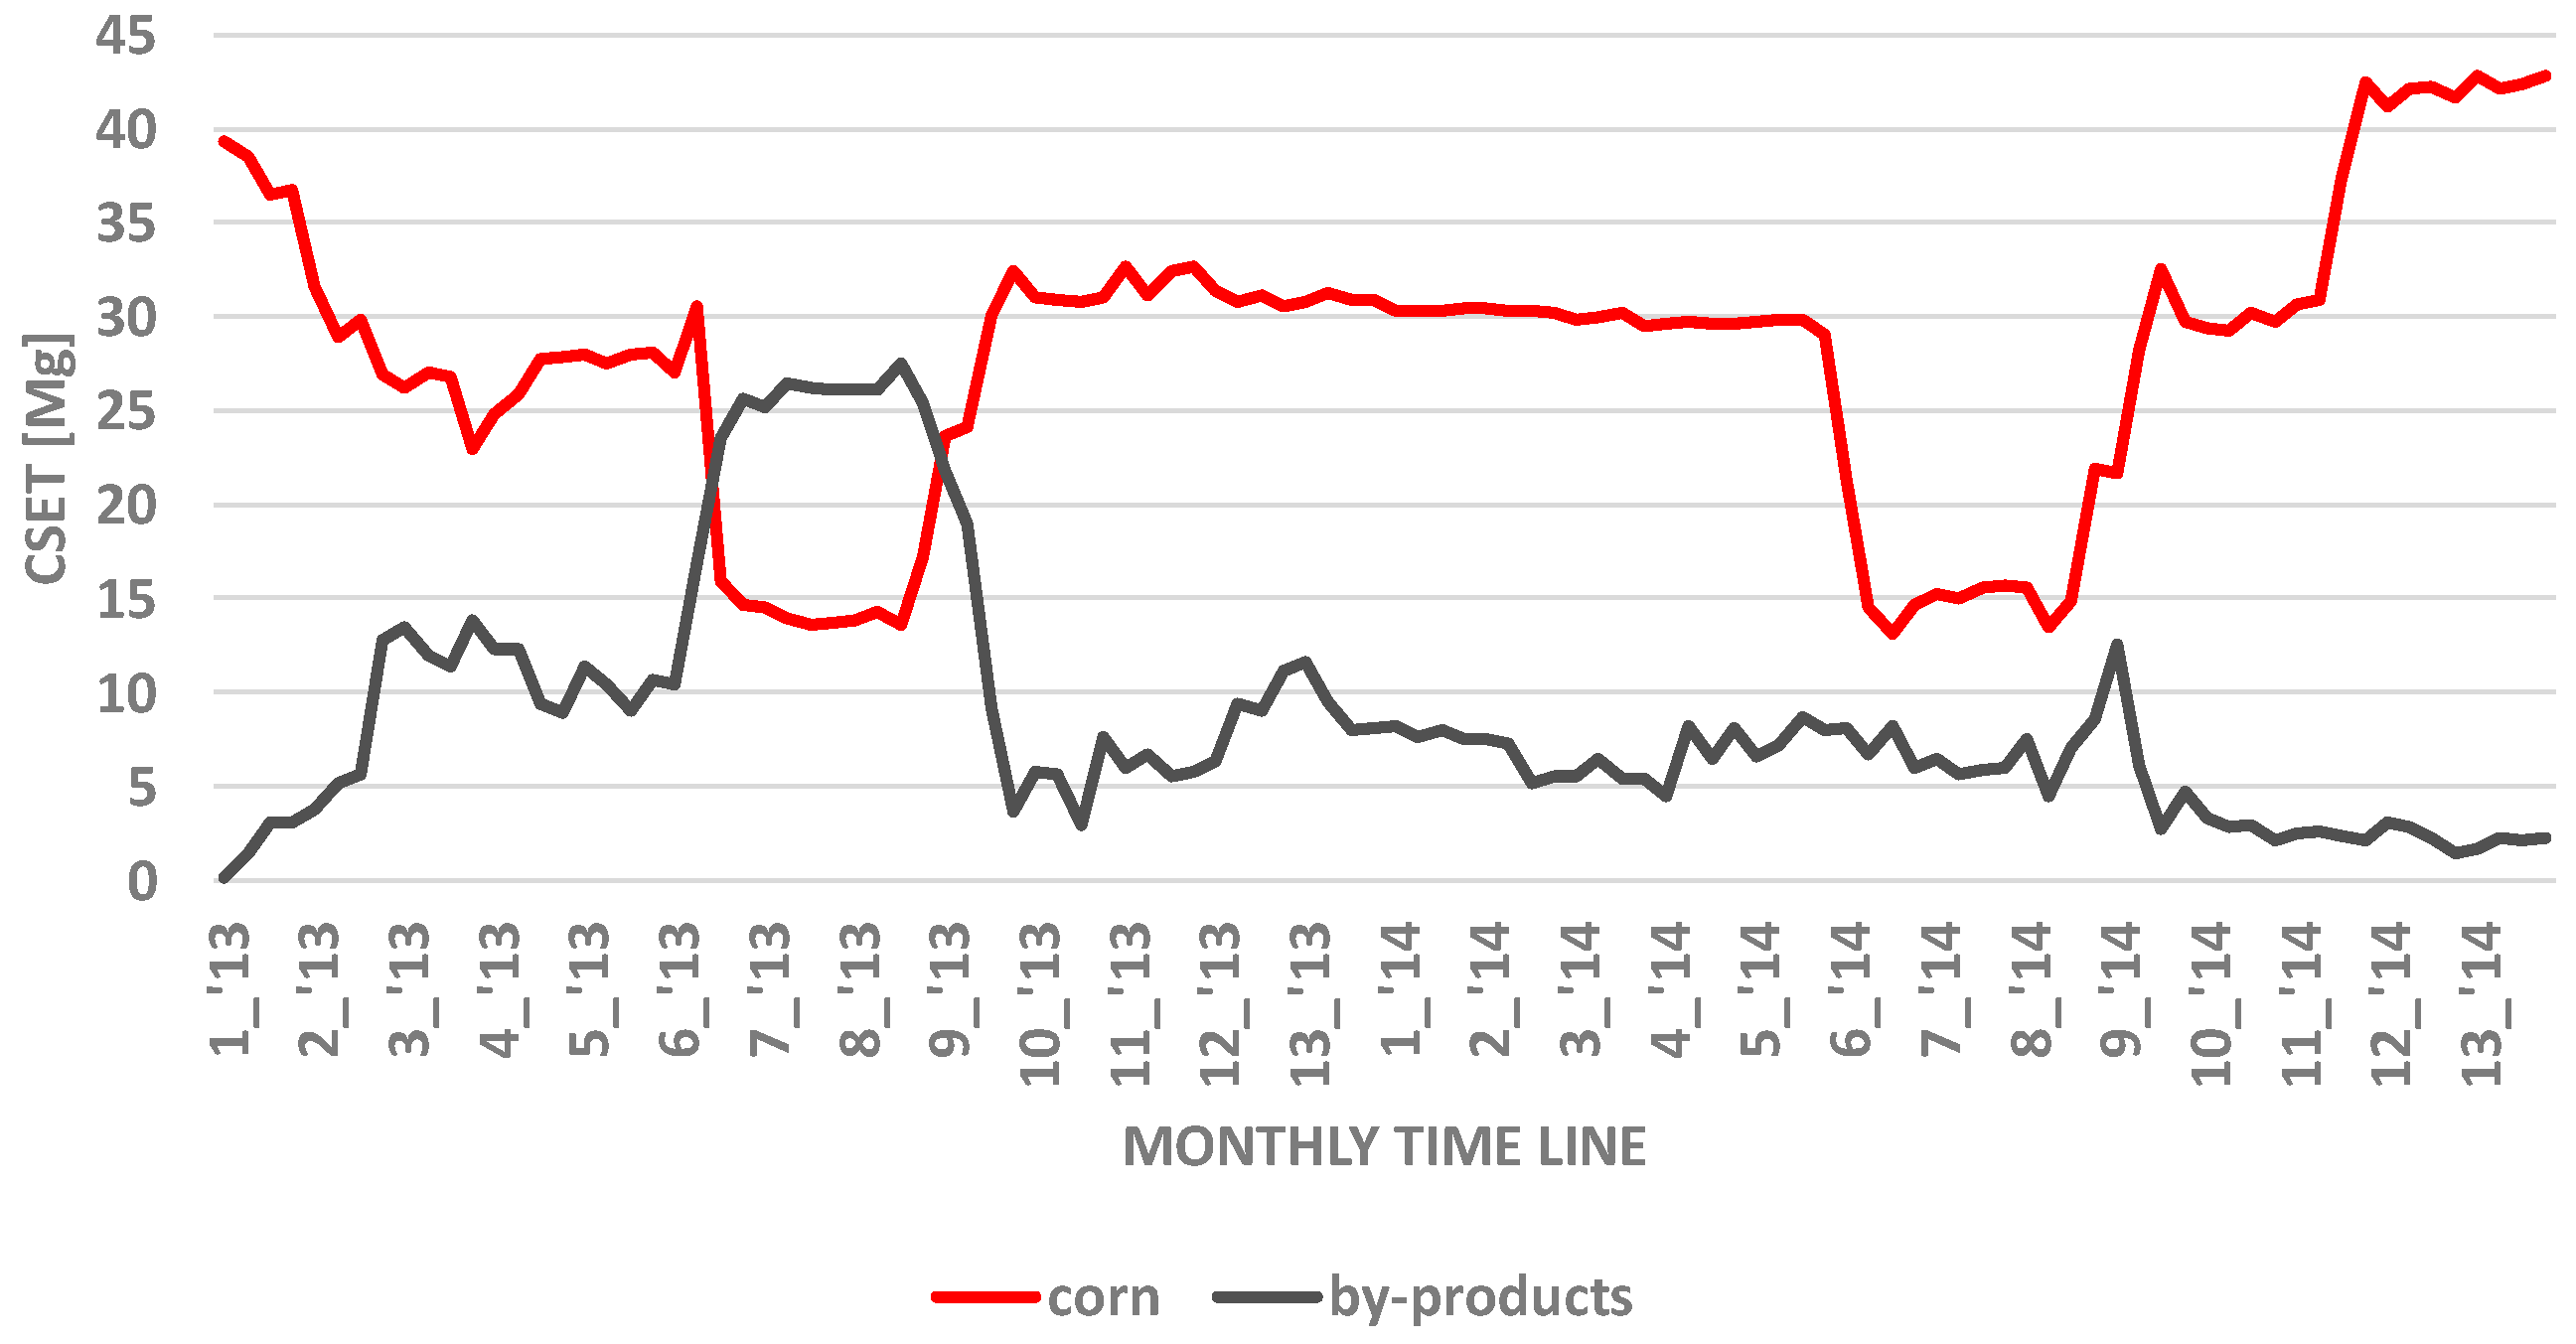
3.3. Scenario S3: Best Case

The municipality of Mordano recorded the highest UCO collection value for a total amount of 3.35 Mg per year or to 0.71 g per capita. The specific production per capita was calculated to provide a parameter of the correlation between UCO collection with the resident population (Figure 6).
The value recorded in Mordano was used as baseline for all the other municipalities to calculate the potential amount of collectible UCO. If all of the other municipalities would collect the same UCO per capita, a potential growth of 486.50 Mg (more than three times) would be possible. Figure 7 shows the current collection rates (per capita) and the additional production for all the municipalities within the case study area.
The new UCO amount introduced in the 46 weeks identified in the S2 scenario, represents the sum of that currently collected with the potentially collectible UCO. The weekly average amount from S2 to S3 was increased from 3.18 Mg to 10.34 Mg.
This amount of UCO would allow to ensure enough organic matter for 38 weeks out of the 46 where the threshold value of 30 Mg·day−1 was exceeded. Figure 8 shows that these eight weeks are concentrated in the last quarter of the year. This is mainly explained by the limited capacity to forecast the supply since both the energy crops and the by-products are characterized by a remarkable seasonality, with a limited availability in certain periods of the year, and by the structural weaknesses of the by-products market that is still fragmented and unstable. In this scenario the corn area would decrease from the 182.20 ha·year−1 of scenario S1 to 92.7 ha·year−1 of scenario S3 with a land savings of 49.1% (Table 1).

3.4. Economic Assessment

For a biogas entrepreneur, the average cost of feedstock (CA) represents one of the most important parameters. In the economic assessment, the costs of all the feedstocks, with the exception of those of UCO, are fixed. Similarly, the market price of all the inputs remain the same under the three scenarios. Considering that in S2 and S3 the cost of UCO is equal to zero, the main variable is represented by the quantity of biomass.
In the case of the substitution of corn with UCO, the potential savings lead to a reduction of the production cost from € 0.61 million (scenario S1) to € 0.43 million (scenario S3) (Table 2).
The initial investment cost (CI) results an unvaried item in the three scenarios since the biogas plant was already built. For the same reason also the management cost (CG) remained unchanged.
With the biogas plant under operation and with a fixed electricity conversion, it was possible to calculate the plant revenue that results unvaried in the three scenarios.
NPV increased from €1.1 million (1,118,826.45) in S1 to €1.2 million (1,170,645.91) in S2 to €1.3 million (1,291,123.50) in S3.
The economic profitability of energy recovery from UCO is confirmed also from the MS value. In the S2 and S3 scenarios the substitution of corn with UCO allowed savings for €51,820 and €172,297.
Similarly, S2 and S3 were characterized by a positive PO value. If compared with the UCO market price of €490 per Mg the increased value of PO might find two different explanations. On the one hand the growth can be explained with the new allocation of UCO that would lead to a reduction of the price paid by recovery companies to regenerate it, thanks to the maximization of the present value and of the net benefits, and to the increase of the collectible quantity. On the other hand, the growth of the value of PO can be explained as the additional collection of UCO stimulated by a higher demand.

4. Conclusions

The paper aimed to assess the technical and economic feasibility of the substitution of energy crops with UCO in AD with particular emphasis on the potential implications on land use. To carry out the analysis a full-scale plant performing AD was monitored for two years, three scenarios to evaluate the energy and environmental impact of the introduction of UCO were developed, and an economic assessment to estimate the cost-effectiveness and the potential income generation of the biogas system was performed.
Results suggest that the introduction of UCO in the feeding mix of the biogas plant could lead to land saving up to 50%. The use of UCO would allow to maintain a stable production of energy along the year, to mitigate the environmental impact of biogas production (less land used for the production of energy crops), and to ensure economic benefits for farmers (an additional source of revenue and reduced costs for biomass collection).
The partial substitution of ECs with UCO is technically feasible and economically viable with a major constraint put in place by the current legislative framework that limits the collection and the utilization of UCO for anaerobic digestion. Policy interventions should be aimed at removing the barriers that currently limit UCO collection and reuse in biogas energy systems.

Author Contributions

Authors equally contributed to research design, data collection and data elaboration and analysis. All authors proofread and approved the final manuscript.

Conflicts of Interest

The authors declare no conflict of interest.

References

  1. Food and Agriculture Organization of the United Nations. Global Agriculture towards 2050, How to Feed the Word, High-Level Expert Forum; Food and Agriculture Organization of the United Nations: Rome, Italy, 2009. [Google Scholar]
  2. Tscharntke, T.; Clough, Y.; Wanger, T.C.; Jackson, L.; Motzke, I.; Perfecto, I.; Vandermeer, J.; Whitbread, A. Global food security, biodiversity conservation and the future of agricultural intensification. Biol. Conserv. 2012, 151, 53–59. [Google Scholar] [CrossRef]
  3. IPCC. Climate Change 2014. Synthesis Report. Available online: https://www.ipcc.ch/report/ar5/wg2/ (accessed on 10 October 2016).
  4. Lutz, C.; Lehr, U.; Wiebe, K.S. Economic effects of peak oil. Energy Policy 2012, 48, 829–834. [Google Scholar] [CrossRef]
  5. Organisation for Economic Co-Operation and Development (OECD); International Energy Agency (IEA). World Energy Outlook; Organisation for Economic Co-Operation and Development (OECD) Publishing: Paris, France, 2012. [Google Scholar]
  6. Mech, A.Z.; Rouse, S. Macro and micro economic principles of the Kyoto Protocol result—Making money. In Proceedings of the 2006 IEEE Electrical Insulation Conference (EIC) Climate Change Technology, Ottawa, ON, Canada, 10–12 May 2006; pp. 1–2.
  7. Unite Nation Framework Convention on Climate Change. Kyoto Protocol Reference Manual on Accounting of Emissions and Assigned Amount; Unite Nation Framework Convention on Climate Change: New York, NY, USA, 2003; pp. 10–122. [Google Scholar]
  8. Sousa, A.; Faria, J.; Fernandes, H.; Gonçalves, R.; Paredes, H.; Martins, P.; Barroso, J. GREENBOX: A management system for used cooking oils collection. In Proceedings of the World Automation Congress (WAC), Piscataway, NJ, USA, 24–28 June 2012; pp. 1–6.
  9. European Commission, Commission Stuff Working Document, Impact Assessment, Comunication from the Commission to the European Parliament, the Council, the European Economic and Social Commiteeand the Committee of the Regions. A Policy Framework for Climate and Energy in the Period from 2020 to 2030. Available online: http://ec.europa.eu/smart-regulation/impact/ia_carried_out/docs/ia_2014/swd_2014_0015 (accessed on 8 August 2016).
  10. Pagani, M.; Vittuari, M.; Johnson, T.G.; de Menna, F. An assessment of the energy footprint of dairy farms in Missouri and Emilia-Romagna. Agric. Syst. 2016, 145, 116–126. [Google Scholar] [CrossRef]
  11. Molari, G.; Milani, M.; Toscano, A.; Borin, M.; Taglioli, G.; Villani, G.; Demetrio, A.Z. Energy characterization of herbaceous biomass irrigated with marginal water. Biomass Bioenergy 2014, 70, 392–399. [Google Scholar] [CrossRef]
  12. McKandry, P. Energy production from biomass (part 2): Conversion technologies. Bioresour. Technol. 2002, 83, 47–54. [Google Scholar] [CrossRef]
  13. EurObserv’ER, 2010. The State of Renewable Energies in Europe. 10th EurObserv’ER Report. Available online: http://www.eurobserv.er.org/pdf/barobilan10.pdf (accessed on 16 November 2016).
  14. Jean Vasile, A.; Raluca Andreea, I.; Popescu, G.H.; Elvira, N.; Marian, Z. Implications of agricultural bioenergy crop production and prices in changing the land use paradigm—The case of Romania. Land Use Policy 2016, 50, 399–407. [Google Scholar] [CrossRef]
  15. Palmer, J.R. Biofuels and the politics of land-use change: Tracing the interactions of discourse and place in European policy making. Environ. Plan. A 2014, 46, 337–352. [Google Scholar] [CrossRef]
  16. Bowyer, C.; Kretschmer, B. Anticipated Indirect Land Use Change Associated with Expanded Use of Biofuels and Bioliquids in the EU—An Analysis of the National Renewable Energy Action Plans; International Institute for Education Planning: Paris, France, 2010; pp. 8–9. [Google Scholar]
  17. Deepanraj, B.; Sivasubramanian, V.; Jayaraj, S. Biogas generation through anaerobic digestion process—An overview. Res. J. Chem. Environ. 2014, 18, 80–93. [Google Scholar]
  18. Riva, C.; Schievano, A.; D’Imporzano, G.; Adani, F. Production costs and operative margins in electric energy generation from biogas. Full-scale case studies in Italy. Waste Manag. 2014, 34, 1429–1435. [Google Scholar] [CrossRef] [PubMed]
  19. Bacenetti, J.; Duca, D.; Negri, M.; Fusi, A.; Fiala, M. Mitigation strategies in the agro-food sector: The anaerobic digestion of tomato purée by-product. An Italian case study. Sci. Total Environ. 2015, 527, 88–97. [Google Scholar] [CrossRef] [PubMed]
  20. Dinuccio, E.; Balsari, P.; Gioelli, F.; Menardo, S. Evaluation of the biogas productivity potential of some Italian agro-industrial biomasses. Bioresour. Technol. 2010, 101, 3780–3783. [Google Scholar] [CrossRef] [PubMed]
  21. De Menna, F.; Malagnino, R.; Vittuari, M.; Molari, G.; Seddaiu, G.; Deligios, P.; Solinas, S.; Ledda, L. Potential biogas production from artichoke byproducts in Sardinia, Italy. Energies 2016, 9, 92. [Google Scholar] [CrossRef]
  22. Namsree, P.; Suvajittanont, W.; Puttanle, C.; Uttapap, D.; Rungsardthon, V. Anaerobic digestion of pineapple pulp and peel in a plug-flow reactor. J. Environ. Manag. 2012, 110, 40–47. [Google Scholar] [CrossRef] [PubMed]
  23. Gianico, A.; Braguglia, C.M.; Mescia, D.; Mininni, G. Ultrasonic and thermal pretreatments to enhance the anaerobic bioconversion of olive husks. Bioresour. Technol. 2013, 147, 623–626. [Google Scholar] [CrossRef] [PubMed]
  24. Ludwig, J.; Treitz, M.; Rentz, O.; Geldermann, J. Production planning by pinch analysis for biomass use in dynamic and seasonal markets. Int. J. Prod. Res. 2009, 47, 2079–2090. [Google Scholar] [CrossRef]
  25. Peiró, L.T.; Méndez, G.V.; Durany, X.G.I. Exergy analysis of integrated waste management in the recovery and recycling of used cooking oils. Environ. Sci. Technol. 2008, 42, 4977–4981. [Google Scholar] [CrossRef]
  26. Regulation (EC) No. 1774/2002 of the European Parliament and of the Council of 3 October 2002 Laying down Health Rules Concerning Animal by-Products Not Intended for Human Consumption. Available online: http://eur-lex.europa.eu/legal-content/EN/TXT/?uri=celex%3A32002R1774 (accessed on 8 August 2016).
  27. Legislative Decree 3 April 2006, n. 152. Environmental Regulations, Official Gazette no. 88, 2006, Ordinary Supplement n. 96. Available online: http://eur-lex.europa.eu/legal-content/EN/TXT/?uri=CELEX%3A62013CJ0551 (accessed on 8 August 2016).
  28. Knothe, G.; Steidley, K.R. A comparison of used cooking oils: A very heterogeneous feedstock for biodiesel. Bioresour. Technol. 2009, 100, 5796–5801. [Google Scholar] [CrossRef] [PubMed]
  29. GREENEA Team, Used Cooking Oil Collection: A Market Worth 470 Million Euros, with France Representing Only 5%. GREENEA 2014. Available online: http://www.greenea.com/it/articoli/category/12-used-cooking-oil.html (accessed on 8 August 2016).
  30. Sheinbaum, C.; Balam, M.V.; Robles, G.; de Larrea, S.L.; Mendoza, R. Biodiesel from waste cooking oil in Mexico City. Waste Manag. Res. 2015, 33, 730–739. [Google Scholar] [CrossRef] [PubMed]
  31. Prussi, M.; Chiaramonti, D.; Recchia, L.; Martelli, F.; Guidotti, F.; Pari, L. Alternative feedstock for the biodiesel and energy production: The OVEST project. Energy 2013, 58, 2–8. [Google Scholar] [CrossRef]
  32. Kolyaei, M.; Zahedi, G.; Nasef, M.M. Optimization of biodiesel production from waste cooking oil using ion exchange resins. In Proceedings of the 2011 4th International Conference on Modeling, Simulation and Applied Optimization (ICMSAO), Kuala Lumpur, Malaysia, 19–21 April 2011; pp. 1–5.
  33. Chhetri, A.B.; Watts, K.C.; Islam, M.R. Waste cooking oil as an alternate feedstock for biodiesel production. Energies 2008, 1, 3–18. [Google Scholar] [CrossRef]
  34. Anastopoulos, G.; Zannikou, Y.; Stournas, S.; Kalligeros, S. Transesterification of vegetable oils with ethanol and characterization of the key fuel properties of ethyl esters. Energies 2009, 2, 362–376. [Google Scholar] [CrossRef]
  35. Ding, J.; Xia, Z.; Lu, J. Esterification and deacidification of a waste cooking oil (TAN 68.81 mg KOH/g) for biodiesel production. Energies 2012, 5, 2683–2691. [Google Scholar] [CrossRef]
  36. Fierro, J.; Martínez, E.J.; Morán, A.; Gómez, X. Valorisation of used cooking oil sludge by codigestion with swine manure. Waste Manag. 2014, 34, 1537–1545. [Google Scholar] [CrossRef]
  37. Nuchdang, S.; Phalakornkule, C. Anaerobic digestion of glycerol and co-digestion of glycerol and pig manure. J. Environ. Manag. 2012, 101, 164–172. [Google Scholar] [CrossRef] [PubMed]
  38. Italian National Consortium for Mandatory Collection and Processing of Waste Vegetable and Animal Oils and Fat (CONOE). Il Contributo del CONOE Alla Green Economy; Technical Report; CONOE: Roma, Italy, 2016. [Google Scholar]
  39. INEA. Italian Agriculture in Figure 2013. Available online: http://dspace.inea.it/bitstream/inea/843/1/Italian_agriculture_figures_2013.pdf (accessed on 11 October 2016).
  40. Cavicchi, B. Sustainability that bikefires: The case of biogas in Emilia Romagna. Environ. Innov. Soc. Trans. 2016, 21, 13–27. [Google Scholar] [CrossRef]
  41. Italian Ministry of Economic Development. Incentives for Biomass and Biogas from Short Chain Biomass. Decreto Ministeriale del 6 Luglio 2010. Available online: http://www.sviluppoeconomico.gov.it/images/stories/documenti/bozza_decreto_interministeriale_mise_ambiente_23_settembre_2015 (accessed on 8 August 2016).
  42. Danieli, L.; Aldrovandi, A. Replace energy crops with the ad hoc biomass. Inf. Agrar. Suppl. 2011, 38, 25–28. [Google Scholar]
  43. Schievano, A.; D’Imporzano, G.; Adani, F. Substituting energy crops with organic wastes and agro-industrial residues for biogas production. J. Environ. Manag. 2009, 90, 2537–2541. [Google Scholar] [CrossRef] [PubMed]
  44. Bordoni, A.; Romagnoli, E.; Foppa Pedretti, E.; Toscano, G.; Rossini, E.; Cozzolino, E.; Riva, G. La Filiera del Biogas. Aspetti Salienti Dello Stato Dell’arte e Prospettive; Laboratorio Biomasse, Università Politecnica delle Marche: Ancona, Italy, 2013; pp. 5–45. [Google Scholar]
  45. Soldano, M.; Fabbri, C.; Labartino, N.; Piccinini, S. Valutazione del Potenziale Metanigeno di Biomasse di Scarto Dell’industria Agroalimentare, Atti Convengo ECOMONDO 2011. Available online: http://www.crpa.it/media/documents/crpa_www/Settori/Ambiente/Download/Archivio-2011/Ecomondo2011_01.pdf (accessed on 8 August 2016).
  46. Karellas, S.; Boukis, I.; Kontopoulos, G. Development of an investment decision tool for biogas production from agricultural waste. Renew. Sustain. Energy Rev. 2010, 14, 1273–1282. [Google Scholar] [CrossRef]
Figure 1. Case study area, 50 km diameter.
Energies 10 00192 g001
Figure 2. Monthly real biogas plant diet in the 2013–2014 biennium.
Energies 10 00192 g002
Figure 3. Cumulative distribution function of the corn used in the biennium 2013–2014.
Energies 10 00192 g003
Figure 4. Used cooking oil (UCO) collected in the selected municipalities (as the percent of the total) in the 2013–2014 biennium.
Energies 10 00192 g004
Figure 5. Corn required in the weeks that exceed the threshold value within S2.
Energies 10 00192 g005
Figure 6. UCO specific production per capita in the selected municipalities.
Energies 10 00192 g006
Figure 7. Collected and potentially collectible UCO per capita in the 2013–2014 biennium.
Energies 10 00192 g007
Figure 8. Corn required in the weeks exceeding the threshold value within S3.
Energies 10 00192 g008
Table 1. Summary of the three scenarios.
2013–2014 AverageS1S2S3
CTOT,C [Mg per year]10,020.708450.205097.70
LU [ha per year]182.20155.3092.70
LUd [ha per day]0.500.430.25
UCO collected [Mg per year]0.00146.30486.50
UCO fed plant [Mg per year]0.00146.30486.50
Land save [ha per year]0.0026.9089.50
Table 2. Economic assessment overview results.
ValueS1S2S3
CA [M€]0.610.56 0.43
CI [M€]0.21 0.210.21
Cg [M€·(kWh)−1]0.23 0.230.23
CT [M€]1.1 1.0 0.89
RT [M€]2.1 2.1 2.1
NPV [M€]1.1 1.2 1.3
MS [M€]0.00.050.17
PO [€·Mg−1]0.0 350350

