The Impact of Urban Design Descriptors on Outdoor Thermal Environment: A Literature Review


1
Department of Architecture, The University of Hong Kong, Hong Kong SAR, China
2
Cities Research Institute, Griffith University, Gold Coast, QLD 4215, Australia
3
Department of Architecture, National University of Singapore, Singapore 117566, Singapore
*
Author to whom correspondence should be addressed.
Energies 2017, 10(12), 2151; https://doi.org/10.3390/en10122151
Submission received: 25 October 2017
/
Revised: 29 November 2017
/
Accepted: 14 December 2017
/
Published: 15 December 2017
Abstract
:This paper presents a literature review on urban design indicators addressing the impact of urban geometry and vegetation on the outdoor thermal environment at the pedestrian level, as urban geometry and vegetation have been regarded as the most influential urban design factors that affect outdoor microclimate. The thermal balance concept is first introduced to elaborate how each component of energy fluxes is affected by the urban built environment, which helps to explore the underlying thermophysical mechanisms of how urban design modifies the outdoor thermal environment. The literature on numerous urban design descriptors addressing urban geometric characteristics is categorized into five groups in this paper according to the design features that the parameters entail, including land use intensity, building form, canyon geometry, space enclosure and descriptive characteristics. The literature on urban vegetation descriptors is reviewed together, followed by the combined effect of urban geometry and vegetation. This paper identifies a series of important urban design parameters and shows that the impact of design parameters on thermal environment varies with time, season, local climate and urban contexts. Contradictory impacts often occur between daytime and nighttime, or different seasons, which requests trade-offs to be achieved when proposing design strategies.
1. Introduction
Accelerated world population growth and urbanization rate have caused considerable stress to our environment: for instance, environmental degradation and climate change. The urban heat island (UHI), as an indicator of urban climate modification, has been investigated extensively since it was first time documented by Luke Howard in 1818. The UHI phenomenon has been identified and recorded for most of the major cities in the world [1,2,3,4,5,6]. Evidence of the negative influences of UHI on energy consumption, air pollution, and public health began to accumulate decades ago. UHI could amplify the cooling energy load substantially in the summer, especially for hot areas [7,8]. According to Salvati, Coch Roura, and Cecere [9], the simulation showed that the cooling load of residential buildings can be increased by the local UHI intensity (2.8 °C in winter and 1.7 °C in summer) by around 18–28%. A study conducted by Agarwal and Tandon [10] concluded that UHI effect aggravated the concentration level of air pollutants in all atmospheric conditions. UHI effect was found to have a significant influence on extreme weather incidents, such as heat waves [11], which is highly related to public health and mortality rates [12,13,14].
The outdoor thermal environment and UHI intensity depend on both natural and man-made factors. The local weather conditions and topographical characteristics are the major natural forces that govern urban thermal environment. As for man-made factors, the process of urbanization is the main driver that alters the urban outdoor thermal environment. Urbanization affects climate variations principally by changing the natural environment, such as modifying the surface albedo and roughness, thermal and hydrological properties of the ground surface. The main modifications can be summarized as follows [15,16,17]:
- The surfaces are changed from soft, porous ground or vegetated ground to hard, watertight ground such as concrete or macadam.
- Canyon geometry causes less energy loss by long-wave radiation emitted from building surfaces.
- More heat resources are generated from the concentration of human activities, heating, air conditioning units and heat generation structure.
- Wind flow is weakened by incremental surface roughness due to building mass, or blocked by large obstructions in the urban canopy layer.
- Industrialization and human activities cause changes in the constituents of the air and water, which play important roles in energy flow processes.
The generation and mitigation of UHI or urban climate modification have attracted widespread research interest [18,19]. The important factors in terms of the urban built environment have been explored and summarized by many researchers [17,20,21,22], covering canyon geometry, building materials, evaporative cooling sources (vegetation or water body), the greenhouse effect, anthropogenic heat sources, and wind patterns. Strategies to mitigate UHI intensity and improve the urban thermal environment have been investigated and proposed for various climate backgrounds with respect to urban design, among which urban geometry and vegetation are regarded as the most influential urban design features [17,22,23]. It is therefore very important for urban designers and architects to understand the relationship between climate indicators and urban design features and to be able to anticipate the potential impact on the outdoor thermal performance of proposed urban geometric characteristics in the early design stage.
Numerous studies have contributed to improving the understanding of the energy balance in the built environment and the interactions between microclimate and urban structural forms, which can provide practical design suggestions for architects and urban designers to create climate-sensitive urban environments with better thermal comfort. During this process, many design parameters have been developed and correlated with climate indicators which signify the thermal environment. Quantitative analysis and scientific interpretation have been conducted to inform urban design practices. However, there has not been a systematic review of the urban design parameters addressing the impact of urban geometry and vegetation on the outdoor thermal environment at the pedestrian level. Therefore, this paper aims to fill the gap by reviewing the urban climate studies that investigate urban design parameters. Important urban design indicators will be identified and reviewed to facilitate future systematic and quantitative research on local climate sensitive urban design.
2. Methodology
This paper systematically reviews the impact of the most important urban design indicators of urban geometry and vegetation at the pedestrian level outdoor thermal environment. The studies entailing urban geometry and vegetation are included and compared. Various urban design indicators have been developed to quantify urban geometric structure characteristics. According to the design feature that the parameters address, they are classified into five groups in the present paper, addressing land use intensity, building form, canyon geometry, space enclosure and descriptive characteristics. Aside from that, all vegetation descriptors are reviewed in one group in this paper. For the vegetation part, only the greenery types on the ground are addressed in this paper. Other greenery types, such as the green wall, green roof and sky garden are excluded since they have very limited influence on the pedestrian level thermal environment [24].
In Section 3, the thermal balance concept is introduced to elaborate the influence of urban construction on each component of energy fluxes in the urban canopy layer. It serves to facilitate the understanding of the underlying thermophysical mechanisms of how urban design affects thermal performance in the following second part. Section 4 reviews extensive literature on urban geometry and vegetation to identify the important design variables that have been investigated over the past decades. The combined effect of the urban design parameters from these two aspects is also reviewed in this part. Literature was searched through ScienceDirect, Scopus, and Google Scholar using keywords identified as “urban heat island”, “UHI”, “outdoor thermal environment”, “outdoor air temperature”, “urban design”, “urban geometry”, “canyon geometry” “urban morphology”, “urban form”, “park”, “greenery”, and “vegetation”. Literature was then screened and chosen according to several standards: (1) investigates the impact of urban geometry or vegetation on UHI or outdoor thermal environment; (2) proposes or adopts specific urban design parameters to define urban geometry or vegetation. Moreover, these design parameters should meet the following standards: (1) should be easily interpreted by urban designers and architects; (2) could provide direct and quantitative implication for the design practices.
3. Thermal Balance in the Urban Environment
To better understand the energy flow within an urban built environment, the concept of energy balance should be introduced. Energy balance is originated from the first law of thermodynamics, which means that energy can neither be created nor destroyed, but only converted from one form to another [25]. The equation is written as (1):
Energy gains = Energy losses + Energy storage
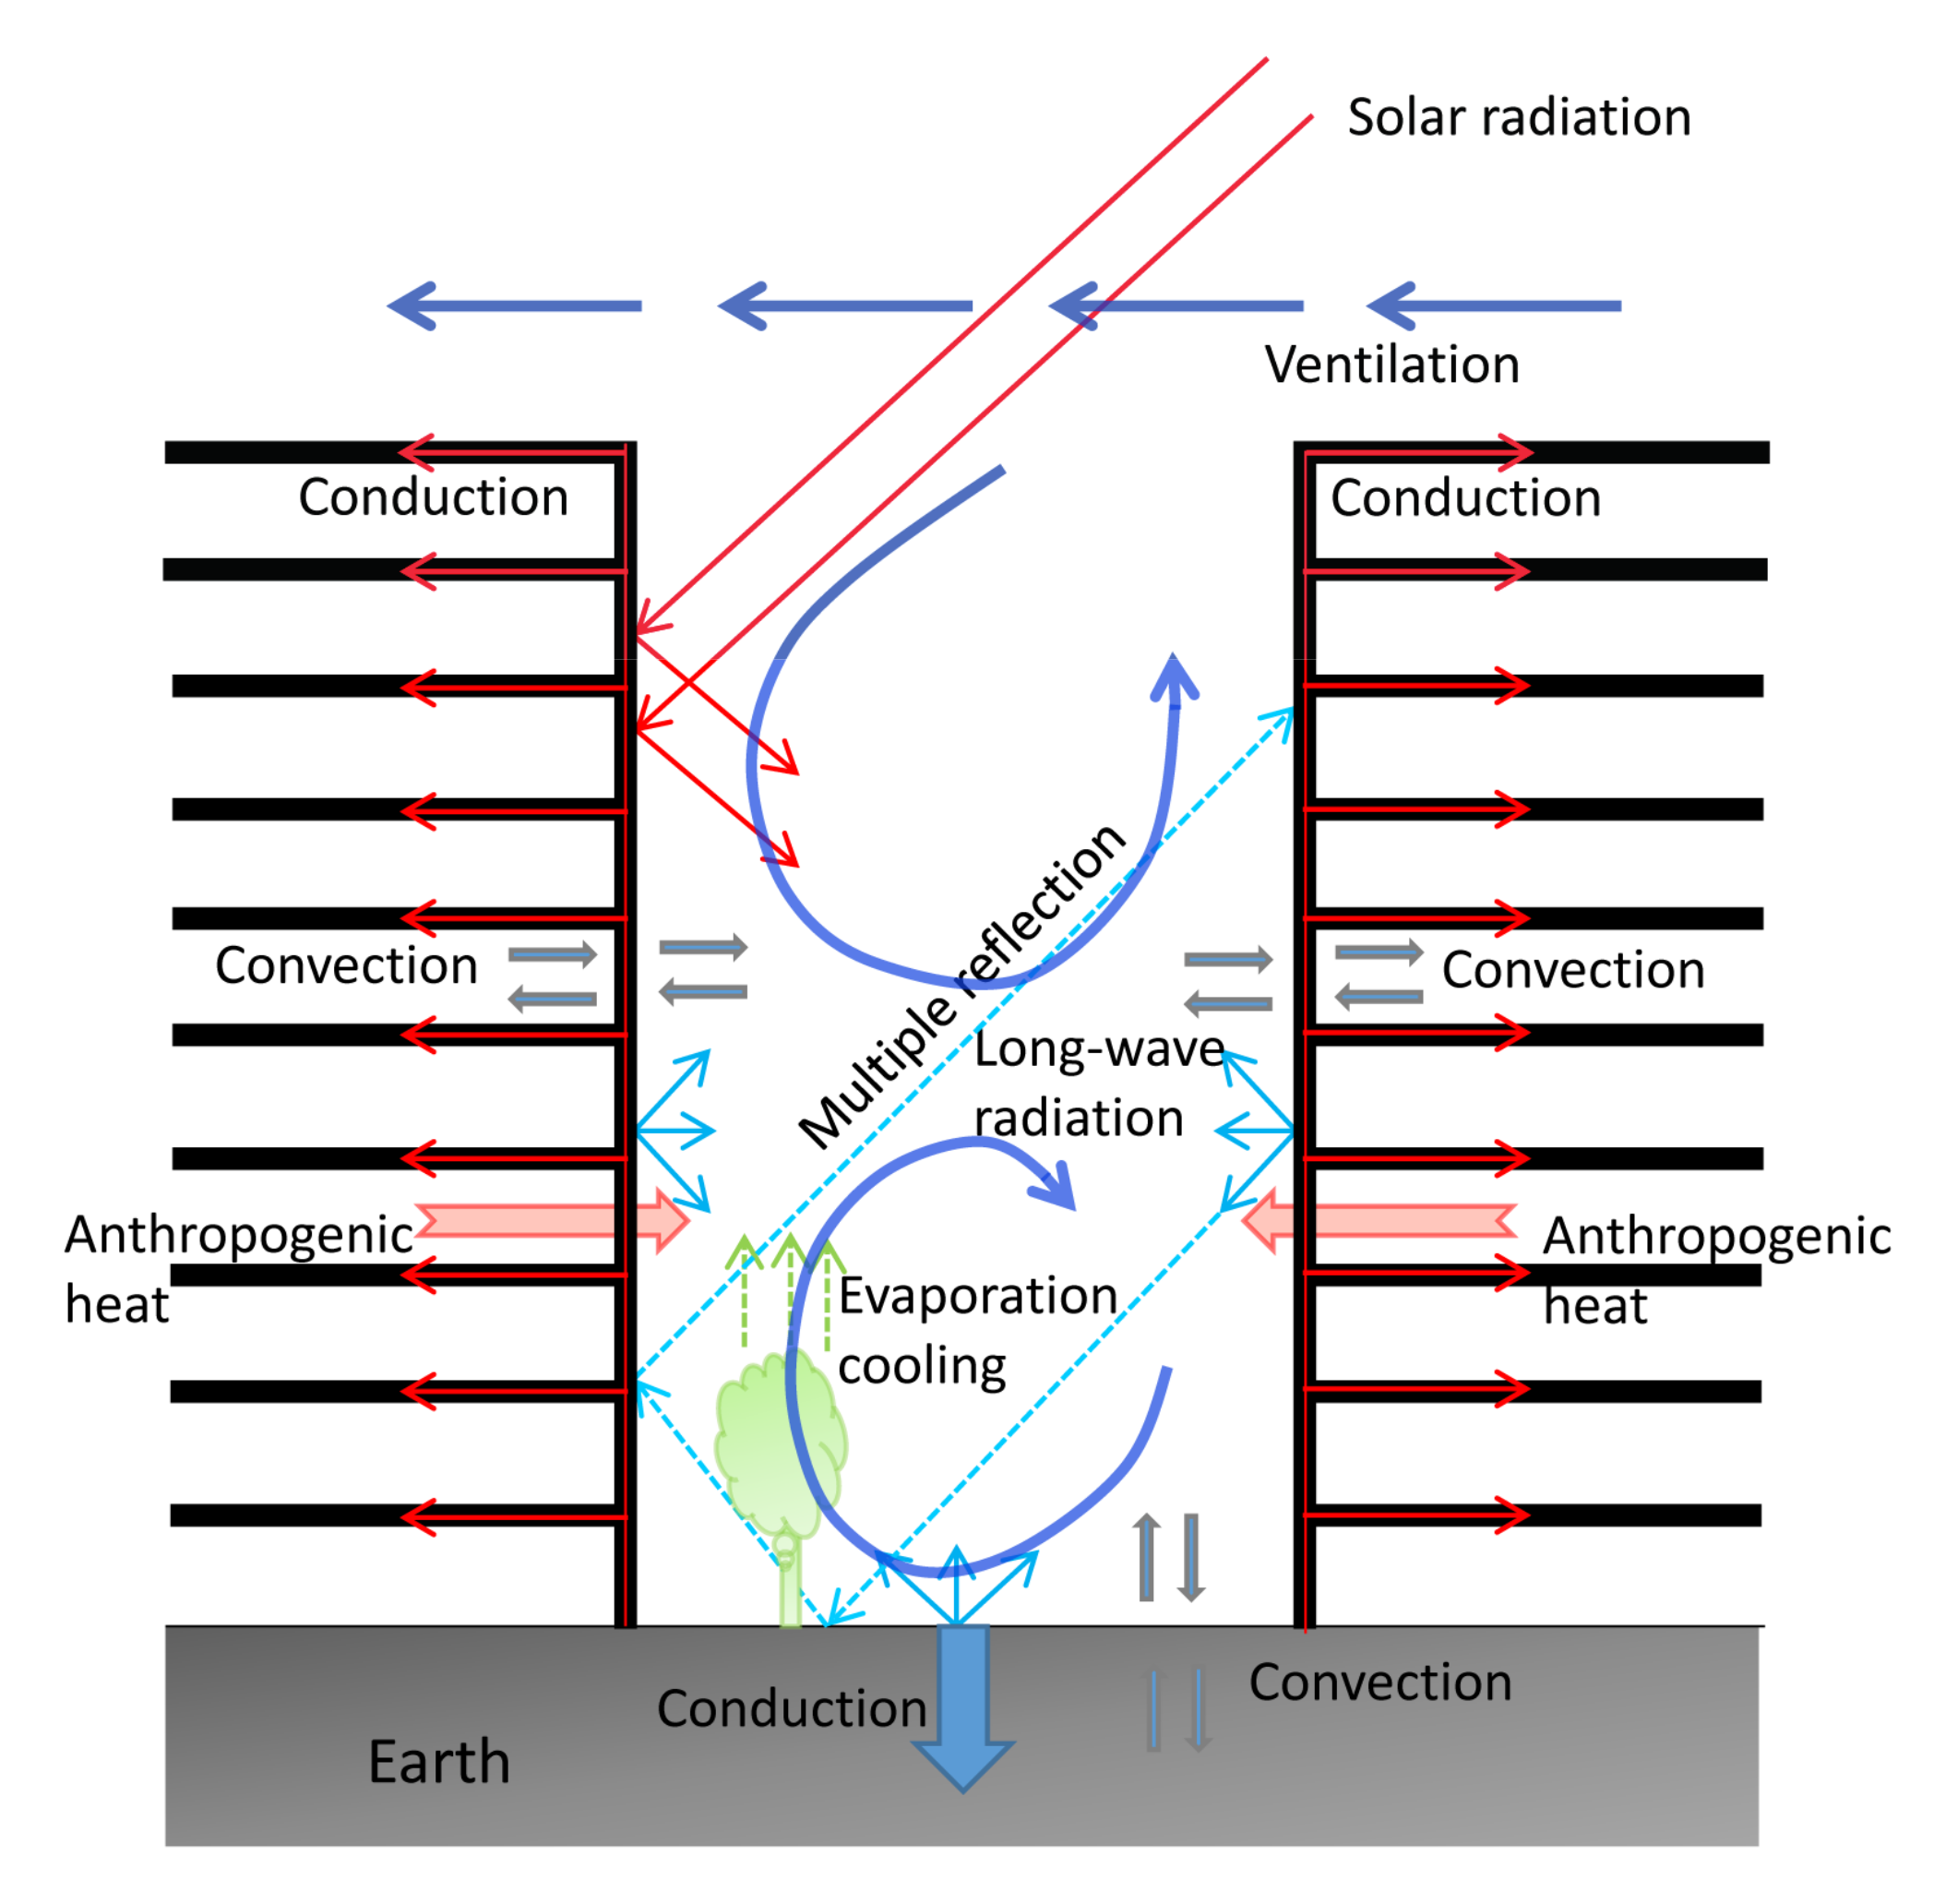
For a surface–air system in an urban built environment, this means that all the energy gains from solar radiation (short-wave) or from anthropogenic heat go somewhere by energy losses in one of three ways, including [15,17,26] (1) convection, to warm up the air in the form of sensible heat (long-wave); (2) evaporation (heats the water in the system) and transpiration (water transpires from vegetation) in the form of latent heat; and (3) net energy transferred to other systems (net horizontal heat advection), or by energy stored in the opaque elements (buildings, roads, etc.) (Figure 1). The energy balance equation can be written as (2) [21,25]:
Qr + QT = QE + QL + QS + QA
Qr—net radiative flux
QT—anthropogenic heat
QE—convective (or turbulent) sensible heat flux
QL—latent heat flux
QS—stored energy
QA—net horizontal heat advection
A detailed illustration of the energy fluxes in the urban environment is shown in Figure 2, which displays how it absorbs and dissipates heat. An explanation of how each component in the energy balance process can be affected by the built environment is presented in the following sub-sections.
3.1. Net Radiation
Net radiation can be described by the following Equation (3), representing four separate radiation processes at the urban surface [26]:
Net radiation = Incoming solar − Reflected solar + Atmospheric radiation − Surface radiation
Incoming solar represents the short-wave radiation emitted from the sun, which varies according to latitude, season, time of the day, clouds, etc. [25]. It includes direct short-wave radiation (solar rays directly from the sun) and diffuse short-wave radiation (solar radiation reflected from clouds and dust particles). Reflected solar is the short-wave radiation reflected from an urban surface and is determined by the solar reflectivity of surface material. Surface albedo is used to define this material characteristic by many researchers. Atmospheric radiation is long-wave energy flux emitted by particles from the sky to urban surfaces on the ground. The energy emitted rises with air temperature and the number of air particulates [21]. Surface radiation represents the long-wave radiation emitted from urban surfaces and is mainly governed by the thermal emittance and surface temperature of the urban material. The higher the thermal emittance and surface temperature the more the energy radiated from the surface [26].
Net radiation is the primary energy source in the urban canopy layer, in which the amount of incoming solar depends on the season, time in the daily cycle, latitude, solar position, and angle. Incoming solar and atmospheric radiation are non-controllable for a specific city from an urban planning and design perspective, while the reflection of short-wave radiation and the thermal emittance of surface material can be manipulated during the design process. For reflected solar, the surface albedo of the building material and urban geometry determines the reflection proportion of incoming solar radiation. The albedo values of building materials vary within a wide range, from 0.05 for dark asphalt (usually used for road paving), through 0.1–0.35 for concrete (usually used for building structure and envelope) to 0.8 for whitewashed roofs [25]. Albedo values for plant coverage over natural surfaces also exhibit variations according to species, sizes and arrangement styles, ranging from 0.07 to 0.3 [25]. It shows that, with the strategic selection of building materials, surface albedo in urban areas may be higher than natural surfaces, reflecting more short-wave radiation. Considering urban geometry, this affects radiation intake in two seemingly contradictory ways [25]: (1) the high variation of building heights leads to lower urban albedo, representing that more radiation is trapped within urban systems through multiple reflections between building facets; (2) increasing building height (deep urban canyon) prevents radiative flux from reaching to the street level. For surface radiation, the energy radiated from a surface itself is mainly decided by the temperature of the surface and its surroundings [26].
A high concentration of urban population and daily activities causes increasingly severe air pollution, resulting in increasing numbers of air particles, which also affects thermal balance in two contradictory ways. On one hand, air pollutants reduce incoming solar radiation that reaches the urban surface [27]. In industrial cities, sunshine duration can be decreased by up to 20% [20]. On the other hand, since aerosol pollutants block convective cooling in the form of long-wave radiation and absorb more heat, the air temperature is raised through the greenhouse effect, which contributes to the source side of the balance equation as atmospheric radiation.
3.2. Anthropogenic Heat
Anthropogenic heat is generated by human daily activities, coming from heating or cooling buildings, automobile heat rejection, industrial and manufacturing activities, etc. Anthropogenic heat is affected by per capita energy use, population density, the climate, the degree and type of industrial activities and the type of urban transport system [25]. Anthropogenic heat exhibits temporal and spatial variations in metropolitan areas [15,25]. Seasonally, requirements for energy consumption in winter greatly differ from those in summer. Diurnally, activities in residential and office areas show regular change during daytime and nighttime, resulting in daily variation of heat release. Spatially, the intensity of anthropogenic heat is highly related to urban density level. Heat generated from human activities in metropolitan areas substantially exceeds rural areas.
3.3. Sensible Heat Flux
Sensible heat flux is the main mechanism for dissipating radiative energy in urban environments [17]. In the urban built environment, sensible heat exchange can be affected by urban geometry, wind flow and the temperature difference between the air and the adjacent surfaces [25]. The latter two factors are also governed by urban geometry. A measurement carried in an urban canyon in mid-latitudes in fine summer weather indicated that canyon geometry and orientation hold key importance for the timing and magnitude of the surface energy balances of canyon walls and floor [28]. During the daytime, a large amount of radiation in the urban canyon is captured by building walls and urban structures through multiple reflections between urban facets, while the natural ground in the rural area is directly heated up by solar radiation. This leads to the cool island effect in the urban area. Erell and Williamson [29] conducted measurements in two urban street canyons and two reference sites and found that there is a frequent occurrence of a daytime cool island during summer. At nighttime, the air temperature in the city center could be higher. On one hand, radiation in a deep urban canyon cannot escape into the air easily due to high obstructions by the buildings, leading to less heat loss by radiative cooling. On the other hand, there is increasing long-wave radiation from building surfaces to heat up the adjacent air due to the higher temperature difference between surfaces and the adjacent air. Therefore, high urban heat island intensity during the nighttime has been recorded in many cities. Wind flow within the canyon affects sensible heat flux of different urban facets since air velocity influences turbulent mixing and thus reduces the temperature difference between urban surfaces [25,30].
3.4. Latent Heat Flux
Thermal properties and the moisture availability of urban surfaces determine the proportion of latent heat flux, which can be predicted by the vegetated ratio of a city [25]. Energy can be lost in the form of latent heat flux by two effects: evaporation (heats the water in the system) and transpiration (water transpires from vegetation). These two processes usually happen simultaneously and are commonly referred to as evapotranspiration. There are much more vegetated surfaces in suburban districts than downtown, which could lead to a major difference in instant energy lost by evapotranspiration in the daytime. Without sufficient energy being lost in the form of latent heat flux in urban areas, the incoming energy stored in building mass and ground will be dissipated as sensible heat flux at night, thus increasing the adjacent air temperature. In consideration of the influence of water availability on energy balance, Barradas, Tejeda-Martínez, and Jáuregui [31] launched a series of energy flux measurements in Mexico City, and it was found that, during the dry season, net radiation was primarily dissipated in the form of sensible (69%) and latent heat (25%). It also indicated that seasonal differences were due to moisture change and plant phenology.
3.5. Stored Energy
Stored energy, as an important component of surface energy balance, could be up to half of daytime net radiation [25]. The thermal properties of the surface material are important for the absorption, storage, and dissipation of radiant energy, which are referred to as thermal conductivity and heat capacity. Materials with high thermal conductivity are more capable of conducting heat to their substrate. Materials with higher heat capacity tend to experience smaller temperature variations and store more heat when receiving large amounts of energy. The concept of thermal admittance is introduced to combine these two material properties. The common values of thermal admittance for different surfaces vary substantially, from 300 Jm−2s1/2K−1 for dry peat soil and foamed concrete to 2500 Jm−2s1/2K−1 for wet sandy loam or dense concrete [25]. The thermal property difference also leads to a temporal variation of the time lag for heat dissipation. Building envelopes and urban structures usually store more heat than natural surfaces in the daytime and then dissipate more energy several hours after sunset, which results in the formation of urban heat island effect at nighttime. Even within urban environments, urban facets show remarkable surface temperature difference due to the high variation of envelope materials, daylight incidence and sunshine duration.
Aside from thermal property differences, urban geometry is another important factor determining storage heat flux. Research shows that canyon orientation has a limited effect on overall heat stored, although it affects each urban facet attributable to varying sunshine exposure. Aspect ratio holds key importance for energy flux in urban canyons. A higher aspect ratio (deeper canyon) leads to a larger net radiation, a larger proportion of the stored solar flux, and a greater time lag from peak radiation to maximum storage rate [25].
3.6. Horizontal Heat Advection
Horizontal heat advection represents the advective heat transferred in the urban environment. Heat advection is caused by great heterogeneity in urban land uses. The building density and green area ratio of different urban districts vary substantially, resulting in different thermal balance and air temperature distribution patterns. It creates relatively hot and cool spots in the urban environment, which induces exchange of heat and moisture between them [25,32,33]. Research indicates that, in metropolitan areas, this heat flux is negligible, but it might be obvious at the boundary between urban and rural areas [17].
4. Urban Design and Outdoor Thermal Performance
Urban morphology is constituted by building dimensions and spacing, the characteristics of artificial surfaces and the amount of green space [25]. It is the main force with respect to governing the micro-scale thermal environment, by deciding the solar radiation availability (radiant exchange) and affecting wind flow pattern. There are three aspects to evaluate the influence of urban morphology on microclimate variations: shading potential of urban mass (especially for the tropical cities), urban ventilation and urban thermal reflectivity. A series of urban planning and design parameters are reviewed and analyzed based on these aspects in the following subsections.
4.1. Urban Geometry Descriptors
4.1.1. Land Use Intensity Descriptors
Construction density (building coverage/density, floor area ratio) is most widely adopted to describe land use intensity. The relationship between urban density and sustainability has been investigated in many studies. There has not been a consensus on whether high-density urban forms (compact city) could lead to less energy consumption and fewer carbon emissions for the whole city. The compact city approach is defined as aiming “to increase built area and residential population densities; to intensify urban economic, social and cultural activities and to manipulate urban size, form and structure and settlement systems in pursuit of the environmental, social and global sustainability benefits derived from the concentration of urban functions” [34]. Usually, increasing building density results in deep and enclosed urban canyons, which exacerbate micro-scale urban climate [25]. Firstly, more solar radiation would be trapped due to multiple reflections within deep urban canyons. Secondly, less long-wave radiation can escape into the sky due to constrained visible fraction. Thirdly, dense urban structure blocks wind flow within the urban canopy layer and reduces ventilation cooling. This is supported by several studies. Perini and Magliocco [24] testified that higher density caused higher air temperature in Italy. A study conducted in Szeged, Hungary found that densely built-up areas had higher annual and monthly mean and minimum air temperatures than structurally open and more vegetated areas [35]. However, in an experimental study conducted in Hong Kong (a typical compact city), it was found that sites with higher density experienced lower air temperature [36]. A study in Toronto, Canada also found that the high-rise area was cooler than middle-rise and low-rise areas, since deep urban canyons could provide more shading and reduce direct solar radiation during daytime [37]. Some researchers [38] claimed that the compact urban form is the best approach to achieve sustainable urban development, since densification of the population and urban functions leads to a highly effective public transport system, which accounts for a great part of urban total energy consumption.
Apart from building density, there are some other parameters used in studies to address land use intensity. Petralli et al. [39] investigated the influence of several urban planning indicators (including street cover ratio, building cover ratio, and building volume density) on summer temperature. They discovered that a 10% increase in building cover ratio resulted in raising the temperature from 0.30 °C to 0.66 °C.
Using urban density as a sole indicator to evaluate the urban physical environment has its limitations. The same density value may correspond to various building configurations. Two project sites with the same building cover ratio and different building heights, or the same floor area ratio (FAR), would have different microclimatic conditions. Sad De Assis and Barros Frota [40] studied the influence of urban forms (land use, typology, and building configurations) on climatic change and they found that dense and low-rise urban areas showed larger thermal amplitude than high-rise ones. Therefore, to better define urban physical characteristics, urban density should be combined with other parameters that can accurately quantify building geometry in both horizontal and vertical dimensions.
4.1.2. Built Form Descriptors
A proportion of input solar radiation is directly reflected back to the atmosphere, which is usually evaluated and quantified by the concept of albedo. Urban albedo represents the ability of the city to reflect the radiation. For low and mid-latitude cities where the thermal stress in summer is the most serious problem, high urban albedo is suggested as the most principal and feasible strategy for UHI mitigation [41,42]. Urban albedo is not only determined by the reflectivity of each single construction material, but also by the three-dimensional arrangement of the urban form [25]. Based on previous studies, there are three characteristics of urban geometry confirmed to be influential on urban albedo: plan area density, building height and uniformity of building height [25,43]. Urban albedo is high in both high- and low-density urban forms, since a large part of the radiation is reflected by roof surfaces in the dense area and by road surfaces in the low-density area. Medium-density configurations (e.g., building height/street width = 2) are verified to exhibit the lowest albedo.
Efforts have been made to assess the effect of urban geometry on albedo. The albedo calculation model was developed to calculate albedos based on three-dimensional urban structures, which took into account urban configuration, changes of solar positions, effects of multiple reflections and shading [44]. The effect of deep canyons on shading and albedo seems contradictory, and the balance between them should be analyzed based on a better quantification measure of urban geometry. In order to identify a clear and direct correlation between urban geometric indicators and urban climate, it would be helpful to explore more elaborate approaches to define the urban geometry.
Studies have been conducted to assess the influence of building height on the microclimate. For a given street width, increasing building height results in deeper urban canyons, which intensify mutual solar reflection and absorption between building surfaces and thus reduce urban albedo. Taller buildings usually are not the desirable choice for renovation at a given urban texture based on general knowledge. However, in a study conducted in Singapore to investigate the effect of building geometry on wind flow and temperature distribution within urban canyons, Priyadarsini and Wong [45] adopted a series of parametric studies and found that strategically placing a few high-rise towers within a canyon would increase wind velocity at the pedestrian level and thus reduce air temperature. In the scenario of wind flow from the parallel direction, the wind speed was raised by up to 90% and the temperature decreased by up to 1 °C. For perpendicular flow scenario, the tower effect was even larger, with a ten-fold increase in wind speed and 1.1 °C reduction in air temperature. This is also supported by a study conducted in Toronto, Canada to examine the influence of newly built high-rise building on an open space, which found that the wind speed on the site increased along with lower air temperature [46].
Building height variation has also been analyzed in a more general context. However, contradictory implications on how this affects microclimate have been generated. For urban radiant exchange, some have pointed out that uniform building heights would lead to higher albedo, attributed to less possibility of impeding reflective radiation from other surfaces, while buildings with different roof heights would create a rougher (less reflective) overall surface and absorb more solar radiation [25]. However, building height variation was found to be an important strategy for better urban wind environment. Based on a numerical study, Chan et al. [47] concluded that tall buildings did not necessarily exist as obstacles and non-uniformity in building heights could help to promote better urban ventilation and cooler environment.
Building form affects the heat flux in the urban environment. The height to floor area ratio is used by Knowles [48] to evaluate the thermal mass of the built environment, and he reported that it could influence UHI intensity. In research conducted in Hong Kong [49], it was found that an increase in height to floor area ratio by 10% would decrease nocturnal UHI by 0.3%. Building setback from the street line, separation between the buildings with long facades and building permeability are found to be significant for improving the pedestrian-level wind environment, which helps to cool the outdoor air in summer [50].
There are also many other morphological indicators identified by researchers in climatological research. Adolphe [51] investigated the influence of urban configuration on outdoor climate by identifying several morphological parameters based on a simplified spatial model at the district and city scale. The morphological indicators included density, rugosity, porosity, sinuosity, occlusivity, compacity, contiguity, solar admittance, and mineralization. Based on this research, Edussuriya et al. [52] refined some of these indicators and proposed additional parameters for the study on the relationship between urban morphology and air quality in Hong Kong. Twenty-one morphological variables were identified and calculated at the street and district levels, and the results showed that only six variables (complete aspect ratio, occlusivity, roughness height, zero-plane displacement height, total building volume/number of buildings and standard deviation of height) presented considerable variations at the district level. It was suggested that air quality in Hong Kong is distinguishable by in-site fabrics instead of district-level variables. The problem is that some of the aforementioned variables are hard to calculate for realistic and complex spatial models, which makes it impossible for application in existing urban environment evaluation. In a study to analyze urban morphology in Tokyo, Yoshida and Omae [53] chose a 2 km × 2 km area as their study site. City blocks were used by the authors as spatial units for morphological variable calculation. The variables investigated were surface area per projected area, volume per projected area, building to land ratio, mean height of buildings, surface area of buildings per unit volume of buildings and mean volume of buildings. These variables reflect the fabric of neighborhood blocks and thus hold key importance for micro-scale morphological research.
4.1.3. Canyon Geometry Descriptors
To deal with the complex urban form, simple model geometries are needed to transfer specific insights into generalized conclusions. The term “urban canyon” was introduced to describe the street geometry by Oke [54]. An urban canyon is a canyon (a deep narrow valley) formed in a street by two rows of tall buildings. It can be defined by three parameters: H, the mean height of the buildings along the two sides of the street in the canyon; W, the canyon width, L, the canyon length. Additionally, canyon axis orientation (street orientation) plays an important role in governing micro-climate in the urban canyon. Based on these parameters, several geometric indicators are proposed to quantify canyon geometry, including aspect ratio (height to width ratio) H/W, length to width ratio L/W and building density [17]. Aspect ratio and street orientation are most often used by researchers when investigating the correlation between street geometry and urban climate. These two indicators mainly control the amount of solar radiation reaching into an urban canyon, which determines the radiant energy flux and storage. They also affect wind flow pattern and thus the thermal environment within the urban canyon.
Aspect Ratio
There is no international standard value for optimal aspect ratio, which could be suitable for cities with different climate backgrounds. Oke indicated that the ideal aspect ratio for mid-latitude cities is 0.4–0.6, which could assure an optimal microclimate in the following ways: alleviating UHI in summer; preserving heat in winter; promoting appropriate air flow for comfort and pollutant dispersion [55].
There have been many studies which have evaluated the impacts of canyon geometry on solar access, wind flow and temperature distribution in terms of aspect ratio. By evaluating the exchange of diffuse radiation within an urban canyon, Harman et al. [56] found that the averaged net radiative flux density from canyon facades decreases monotonically as the canyon aspect ratio increases. A climate measurement in Athens, Greece showed that a clear increase in cooling rates can be observed when decreasing aspect ratios [57]. Goh and Chang [58] measured 17 estates in Singapore and conducted a correlation study between aspect ratio and nocturnal heat island intensities. Their statistical analysis results showed that the median aspect ratio can positively affect heat island intensities. Computational fluid dynamic (CFD) simulations were also conducted in Singapore and the results showed that applying an ideal H/W ratio for urban canyons would increase the wind speed by up to 35% and cool the air by up to 0.7 °C [59].
However, some studies pointed out that a higher aspect ratio may not necessarily lead to a worse microclimate. Andreou and Axarli [60] conducted extensive measurements in two sites in Tinos, Greece (Mediterranean climate with warm, dry summers and mild, wet winters). One of the sites was a traditional settlement, characterized by high density, high aspect ratio (value: 2–4), while the other being a newly built site with a lower aspect ratio (value: 0.7–0.9). Results indicated that a higher aspect ratio led to smaller variations in surface temperatures, and lower air temperatures. Another research project was conducted in hot and dry climates in Fez, Morocco [61]. Thermal comfort conditions were compared between an extremely deep (aspect ratio: 9.7) and a shallow street canyon (aspect ratio: 0.6). Results showed that it was comfortable in the deeper canyon while very uncomfortable in the shallow one in summer. However, in winter, the shallow canyon was more comfortable, since more solar radiation could reach the ground. It was suggested that a compact urban design with a very deep canyon would be preferred in hot and dry climates.
Street Orientation
It is generally accepted that street orientation has an essential influence on the variations of solar access and thus surface temperatures between different surfaces [62]. In addition to surface temperature, the effect of street orientation on air temperature has also been investigated by researchers. Nakamura and Oke [63] observed the temporal development of the spatial distribution of air and surface temperature in an east-west oriented urban canyon (H/W = 1.06) in Japan. It was reported that air temperature differences in the daytime are largest on the north side since it is directly irradiated. However, the roof-canyon air temperature variations are small (usually < 0.5 °C). Erell and Williamson [29] also discovered a noticeable difference in air temperature between a north-south oriented street canyon and an east-west oriented street. However, experiments in Greece showed that there were no observable air temperature variations caused by street orientation, while considerable differences of surface temperatures were recorded on vertical walls with varying orientations for both summer and winter [60].
The effect of canyon geometry on climate variation in terms of both aspect ratio and street orientation have been the research objects in many studies [64,65,66]. Numerous experiments have established that there is a significant relationship between urban geometry and canyon surface temperatures [62,67], while the correlation between urban geometry and air temperatures is relatively weak [60]. This can be explained by the fact that air temperature distribution is not only affected by urban geometry but also by the combined effect of surface characteristics and air mixing rate, etc. [17].
4.1.4. Space Enclosure Descriptors
In urban climate studies, urban geometry has been investigated in a view factor framework for decades. The most commonly used 3-d indicator is the sky view factor (SVF). SVF represents the fraction of the overlying hemisphere occupied by the sky and it can be calculated by hemispheric pictures taken by cameras with fisheye lenses [54]. SVF is usually employed to reflect street geometry and land use characteristics. It provides a scientific approach to quantify urban geometric features, especially for heterogeneous spaces.
There has been a seemingly contradictory effect of SVF on climate in terms of time and season. SVF controls the amount of global radiation that can reach a specific point in an urban canyon in the daytime and also represents the probability of radiative cooling during nighttime. A lower SVF represents more shading on the ground and a cooler environment in the daytime, but more radiation trapped at the nighttime [68]. Seasonally, a lower SVF impedes solar radiation and reduces space cooling energy consumption in summer; however, in winter, it would increase energy used for lighting and space heating. In research conducted in Taiwan, it was pointed out that a high SVF would cause thermal discomfort in summer, while a low SVF would cause discomfort in winter [69,70].
Geographically, cities located in low, medium and high latitudes require different amounts of global radiation for thermal comfort and low energy load. There is no universal standard for the threshold of SVF. In a high-rise, high-density city such as Hong Kong, a given location with an SVF value larger than 0.3 would be considered relatively open space, which apparently differs from European cities [49]. Therefore, suggestions for an optimal SVF range should be made based on research in each specific city.
Surface temperature has been correlated with SVF in many studies, and the results show a clear relationship between them. Bärring et al. [71] reported that increasing SVF led to a decrease in surface temperature in Malmö, Sweden. However, consensus on whether there is a clear correlation between air temperature and SVF has not been achieved. Yamashita et al. [72] reported a clear relationship between air temperature and SVF in several cities in Japan. In a study in Hong Kong, Giridharan et al. [49] identified SVF as an important parameter for both daytime and nocturnal UHI. They concluded that increases in SVF by 10% would raise daytime UHI by 2.1%, and decrease nocturnal UHI by 0.3%. Since its effect on daytime climate was larger than nighttime, design strategies were suggested to focus on manipulating street geometry to provide sufficient shading for the environment. But in an empirical study in Goteborg, Eliasson [73] reported that there is no statistically significant relationship between the air temperature and SVF. This may be because the air temperature is regulated by more complex mechanisms in urban environments.
4.1.5. Descriptive Indicators
In addition to the aforementioned numeric parameters, building layout, as a descriptive indicator, is commonly used to be correlated with climate patterns in climatological research. Quantitative research on building layout and outdoor climate have been conducted either by case studies or numeric simulations based on simplified spatial models [74]. Middel et al. [75] compared five neighborhoods with different layouts in semi-arid Phoenix, Arizona, in terms of mid-afternoon air temperature, ventilation, surface temperature, and shading via using ENVI-met. Results showed that, in the mid-afternoon, dense building layouts could create local cool islands. Okeil [76] proposed the residential solar block (RSB) as an energy efficient building layout for the context of Abu Dhabi (hot desert climate), rather than the linear urban form and block urban form. The RSB can increase winter solar radiation, which allows the maximum potential of passive utilization of solar energy. It can also ameliorate UHI by increased air flow.
Leslie Martin and his team at Cambridge University published several important papers in the late 1960s, trying to answer the question “What building forms make the best use of land” by identifying and comparing six simplified archetypal forms in terms of built potential (ratio of the building floor area to the site area) and daylight availability. Results showed that courtyards perform best, rather than pavilions. This analysis was further extended by Ratti et al. [77], through conducting comparative studies in hot-arid climate based on a series of previous research. These forms were examined in a real urban case study and compared in terms of several environmental parameters, including surface to volume ratios, shadow densities, daylight accessibility and view factors. It was concluded that the courtyard configuration performs better than pavilion types in the hot-arid climates. These studies investigated the energy load caused by the immediate urban environment, by which the implication of how these generic building forms affected urban microclimate can be revealed.
4.2. Urban Vegetation Descriptors
Urban vegetation has been proposed as a principal approach for improving the outdoor thermal environment and air quality, in the form of parks, road trees, green roofs, etc. [22,78]. Vegetation differs from urban surface materials in terms of exchanges of heat, mass, and momentum with the atmosphere [79]. The effect of vegetation on microclimate varies with time, season and urban built environment [24,80]. Vegetation affects urban climate through several processes. Firstly, evapotranspiration helps to lose heat during the transfer from water to vapor. This process can influence the radiative flux by increasing latent heat flux and decreasing storage and turbulent sensible heat flux [81]. Secondly, vegetation can provide shading for building surfaces and canyon ground, while it would also intercept the dissipation of long-wave radiation from the ground to the atmosphere [82]. Last but not least, vegetation can help to reduce undesirable air flow when strategically arranged.
Research showed that the cooling effect of vegetation on surface temperature is larger than on air temperature [83,84,85,86,87,88,89]. Compared with paved asphalt roads and squares, grass and vegetative ground cover play an important role in improving thermal comfort by maintaining low surface temperature [90]. First of all, most of the energy absorbed by well-irrigated grass would be converted into latent heat by the mechanism of evapotranspiration, which would lead to a substantial reduction in surface temperature. Moreover, the albedo value of grass (0.20–0.25) is smaller than construction materials painted in a light color, which means that it would reflect less radiation to the human body and thus result in less thermal stress [25].
It has been indicated that urban climate is highly related to the quantity and types of vegetation [91]. Therefore, green cover ratio, tree cover ratio, and lawn cover ratio are usually adopted to quantify the vegetation in urban climate research, which are normally found to be negatively related with air temperature [39,92,93]. Among all vegetation types, trees are considered more influential on air temperature reduction than grass, since tree canopy can provide shading in addition to the evapotranspiration effect [6,36,94,95]. The cooling effect of trees depends on the species and canopy size. The tree view factor (TVF) has been used to evaluate the shading ability provided by trees, which is calculated, similarly to the sky view factor, by WinSCANOPY software (a digital image analyser for canopy and solar radiations analysis, developed by Regent Instruments Inc., Québec, QC, Canada) using sky view images taken by a camera with a fisheye lens [6]. TVF is defined as the fraction occupied by vegetation canopy of the overlying hemisphere. Therefore, it is suggested that the implementation of grass planting should be combined with trees [96,97]. Shashua-Bar et al. [98] compared different combinations of mature trees, grass, overhead shading mesh and paving in a hot-arid region. It was found that grass can help to reduce the duration of hot periods and it showed even more pronounced effect when combining with trees, making the place comfortable at all hours.
However, some researchers pointed out that the effect of trees on air temperature reduction right under them may be overestimated [25]. It is obvious that the thermal comfort condition under trees is much better than the area exposed to extensive sunshine, since the radiative fluxes under trees are substantially reduced due to canopy shading [99]. However, the air temperature between these two locations may not show much difference because of air turbulence within short distances.
4.3. Combined Effect of Design Descriptors
Urban geometry and vegetation have been found to be most critical in affecting the urban thermal environment. There have been a number of research projects investigating the mutual and combined effect of these two aspects, intending to establish a systematic design approach with respect to the comfortable urban environment (Table 1). The performance of vegetation can be influenced by the urban geometry and background climate. As indicated by Dimoudi and Nikolopoulou [100] and Shashua-Bar et al. [101], the cooling effect of vegetation could alter when the aspect ratio and wind speed change. Measurements in Hong Kong showed that a higher cooling effect of trees can be observed at high-SVF sites than at low-SVF sites [102]. Perini and Magliocco [24] discovered that cooling effect of vegetation is higher in a street canyon with taller buildings, or in a climate with higher temperature and lower relative humidity. Andreou [103] found that trees provide a more considerable cooling effect on E–W orientated streets than on N–S streets.
5. Conclusions
Although urban design and architectural design professionals have taken climate into consideration since early constructions in the human history, the design decisions were mostly made based on personal experiences and a common understanding of local climate effects accumulated from generation to generation. They tended to design buildings and the urban environment as a shelter from the harsh climate conditions to create comfortable and energy-efficient indoor environments without much consideration for the negative influence of constructions on the outdoor climate, which would, in turn, affect the thermal performance of buildings. Urban climatology is dedicated to understanding the interactions between urban climate and urban construction area. However, most researchers in this area are from disciplines of geography, environmental engineering, atmospheric science, etc., which leads to problems including [112] the fact that the outcome cannot be easily translated into specific design guidelines that can be readily utilized in architectural and urban design practices; and that the research is mainly focused on a subtle topic instead of a systematic approach. Therefore, the efforts to transform urban climatic knowledge from the fundamental thermophysics knowledge stage to applied science have increased noticeably. Urban climate studies generally turn into interdisciplinary research, engaging rising contributions from architects and urban designers.
Prescribed urban planning regulations and design guidelines have been enacted in most countries and cities in order to control the physical structure and urban environment. These regulations and guidelines include a broad range of design measures, from large-scale measures, such as zoning regulation, the arrangement of infrastructures, urban landscape, etc., to small-scale ones such as building form, building façade and roof, construction material, etc. In these documents, urban design parameters are frequently adopted to regulate the design features in a parametric approach, such as building density, building height, green coverage ratio, etc. Urban design parameters are important design instruments that are familiar to practice professionals. However, urban planning and design regulations are rarely established based on the consideration of improving urban microclimate. The review of urban climate studies on the urban design parameters in the present paper may help to identify the potential of adding new parametric measures in the local urban design guidelines to address urban climate enhancement.
In order to create a thermally comfortable urban environment, design decisions made by urban designers and architects should be based on a systematic understanding of the potential impact of urban design characteristics on outdoor microclimate. This paper presents a literature review on urban design indicators addressing the impact of urban geometry and vegetation on the outdoor thermal environment at pedestrian level, as urban geometry and vegetation have been regarded as the most influential urban design factors that affect outdoor microclimate. The thermal balance concept is first introduced to elaborate how each component of energy fluxes is affected by urban built environment, which helps to explore the underlying thermophysical mechanisms of how urban design modifies the outdoor thermal environment. Based on the basic thermal balance equation, schematic diagrams of the energy fluxes in the urban built environment are provided to show the energy exchange between buildings, outdoor space and the ground. A detailed elaboration of the impact of urban environment on each energy flux is presented. The literature on numerous urban design descriptors addressing urban geometric characteristics is categorized into five groups in this paper according to the design feature that the parameters entail, including land use intensity, building form, canyon geometry, space enclosure and descriptive characteristics. The literature on urban vegetation descriptors is reviewed in one group, followed by the combined effect of urban geometry and vegetation.
This paper provides a basic framework for future studies that aim to investigate systematic, thermally comfortable urban design strategies as important urban design descriptors, related to urban geometry and vegetation which have been identified and reviewed. This paper compares the different studies of each design indicator conducted in different urban environments and climate grounds. It shows that the impact of urban design parameters on the thermal environment varies with time, season, local climate, and urban contexts. It confirms the necessity of conducting local urban design and climate research, in order to facilitate effective climate responsive urban design. Contradictory impacts often occur between daytime and nighttime, or different seasons, which requires that trade-offs be achieved when proposing design strategies. However, the limitation of this paper should be addressed. The literature reviewed in this paper mainly focused on the pedestrian level urban thermal environment indicated by surface and air temperature. This paper could serve as a basis for future studies on outdoor thermal comfort, which is a much more complicated issue and entails more factors of climatic, physiological, and behavioral characteristics.
Acknowledgments
The authors wish to acknowledge the financial support from the University of Hong Kong UDF 11420-00600050-91430-14300-171-01 and HKU Seed Fund for Applied Research Project No. 0400769.06080.01100.301.01.
Author Contributions
Pingying Lin conceived and designed the review; Pingying Lin and Zhonghua Gou conducted the literature review; Pingying Lin and Stephen Siu-Yu Lau contributed the analysis; Pingying Lin and Hao Qin wrote the paper.
Conflicts of Interest
The authors declare no conflict of interest.
References
- Emmanuel, R.; Krüger, E. Urban heat island and its impact on climate change resilience in a shrinking city: The case of Glasgow, UK. Build. Environ. 2012, 53, 137–149. [Google Scholar] [CrossRef]
- Krüger, E.; Drach, P.; Emmanuel, R.; Corbella, O. Urban heat island and differences in outdoor comfort levels in Glasgow, UK. Theor. Appl. Climatol. 2013, 112, 127–141. [Google Scholar] [CrossRef]
- Montávez, J.P.; Rodríguez, A.; Jiménez, J.I. A study of the urban heat island of Granada. Int. J. Climatol. 2000, 20, 899–911. [Google Scholar] [CrossRef]
- Jauregui, E. Heat island development in Mexico City. Atmos. Environ. 1997, 31, 3821–3831. [Google Scholar] [CrossRef]
- Giridharan, R.; Lau, S.S.Y.; Ganesan, S. Nocturnal heat island effect in urban residential developments of Hong Kong. Energy Build. 2005, 37, 964–971. [Google Scholar] [CrossRef]
- Yang, F.; Lau, S.S.Y.; Qian, F. Summertime heat island intensities in three high-rise housing quarters in inner-city Shanghai China: Building layout, density and greenery. Build. Environ. 2010, 45, 115–134. [Google Scholar] [CrossRef]
- Hassid, S.; Santamouris, M.; Papanikolaou, N.; Linardi, A.; Klitsikas, N.; Georgakis, C.; Assimakopoulos, D.N. Effect of the Athens heat island on air conditioning load. Energy Build. 2000, 32, 131–141. [Google Scholar] [CrossRef]
- Santamouris, M.; Cartalis, C.; Synnefa, A.; Kolokotsa, D. On the impact of urban heat island and global warming on the power demand and electricity consumption of buildings—A review. Energy Build. 2015, 98, 119–124. [Google Scholar] [CrossRef]
- Salvati, A.; Coch Roura, H.; Cecere, C. Assessing the urban heat island and its energy impact on residential buildings in Mediterranean climate: Barcelona case study. Energy Build. 2017, 146, 38–54. [Google Scholar] [CrossRef]
- Agarwal, M.; Tandon, A. Modeling of the urban heat island in the form of mesoscale wind and of its effect on air pollution dispersal. Appl. Math. Model. 2010, 34, 2520–2530. [Google Scholar] [CrossRef]
- Ward, K.; Lauf, S.; Kleinschmit, B.; Endlicher, W. Heat waves and urban heat islands in Europe: A review of relevant drivers. Sci. Total Environ. 2016, 569, 527–539. [Google Scholar] [CrossRef] [PubMed]
- Williams, S.; Nitschke, M.; Weinstein, P.; Pisaniello, D.L.; Parton, K.A.; Bi, P. The impact of summer temperatures and heatwaves on mortality and morbidity in Perth, Australia 1994–2008. Environ. Int. 2012, 40, 33–38. [Google Scholar] [CrossRef] [PubMed]
- Chan, E.Y.Y.; Goggins, W.B.; Kim, J.J.; Griffiths, S.M. A study of intracity variation of temperature-related mortality and socioeconomic status among the Chinese population in Hong Kong. J. Epidemiol. Community Health 2012, 66, 322–327. [Google Scholar] [CrossRef] [PubMed]
- Lowe, S.A. An energy and mortality impact assessment of the urban heat island in the US. Environ. Impact Assess. Rev. 2016, 56, 139–144. [Google Scholar] [CrossRef]
- Emmanuel, R. An Urban Approach to Climate-Sensitive Design: Strategies for the Tropics; Spon Press: London, UK, 2005. [Google Scholar]
- Ferrar, T.A. The Urban Costs of Climate Modification; Wiley: New York, NY, USA, 1976. [Google Scholar]
- Santamouris, M. Energy and Climate in the Urban Built Environment; James & James: London, UK, 2001. [Google Scholar]
- Rizwan, A.M.; Dennis, L.Y.C.; Liu, C. A review on the generation, determination and mitigation of Urban Heat Island. J. Environ. Sci. 2008, 20, 120–128. [Google Scholar] [CrossRef]
- Santamouris, M.; Kolokotsa, D. Urban Climate Mitigation Techniques; Taylor & Francis Ltd.: London, UK, 2016. [Google Scholar]
- Landsberg, H.E. The Urban Climate; Academic Press: New York, NY, USA, 1981. [Google Scholar]
- Oke, T.R. Boundary Layer Climate, 2nd ed.; Methuen: London, UK, 1987; ISBN 0415043190. [Google Scholar]
- Wong, N.H.; Chen, Y. Tropical Urban Heat Islands: Climate, Buildings and Greenery; Taylor & Francis: London, UK; New York, NY, USA, 2009. [Google Scholar]
- Todhunter, P.E. Microclimatic variations attributable to urban canyon asymmetry and orientation. Phys. Geogr. 1990, 11, 131–141. [Google Scholar]
- Perini, K.; Magliocco, A. Effects of vegetation, urban density, building height, and atmospheric conditions on local temperatures and thermal comfort. Urban For. Urban Green. 2014, 13, 495–506. [Google Scholar] [CrossRef]
- Erell, E.; Pearlmutter, D.; Williamson, T. Urban Microclimate: Designing the Spaces between Buildings, 1st ed.; Earthscan: London, UK; Washington, DC, USA, 2010. [Google Scholar]
- Gartland, L. Heat Islands: Understanding and Mitigating Heat in Urban Areas; Earthscan: London, UK; Sterling, VA, USA, 2008. [Google Scholar]
- Jauregui, E.; Luyando, E. Global radiation attenuation by air pollution and its effects on the thermal climate in Mexico City. Int. J. Climatol. 1999, 19, 683–694. [Google Scholar] [CrossRef]
- Nunez, M.; Oke, T.R. The Energy Balance of an Urban Canyon. J. Appl. Meteorol. 1977, 16, 11–19. [Google Scholar] [CrossRef]
- Erell, E.; Williamson, T. Intra-urban differences in canopy layer air temperature at a mid-latitude city. Int. J. Climatol. 2007, 27, 1243–1255. [Google Scholar] [CrossRef]
- Niachou, K.; Livada, I.; Santamouris, M. Experimental study of temperature and airflow distribution inside an urban street canyon during hot summer weather conditions. Part II: Airflow analysis. Build. Environ. 2008, 43, 1393–1403. [Google Scholar] [CrossRef]
- Barradas, V.L.; Tejeda-Martínez, A.; Jáuregui, E. Energy balance measurements in a suburban vegetated area in Mexico City. Atmos. Environ. 1999, 33, 4109–4113. [Google Scholar] [CrossRef]
- Eliasson, I.; Upmanis, H. Nocturnal airflow from urban parks-implications for city ventilation. Theor. Appl. Climatol. 2000, 66, 95–107. [Google Scholar] [CrossRef]
- Williamson, T.; Erell, E. The implications for building ventilation of the spatial and temporal variability of air temperature in the urban canopy layer. Int. J. Vent. 2008, 7, 23–35. [Google Scholar] [CrossRef]
- Jenks, M.; Burgess, R. Compact Cities: Sustainable Urban Forms for Developing Countries; Spon Press: London, UK; New York, NY, USA, 2000. [Google Scholar]
- Skarbit, N.; Stewart, I.D.; Unger, J.; Gál, T. Employing an urban meteorological network to monitor air temperature conditions in the “local climate zones” of Szeged, Hungary. Int. J. Climatol. 2017, 37, 582–596. [Google Scholar] [CrossRef]
- Lin, P.; Lau, S.S.Y.; Qin, H.; Gou, Z. Effects of urban planning indicators on urban heat island: A case study of pocket parks in high-rise high density environment. Landsc. Urban Plan. 2017, 168, 48–60. [Google Scholar] [CrossRef]
- Wang, Y.; Berardi, U.; Akbari, H. Comparing the effects of urban heat island mitigation strategies for Toronto, Canada. Energy Build. 2016, 114, 2–19. [Google Scholar] [CrossRef]
- Jenks, M.; Burton, E.; Williams, K. The Compact City: A Sustainable Urban Form? 1st ed.; E & FN Spon: London, UK; New York, NY, USA, 1996. [Google Scholar]
- Petralli, M.; Massetti, L.; Brandani, G.; Orlandini, S. Urban planning indicators: Useful tools to measure the effect of urbanization and vegetation on summer air temperatures. Int. J. Climatol. 2014, 34, 1236–1244. [Google Scholar] [CrossRef]
- De Assis, E.S.; Frota, A.B. Urban bioclimatic design strategies for a tropical city. Atmos. Environ. 1999, 33, 4135–4142. [Google Scholar] [CrossRef]
- Akbari, H.; Davis, S.; Dorsano, S.; Huang, J.; Winnett, S. Cooling Our Communities: A Guidebook on Tree Planting and Light-Colored Surfacing; U.S. Environmental Protection Agency: Washington, DC, USA, 1992. [Google Scholar]
- Synnefa, A.; Santamouris, M.; Akbari, H. Estimating the effect of using cool coatings on energy loads and thermal comfort in residential buildings in various climatic conditions. Energy Build. 2007, 39, 1167–1174. [Google Scholar] [CrossRef]
- Kondo, A.; Ueno, M.; Kaga, A.; Yamaguchi, K. The influence of urban canopy configuration on urban albedo. Bound. Layer Meteorol. 2001, 100, 225–242. [Google Scholar]
- Chimklai, P.; Hagishima, A.; Tanimoto, J. A computer system to support Albedo Calculation in urban areas. Build. Environ. 2004, 39, 1213–1221. [Google Scholar] [CrossRef]
- Priyadarsini, R.; Wong, N.H. Parametric studies on urban geometry, air flow and temperature. Int. J. Archit. Sci. 2005, 6, 114–132. [Google Scholar]
- Berardi, U.; Wang, Y. The effect of a denser city over the urban microclimate: The case of Toronto. Sustainability 2016, 8, 822. [Google Scholar] [CrossRef]
- Chan, A.T.; So, E.S.P.; Samad, S.C. Strategic guidelines for street canyon geometry to achieve sustainable street air quality. Atmos. Environ. 2001, 35, 5681–5691. [Google Scholar] [CrossRef]
- Knowles, R.L. Energy and Form: An Ecological Approach to Urban Growth; MIT Press: Cambridge, MA, USA, 1974. [Google Scholar]
- Giridharan, R.; Lau, S.S.Y.; Ganesan, S.; Givoni, B. Urban design factors influencing heat island intensity in high-rise high-density environments of Hong Kong. Build. Environ. 2007, 42, 3669–3684. [Google Scholar] [CrossRef]
- Yuan, C.; Ng, E. Building porosity for better urban ventilation in high-density cities—A computational parametric study. Build. Environ. 2012, 50, 176–189. [Google Scholar] [CrossRef]
- Adolphe, L. A simplified model of urban morphology: Application to an analysis of the environmental performance of cities. Environ. Plan. B Plan. Des. 2001, 28, 183–200. [Google Scholar] [CrossRef]
- Edussuriya, P.; Chan, A.; Ye, A. Urban morphology and air quality in dense residential environments in Hong Kong. Part I: District-level analysis. Atmos. Environ. 2011, 45, 4789–4803. [Google Scholar] [CrossRef]
- Yoshida, H.; Omae, M. An approach for analysis of urban morphology: Methods to derive morphological properties of city blocks by using an urban landscape model and their interpretations. Comput. Environ. Urban Syst. 2005, 29, 223–247. [Google Scholar] [CrossRef]
- Oke, T.R. Canyon geometry and the nocturnal urban heat island: Comparison of scale model and field observations. J. Climatol. 1981, 1, 237–254. [Google Scholar] [CrossRef]
- Oke, T.R. Street design and urban canopy layer climate. Energy Build. 1988, 11, 103–113. [Google Scholar]
- Harman, I.N.; Best, M.J.; Belcher, S.E. Radiative Exchange in an urban street canyon. Bound. Layer Meteorol. 2004, 110, 301–316. [Google Scholar]
- Giannopoulou, K.; Santamouris, M.; Livada, I.; Georgakis, C.; Caouris, Y. The impact of canyon geometry on intra urban and urban: Suburban night temperature differences under warm weather conditions. Pure Appl. Geophys. 2010, 167, 1433–1449. [Google Scholar] [CrossRef]
- Goh, K.C.; Chang, C.H. The relationship between height to width ratios and the heat island intensity at 22:00 h for Singapore. Int. J. Climatol. 1999, 19, 1011–1023. [Google Scholar]
- Priyadarsini, R.; Hien, W.N.; David, C.K.W. Microclimatic modeling of the urban thermal environment of Singapore to mitigate urban heat island. Sol. Energy 2008, 82, 727–745. [Google Scholar] [CrossRef]
- Andreou, E.; Axarli, K. Investigation of urban canyon microclimate in traditional and contemporary environment. Experimental investigation and parametric analysis. Renew. Energy 2012, 43, 354–363. [Google Scholar] [CrossRef]
- Johansson, E. Influence of urban geometry on outdoor thermal comfort in a hot dry climate: A study in Fez, Morocco. Build. Environ. 2006, 41, 1326–1338. [Google Scholar] [CrossRef]
- Van Esch, M.M.E.; Looman, R.H.J.; De Bruin-Hordijk, G.J. The effects of urban and building design parameters on solar access to the urban canyon and the potential for direct passive solar heating strategies. Energy Build. 2012, 47, 189–200. [Google Scholar] [CrossRef]
- Nakamura, Y.; Oke, T.R. Wind, temperature and stability conditions in an east-west oriented urban canyon. Atmos. Environ. 1988, 22, 2691–2700. [Google Scholar]
- Krüger, E.; Pearlmutter, D.; Rasia, F. Evaluating the impact of canyon geometry and orientation on cooling loads in a high-mass building in a hot dry environment. Appl. Energy 2010, 87, 2068–2078. [Google Scholar] [CrossRef]
- Krüger, E.L.; Minella, F.O.; Rasia, F. Impact of urban geometry on outdoor thermal comfort and air quality from field measurements in Curitiba, Brazil. Build. Environ. 2011, 46, 621–634. [Google Scholar] [CrossRef]
- Shashua-Bar, L.; Hoffman, M.E. Geometry and orientation aspects in passive cooling of canyon streets with trees. Energy Build. 2003, 35, 61–68. [Google Scholar] [CrossRef]
- Sakakibara, Y. A numerical study of the effect of urban geometry upon the surface energy budget. Atmos. Environ. 1996, 30, 487–496. [Google Scholar]
- Yan, H.; Fan, S.; Guo, C.; Wu, F.; Zhang, N.; Dong, L. Assessing the effects of landscape design parameters on intra-urban air temperature variability: The case of Beijing, China. Build. Environ. 2014, 76, 44–53. [Google Scholar] [CrossRef]
- Lin, T.P.; Matzarakis, A.; Hwang, R.L. Shading effect on long-term outdoor thermal comfort. Build. Environ. 2010, 45, 213–221. [Google Scholar] [CrossRef]
- Hwang, R.L.; Lin, T.P.; Matzarakis, A. Seasonal effects of urban street shading on long-term outdoor thermal comfort. Build. Environ. 2011, 46, 863–870. [Google Scholar] [CrossRef]
- Bärring, L.; Mattsson, J.O.; Lindqvist, S. Canyon geometry, street temperatures and urban heat island in Malmö, Sweden. J. Climatol. 1985, 5, 433–444. [Google Scholar]
- Yamashita, S.; Sekine, K.; Shoda, M.; Yamashita, K.; Hara, Y. On relationships between heat island and sky view factor in the cities of Tama River basin, Japan. Atmos. Environ. 1986, 20, 681–686. [Google Scholar] [CrossRef]
- Eliasson, I. Intra-urban nocturnal temperature differences: A multivariate approach. Clim. Res. 1996, 7, 21–30. [Google Scholar] [CrossRef]
- Allegrini, J.; Dorer, V.; Carmeliet, J. Influence of morphologies on the microclimate in urban neighbourhoods. J. Wind Eng. Ind. Aerodyn. 2015, 144, 108–117. [Google Scholar] [CrossRef]
- Middel, A.; Häb, K.; Brazel, A.J.; Martin, C.A.; Guhathakurta, S. Impact of urban form and design on mid-afternoon microclimate in Phoenix Local Climate Zones. Landsc. Urban Plan. 2014, 122, 16–28. [Google Scholar] [CrossRef]
- Okeil, A. A holistic approach to energy efficient building forms. Energy Build. 2010, 42, 1437–1444. [Google Scholar] [CrossRef]
- Ratti, C.; Raydan, D.; Steemers, K. Building form and environmental performance: Archetypes, analysis and an arid climate. Energy Build. 2003, 35, 49–59. [Google Scholar] [CrossRef]
- Kong, F.; Yin, H.; James, P.; Hutyra, L.R.; He, H.S. Effects of spatial pattern of greenspace on urban cooling in a large metropolitan area of eastern China. Landsc. Urban Plan. 2014, 128, 35–47. [Google Scholar] [CrossRef]
- Oke, T.R. The micrometeorology of the urban forest. Philos. Trans. R. Soc. B Biol. Sci. 1989, 324, 335–349. [Google Scholar] [CrossRef]
- Tong, S.; Wong, N.H.; Tan, C.L.; Jusuf, S.K.; Ignatius, M.; Tan, E. Impact of urban morphology on microclimate and thermal comfort in northern China. Sol. Energy 2017, 155, 212–223. [Google Scholar] [CrossRef]
- Pearlmutter, D.; Krüger, E.L.; Berliner, P. The role of evaporation in the energy balance of an open-air scaled urban surface. Int. J. Climatol. 2009, 29, 911–920. [Google Scholar] [CrossRef]
- Picot, X. Thermal comfort in urban spaces: Impact of vegetation growth. Case study: Piazza della Scienza, Milan, Italy. Energy Build. 2004, 36, 329–334. [Google Scholar] [CrossRef]
- Bowler, D.E.; Buyung-Ali, L.; Knight, T.M.; Pullin, A.S. Urban greening to cool towns and cities: A systematic review of the empirical evidence. Landsc. Urban Plan. 2010, 97, 147–155. [Google Scholar] [CrossRef]
- Ca, V.T.; Asaeda, T.; Abu, E.M. Reductions in air conditioning energy caused by a nearby park. Energy Build. 1998, 29, 83–92. [Google Scholar] [CrossRef]
- Bonan, G.B. The microclimates of a suburban Colorado (USA) landscape and implications for planning and design. Landsc. Urban Plan. 2000, 49, 97–114. [Google Scholar] [CrossRef]
- Lin, T.P.; Ho, Y.F.; Huang, Y.S. Seasonal effect of pavement on outdoor thermal environments in subtropical Taiwan. Build. Environ. 2007, 42, 4124–4131. [Google Scholar] [CrossRef]
- Papadakis, G.; Tsamis, P.; Kyritsis, S. An experimental investigation of the effect of shading with plants for solar control of buildings. Energy Build. 2001, 33, 831–836. [Google Scholar] [CrossRef]
- Cohen, P.; Potchter, O.; Matzarakis, A. Daily and seasonal climatic conditions of green urban open spaces in the Mediterranean climate and their impact on human comfort. Build. Environ. 2012, 51, 285–295. [Google Scholar] [CrossRef]
- Takebayashi, H.; Moriyama, M. Study on the urban heat island mitigation effect achieved by converting to grass-covered parking. Sol. Energy 2009, 83, 1211–1223. [Google Scholar] [CrossRef]
- Onishi, A.; Cao, X.; Ito, T.; Shi, F.; Imura, H. Evaluating the potential for urban heat-island mitigation by greening parking lots. Urban For. Urban Green. 2010, 9, 323–332. [Google Scholar] [CrossRef]
- Baris, M.E.; Sahin, S.; Yazgan, M.E. The contribution of trees and green spaces to the urban climate: The case of Ankara. Afr. J. Agric. Res. 2009, 4, 791–800. [Google Scholar]
- Hamada, S.; Ohta, T. Seasonal variations in the cooling effect of urban green areas on surrounding urban areas. Urban For. Urban Green. 2010, 9, 15–24. [Google Scholar] [CrossRef]
- Wong, N.H.; Jusuf, S.K.; Syafii, N.I.; Chen, Y.; Hajadi, N.; Sathyanarayanan, H.; Manickavasagam, Y.V. Evaluation of the impact of the surrounding urban morphology on building energy consumption. Sol. Energy 2011, 85, 57–71. [Google Scholar] [CrossRef]
- Giridharan, R.; Lau, S.S.Y.; Ganesan, S.; Givoni, B. Lowering the outdoor temperature in high-rise high-density residential developments of coastal Hong Kong: The vegetation influence. Build. Environ. 2008, 43, 1583–1595. [Google Scholar] [CrossRef]
- Ng, E.; Chen, L.; Wang, Y.; Yuan, C. A study on the cooling effects of greening in a high-density city: An experience from Hong Kong. Build. Environ. 2012, 47, 256–271. [Google Scholar] [CrossRef]
- Shashua-Bar, L.; Pearlmutter, D.; Erell, E. The cooling efficiency of urban landscape strategies in a hot dry climate. Landsc. Urban Plan. 2009, 92, 179–186. [Google Scholar] [CrossRef]
- Srivanit, M.; Hokao, K. Evaluating the cooling effects of greening for improving the outdoor thermal environment at an institutional campus in the summer. Build. Environ. 2013, 66, 158–172. [Google Scholar] [CrossRef]
- Shashua-Bar, L.; Pearlmutter, D.; Erell, E. The influence of trees and grass on outdoor thermal comfort in a hot-arid environment. Int. J. Climatol. 2011, 31, 1498–1506. [Google Scholar] [CrossRef]
- Mahmoud, A.H.A. Analysis of the microclimatic and human comfort conditions in an urban park in hot and arid regions. Build. Environ. 2011, 46, 2641–2656. [Google Scholar] [CrossRef]
- Dimoudi, A.; Nikolopoulou, M. Vegetation in the Urban Environment: Microclimatic analysis and benefits. Energy Build. 2003, 35, 69–76. [Google Scholar]
- Shashua-Bar, L.; Hoffman, M.E.; Tzamir, Y. Integrated thermal effects of generic built forms and vegetation on the UCL microclimate. Build. Environ. 2006, 41, 343–354. [Google Scholar] [CrossRef]
- Tan, Z.; Lau, K.K.L.; Ng, E. Planning strategies for roadside tree planting and outdoor comfort enhancement in subtropical high-density urban areas. Build. Environ. 2017, 120, 93–109. [Google Scholar] [CrossRef]
- Andreou, E. Thermal comfort in outdoor spaces and urban canyon microclimate. Renew. Energy 2013, 55, 182–188. [Google Scholar] [CrossRef]
- Emmanuel, R.; Johansson, E. Influence of urban morphology and sea breeze on hot humid microclimate: The case of Colombo, Sri Lanka. Clim. Res. 2006, 30, 189–200. [Google Scholar] [CrossRef]
- Giridharan, R.; Ganesan, S.; Lau, S.S.Y. Daytime urban heat island effect in high-rise and high-density residential developments in Hong Kong. Energy Build. 2004, 36, 525–534. [Google Scholar] [CrossRef]
- Yang, F.; Lau, S.S.Y.; Qian, F. Urban design to lower summertime outdoor temperatures: An empirical study on high-rise housing in Shanghai. Build. Environ. 2011, 46, 769–785. [Google Scholar] [CrossRef]
- Shashua-Bar, L.; Hoffman, M.E. Quantitative evaluation of the effects of built-up geometry and trees on diurnal air temperature in canyon-type courtyards. Adv. Build. Technol. 2002, II, 1493–1500. [Google Scholar] [CrossRef]
- Shashua-Bar, L.; Hoffman, M.E. Quantitative evaluation of passive cooling of the UCL microclimate in hot regions in summer, case study: Urban streets and courtyards with trees. Build. Environ. 2004, 39, 1087–1099. [Google Scholar] [CrossRef]
- Shashua-Bar, L.; Tsiros, I.X.; Hoffman, M.E. A modeling study for evaluating passive cooling scenarios in urban streets with trees. Case study: Athens, Greece. Build. Environ. 2010, 45, 2798–2807. [Google Scholar] [CrossRef]
- Konarska, J.; Holmer, B.; Lindberg, F.; Thorsson, S. Influence of vegetation and building geometry on the spatial variations of air temperature and cooling rates in a high-latitude city. Int. J. Climatol. 2016, 36, 2379–2395. [Google Scholar] [CrossRef] [Green Version]
- Yahia, M.W.; Johansson, E. Influence of urban planning regulations on the microclimate in a hot dry climate: The example of Damascus, Syria. J. Hous. Built Environ. 2013, 28, 51–65. [Google Scholar] [CrossRef]
- Oke, T.R. Towards better scientific communication in urban climate. Theor. Appl. Climatol. 2006, 84, 179–190. [Google Scholar] [CrossRef]
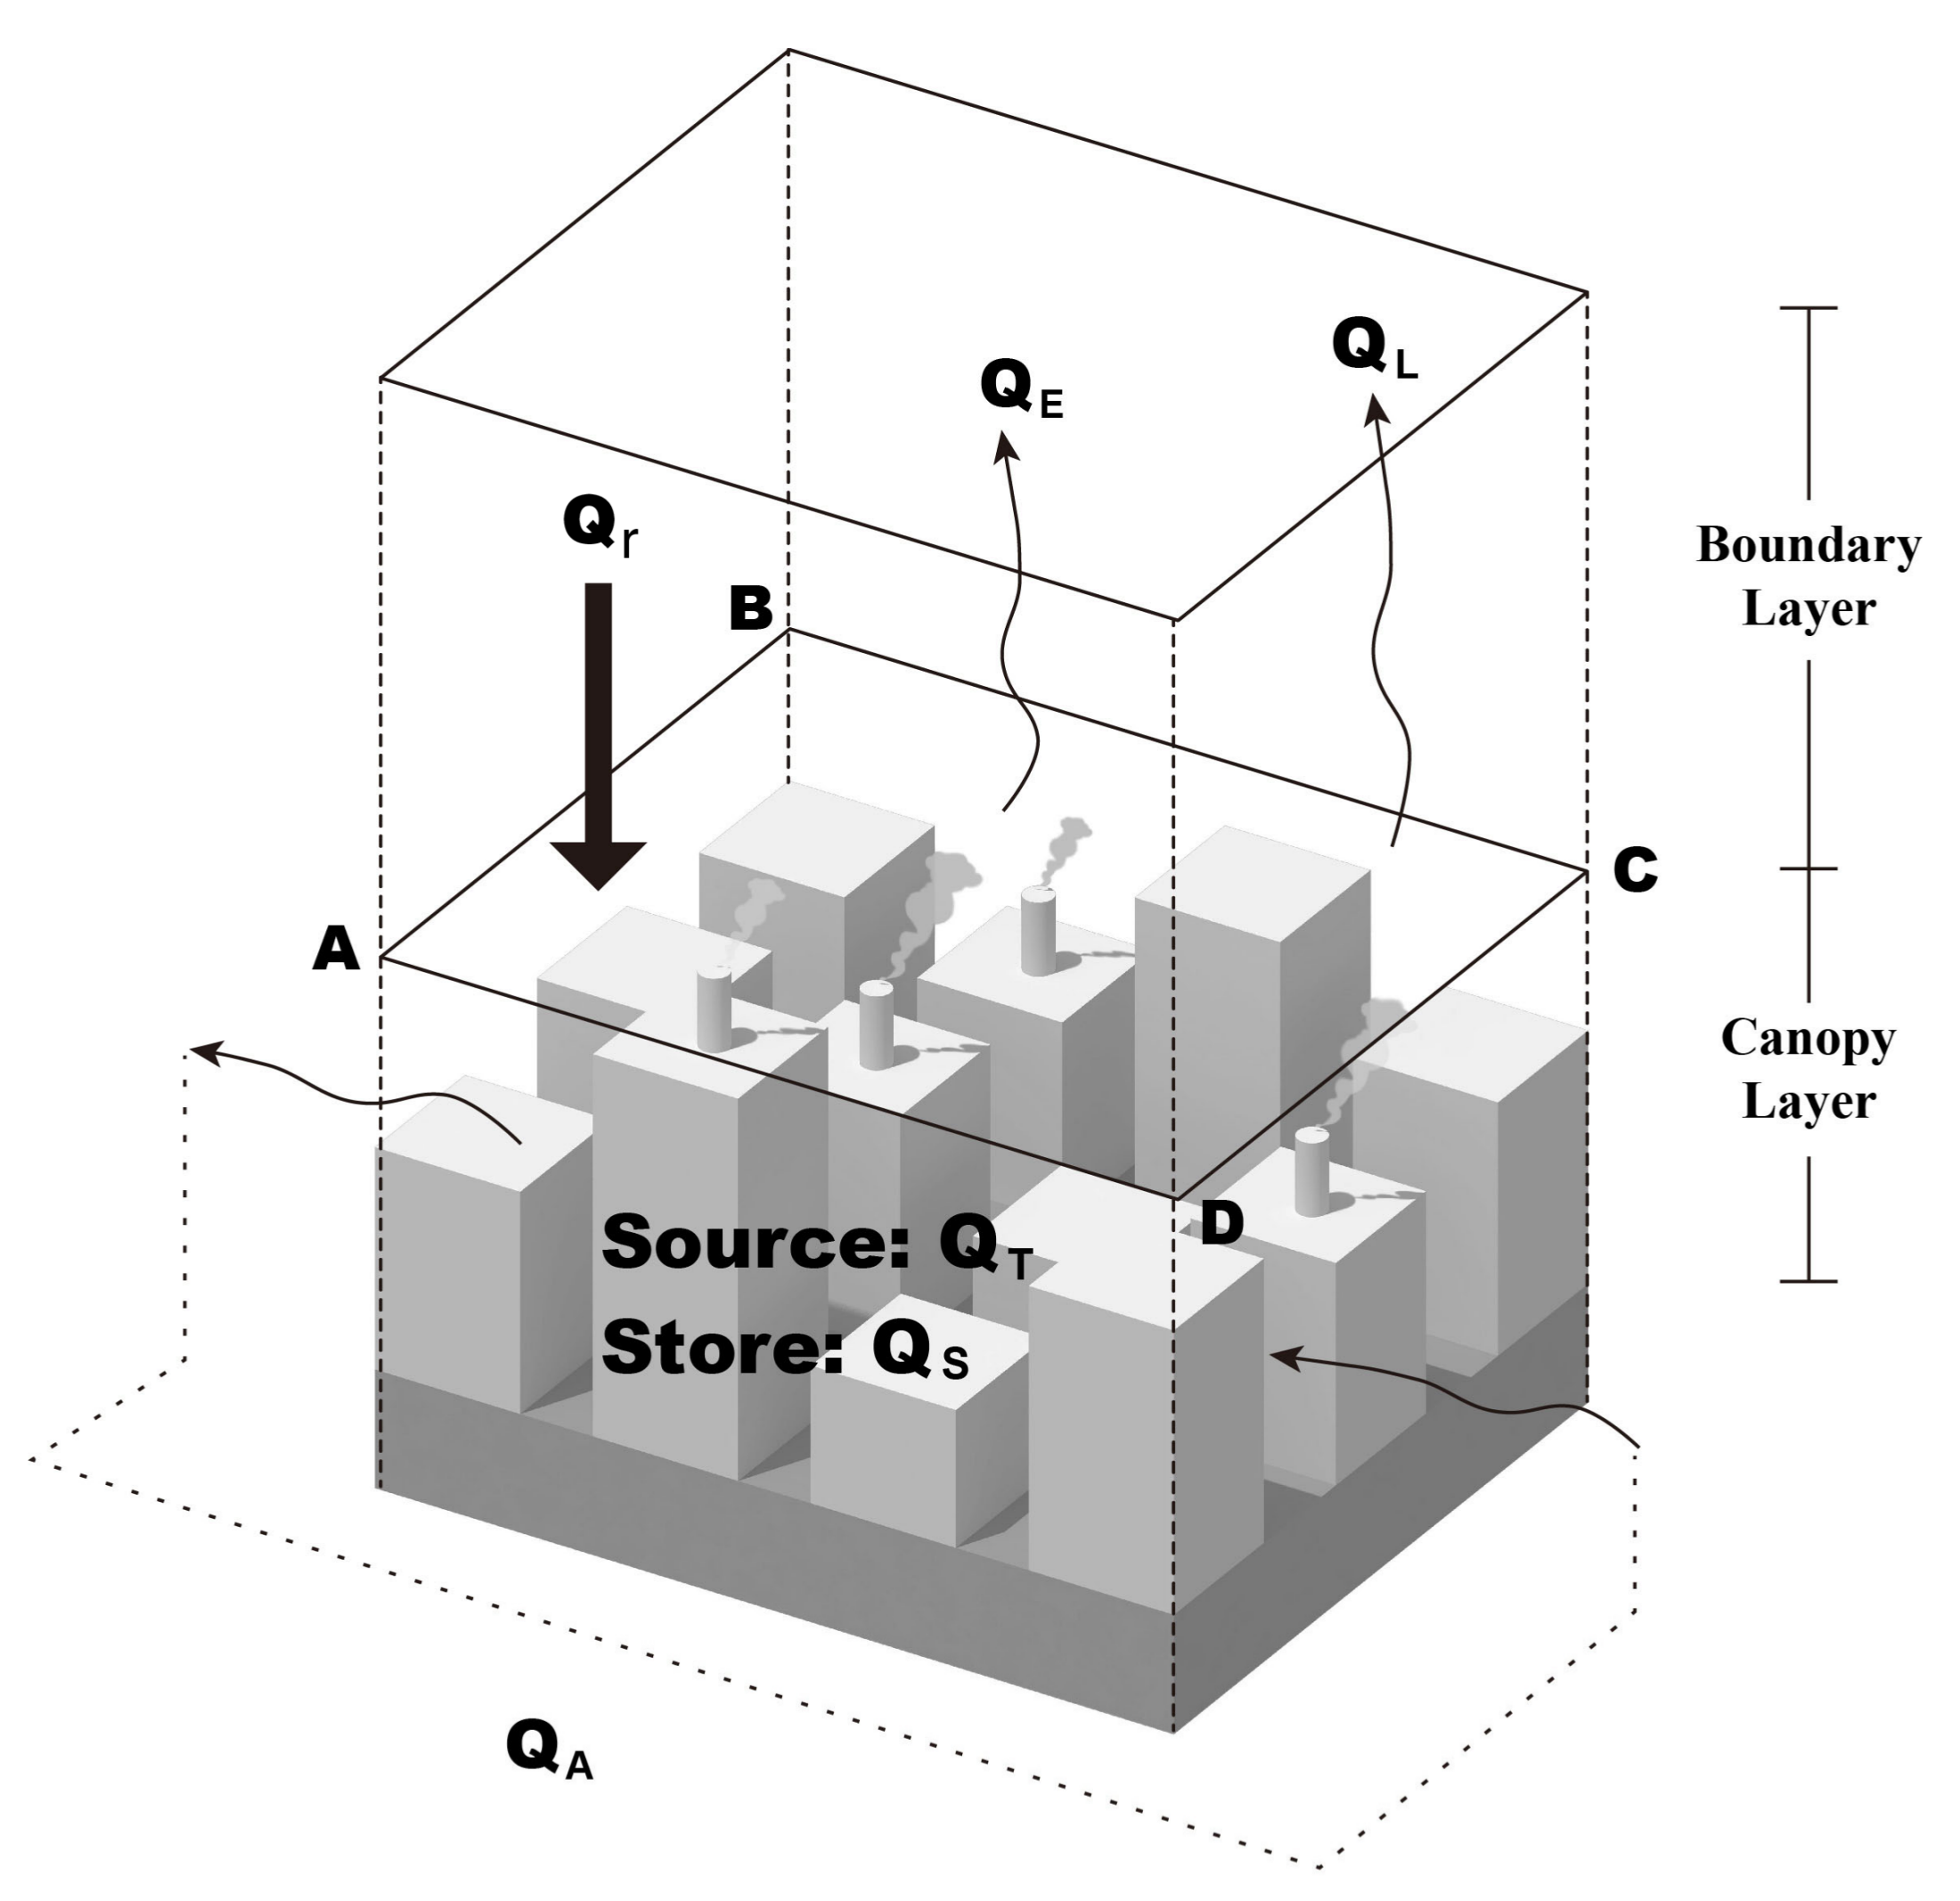
Figure 2.
Schematic diagram of the energy fluxes in the microscale urban environment (drawn by authors).
Figure 2.
Schematic diagram of the energy fluxes in the microscale urban environment (drawn by authors).

Table 1.
Literature on the combined effect of urban geometry and vegetation.
| Research | Urban Area | Climate | Method | Parameters Investigated |
|---|---|---|---|---|
| [104] | Colombo, Sri Lanka | Tropical monsoon climate | Field measurement | H/W, sky view factor (SVF), orientation, ground cover, distance to sea |
| [93] | Singapore | Tropical rainforest climate (hot and humid) | Field measurement and simulation | Green plot ratio (GnPR), sky view factor, surrounding building density, the wall surface area, pavement area, albedo |
| [100] | Pikermi, Greece | Subtropical Mediterranean climate | Simulation | Size of green area, density of the urban texture, orientation, different wind speeds, distance from the green area |
| [5,49,94,105] | Hong Kong, China | Humid subtropical climate | Field measurement | Surface albedo, SVF, tree cover, shrub cover, average height to floor area ratio, built area |
| [36] | Hong Kong, China | Humid subtropical climate | Field measurement | Floor area ratio (FAR), building density, park area, tree ratio, shrub ratio |
| [6,106] | Shanghai, China | Humid subtropical climate | Field measurement | SVF, tree view factor (TVF), green ratio, green plot ratio, green cover ratio, ground surface albedo, FAR |
| [68] | Beijing, China | Humid continental climate | Field measurement | Building area (%), vegetation cover (%), SVF distance to park, distance to water body |
| [37] | Toronto, Canada | Humid continental climate | Simulation | Density, building height, surface albedo, vegetation cover |
| [107] | Tel Aviv, Israel | Mediterranean climate | Field measurement and simulation | Courtyard’s geometry and the density of shade trees |
| [108] | Tel Aviv, Israel | Mediterranean climate | Field measurement and simulation | Cluster deepening, albedo modification, and orientation in the presence of shade trees |
| [101] | Tel Aviv, Israel | Mediterranean climate | Field measurement and simulation | Generic built forms, H/W, spacing distance to frontal length, building depth to frontal length, envelope ratio, trees coverage, colonnade |
| [109] | Athens, Greece | Subtropical Mediterranean climate | Field measurement and simulation | Tree canopy coverage, traffic load, surface albedo modification, aspect ratio and street’s ventilation |
| [103] | Tinos, Greece | Mediterranean climate | Field measurement and simulation | Aspect ratio, street orientation, presence of trees, ground albedo |
| [24] | Milan, Genoa, Rome | Mediterranean climate | Simulation | Building density, building height, vegetation cover and types |
| [110] | Gothenburg, Sweden | Oceanic climate | Field measurement | Tree cover and volume, building cover and volume, fraction of permeable surfaces and SVF |
| [111] | Damascus, Syria | Cold desert climate | Simulation | Aspect ratio, street orientation, the presence of trees, building types |
© 2017 by the authors. Licensee MDPI, Basel, Switzerland. This article is an open access article distributed under the terms and conditions of the Creative Commons Attribution (CC BY) license (http://creativecommons.org/licenses/by/4.0/).
Share and Cite
MDPI and ACS Style
Lin, P.; Gou, Z.; Lau, S.S.-Y.; Qin, H. The Impact of Urban Design Descriptors on Outdoor Thermal Environment: A Literature Review. Energies 2017, 10, 2151. https://doi.org/10.3390/en10122151
AMA Style
Lin P, Gou Z, Lau SS-Y, Qin H. The Impact of Urban Design Descriptors on Outdoor Thermal Environment: A Literature Review. Energies. 2017; 10(12):2151. https://doi.org/10.3390/en10122151
Chicago/Turabian StyleLin, Pingying, Zhonghua Gou, Stephen Siu-Yu Lau, and Hao Qin. 2017. "The Impact of Urban Design Descriptors on Outdoor Thermal Environment: A Literature Review" Energies 10, no. 12: 2151. https://doi.org/10.3390/en10122151
Note that from the first issue of 2016, this journal uses article numbers instead of page numbers. See further details here.