Analyses of Wind and Photovoltaic Energy Integration from the Promoting Scheme Point of View: Study Case of Romania


Department of Economic Informatics and Cybernetics, The Bucharest University of Economic Studies, Romana Square 6, 010374 Bucharest, Romania
*
Author to whom correspondence should be addressed.
Energies 2017, 10(12), 2101; https://doi.org/10.3390/en10122101
Submission received: 28 October 2017
/
Revised: 4 December 2017
/
Accepted: 8 December 2017
/
Published: 11 December 2017
(This article belongs to the Section F: Electrical Engineering)
Abstract
:The integration of renewable energy sources (RES) has several complex technical and economic aspects, such as: grid reinforcement, tertiary power reserves required for intermittent operation of RES, promoting or support scheme, etc. In this paper, the focus will be given to wind and photovoltaic energy integration from the promoting scheme point of view, with a special emphasis on the case of Romania. In this respect, we propose a model that shows the relation between wind and photovoltaic energy integration and support scheme in Romania. Due to the green certificates (GC) support scheme design that is related to several elements such as total consumption forecast, installed power of the plants based on each type of RES and their full load hours that are expected to vary, we also perform several sensitivity analyses. The GC support scheme implemented in Romania provides interesting insights regarding the installed power based on the primary energy source that could benefit from the GC for RES investors, policy and decision makers.
1. Introduction
The promotion of renewable energy is one of the major European Union (EU) policies on energy. Furthermore, smart grid strategies target technologies, systems and solutions to supply, host and utilize up to 100% renewable energy sources (RES). Their integration, especially wind and photovoltaic energy due to higher volatility, has significant implications on power systems’ security. The EU regulation (i.e., Directive 2009/28/EC) allows different schemes of support for RES at a national level that are the main driver for new RES investment and hence have an impact on network planning and development [1].
Green certificates (GC) are tradable commodities proving that certain electricity is generated by RES and are traded on a dedicated market, separately from the energy produced. Three other main types of RES support schemes in place in the EU are: feed-in tariff, feed-in premium and investment grants.
The mandatory quota system related to the GC is a market-based support mechanism, the level of support being determined by demand and supply. This is intended to make it profitable for investors to invest in new electricity generation from RES.
Currently, five EU Member States (MSs) and Norway have introduced GC mechanism for RES support mechanism. However, in some countries, quota systems are now being replaced by other types of support schemes, notably feed-in premium. European countries where green certificate policies are in place include Romania, Poland, Belgium, Sweden and the UK. The green certificate market in Italy has been replaced by feed-in tariffs on 1 July 2016. In the UK, the green certificate mechanism will end in 2017.
Different variations of green certificate schemes design exist. Most countries opted for a green certificate scheme national in scope, whilst Norway and Sweden have a common GC system in place. Some EU Member States also apply hybrid systems, e.g., a quota with minimum prices. Some countries have chosen to link the obligation to purchase certificates to the electricity suppliers, while other countries have chosen to link the obligation to purchase certificates to grid operators. However, similar to all RES support mechanisms, the quota schemes follow the objective of increasing the level of electricity production from RES [2].
In [3], the authors analyze the way of minimizing the influence of the existing RES support schemes on the electricity consumers. They propose the modification of the RES support mechanisms at the legislative level that could minimize the influence of the mandatory procurement component on consumers’ electricity price and could provide an opportunity for the suppliers to forecast the operation of small power plants and their generation capabilities.
In [4], the authors present an analysis of the impact of the support scheme on the investment in RES in Romania. The paper shows the evolution of green certificates market, mandatory quotas and the support scheme’s effects on the RES generation.
In [5], the paper presents an analysis of the evolution of the support scheme for promoting renewable energy sources in Romania following: annual mandatory quotas of green certificate, price of green certificates, evolution of the power plants based on RES-installed capacity, structure of the installed power in RES and contribution of the RES to electricity generation in Romania.
In [6], an optimization planning framework to evaluate the impact of implementing a support instrument at different stages of planning on the final grid design and installed offshore wind capacities is presented. Optimal capacities are set so that congestion revenue collected throughout the lifetime of the project pays off the investment cost of new grid elements or reinforcements. The proposed model is used to investigate the impact of implementing a wind support plan on the development of the offshore grid in the North Sea. The results are interpreted in economic terms and show the effectiveness of the proposed approach.
In [7], the authors analyze the modifications of the RES support mechanisms that can create additional income for the producers and society. They apply a simple methodology based on numerical experiments with models of two types of power plants: biofuel and hydropower plants. The results prove the impact of modification on RES support schemes and the ways certain tools are designed to deal with them.
In [8], the authors mainly investigate different protection options for RES investors following changes in law affecting RES support schemes in Europe. The potential remedies are analyzed under both EU law and international treaties.
In [9], the author analyzes the positive and negative interactions between energy efficiency measures and different RES support schemes and evaluates the relation of specific instruments and design of support schemes and the interactions results. The author finds that the most significant interactions appear when energy efficiency measures are added to RES support schemes, especially when green certificates mechanism with relative quota is implemented.
In [10], the authors show the reduction in the wholesale electricity price due to RES generation. In Spain, this reduction is greater than costs for electricity consumers related to the RES support scheme. They show that there is an inverse correlation between RES support scheme and wholesale electricity market price and, despite the additional cost generated by the support scheme, the net reduction in the electricity price is a positive aspect of RES integration.
In [11], the authors analyze the performance of different RES support schemes, considered as the most representative price- and quantity-driven instruments, based on the efficacy, efficiency, equity and institutional feasibility.
In [12], the authors provide additional theoretical insights concerning RES support schemes and analyze the welfare effects of different RES support schemes designed to achieve given targets for RES electricity generation.
Systematic and comprehensive reviews and opinions regarding the combination between emissions trading scheme and RES support schemes are presented in [13]. The analyses show that a policy mix between emissions trading scheme and RES support schemes is possible under certain conditions.
In [14], the authors present a harmonization study of RES support schemes. They collect data related to RES support schemes, analyze the different policies taking into account their design elements and relate each design element or strategy characteristic of RES support schemes to policy objectives. They use the decision tree learning method in order to estimate the relevance of each design element to a certain policy objective in order to harmonize or co-ordinate RES support schemes at the EU level.
Starting from the fact that RES support scheme has a significant impact on the power market and the effectiveness of its functioning, in [15] the authors consider that RES support schemes have led to significant changes in power supply curve, also known as the merit order effect. They also consider that the development of RES generation resulted in a huge increase of extra cost related with RES support schemes.
In [16], the author presents that Russia intends to promote renewable energy through the capacity market. The idea is to remunerate investors for the installed capacity of their power plants, in particular for the availability of their power plants to produce electricity. This paper tries to demonstrate that a capacity-based approach to support RES can provide an alternative to the current output-based schemes.
In [17], the authors present the level, design and model of support schemes used to promote renewable energy in Europe. The proposed theoretical model aims to determine optimal renewable energy policies. The authors also describe the market share, production cost developments and economic assessment of current support schemes.
Since the support scheme implications have significance for power systems and stakeholders, we analyze its impact on RES, especially on the installed power of wind power plants (WPP) and photovoltaic systems (PV) in Romania.
In our paper, apart from the literature, we show that there is a strong relation between the RES support scheme (in particular, the green certificates market mechanism) and the installed capacity of different RES-based technologies. The design of the support scheme and its consistency influence investment in the RES sector.
Since most of the obstacles regarding RES integration can be overcome by additional investment (in grid capacities or power system reserves), the design of RES support schemes is very important due to the fact that it is the main driver for promoting the RES. As a novelty, the proposed model indicates the installed power of WPP and PV in Romania that could benefit from GC support scheme. It can also be used to indicate the installed power of other types of RES that could benefit from GC support scheme.
This paper consists in six main sections. In Section 1, the structure of the paper is described and related works from the literature are presented.
In Section 2, the European context in terms of RES policies is depicted. According to Directive 2009/28/EC, also known as the RES Directive, and new targets, the EU aims to get 20% of its final energy consumption from RES by 2020, and at least 27% or even more by 2030. These goals require more measures for RES integration taking into account the volatility of wind and photovoltaic energy, cost evolution of RES-generating technologies in correlation with incentives, energy storage implementation, etc.
In Section 3, the Romanian national context in terms of the RES current situation and GC support scheme is depicted. Regarding the Romanian case, special attention is given due to its higher level of wind and photovoltaic energy integration in the region. Also, the promoting scheme applied in Romania provides a sensitive indicator regarding the WPP and PV installed power that could benefit from the support of GC.
In Section 4, as a novelty we analyze the wind and photovoltaic energy integration in Romania from the promoting scheme point of view that concerns: mechanism of RES promoting scheme consisting of mandatory quotas that energy suppliers have to acquire, estimation of total electricity consumption and yearly operating time at maximum capacity of each type of power plant based on RES. The proposed model is based on GC mechanism and provides the installed power of WPP and PV that would benefit from a promoting scheme taking into account several assumptions, providing a brief overview on what should be expected as rational behavior from RES investors.
In Section 5, the model for wind and photovoltaic energy integration from the promoting scheme point of view is implemented and several simulations are performed starting from an initial basic scenario. Then, the variables of the model are modified one-by-one in a sensitivity analysis. The simulations reveal the installed power of WPP and PV that could benefit from GC support in different scenarios and some factors that can be influenced by decision makers in order to improve wind and photovoltaic energy integration. In Section 6, discussion and conclusions of our research and results are pointed out, underlying the novelty of the proposed wind and photovoltaic energy integration model based on RES support scheme implemented in Romania.
2. European Context: RES Policies
Due to their low greenhouse gas emissions compared to fossil fuels, RES are considered as critical for meeting the EU’s climate targets. As mostly indigenous energy sources, they also help reduce the EU’s dependence on energy imports. Moreover, RES help reduce air pollution. Also, the renewables’ industries employ over a million people in the EU. Therefore, the EU aims to get 20% of its final energy consumption from RES by 2020, and at least 27% by 2030. The RES Directive sets national targets for all MSs, which have to develop national action plans and report on progress every two years [18]. In 2014, RES had a 16% share in the energy consumption of the EU. Nine MSs have already achieved their targets for 2020, while others will have to make more efforts to reach their goals [19].
Nonetheless, investment in RES in Europe has slowed down in recent years, due to policy changes, sluggish economy and rapid decrease of RES incentives. Therefore, incentives must be correlated with falling technology costs, in order to avoid over-compensation and rising energy prices. The EU Commission is currently preparing a legislative proposal for a new electricity market design that facilitates the integration of RES in the market. Moreover, the European Parliament supports the growth of RES in the EU and has called for a binding 30% RES target for 2030, to be implemented by means of national targets for each MS. However, less incentives for RES investors and more integration costs for more RES penetration will lead to a challenging context for the MSs.
3. Romanian National Context
Romania has significant oil and gas reserves, substantial coal deposits and hydro resources. Romania partly imports oil and gas from Russia and other countries. Currently, the structure of installed power (Pi) is about 29% coal, 22% oil, 19% hydro, 7% nuclear, 15% wind, 7% PV and 1% biomass [20], as shown in Figure 1.
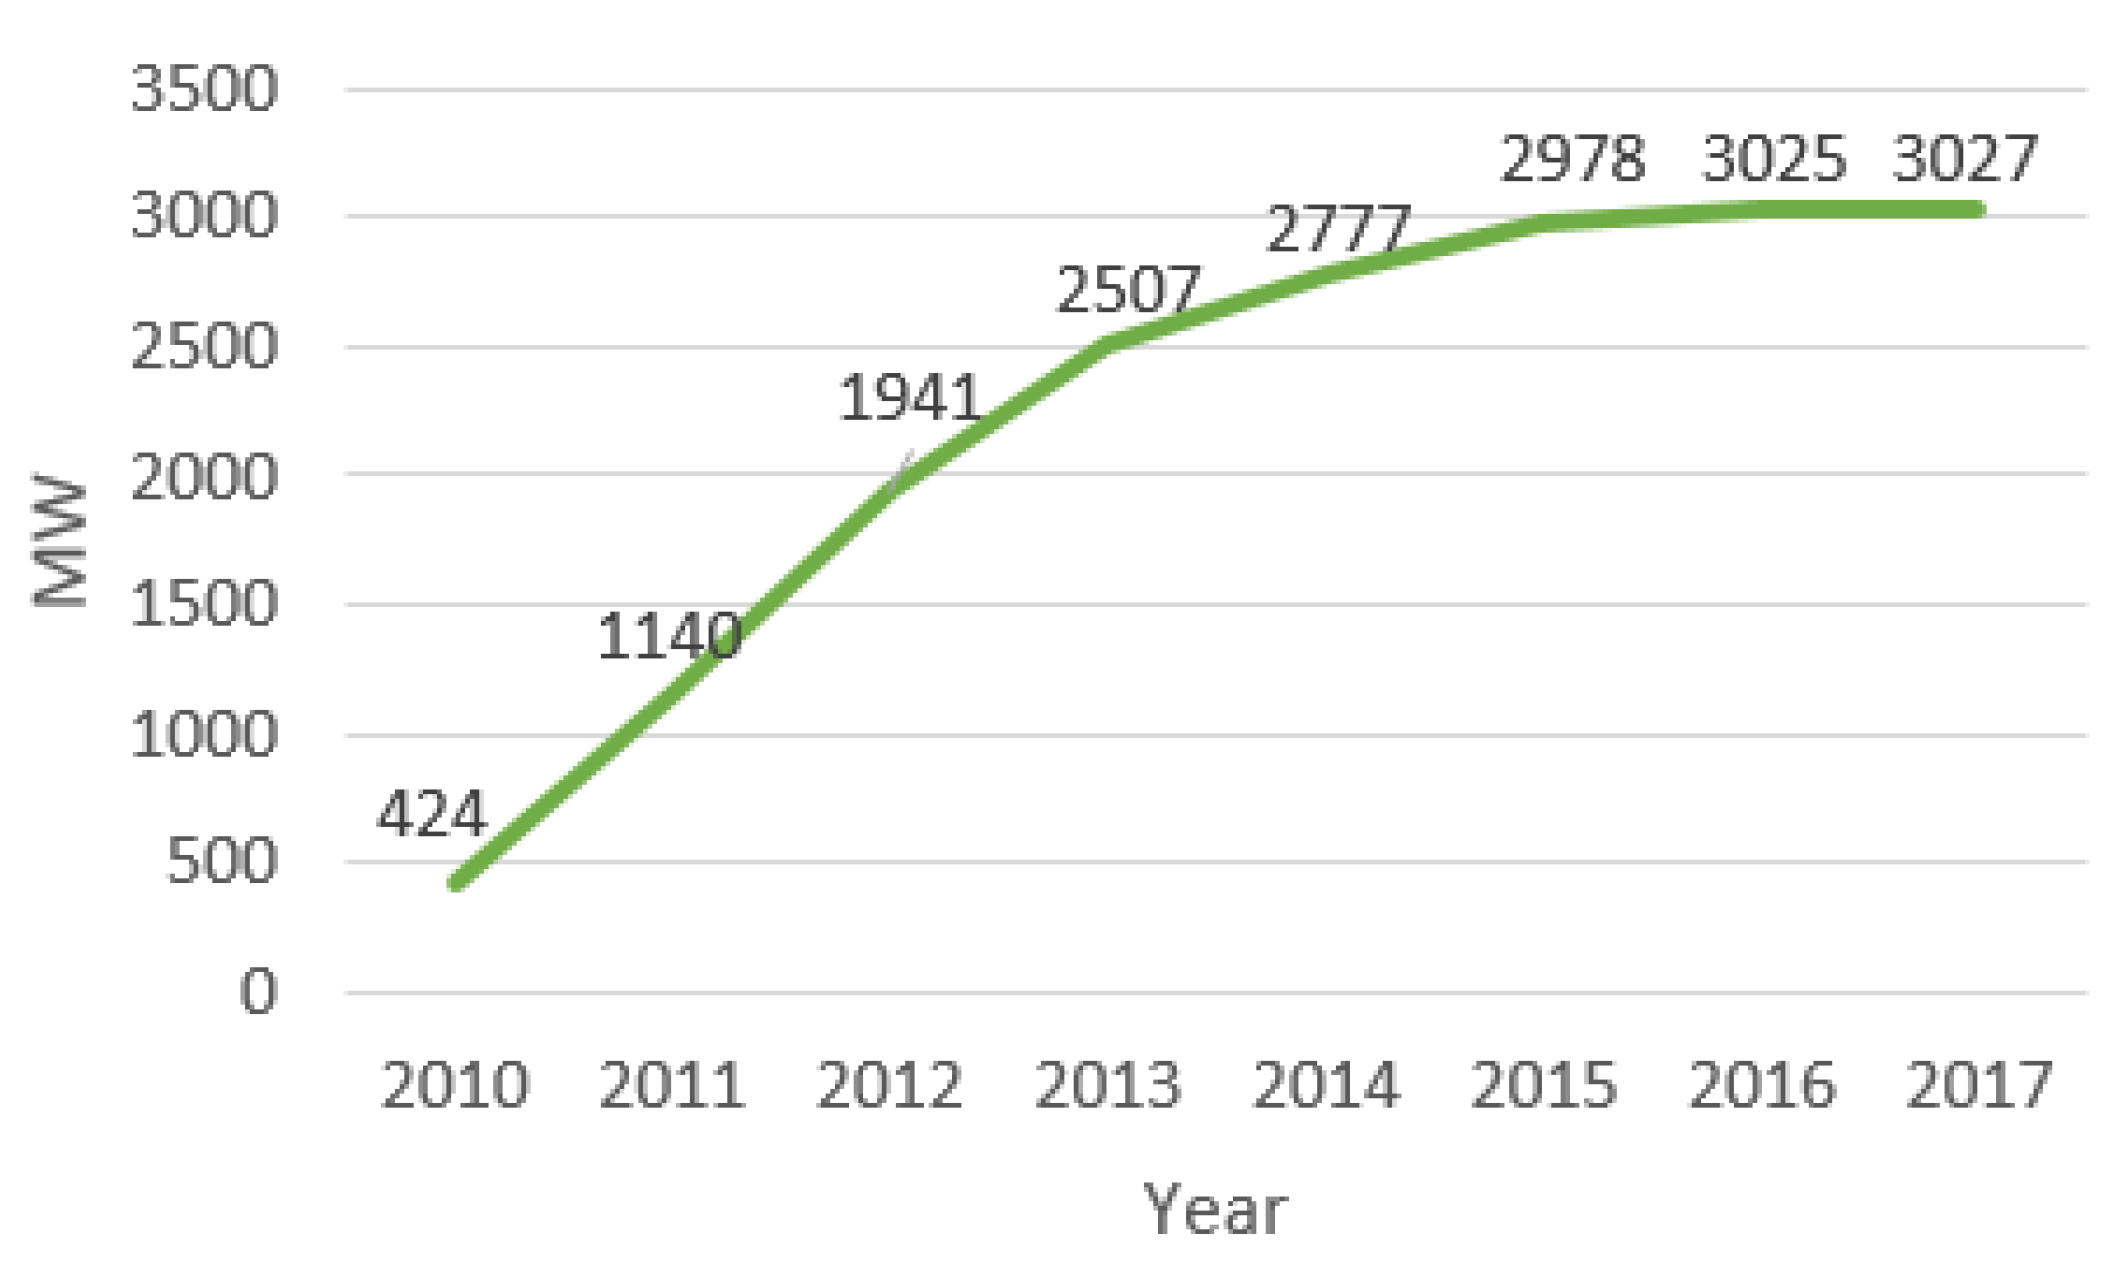
In November 2017, WPP reached installed capacity of 3027 MW [20], as in Figure 2, from the 14 MW installed capacity in 2009, which is a remarkable improvement. However, in the last years (since 2015) the increase of WPP installed power was very slow.
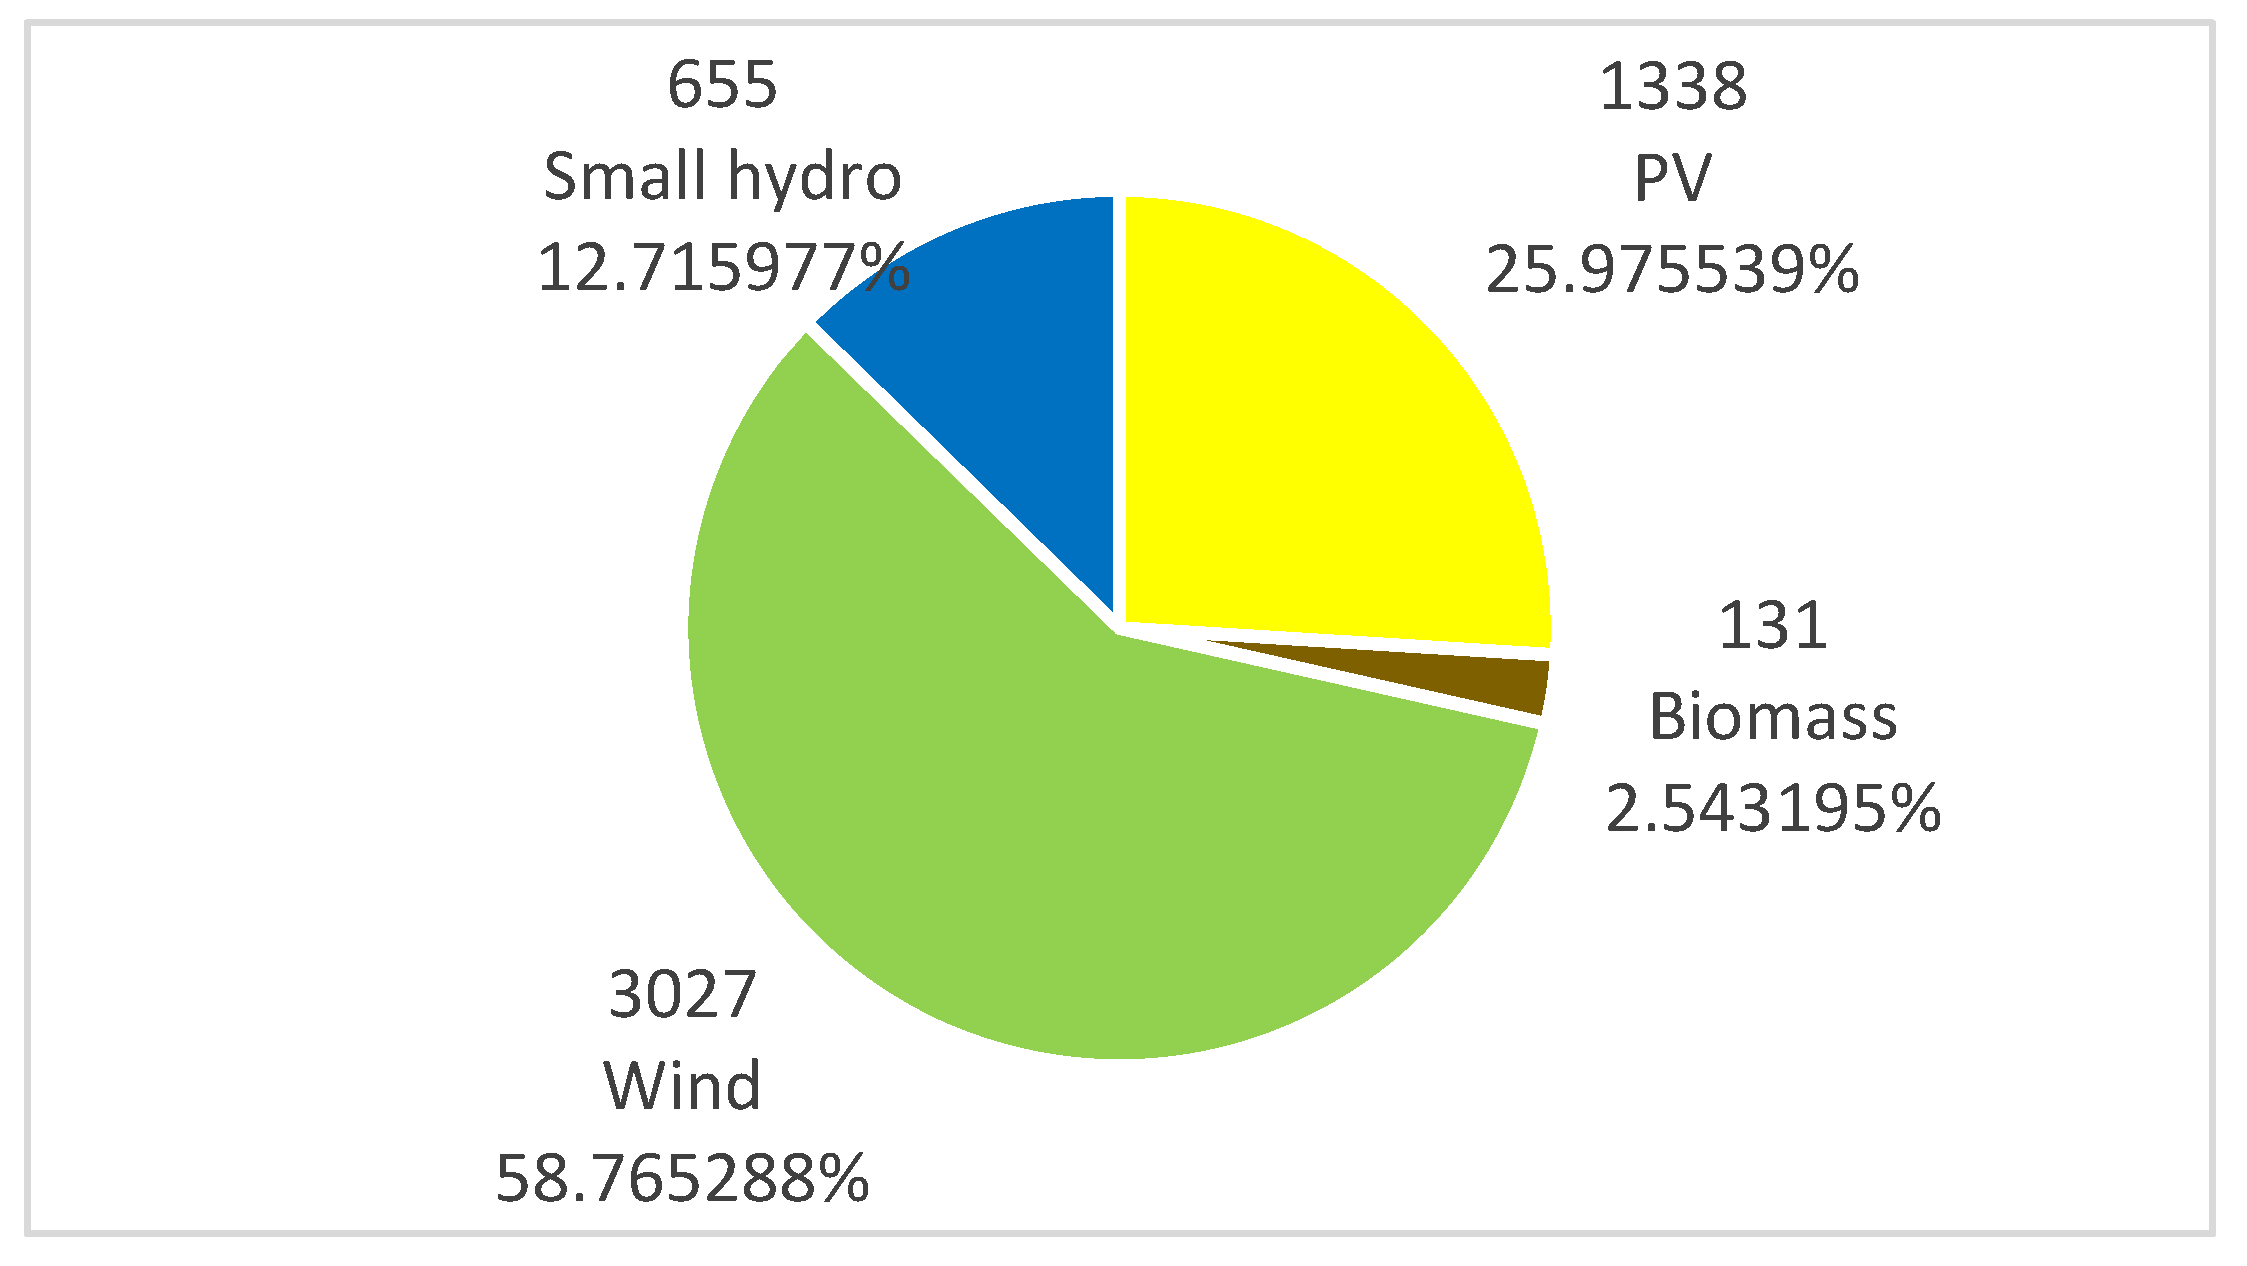
Wind energy is the most developed RES in Romania, the WPP installed power representing around 60% of the total RES installed power. Also, PV is the second most developed RES in Romania, having an installed power of about 1338 MW [20] and representing about 26% of the total RES installed power, as in Figure 3.
As for the support scheme, each produced MWh from RES is given a certain number of GC based on the specific primary energy source (i.e., wind, photovoltaic, micro-hydro and biomass) as a result of different costs for RES generating technology. In the framework of the green certificates market [21,22], GC are sold by the producers entitled to receive GC (depending on the generated energy). The electricity suppliers are obliged to buy GC so that quotas established by the legislation are fulfilled. Initially, mandatory quotas were established up to year 2020 by Law no. 139/2010 (2010–0.083; 2011–0.1; 2012–0.12; 2013–0.14; 2014–0.15; 2015–0.16; 2016–0.17; 2017–0.18; 2018–0.19; 2019–0.195; 2020–0.2) [23]. Since 2014, the policy makers decided to substantially decrease the mandatory quotas. For instance, in 2016 and 2017, mandatory annual quotas of electricity produced from RES that benefit from the promotion system were reduced to 12.15% and 8.3% as in [24,25].
Depending on its market share, each electricity supplier has to buy a certain number of GC. As a protection measure, the GC market price can vary between lower limit (27 Euro/MWh) and upper limit (55 Euro/MWh), so it protects electricity consumers on one side and generation companies (producers) on the other side. Minimum GC price is supposed to protect producers and enable them to prepare a minimal business plan. Setting the maximum GC price is intended to protect electricity consumers, to avoid a high GC price becoming a burden.
Therefore, all producers will receive GC (for each generated MW) if they are enabled by the National Regulatory Authority for Energy (based on their primary resources), but the obligation to buy GC is only on suppliers since they need to fulfill mandatory quotas. If the number of GC available on the market is higher than the request, there are three significant implications:
- GC price will go down to the minimal price;
- some GC will remain unsold since the offer is higher than the request;
- RES investors will become reluctant to extend their activities. Therefore, Pi of RES-based power plants will stagnate.
In case electricity suppliers are not able to fulfill mandatory quotas, penalties are imposed, being obliged to pay double the maximal GC price. In that case, the money is collected by the Transmission System Operator and stored in the development fund with the purpose of funding small RES projects.
4. Materials and Methods
In this section, as a novelty we propose an adaptive model for wind and photovoltaic energy integration in Romania regarding promoting scheme impact.
It is obvious that the private RES investors are tempted by the incentives given by government to sustain green energy generation. So that the investors’ interest in RES is directly proportional with the promoting scheme attractiveness, thus the wind and photovoltaic energy integration depend to some extent on the promoting scheme design.
Therefore, the proposed model provides valuable information for RES investors, policy and decision makers, giving indication on the WPP and PV installed power that would benefit from GC promoting scheme, without considering other obstacles related to wind and photovoltaic energy integration, such as grid capacity limits, power system reserves, etc.
The proposed approach is based on several estimations, such as: electricity consumption, installed power of other RES, full load hours and mandatory quotas. Therefore, on the one hand, the annual mandatory quotas are multiplied by the estimated gross electricity consumption. In this case, the electricity consumption covered by RES for year k is obtained. It is also known as total green consumption:
where:
- —total green consumption for year k;
- mandatory quota for year k;
- —total consumption for year k.
On the other hand, total green consumption is the sum of energy produced by WPP, PV, biomass, micro-hydro power plants and other power plants based on RES:
where:
- —energy produced by WPP for year k;
- —energy produced by PV for year k;
- —energy produced by biomass power plants for year k;
- —energy produced by micro-hydro power plants for year k;
- —energy produced by other power plants based on RES for year k;
- r—type of power plants based on RES;
- —energy produced by r for year k.
So, by using (1) and (2), we can determine the energy produced by WPP and PV:
In order to estimate the operation of different RES-based power plants, full load hours (FLH) are required that represent an annual number of hours that will take a given RES technology to yield its annual production if it is able to produce with its installed capacity all of the time.
By multiplying (where r is the type of power plants based on RES) with estimation of installed power , energy produced by each type of RES for year k is obtained:
The FLH are estimated based on global experience, but specific local conditions are also relevant. FLH may differ based on technology; more advanced technologies are designed to produce even when wind speed is lower or higher than well-known old standard thresholds, so that FLH can be seen as a sensitive estimation.
The installed power of other RES (except wind and photovoltaic energy that will be calculated) is another estimation considered in this model. Since all RES share the total green consumption, depending on the installed power of the other RES, the amount of green consumption that should be produced by WPP and PV varies.
Considering Equations (3) and (4), by reducing the total green consumption with the sum of energy produced by biomass and micro-hydro power plants, energy that should be produced by WPP, and PV, is obtained:
In order to estimate the WPP installed power and PV installed power , we split wind and photovoltaic energy based on their actual installed power ratio .
where:
- —actual WPP installed power;
- —actual PV installed power.
Therefore, the energy produced by WPP for year k and energy produced by PV for year k are obtained:
Then, dividing wind energy by number of specific FLH for wind energy , the estimation of WPP installed power for year k is obtained:
Also dividing photovoltaic energy by number of specific FLH for PV , the estimation of PV installed power for year k is obtained:
Considering Equations (1), (9) and (10), we show that and depend on mandatory quotas, total consumption, full load hours and installed power of other RES:
Based on this model, several numeric simulations regarding wind and photovoltaic energy integration from the promoting scheme point of view will be performed in Section 5. Taking into account the estimations considered in the model, a couple of sensitivity analyses will also be depicted in the next section.
5. Results
In this section, several simulations regarding wind and photovoltaic energy integration in Romania from the GC promoting scheme point of view are performed, revealing interesting figures for RES investors, policy and other decision makers. Since the variation of one of the estimations has an impact on the WPP/PV installed power or on wind/photovoltaic energy integration, different scenarios are analyzed in the following paragraphs.
The medium- and long-term electricity consumption forecast is one of the estimations of the proposed model; it is sensitive and takes into account historical data and trend of social and economic circumstances. However, it is difficult to estimate long-term influences of the global economic crisis that began in 2008 and profoundly affected Romania. Also, the electricity consumption estimations differ based on the moment in time (i.e., more optimistic estimations were envisioned in 2007) and different hypotheses regarding evolution of Gross Domestic Product (GDP) and population growth. Therefore, at least three scenarios should be taken into account when establishing these values: pessimistic, base case (or reference) and optimistic scenarios.
Out of the total green consumption, the WPP and PV supply a part of it. Therefore, in order to determine the part of the total green consumption that is covered by the WPP and PV, total energy that could be produced by the other RES should be estimated based on their installed power and FLH. Since in Romania, available significant RES apart from wind and photovoltaic energy are biomass and micro-small hydro energy, these will be considered as other RES in the simulations. However, the simulations can be performed for any type of RES in order to figure out the installed power that could benefit from GC support scheme.
In accordance with the National Action Plan for Renewable Energy Sources issued by Romanian authorities in 2010 [26], the estimation of installed power by 2020 for PV is 260 MW, for biomass power plants is 600 MW and for micro-hydro power plants is 730 MW. However, some of these figures are now far from the current development of the RES in Romania and, therefore, they may be considered only as indicative.
As for the mandatory quotas that the electricity suppliers should fulfill, they were initially established by Law no. 139/2010 for the period 2010–2020, but they were in force until 2013 because starting from 2014, the National Regulatory Authority for Energy (NRAE) diminished the annual mandatory quotas based on the methodology approved by Order no. 101/2015 [27]. Therefore, the annual quotas for the period 2014–2017 significantly decreased as a consequence of Order no. 101/2015, as follows:
- 2014: from 15% to 11.10%;
- 2015: from 16% to 11.90%;
- 2016: from 17% to 12.15%;
- 2017: from 18% to 8.30%.
Therefore, in 2017 the level of mandatory quota is equal to the mandatory quota in the first year of GC implementation (2010).
In Figure 4, changes in annual mandatory quotas are depicted. From 2017, we estimated the evolution of mandatory quotas as if they remain unchanged from 2017 to 2020 (grey line) or as average (blue line). However, due to the fact that the RES integration target is constantly rising by the EU policy, we expect that the mandatory quotas will rather follow or be above the blue line.
In the following subsections, five alternative scenarios will be performed in order to understand the impact of variation of one-by-one estimations on WPP/PV installed power or wind and photovoltaic energy integration from the GC promoting scheme point of view.
5.1. Initial Scenario
The first scenario consists in the following input data: quotas established by Law no. 139/2010, Methodology approved by Order no. 101/2014 and a couple of Notes issued by the NRAE regarding the mandatory quotas for electricity generated by the renewable energy sources that benefit from promoting system with GC for the years 2016 and 2017 [24,25], annually gross electricity consumption estimated in [28] and adjusted, as well as our estimation in terms of mandatory quotas up to 2020, expected FLH as in [29] and installed power Pi for other RES [20] (except wind and photovoltaic that will be calculated).
Input data of initial scenario is presented in Table 1. The results of initial scenario are described in Table 2.
Based on these assumptions, the installed power of WPP and installed power of PV that would benefit in 2020 from the promoting scheme are almost 1300 MW and 1000 MW. In order to raise this value, mandatory quotas or electricity consumption should be increased. The fact that only 1300 MW of WPP and 1000 MW of PV are supported by GC means that some producers are not able to sell the GC that they receive due to the fact that there is no request on the GC market.
However, drastically diminishing the mandatory quotas and less predictability have had a significant impact on the WPP and PV installed power that would benefit from GC. After the mandatory quotas were decreased, the number of applications from RES investors for grid connection to the grid significantly reduced.
With similar assumption except mandatory quotas considered as initially approved by Law no. 139/2010, the installed power of WPP and PV that would benefit from GC could have been around 3350 MW and 2600 MW, which, in the case of WPP, is close to the actual installed power.
5.2. Electricity Consumption Variation
In the second scenario, electricity consumption forecast variation for the period 2017–2020 is considered. On one hand, the National Energy Strategy estimated in 2007 a higher electricity consumption by 2015 and 2020: 74.5 and 85 TWh. This estimation was based on an economic scenario that is not very close to future evolution of economy. On the other hand, the National Forecasting Commission estimated in 2010 a smaller electricity consumption moderated by economic crisis and trends of increasing efficiency. GDP estimation for 2020 that was released in 2010 is only 77.4%, comparing with the forecast in 2007. Therefore, based on the moment in time when electricity consumption estimation has been made and due to the difficulties in forecasting the influences of the global economic crisis and energy efficiency measures on the future circumstances, electricity consumption is increased by 5%, while the rest of the assumptions are kept unchanged. This scenario is fully described in Table 3.
Based on these assumptions, in case the electricity consumption is increased by 5%, the installed power of WPP and installed power of PV that would benefit in 2020 from the promoting scheme are around 1400 MW and 1100 MW, higher with 100 MW than in the initial scenario due to the direct relation with consumption level. Therefore, in order to increase the wind and photovoltaic energy integration, electricity consumption could be stimulated by the policy makers.
5.3. Variation of Installed Power of other RES
In the third scenario, installed power of other RES is slightly increased according to the actual context, RES potential and investors’ applications, while the rest of the assumptions remain unchanged as in Table 4.
In case the proportion of the other RES increases in total green consumption, it is obvious that the installed power of WPP and PV that would benefit from promoting scheme will decrease. This scenario is fully described in Table 5.
In this scenario, the WPP installed power and PV installed power that would benefit in 2020 from GC promoting scheme are approximately 1200 MW and 900 MW, decreasing by approximately 100 MW compared to the initial scenario due to the fact that GC are shared by all RES.
5.4. Different FLH
In this scenario, we modified the FLH, since these figures are also rough estimations of the European Network Transmission System Operators for Electricity (ENTSO-E), while the rest of the assumptions remain unchanged.
In case the FLH of WPP are decreased from 1900 to 1700 h/year, according to other estimations [30,31], then the installed power of WPP that would benefit in 2020 from the GC is approximately 1450 MW. Also, in case the FLH of PV are decreased from 1100 to 1000 h/year based on [31], then the installed power of PV that would benefit in 2020 from the GC is around 1100 MW. This scenario is depicted in Table 6.
For less windy areas, FLH are lower and that means that more installed power of WPP would benefit from promoting scheme. Although FLH and installed power of other RES have an impact on wind and photovoltaic energy integration, they could not be influenced by the policy makers. Therefore, only mandatory quotas and electricity consumption increase could really improve the wind energy and photovoltaic integration, while FLH and installed power of other RES depend on meteorological conditions and private interests.
5.5. Best Estimation
In this scenario, we adjust variables of the model, considering our estimations in terms of electricity gross consumption (10% increase compared with initial scenario), mandatory quotas (slight increase), FLH and installed power of other RES. Assumptions regarding installed power of RES and FLH are presented in Table 7 and simulation of the scenario is depicted in Table 8.
In this scenario, the installed power of WPP that would benefit in 2020 from promoting scheme is approximately 2100 MW. Also, the installed power of PV that would benefit in 2020 from promoting scheme is around 1600 MW. Although the actual installed power of WPP/PV in Romania is more than 3000/1300 MW, investors cannot always obtain benefits from GC promoting scheme due to the lack of request on the GC market. It means that the estimated electricity consumption is not enough to sustain higher installed power of WPP.
However, in the future, we expect that electricity consumption and mandatory quotas will increase due to EU policies that set new ambitious targets for RES integration and also electricity consumption will be stimulated by the increased number of electric vehicles.
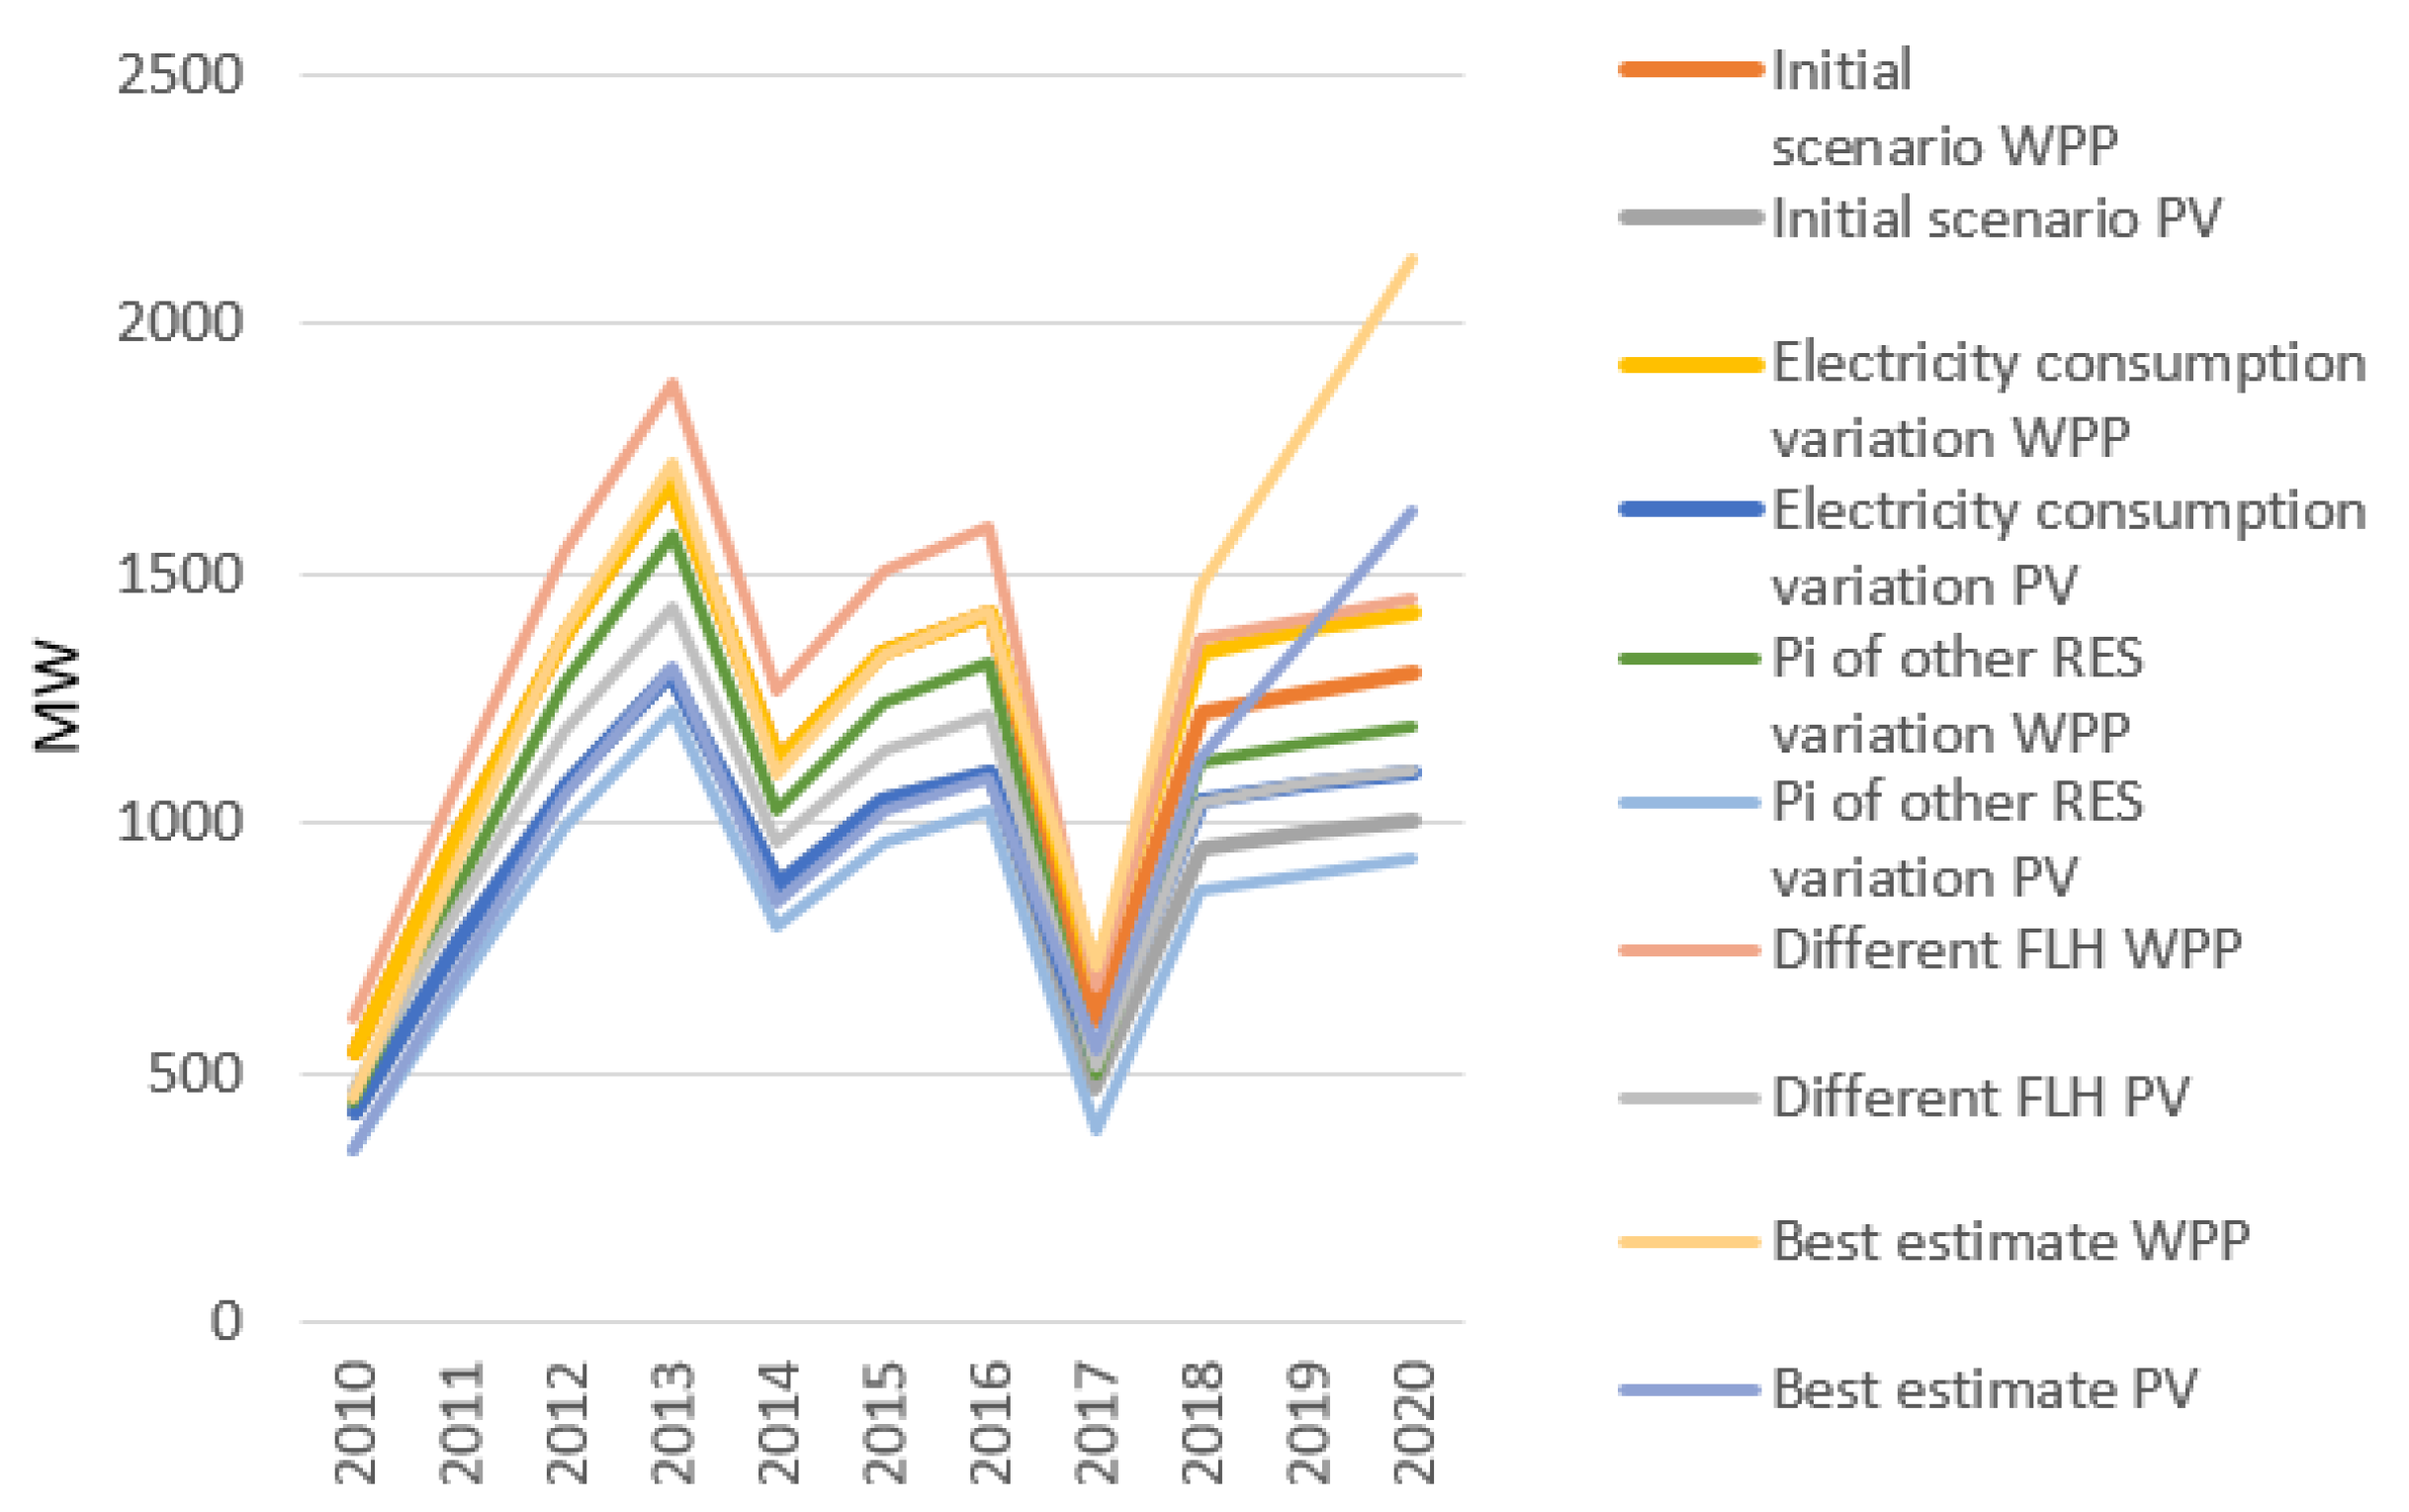
The results of the sensitivity analyses as shown in Table 9 and Figure 5 are indicative, based on several estimations. They can provide an indication for RES investors, policy and decision makers regarding instruments to stimulate wind and photovoltaic energy integration since the interest of RES investors is mainly focused on the outcome from the support scheme.
Therefore, clearly the design and implementation of the promoting scheme are important for wind and photovoltaic energy integration. By the proposed model, the installed power of any other RES could be also investigated.
6. Discussion and Conclusions
Wind and photovoltaic energy integration in Romania in terms of GC promoting scheme has been illustrated throughout the sections of this paper. As a novelty, we proposed a model for wind and photovoltaic energy integration in Romania from the support scheme point of view that gives an indication for WPP and PV installed power in the near future. It concerns the mechanism of RES promoting scheme applied in Romania consisting of mandatory quotas that energy suppliers have to acquire, estimation of electricity consumption and yearly operating time at maximum capacity of each type of RES.
In the end, our model for wind and photovoltaic energy integration from the promoting scheme point of view is implemented and several simulations are performed starting from an initial basic scenario. Then, the variables of the model are modified one-by-one in a sensitivity analysis. The simulations based on the proposed model reveal the installed power (range from 1200 to 2100 MW for WPP and 900 and 1600 MW for PV) that could benefit in 2020 from GC support in different scenarios.
Based on the proposed model, we indicate the installed power range of WPP and PV that could benefit from GC support scheme, showing that Pi of WPP and PV is a function of mandatory quotas, total consumption, full load hours and installed power of other RES, but only the consumption and quotas can be properly modified in order to encourage the wind and photovoltaic energy integration.
The model can also be easily implemented for other RES technology, indicating the installed power of biomass or micro-hydro power plants that would benefit from the support scheme, providing sound indication for RES investors, policy and strategy makers.
Acknowledgments
This paper presents the scientific results of the project “Intelligent system for trading on wholesale electricity market” (SMARTRADE), co-financed by the European Regional Development Fund (ERDF), through the Competitiveness Operational Programme (COP) 2014–2020, priority axis 1—Research, technological development and innovation (RD&I) to support economic competitiveness and business development, Action 1.1.4—Attracting high-level personnel from abroad in order to enhance the RD capacity, contract ID P_37_418, no. 62/05.09.2016, beneficiary: The Bucharest University of Economic Studies.
Author Contributions
All authors contributed equally to this work.
Conflicts of Interest
The authors declare no conflict of interest.
References
- European Network Transmission System Operator for Electricity (ENTSO-E). RES Directive Review: ENTSO-E Views on RES Support Schemes. Available online: https://www.entsoe.eu/publications/position-papers/position-papers-archive/Pages/Position%20Papers/RES-Directive-review-ENTSO-E-views-on-RES-support-schemes.aspx (accessed on 15 September 2017).
- Council of European Energy Regulators (CEER). Key Support Elements of RES in Europe: Moving towards Market Integration. Available online: https://www.ceer.eu/documents/104400/3728813/C15_SDE-49-03+CEER+report+on+key+support+elements_26_January_2016.pdf/28b53e80-81cf-f7cd-bf9b-dfb46d471315 (accessed on 9 September 2017).
- Varfolomejeva, R.; Sauhats, A.; Sokolovs, N.; Coban, H. The influence of small-scale power plant supporting schemes on the public trader and consumers. Energies 2017, 10, 800. [Google Scholar] [CrossRef]
- Atanasoae, P.; Hopulele, E. The impact of the support scheme on the installed capacity in renewable energy sources in Romania. In Proceedings of the 2014 International Conference and Exposition on Electrical and Power Engineering (EPE), Iasi, Romania, 16–18 October 2014; IEEE: Piscataway, NJ, USA, 2014; pp. 1148–1151. [Google Scholar]
- Atanasoae, P.; Pentiuc, R.; Bobric, C.; Hopulele, E. The evolution of the support scheme for promoting renewable energy sources in Romania. Renew. Energy Environ. Sustain. 2016, 1, 27. [Google Scholar] [CrossRef]
- Torbaghan, S.S.; Müller, H.; Gibescu, M.; Meijden, M.; Roggenkamp, M. Impact of wind energy support schemes on the development of an offshore grid in the North Sea. In Proceedings of the 2014 IEEE PES General Meeting, National Harbor, MD, USA, 27–31 July 2014; IEEE: Piscataway, NJ, USA, 2014. [Google Scholar]
- Varfolomejeva, R.; Iljina, I.; Coban, H.; Sokolovs, N.; Sauhats, A. The limiting factors and supporting schemes influence on small-scale power plant work. In Proceedings of the 2016 IEEE 16th International Conference on Environment and Electrical Engineering (EEEIC), Florence, Italy, 7–10 June 2016; IEEE: Piscataway, NJ, USA, 2016. [Google Scholar]
- Pardi, L.; Cosentino, N. It’s something unpredictable but who shall set it right? Change in law in RES support schemes and investment protection instruments under EU law and the ECT. In Proceedings of the 2012 9th International Conference on European Energy Market (EEM), Florence, Italy, 10–12 May 2012; IEEE: Piscataway, NJ, USA, 2012. [Google Scholar]
- Pablodel, R. Analysing the interactions between renewable energy promotion and energy efficiency support schemes: The impact of different instruments and design elements. Energy Policy 2010, 38, 4978–4989. [Google Scholar] [CrossRef]
- Miera, G.S.; del Rio Gonzalez, P.; Vizcaino, I. Analysing the impact of renewable electricity support schemes on power prices: The case of wind electricity in Spain. Energy Policy 2008, 36, 3345–3359. [Google Scholar] [CrossRef]
- Verbruggen, A.; Lauber, V. Assessing the performance of renewable electricity support instruments. Energy Policy 2012, 45, 635–644. [Google Scholar] [CrossRef]
- Pahle, M.; Schill, W.P.; Gambardella, C.; Tietjena, O. Renewable Energy Support, Negative Prices, and Real-time Pricing. Energy J. 2016, 37, 147–169. [Google Scholar] [CrossRef]
- Lehmann, P.; Gawel, E. Why should support schemes for renewable electricity complement the EU emissions trading scheme? Energy Policy 2013, 52, 597–607. [Google Scholar] [CrossRef]
- Iychettira, K.K.; Linares, P.; Hakvoort, R.A. Harmonising RES-E support schemes using design elements. In Proceedings of the 2015 12th International Conference on the European Energy Market (EEM), Lisbon, Portugal, 19–22 May 2015; IEEE: Piscataway, NJ, USA, 2015. [Google Scholar]
- Knápek, J.; Haas, R. New challenges in RES support. In Proceedings of the 2016 2nd International Conference on Intelligent Green Building and Smart Grid (IGBSG), Prague, Czech Republic, 27–29 June 2016; IEEE: Piscataway, NJ, USA, 2016. [Google Scholar]
- Boute, A. Promoting Renewable Energy through Capacity Markets: An Analysis of the Russian Support Scheme. Energy Policy 2012, 46, 68–77. [Google Scholar] [CrossRef]
- Canton, J.; Lindén, Å.J. Directorate-General for Economics and Financial Affairs. European Commission. Support Schemes for Renewable Electricity in the EU. Economic Papers 408. Available online: http://ec.europa.eu/economy_finance/publications/economic_paper/2010/pdf/ecp408_en.pdf (accessed on 1 September 2017).
- European Parliament. Promotion of Renewable Energy Sources in the EU. Available online: http://www.europarl.europa.eu/thinktank/en/document.html?reference=EPRS_IDA(2016)583810 (accessed on 10 September 2017).
- European Commission. Renewables: Europe on Track to Reach Its 20% Target by 2020. Available online: http://europa.eu/rapid/press-release_MEMO-17-163_en.htm (accessed on 26 August 2017).
- Generation Data. Available online: http://www.transelectrica.ro/web/tel/productie (accessed on 4 August 2017).
- Law No. 220/2008 Regarding the Establishment of Promotion System for Renewable Energy Sources. Published in Official Monitor, Part I, No. 577 from 13 August 2010. Available online: https://www.ecolex.org/details/legislation/law-no-2202008-for-establishing-the-system-to-promote-the-production-of-energy-from-renewable-energy-sources-lex-faoc115082/ (accessed on 6 August 2017).
- Law No. 134/2012 for Approval of OUG No. 88/2001 Regarding Modification and Completion of Law No. 220/2008 for Establishment of Promotion System for Renewable Energy Sources. Published in Official Monitor, Part I, No. 505 from 23 July 2012. Available online: http://leg-armonizata.minind.ro/leg_armonizata/energie/Legea_134_2012.pdf (accessed on 28 August 2017).
- Law No. 139/2010 Regarding Modification and Completion of Law No. 220/2008 for Establishment of Promotion System for Renewable Energy Sources. Published in Official Monitor, Part I, No. 474 from 9 June 2010. Available online: https://www.ecolex.org/details/legislation/law-no-1392010-concerning-the-modification-and-completion-of-law-no-2202008-for-establishing-the-system-to-promote-the-production-of-energy-from-renewable-energy-sources-lex-faoc115096/ (accessed on 31 August 2017).
- National Regulatory Authority for Energy (NRAE). Note Regarding the Mandatory Quota for Electricity Generated by the Renewable Energy Sources that Benefit from Promoting System with Green Certificates for Year 2016. Available online: http://www.anre.ro/ro/legislatie/surse-regenerabile/piata-de-certificate-verzi-2016 (accessed on 24 July 2017).
- National Regulatory Authority for Energy (NRAE). Note Regarding the Mandatory Quota for Electricity Generated by the Renewable Energy Sources that Benefit from Promoting System with Green Certificates for Year 2017. Available online: http://www.anre.ro/ro/legislatie/surse-regenerabile/piata-de-certificate-verzi-2017 (accessed on 25 July 2017).
- Economy Ministry. National Action Plan for Renewable Energy Sources. Available online: https://ec.europa.eu/energy/en/topics/renewable-energy/national-action-plans (accessed on 17 April 2017).
- National Regulatory Authority for Energy (NRAE). Order No. 101/01.07.2015 for Approval of the Methodology for Establishment of the Mandatory Annual Quotas for Electricity Generated by Renewable Energy Sources that Benefit from the Promotion System with Green Certificates and Acquisition of the Green Certificates. Available online: http://www.anre.ro/ro/energie-electrica/decizii-si-ordine (accessed on 26 May 2017).
- Economy Ministry. National Energy Strategy of Romania for Period 2007–2020, Updated for 2011–2020. Available online: http://www.minind.ro/energie/STRATEGIA_energetica_actualizata.pdf (accessed on 30 July 2017).
- ENTSO-E. Scenario Outlook and Adequacy Forecast 2013–2030. Available online: https://www.entsoe.eu/publications/system-development-reports/adequacy-forecasts/soaf-2013-2030/Pages/default.aspx (accessed on 4 April 2017).
- Fraunhofer IWES Wind Monitor Full-load Hours. Available online: http://windmonitor.iwes.fraunhofer.de/windmonitor_en/3_Onshore/5_betriebsergebnisse/1_volllaststunden/ (accessed on 28 November 2017).
- Huber, M.; Dimkova, D.; Hamacher, T. Integration of wind and solar power in Europe: Assessment of flexibility requirements. Energy J. 2014, 69, 236–246. [Google Scholar] [CrossRef]
Figure 1.
Installed power (Pi) of different primary sources in Romania as of November 2017.
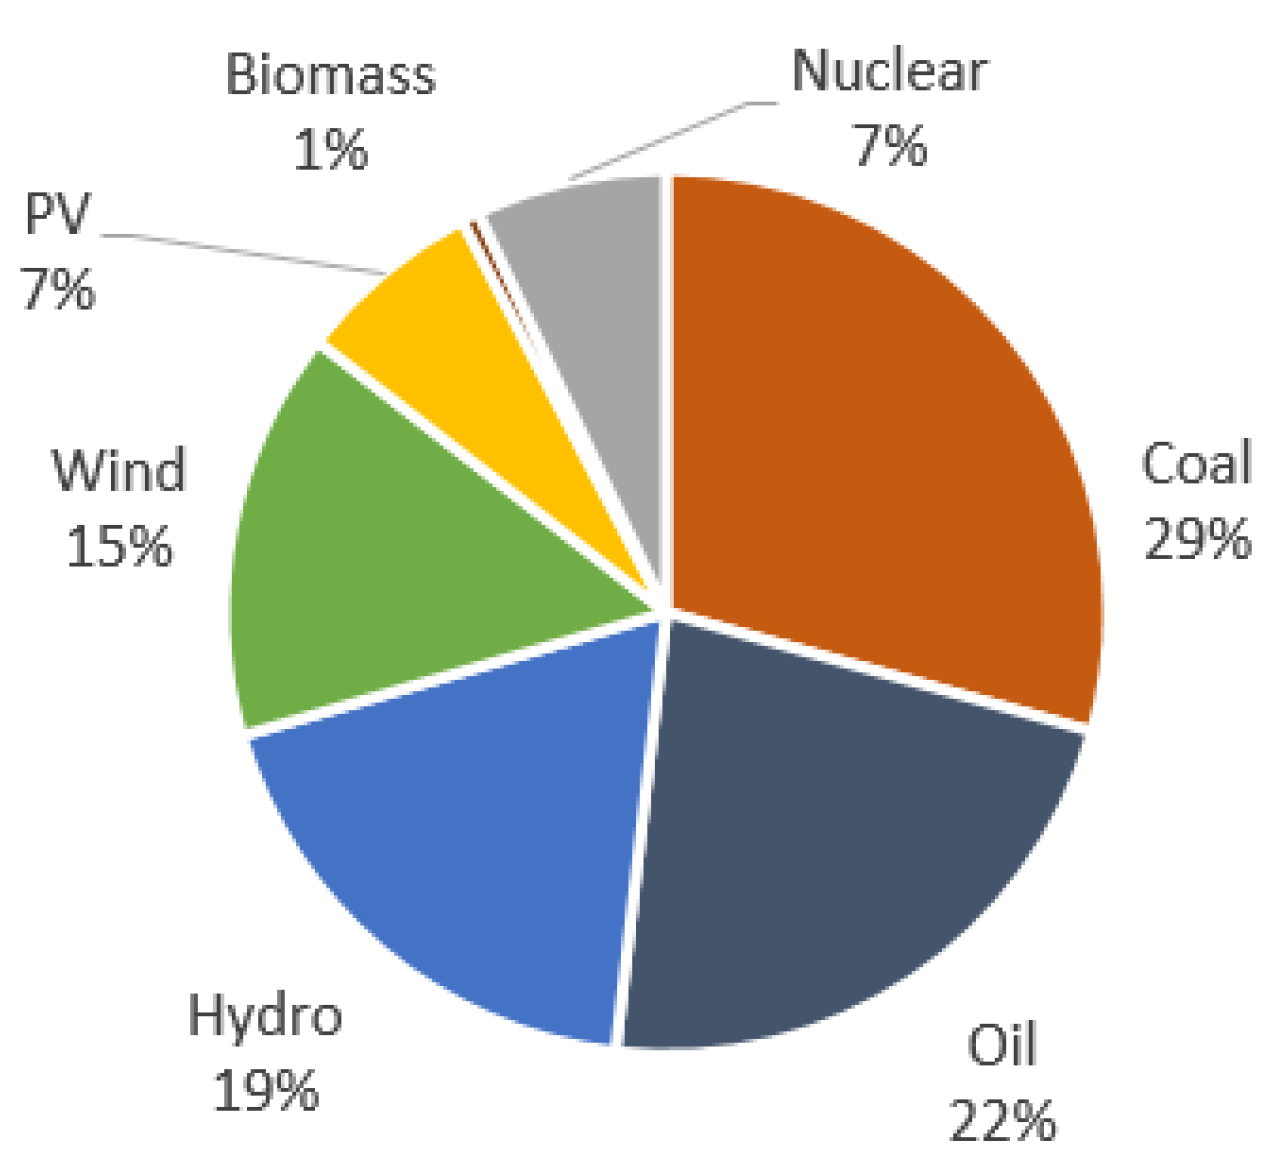
Figure 2.
Pi [MW] of wind power plant (WPP) in Romania during 2010–2017.

Figure 3.
Pi [MW] of renewable energy sources (RES) in Romania as of November 2017.

Figure 4.
Different quotas as a consequence of legislation modification.
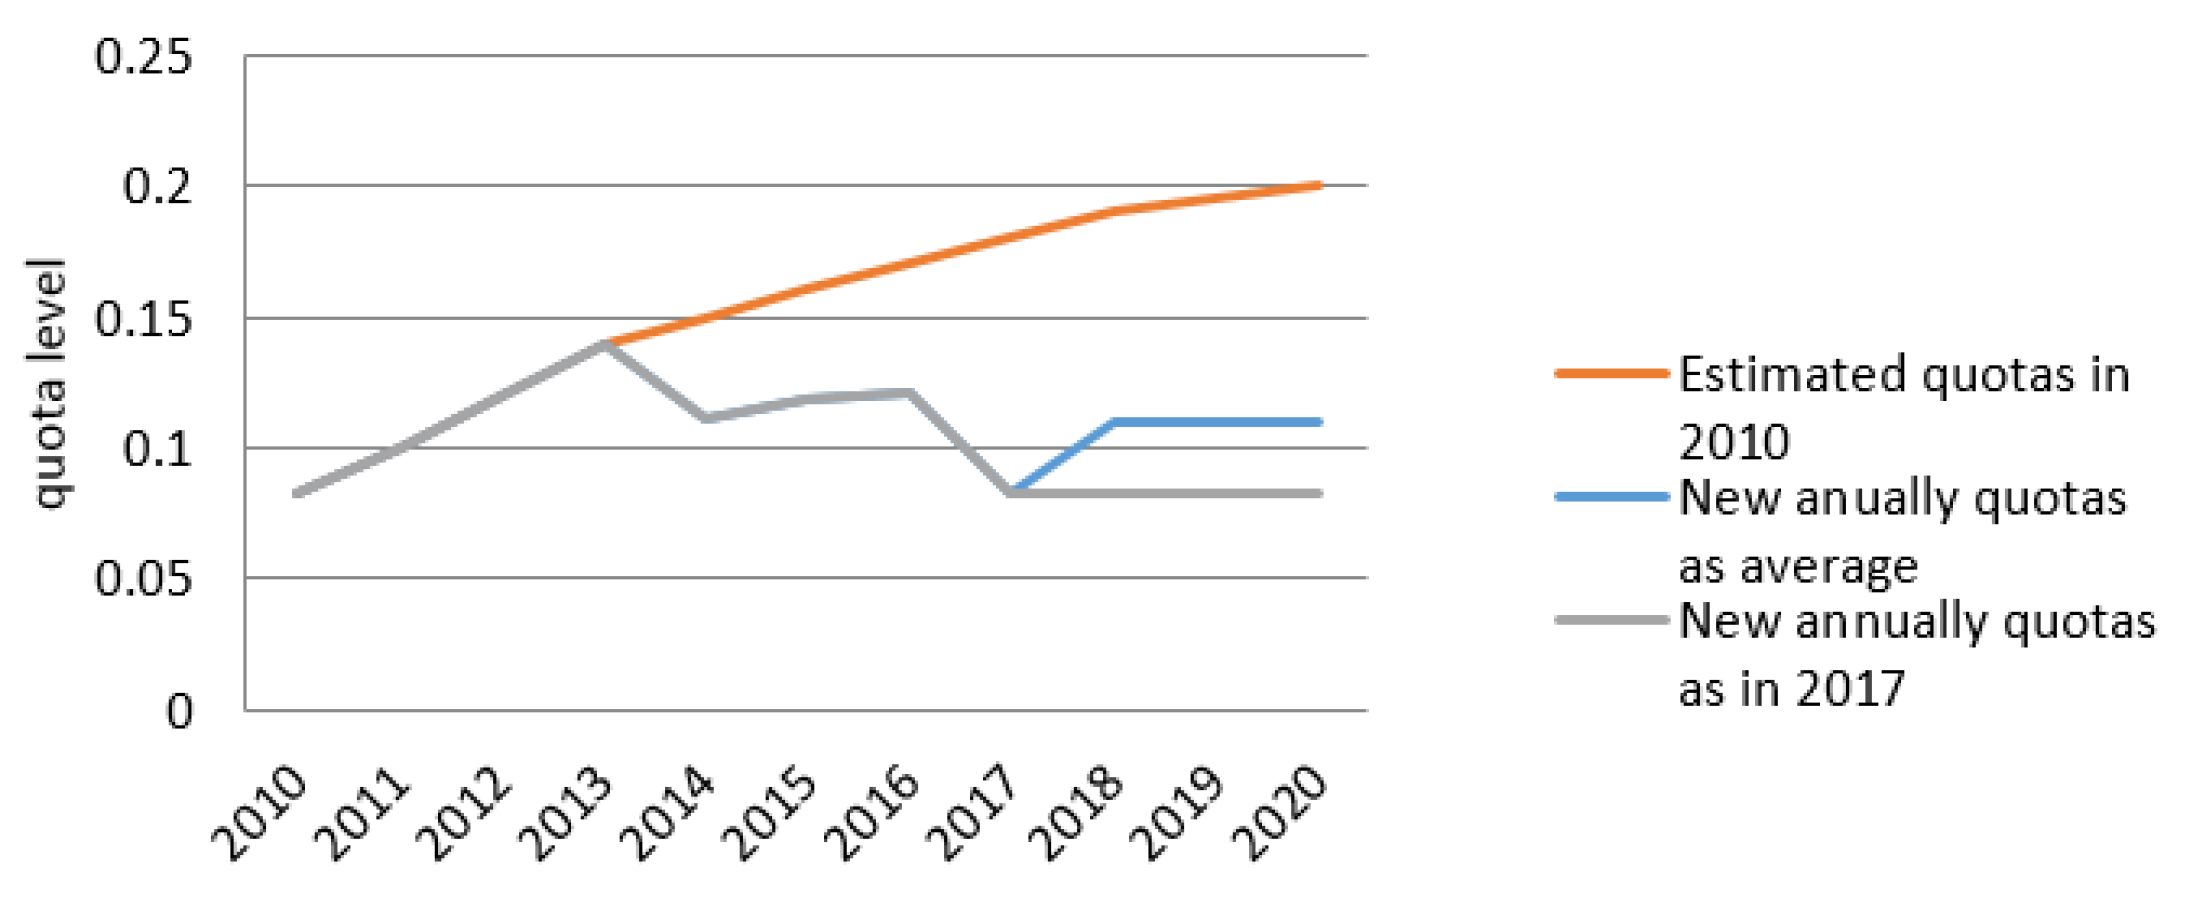
Figure 5.
Simulation of different scenarios of wind energy integration.

Table 1.
Full load hours (FLH) and installed power (Pi) of renewable energy sources (RES).
| RES Type | FLH [h/Year] | Pi [MW] |
|---|---|---|
| Biomass | 5700 | 131 |
| Micro-hydro | 3900 | 655 |
| Wind | 1900 | to be calculated |
| Photovoltaic (PV) | 1100 | to be calculated |
Table 2.
Simulation of initial scenario.
| Year | Quotas | Gross Consumption [TWh] | Total Green Consumption [TWh] | WPP + PV Energy [TWh] | Pi WPP [MW] | Pi PV [MW] |
|---|---|---|---|---|---|---|
| 2010 | 0.083 | 57.80 | 4.80 | 1.50 | 543 | 422 |
| 2011 | 0.1 | 60.03 | 6.00 | 2.70 | 981 | 761 |
| 2012 | 0.12 | 59.28 | 7.11 | 3.81 | 1384 | 1074 |
| 2013 | 0.14 | 56.64 | 7.93 | 4.63 | 1681 | 1304 |
| 2014 | 0.111 | 57.73 | 6.41 | 3.11 | 1128 | 876 |
| 2015 | 0.119 | 58.83 | 7.00 | 3.70 | 1344 | 1043 |
| 2016 | 0.1215 | 59.39 | 7.22 | 3.91 | 1422 | 1103 |
| 2017 | 0.083 | 59.70 | 4.96 | 1.65 | 601 | 466 |
| 2018 | 0.11 | 60.60 | 6.67 | 3.36 | 1222 | 948 |
| 2019 | 0.11 | 61.60 | 6.78 | 3.47 | 1262 | 979 |
| 2020 | 0.11 | 62.50 | 6.88 | 3.57 | 1298 | 1007 |
Table 3.
Simulation of electricity consumption variation scenario.
| Year | Quotas | Gross Consumption [TWh] | Total Green Consumption [TWh] | WPP + PV Energy [TWh] | Pi WPP [MW] | Pi PV [MW] |
|---|---|---|---|---|---|---|
| 2017 | 0.083 | 62.69 | 5.20 | 1.90 | 691 | 536 |
| 2018 | 0.11 | 63.63 | 7.00 | 3.70 | 1343 | 1042 |
| 2019 | 0.11 | 64.68 | 7.11 | 3.81 | 1385 | 1075 |
| 2020 | 0.11 | 65.63 | 7.22 | 3.92 | 1423 | 1104 |
Table 4.
FLH and Pi of RES.
| RES Type | FLH [h/Year] | Pi [MW] |
|---|---|---|
| Biomass | 5700 | 150 |
| Micro-hydro | 3900 | 700 |
| Wind | 1900 | to be calculated |
| Solar | 1100 | to be calculated |
Table 5.
Simulation of Pi of other RES variation scenario.
| Year | Quotas | Gross Consumption [TWh] | Total Green Consumption [TWh] | WPP + PV Energy [TWh] | Pi WPP [MW] | Pi PV [MW] |
|---|---|---|---|---|---|---|
| 2017 | 0.083 | 59.70 | 4.96 | 1.37 | 498 | 386 |
| 2018 | 0.11 | 60.60 | 6.67 | 3.08 | 1119 | 868 |
| 2019 | 0.11 | 61.60 | 6.78 | 3.19 | 1159 | 899 |
| 2020 | 0.11 | 62.50 | 6.88 | 3.29 | 1195 | 927 |
Table 6.
Simulation of FLH variation scenario.
| Year | Quotas | Gross Consumption [TWh] | Total Green Consumption [TWh] | WPP + PV Energy [TWh] | Pi WPP [MW] | Pi PV [MW] |
|---|---|---|---|---|---|---|
| 2017 | 0.083 | 59.70 | 4.96 | 1.65 | 671 | 513 |
| 2018 | 0.11 | 60.60 | 6.67 | 3.36 | 1366 | 1043 |
| 2019 | 0.11 | 61.60 | 6.78 | 3.47 | 1410 | 1077 |
| 2020 | 0.11 | 62.50 | 6.88 | 3.57 | 1451 | 1108 |
Table 7.
FLH and Pi in case of best scenario.
| RES Type | FLH [h/Year] | Pi [MW] |
|---|---|---|
| Biomass | 6000 | 150 |
| Micro-hydro | 4000 | 700 |
| Wind | 1700 | to be calculated |
| PV | 1000 | to be calculated |
Table 8.
Simulation of best scenario.
| Year | Quotas | Gross Consumption [TWh] | Total Green Consumption [TWh] | WPP + PV Energy [TWh] | Pi WPP [MW] | Pi PV [MW] |
|---|---|---|---|---|---|---|
| 2017 | 0.083 | 65.67 | 5.45 | 1.75 | 711 | 543 |
| 2018 | 0.11 | 66.66 | 7.33 | 3.63 | 1474 | 1126 |
| 2019 | 0.12 | 67.76 | 8.13 | 4.43 | 1799 | 1374 |
| 2020 | 0.13 | 68.75 | 8.94 | 5.24 | 2126 | 1624 |
Table 9.
Pi of WPP and PV in different scenarios.
| Year | Initial Scenario WPP | Initial Scenario PV | Electricity Cons. WPP | Electricity Cons. PV | Pi of Other RES WPP | Pi of Other RES PV | Diff. FLH WPP | Diff. FLH PV | Best Estimate WPP | Best Estimate PV |
|---|---|---|---|---|---|---|---|---|---|---|
| 2010 | 543 | 422 | 543 | 422 | 440 | 342 | 607 | 464 | 445 | 340 |
| 2011 | 981 | 761 | 981 | 761 | 878 | 681 | 1097 | 838 | 935 | 714 |
| 2012 | 1384 | 1074 | 1384 | 1074 | 1281 | 994 | 1547 | 1182 | 1385 | 1058 |
| 2013 | 1681 | 1304 | 1681 | 1304 | 1578 | 1224 | 1879 | 1435 | 1717 | 1311 |
| 2014 | 1128 | 876 | 1128 | 876 | 1025 | 796 | 1261 | 963 | 1099 | 839 |
| 2015 | 1344 | 1043 | 1344 | 1043 | 1240 | 963 | 1502 | 1147 | 1340 | 1023 |
| 2016 | 1422 | 1103 | 1422 | 1103 | 1319 | 1023 | 1589 | 1214 | 1427 | 1090 |
| 2017 | 601 | 466 | 691 | 536 | 498 | 386 | 671 | 513 | 711 | 543 |
| 2018 | 1222 | 948 | 1343 | 1042 | 1119 | 868 | 1366 | 1043 | 1474 | 1126 |
| 2019 | 1262 | 979 | 1385 | 1075 | 1159 | 899 | 1410 | 1077 | 1799 | 1374 |
| 2020 | 1298 | 1007 | 1423 | 1104 | 1195 | 927 | 1451 | 1108 | 2126 | 1624 |
© 2017 by the authors. Licensee MDPI, Basel, Switzerland. This article is an open access article distributed under the terms and conditions of the Creative Commons Attribution (CC BY) license (http://creativecommons.org/licenses/by/4.0/).
Share and Cite
MDPI and ACS Style
Oprea, S.-V.; Bâra, A. Analyses of Wind and Photovoltaic Energy Integration from the Promoting Scheme Point of View: Study Case of Romania. Energies 2017, 10, 2101. https://doi.org/10.3390/en10122101
AMA Style
Oprea S-V, Bâra A. Analyses of Wind and Photovoltaic Energy Integration from the Promoting Scheme Point of View: Study Case of Romania. Energies. 2017; 10(12):2101. https://doi.org/10.3390/en10122101
Chicago/Turabian StyleOprea, Simona-Vasilica, and Adela Bâra. 2017. "Analyses of Wind and Photovoltaic Energy Integration from the Promoting Scheme Point of View: Study Case of Romania" Energies 10, no. 12: 2101. https://doi.org/10.3390/en10122101
Note that from the first issue of 2016, this journal uses article numbers instead of page numbers. See further details here.