Article

Directionality Effects of Aligned Wind and Wave Loads on a Y-Shape Semi-Submersible Floating Wind Turbine under Rated Operational Conditions

1
Shenzhen Graduate School, Harbin Institute of Technology, Shenzhen 518055, China
2
School of Civil Engineering, Harbin Institute of Technology, Harbin 150001, China
3
Department of Civil and Environmental Engineering, The Hong Kong University of Science and Technology, Hong Kong, China
4
XEMC Windpower Co., Ltd., Xiangtan 411102, China
*
Author to whom correspondence should be addressed.
Energies 2017, 10(12), 2097; https://doi.org/10.3390/en10122097
Submission received: 28 October 2017 / Revised: 5 December 2017 / Accepted: 6 December 2017 / Published: 11 December 2017
(This article belongs to the Section I: Energy Fundamentals and Conversion)

Abstract

:
The Y-shape (triangular) semi-submersible foundation has been adopted by most of the built full-scale floating wind turbines, such as Windfloat, Fukushima Mirai and Shimpuu. Considering the non-fully-symmetrical shape and met-ocean condition, the foundation laying angle relative to wind/wave directions will not only influence the downtime and power efficiency of the floating turbine, but also the strength and fatigue safety of the whole structure. However, the dynamic responses induced by various aligned wind and wave load directions have scarcely been investigated comparatively before. In our study, the directionality effects are investigated by means of combined wind and wave tests and coupled multi-body simulations. By comparing the measured data in three load directions, it is found that the differences of platform motions are mainly derived from the wave loads and larger pitch motion can always be observed in one of the directions. To make certain the mechanism underlying the observed phenomena, a coupled multi-body dynamic model of the floating wind turbine is established and validated. The numerical results demonstrate that the second-order hydrodynamic forces contribute greatly to the directionality distinctions for surge and pitch, and the first-order hydrodynamic forces determine the variations of tower base bending moments and nacelle accelerations. These findings indicate the directionality effects should be predetermined comprehensively before installation at sea, which is important for the operation and maintenance of the Y-shape floating wind turbines.

1. Introduction

Humans are currently faced with serious energy and environmental challenges, so it has become all the more urgent to change the traditional constitution of energy sources. Adopting clean, renewable energy such as wind power is critical. Compared with onshore winds, worldwide offshore wind resources have proved to be more abundant and consistent, less visual, noise annoyance and variability on market price [1,2]. It is estimated that offshore wind could contribute to nearly 5.5% of the world’s electricity by the year 2050 [3]. Hence, offshore wind energy is becoming one of the most promising sources of renewable energy. The current bottom-fixed offshore wind turbines have only seen limited deployment to water depths of 30 m [4]. Beyond that range, construction costs will surge. Recently, the development of floating offshore wind turbine (FOWT) technology is making deep water wind energy exploitation realizable.
Learning from the experience developed in the offshore oil and gas industry, four types of floating foundation are available for FOWTs, i.e., spar-buoys, semi-submersible, barges and tension leg platform (TLP). Some full-scale prototype FOWTs have been tested at sea: the spar-type Hywind [5] with a 2.3 MW wind turbine was installed in 2009; the semi-submersible WindFloat [6] equipped with a 2 MW wind turbine was launched in 2011; one spar-type and two semi-submersible floating wind turbines were built with support from the Fukushima Offshore Wind Farm Demonstration Project [7] from 2011 to 2016. Due to its good site-adaptability and easy installation [8], the triangular semi-submersible foundation, which is generally composed of three outer columns, has been adopted by most of these existing full-scale FOWTs, such as Windfloat [6], Fukushima Mirai and Shimpuu [7]. However, the non-fully-symmetrical shape makes the semi-submersible FOWT sensitive to wind/wave direction. The stability and hydrodynamic characteristics can be different along with wind/wave headings, ultimately resulting in different dynamic responses. Hence, a better understanding of directionality effects on the semi-submersible FOWT will be beneficial to mitigate loadings and improve power generation efficiency.
Scale model tests and numerical simulations are two major ways for the FOWT dynamics research. Although it is quite expensive to conduct wave flume/basin tests, it should be noted that it is the only validated approach to capture the strongly nonlinear phenomena in complex ocean environment except full-scale tests [9]. The purposes for the existing semi-submersible FOWT model tests can be categorized into two groups [10]. The first group is to validate numerical simulations. Roddier et al. [6] conducted a 1/105 scale model of the WindFloat platform to test the validity of the numerical simulations performed with TIMEFLOAT. Coulling et al. [11] validated the DeepCwind OC4 semi-submersible FOWT model [12] established in the floating wind turbine simulator FAST [13] with the 1/50th-scale model test data. The second one is to investigate the dynamic response of the FOWT system with specific features. Michailides et al. [14] and Gao et al. [15] examined the functionality of a semi-submersible wind energy and flap-type wave energy converter (SFC) through a 1/50th scale physical model. Chen and Hu [16] investigated the aerodynamics-induced dynamic characteristics of OC4 semi-submersible FOWT model by a 1/50th scale model. Valuable information had been concluded from these model tests. However, only one load direction was employed in these tests, while wind/wave directions are always changeable in real offshore conditions. Up until now, numbered tests had been carried out with different wind/wave directions [17], but the discussions on realistic dynamics performance of the semi-submersible FOWTs under different load directions are scarce and remain unclear.
Numerical simulations are economical and informative, serving as a good complement of scale model tests. In general, the numerical approach used for FOWT dynamics analysis is based on the hybrid frequency and time domain method [18]. The hydrodynamic coefficients such as added mass, radiation damping and wave excitation forces are obtained through a potential flow solver in frequency domain and then transferred to time domain through retardation functions or Fourier transform [19]. At the same time, the aerodynamic forces from wind turbine and mooring line forces are calculated based on Blade Element Momentum theory (BEM)/Generalize Dynamic Wake theory (GDW) [20] and quasi-static method [21]/lumped-mass approach [22] respectively. Ultimately, through multi-body dynamics analysis [23], the coupled dynamic responses can be obtained. This analysis approach has been utilized by the FOWT numerical codes such as FAST [13] and SIMO-RIFLEX-AeroDyn [24].
With the aid of this numerical approach, the wind-wave directionality effects on FOWTs have been discussed in the previous studies. Philippe et al. [25,26] compared the motion Response Amplitude Operators (RAOs) of the MIT/NREL Shallow Drafted Barge (SDB) [27] in five wave directions relative to wind. They found that the largest surge, heave, pitch motions and the smallest sway, roll, yaw motions occurred in the aligned wind and wave condition, while an opposite trend was observed during 90° misalignment conditions. Using a more sophisticated time domain numerical model, Ramachandran et al. [28] reported a similar trend according to the effects of wind and wave load direction on a TLP FOWT. Barj et al. [29,30] discovered that although including the misaligned wind and wave conditions will be helpful to improve the estimation of extreme and fatigue loads, the highest extreme and fatigue loads for most structure locations are inclined to occur in the aligned wind and wave conditions. However, these findings are specific to the spar-type FOWT. More generally, Bachynski et al. [31] investigated the motions and tower base fatigue loads of four kinds of offshore foundations, i.e., a spar, a tension leg platform and two semi-submersible platforms, in aligned as well as misaligned conditions. The literature demonstrated that the motions would be slightly increased in several misaligned conditions, but the largest tower base fatigue damages were caused by the aligned wind and wave conditions. In addition, Bachynski et al. compared the tower base fatigue damages of a semi-submersible FOWT in two aligned wind and wave directions. Karimirad et al. [32] also found that there was no visible adverse impact of the misaligned conditions on the motions, tension of mooring lines and power production of a V-shaped semi-submersible FOWT system under operational conditions.
These published works mainly focused on the impact of wind and wave misalignment, but most conclusions indicate that the aligned wind and wave conditions are usually more important, particularly on the occasions of the highest extreme loads. However, up to now, numerical studies on the effects of aligned wind and wave from different directions on the non-fully-symmetrical semi-submersible FOWT are very scarce. In addition, the main causes of the directionality effects, which are essential to make a comprehensive understanding of these phenomena, have not been discussed by the aforementioned studies.
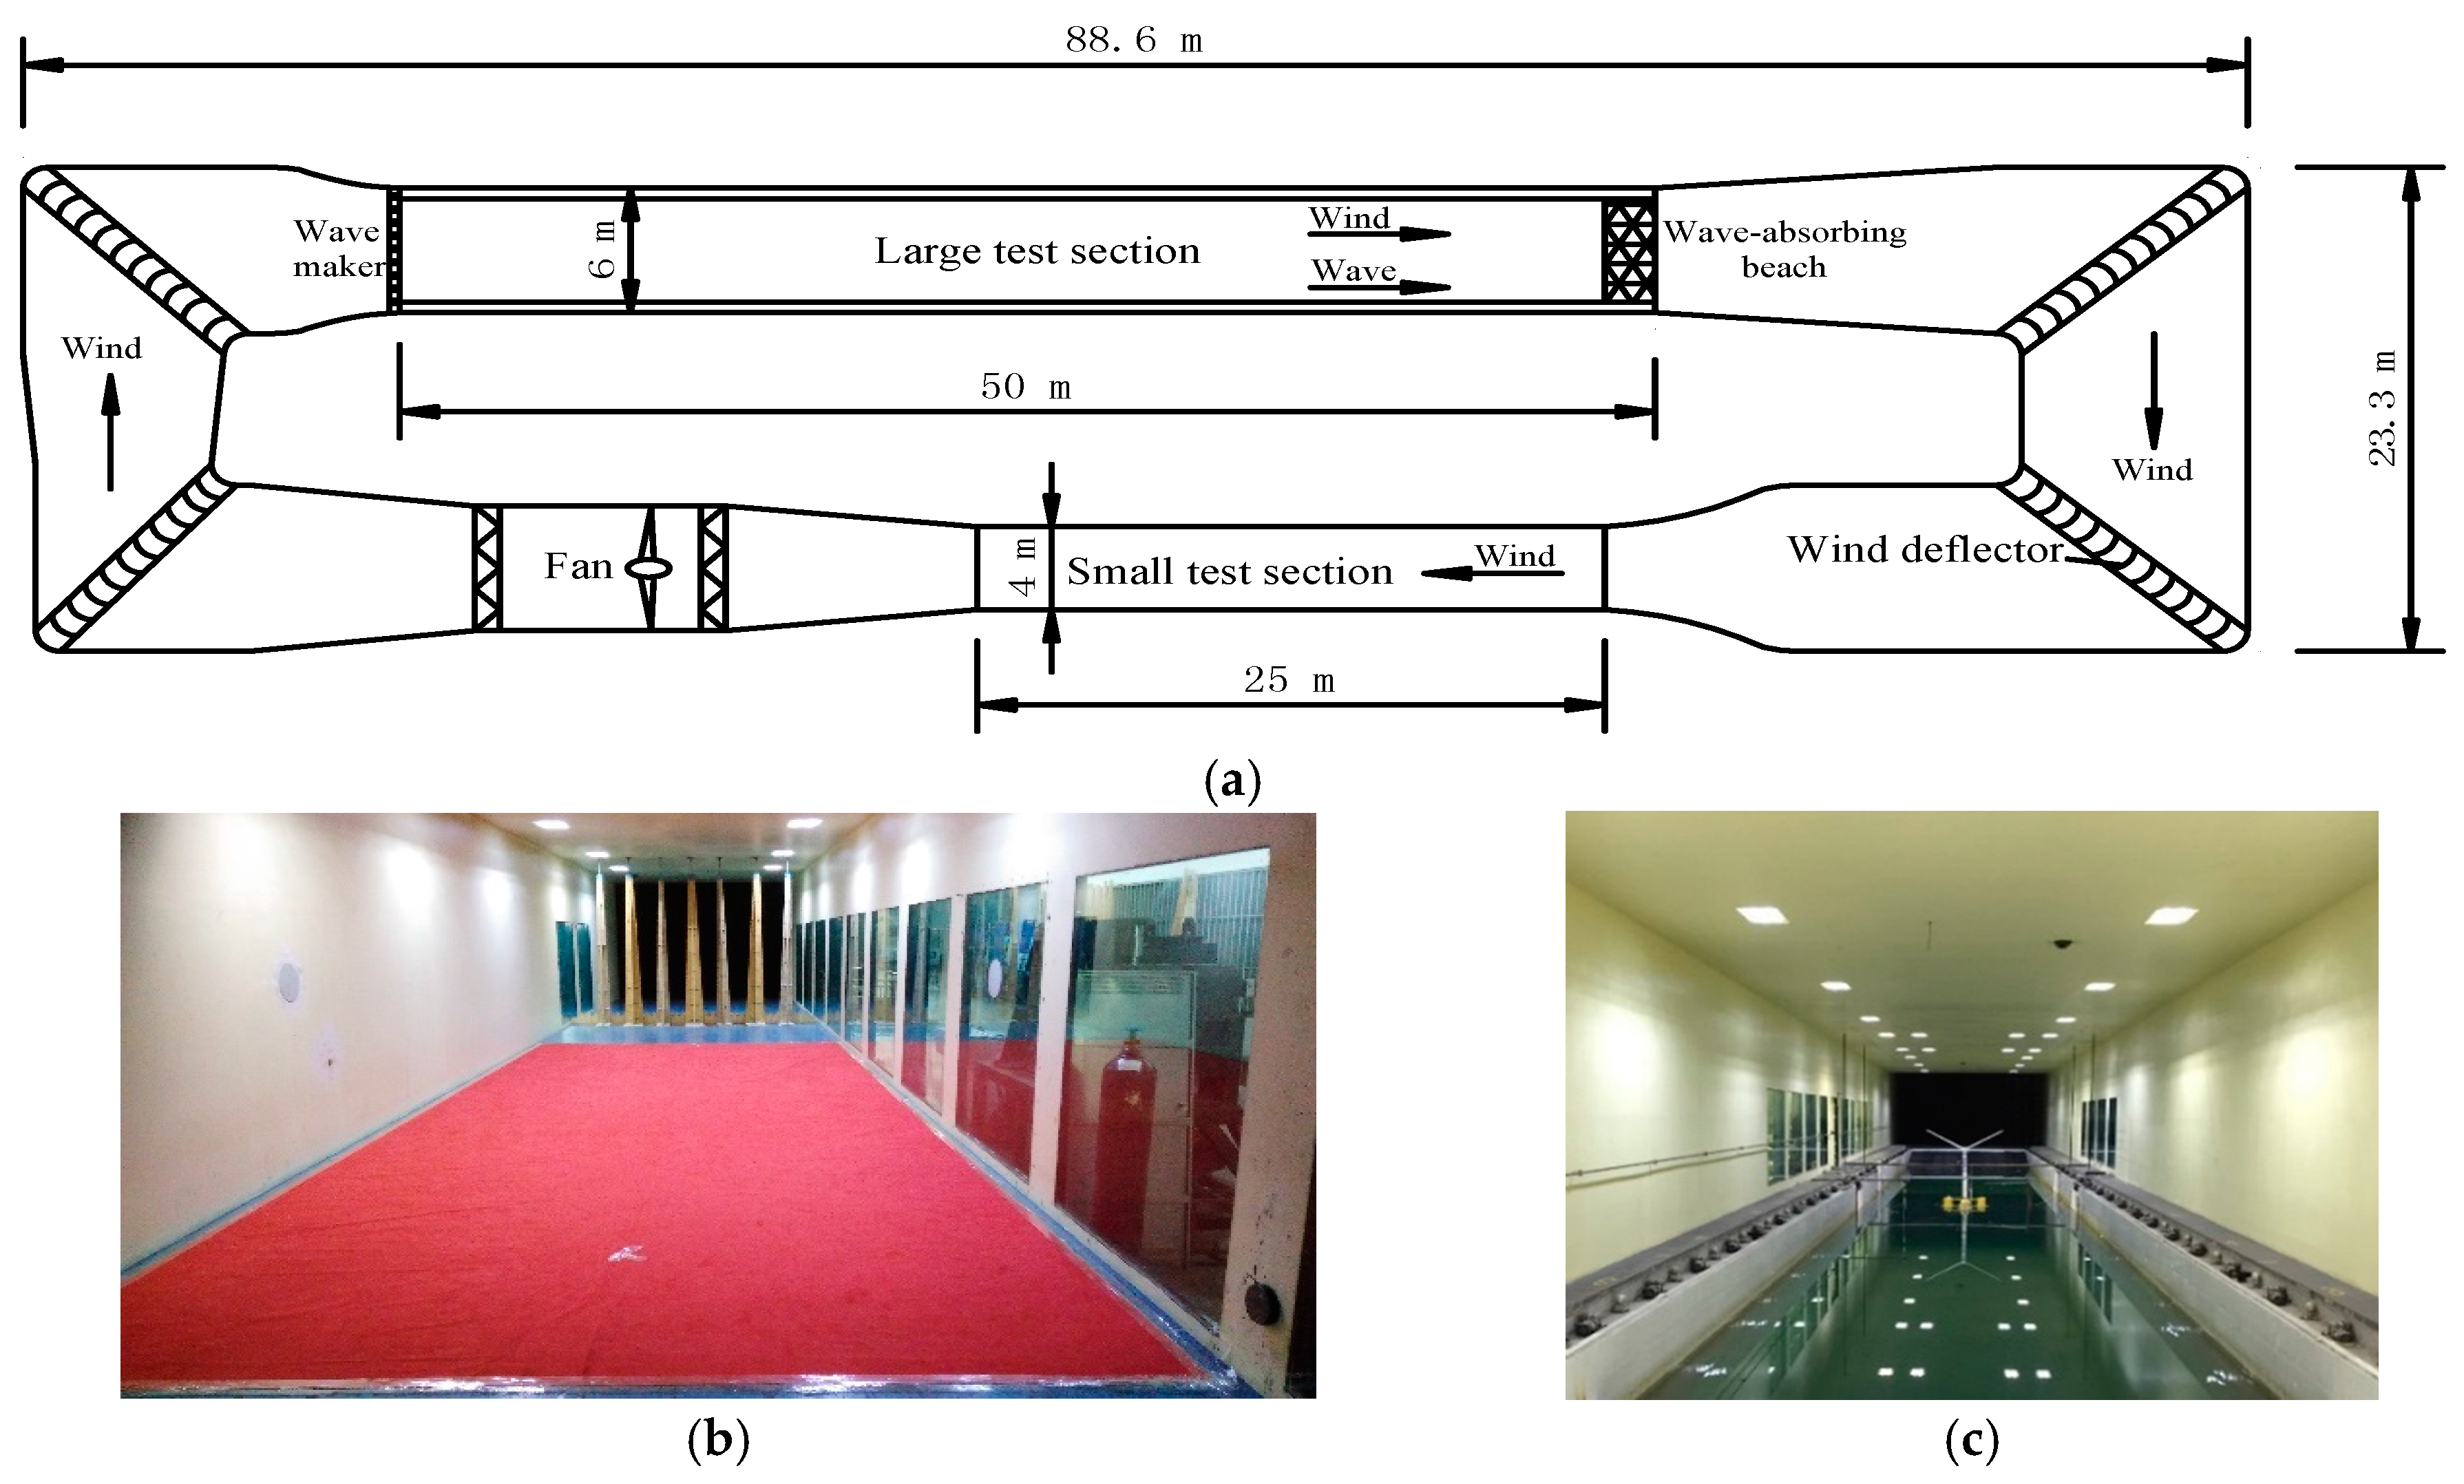
The aim of this paper is to uncover the phenomena and mechanism for the performance of a Y-shape semi-submersible FOWT attacked by multiple aligned wind and wave headings. The Y-shape semi-submersible platform refers to the floater composed of four columns, with a central column connected with three outer columns. First of all, 1/60th scale model tests in three load directions are carried out to reproduce the physical reality. The Y-shape semi-submersible FOWT model, environmental conditions and measurement are designed and calibrated carefully in a high quality joint wind tunnel and wave flume (WTWF) laboratory. Subsequently, the corresponding numerical model is established and validated with the test data. The dynamic responses such as tower base fore-aft bending moment and nacelle acceleration, which are not measured in the tests, are analyzed in the consideration of the load directionality effects. Additionally, the numerical results for different load directions are compared so as to find out the main causes of the load directionality effects. The results demonstrate that the platform motions are different between wave headings, further giving rise to a large difference in tower base loads and nacelle acceleration. Therefore, it is crucial to premeditate the load directionality effects before installation at sea, which can be beneficial for the power generation efficiency and safety of the FOWT system.

2. The Specification of the Semi-Submersible Floating Wind Turbine

As shown in 
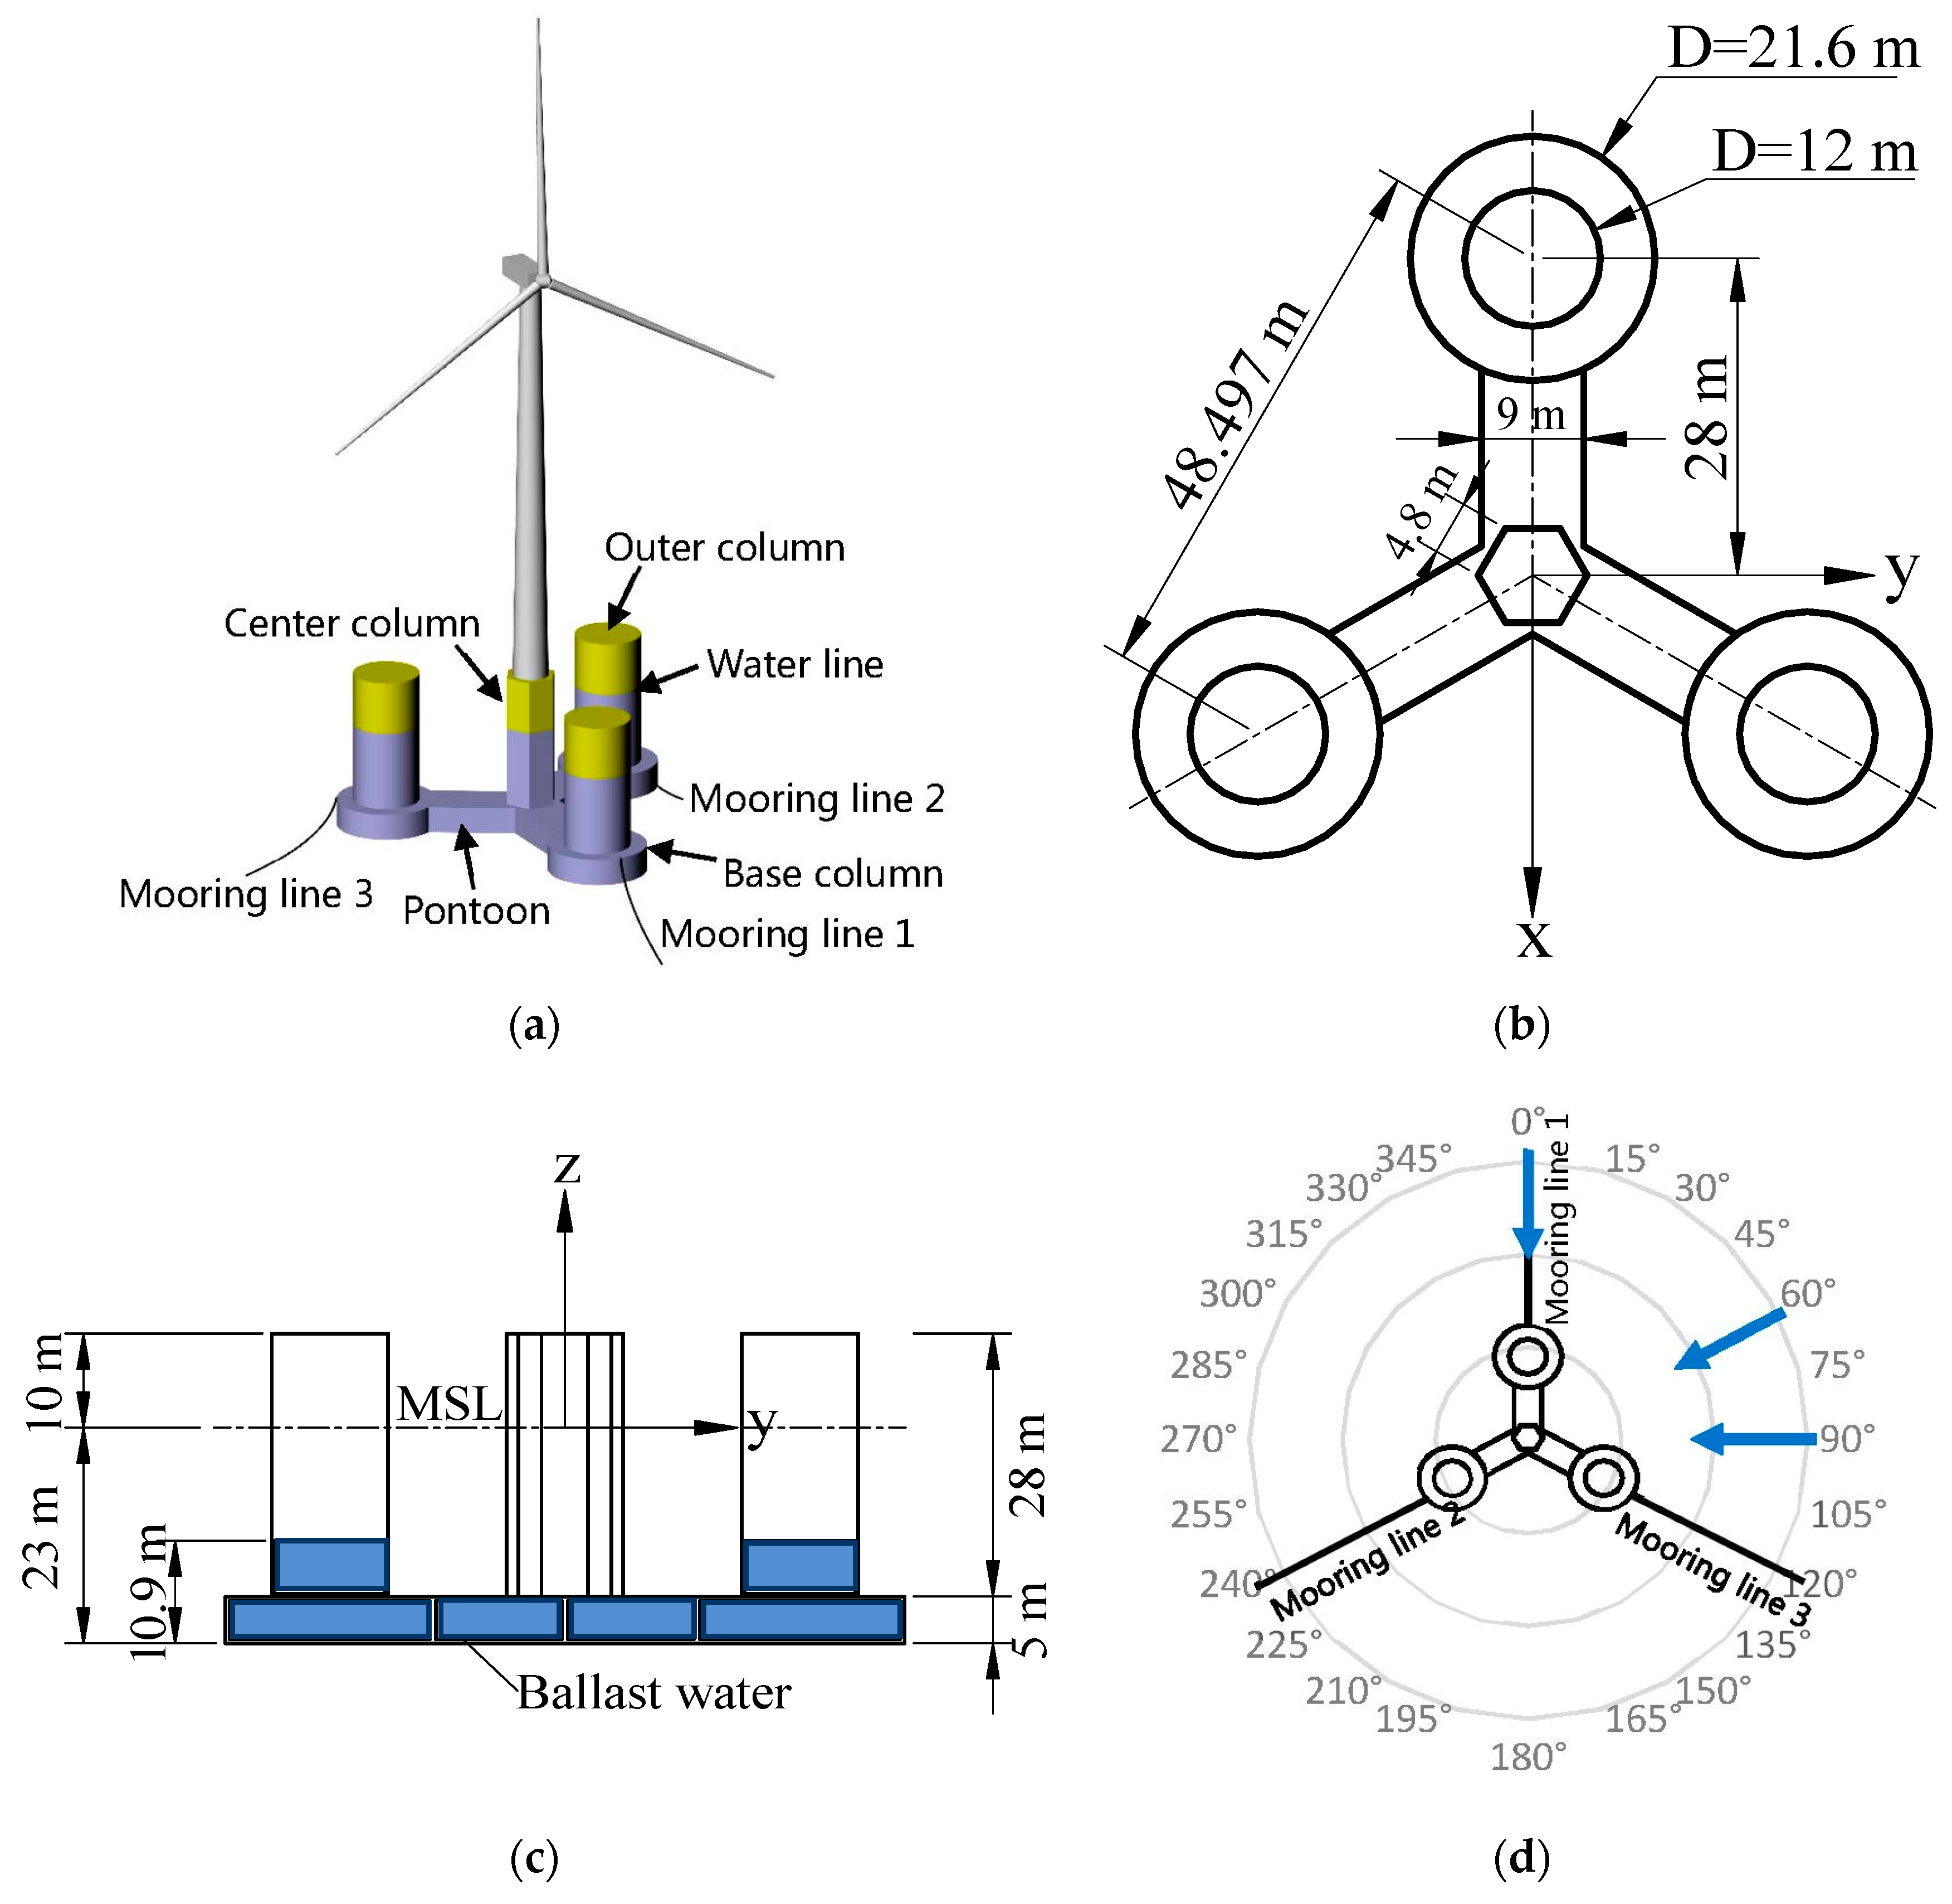
Figure 1, the investigated floating wind turbine system named ConFloat is composed of a 5 MW horizontal axis wind turbine, a semi-submersible foundation and a three-line catenary mooring system.
The wind turbine is a conventional three-bladed upwind direct-driven turbine. Similar to the NREL offshore 5 MW baseline wind turbine [33], its hub height is 90 m above MSL and the cut-in, rated and cut-out wind speed are 3 m/s, 11.5 m/s and 25 m/s (10-min average wind speed at hub height) respectively.
The four-column semi-submersible foundation is a conceptual design conceived by the authors’ research group. Its main characteristics are listed as follows:
(1)
Prestressed concrete is used to construct the major structure, which is expected to reduce manufacturing cost and a better resistance against corrosion and fatigue compared with steel;
(2)
Three rectangle section pontoons are arranged between the outer columns and the center column for connection, providing sufficient strength and stiffness for the platform. No brace arm is designed so as to reduce fatigue occurred at the joints [8];
(3)
The base columns and large-section pontoons are helpful to provide space for ballast, lower the center of gravity and alleviate the motion response, especially the heave motion.
The components and dimensions of the platform are shown in Figure 1b,c along with the coordinate system employed in this study. The pontoons, base columns and outer columns are filled with ballast water to achieve 23 m draft. The wind/wave load directions relative to the platform are given in Figure 1d. It should be noted that the x-axis direction is always consistent with the load direction and the rotor is also yawed to meet the wind accordingly. High-strength lightweight concrete with density of 1900 kg/m3 is adopted for the platform construction. By carrying out preliminary structural analysis, the platform wall of 350 mm thickness is robust enough to resist environmental loads. Furthermore, in order to increase the structural stiffness and separate watertight compartments, stiffeners and bulkheads are arranged inside the platform and considered during the calculation of structural properties, which are summarized in Table 1.
The platform is moored with three catenary mooring lines, as shown in Figure 1b. The fairleads are located at the outside edge of the base column at the water depth of 18 m below MSL. Properties of the catenary mooring system are summarized in Table 2.

3. Setup of the Model Tests

3.1. Test Facility

As Figure 2 shows, the closed return wind tunnel and wave flume (WTWF) joint laboratory in Harbin Institute of Technology has two test sections. The small test section, capable of generating high quality atmospheric boundary layers, is used to calibrate the scaled wind turbine model. The large test section has a wave flume underneath the wind tunnel and is able to generate realistic combined wind and wave fields. The sizes and performance parameters of the laboratory are listed in Table 3.

3.2. Experimental Models

To ensure a correct relationship between inertial and gravitational forces, the experimental models and loads are designed according to the Froude scaling law with geometric scale of 1:60. It should be noted that the results are all presented at full scale.
The model of platform was made of stainless steel with the thickness of 0.95 mm so as to ensure sufficient strength and stiffness. Iron blocks were placed in the pontoons, the base columns and the upper columns for achieving the target mass, center of gravity and the moment of inertia.
Due to the complicate effects of reduced Reynolds number on the flow around turbine blades, it is almost impossible to recover all the aerodynamic forces using a geometry-scaled model [34,35,36]. Nevertheless, the average wind thrusts of the rotor had been successfully simulated by a drag disc fixed to the hub shaft [6,37,38,39]. This approach was employed in this study. The drag disc was made of a kind of lightweight foamed plastics and a metal ring was fixed at the central shaft of disc to compensate the prototype mass.
The rated wind condition with the wind speed of 11.5 m/s was simulated in the tests. The initial diameters of the drag discs were estimated by the drag formulation: F = 1 2 C d ρ v 2 A , in which F is the thrust force on the disc; Cd is the drag coefficient which is set to 1.9 according to the DNV rule [40]; ρ is the air density; v is the wind speed at hub height; A is the area of the disc. The wind thrust force was calibrated in the small test section of the wind tunnel. An ATI force balance mounted at the tower base was employed for the wind turbine thrust measurement. The diameters of the discs were adjusted by trial and error to match the target wind thrust forces. Finally, the thrust force comparison between the model and the prototype and the equivalent wind turbine model for the rated wind condition are presented in Figure 3. Note that the prototype data was derived from the wind turbine simulator Bladed. It is shown that the averaged measured values agree quite well with the targets. The diameter of the disc 110 cm.
Due to the restriction of the wave flume width, the catenary mooring lines cannot be downscaled directly in its prototype shape. Instead, the equilibrium horizontal spring mooring system was adopted [41]. It is known that the vertical force is provided by the gravity of the catenary mooring lines and its variation is limited. Hence, it is reasonable to regard the vertical force as a part of the platform ballast system. As Figure 4 shows, three horizontal spring mooring lines were arranged around the platform with a 120° interval angle. Each spring mooring line consists of three parts: a turnbuckle used for pretension adjustment, a spring providing the required stiffness for the system, and a steel wire connected with the platform.
The stiffness of the spring is 20.5 N/m (7.5645 × 10⁴ N/m in prototype), which was determined by linear least-squares fitting of the displacement-restoring force/moment curve of the prototype catenary mooring lines. The comparisons of the surge-restoring force curves and the pitch-restoring moment curves between the catenary and the spring mooring system in three load directions are illustrated in Figure 5. Except slight discrepancies in the large surge displacements, the horizontal restoring stiffness of the spring mooring system agrees fairly well with the prototype catenary mooring system. The figure also indicates that the restoring stiffness of three load directions is basically consistent with each other. In addition, in order to examine the surge-pitch coupling effects on the restoring force/moment of the mooring lines, surge-restoring force curves with pitch motion and pitch-restoring moment curves with surge motion are plotted in Figure 6. Obviously, the platform pitch motion is less influential on the mooring restoring forces according to Figure 6a–c. In term of the restoring moments, the impact of platform surge motion is significant. Compared with the prototype, the spring mooring lines tend to provide larger restoring moments with the increase of surge motion along the positive direction of wind/wave loads. However, on the whole, it is feasible to emulate the catenary mooring system by horizontal spring mooring lines in the flume model tests.

3.3. Measuring Instruments

As Figure 7 shows, the wind profile was measured by a micromanometer installed on a lifting frame. Wave elevations were monitored by three capacitance type wave probes. The six degrees of freedom (DOFs) of the FOWT model were captured by an in-house stereo vision measurement system [42,43], which consists of three parts: two cameras, five tracking targets attached onto the model and an image acquisition/processing platform. Its high precision was demonstrated by comparing results with a laser displacement sensor.

3.4. Wind and Wave Environment Calibration Tests

In this study, the FOWT dynamics under the rated operational condition were investigated. The average wind speed at hub height, significant wave height Hs and spectral peak period Tp are 11.5 m/s, 2.23 m and 6.74 s respectively, which are determined on the basis of long-term met-ocean data from the south-eastern coast of China.
The measured mean wind speed and turbulence intensity profile at the location of the FOWT model are displayed in Figure 8a,b. The simulated wind speed profile is in close accordance with the dashed line, which is the empirical power law profile with a 0.1 wind shear exponent. Since only the averaged thrusts of wind turbine can be modeled by means of the disc, no turbulent wind is generated intentionally in the tunnel. Hence, it is shown that the turbulence intensity at hub height is small (less than 5%). Furthermore, Figure 8c shows the comparison between the measured spectrum and the target Joint North Sea Wave Observation Project (JONSWAP) spectrum. The consistency between the measured and target spectrums, except for the discrepancies around 0.2 Hz which may be caused by the reflected waves from the sidewalls of the flume, indicates that the wave flume is capable of generating the specified realistic ocean condition.

3.5. Test Matrix

To study the dynamic performance of the FOWT thoroughly, five kinds of tests, i.e., free decay tests, regular wave tests, steady wind tests, irregular wave tests and combined wind and wave tests, were performed.
Free decay tests of six DOFs were carried out to estimate the natural periods of FOWT motions and the viscous damping coefficients. Through the regular wave tests, the linear hydrodynamic performance characterized by Response Amplitude Operators (RAOs) can be obtained. A range of 11 wave periods in the interval [5, 25] with a period step of 2 s were examined. The wave heights are 1.8 m and 2 m for the wave periods ranging from 5 s to 15 s and 17 s to 25 s respectively. To obtain the harmonic, steady-state response, the duration of 2 min, i.e., 15.5 min in full scale, was tested for each wave period. The wind and wave effects were investigated separately by the steady wind tests and the irregular wave tests in the rated operational condition. Finally, the combined wind and wave tests were performed. For each sea state, 2 h of test data were recorded in full scale. To compare the performance of the FOWT system in different load directions, three wind/wave headings, i.e., 0°, 60° and 90°, were examined for each test. Hence totally 48 test cases are defined, which are summarized in Table 4.

4. Numerical Simulations

The main purposes of this numerical study are threefold: (1) to validate a coupled aero-hydro-servo-elastic dynamic floating wind turbine simulator with the model test data; (2) to further investigate the main causes of the aligned wind and wave directionality effects; (3) to analyze physical qualities which are not measured in the tests, such as the tower base fore-aft bending moment and nacelle acceleration.
FAST, an open source time domain wind turbine simulator from NREL, integrates the computational methodologies and analysis tools of onshore wind turbine and offshore oil and gas industries [21], making the coupled aero-hydro-servo-elastic dynamic analysis of floating wind turbine systems realizable. In FAST, the floating platform is regarded as a six DOFs rigid body whose motions can be described by the following differential Equation:
[ M + A ( ) ] q ¨ ( t ) + 0 t K ( t τ ) q ˙ ( τ ) d τ + C q ( t ) + B add q ˙ ( t ) | q ˙ ( t ) | = F wave ( t ) + F Aero ( t ) + F Lines ( t )
where M is the structure mass matrix; A(∞) is the added mass matrix at infinite frequency; q ( t ) , q ˙ ( t ) and q ¨ ( t ) are the platform displacement, velocity and acceleration vectors respectively; K(τ) is the wave-radiation-retardation kernel which depends on the added mass and radiation damping matrix; C is hydrostatic restoring matrix; Badd is the user-defined additional quadratic damping matrix; Fwave(t) is the excitation load from incident waves; FAero(t) is the aerodynamic load from wind turbine; FLines(t) is the load from the mooring lines. The hydrodynamic, aerodynamic and mooring loads applied in the numerical models will be discussed in the following subsections.

4.1. Hydrodynamics Modeling

The solution of the hydrodynamic problem in FAST is based on potential flow theory as well as the Morison’s equation. For the first-order potential flow, the hydrodynamics problem is composed by radiation, diffraction and hydrostatics. The radiation effect refers to the force and moment on the body when the structure is forced to oscillate in calm water. The radiation loads are identified as two terms, namely added mass and radiation damping, which are denoted by the first two terms on the left side of Equation (1). These two terms, which are the function of the structure’s geometry, the frequency of oscillation and the finite water depth [44], are independent of the wave headings. The diffraction effect is related to the hydrodynamic loads induced by the incident waves with the body held fixed, denoted by Fwave(t) in Equation (1). It relies on the body form and wave headings. The third term, Cq(t), represents the restoring force/moment resulting from the effects of waterplane area and the gravitational-buoyancy as the displacements of the platform (heave, roll and pitch) take place. The hydrodynamic coefficients of these three terms can be obtained by solving the boundary-value problem using panel method [45].
Previous studies [46,47,48,49] had demonstrated that the first-order theory for potential flow is insufficient for the FOWT dynamics prediction. The second-order hydrodynamic theory can more accurately account for the nonlinear free-surface boundary conditions and the loadings about the actual instantaneous wetted surface of a platform, which may be critical in the hydrodynamic analysis. In general, the second-order hydrodynamic loads are composed of the mean-drift forces, the difference-frequency drift force and the sum-frequency drift force. For a semi-submersible platform, the difference-frequency drift force is important since it can excite the natural frequencies of the structure and result in resonance.
Apart from the linear radiation damping, the effects of viscous damping are also considered in FAST by employing a quadratic term in the left side of the motion equation. In practice, however, the damping coefficient is empirically determined and is dependent on many factors, including the Reynolds number effects and surface roughness. For that reason, a user-defined quadratic damping matrix Badd is available in FAST, helping to tune the numerical model to match damping to experimental results, such as free decay tests.
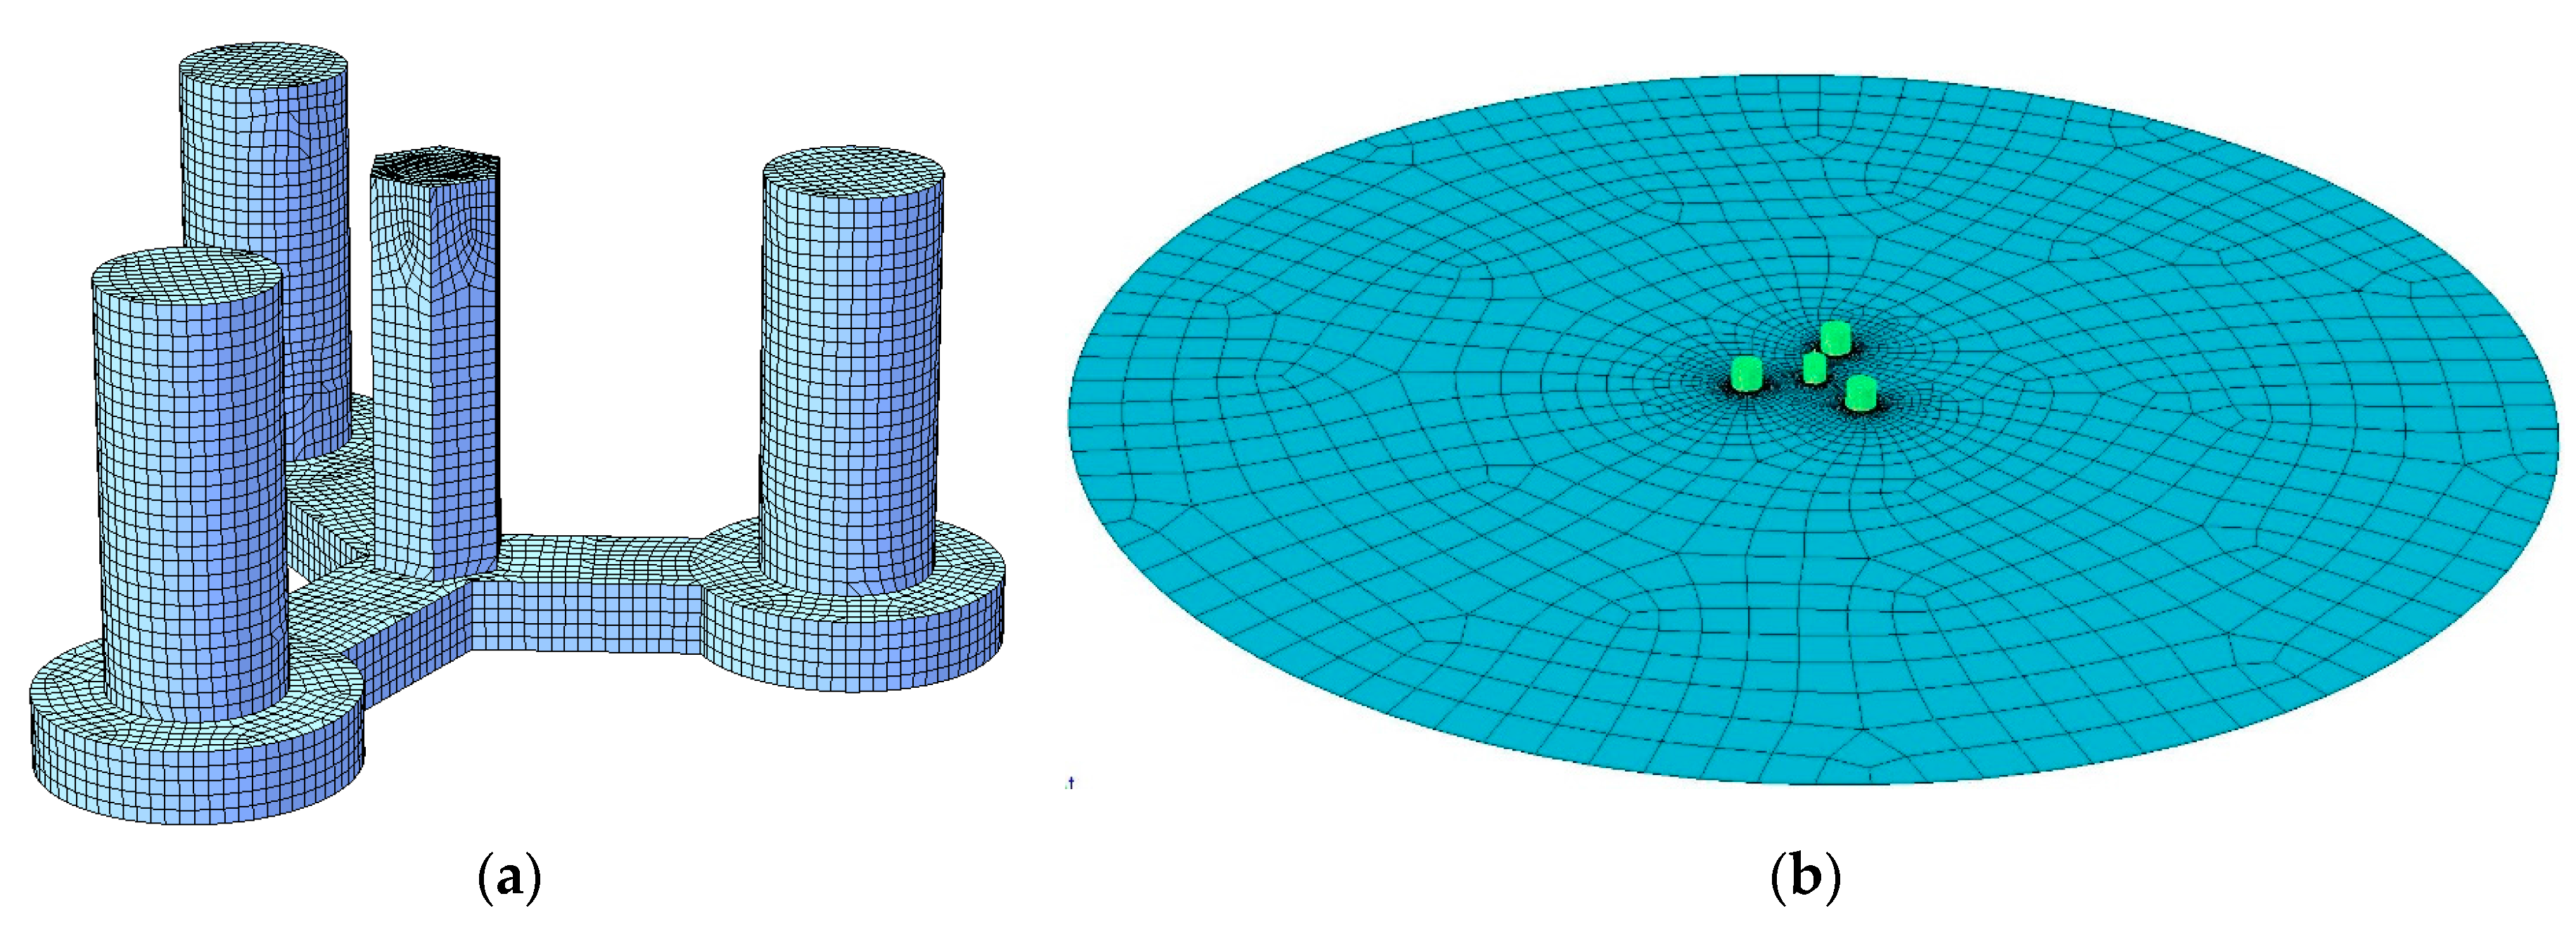
In the case of the ConFloat FOWT numerical model, both the first- and the second-order hydrodynamic coefficients were calculated. The panel model employed in potential flow computation is shown in Figure 9a. The grid size sensitivity analysis was carried out to ensure the independence and efficiency of the solutions. The intrinsic properties of the system such as the mass, the center of gravity and the moment of inertia were derived from a 3D solid model. Totally 60 wave frequencies within the range of [0.05 3.0] rad/s by a step of 0.05 rad/s were adopted for the analysis. For the second-order effects, the mean-drift force and the difference-frequency drift force were computed with full Quadratic Transfer Function (QTF), while the sum-frequency drift force was ignored. The free surface grids are presented in Figure 9b. For the viscous drag term, the user-defined additional quadratic damping matrix was tuned by trial and error until the simulation free-decay results matched well with the test data for each DOF.

4.2. Aerodynamics Modeling

Two wake models, the blade element momentum (BEM) theory and the generalized dynamic wake (GDW) theory, are usually used for the aerodynamic calculations for aero-elastic simulations of horizontal axis wind turbine configurations [
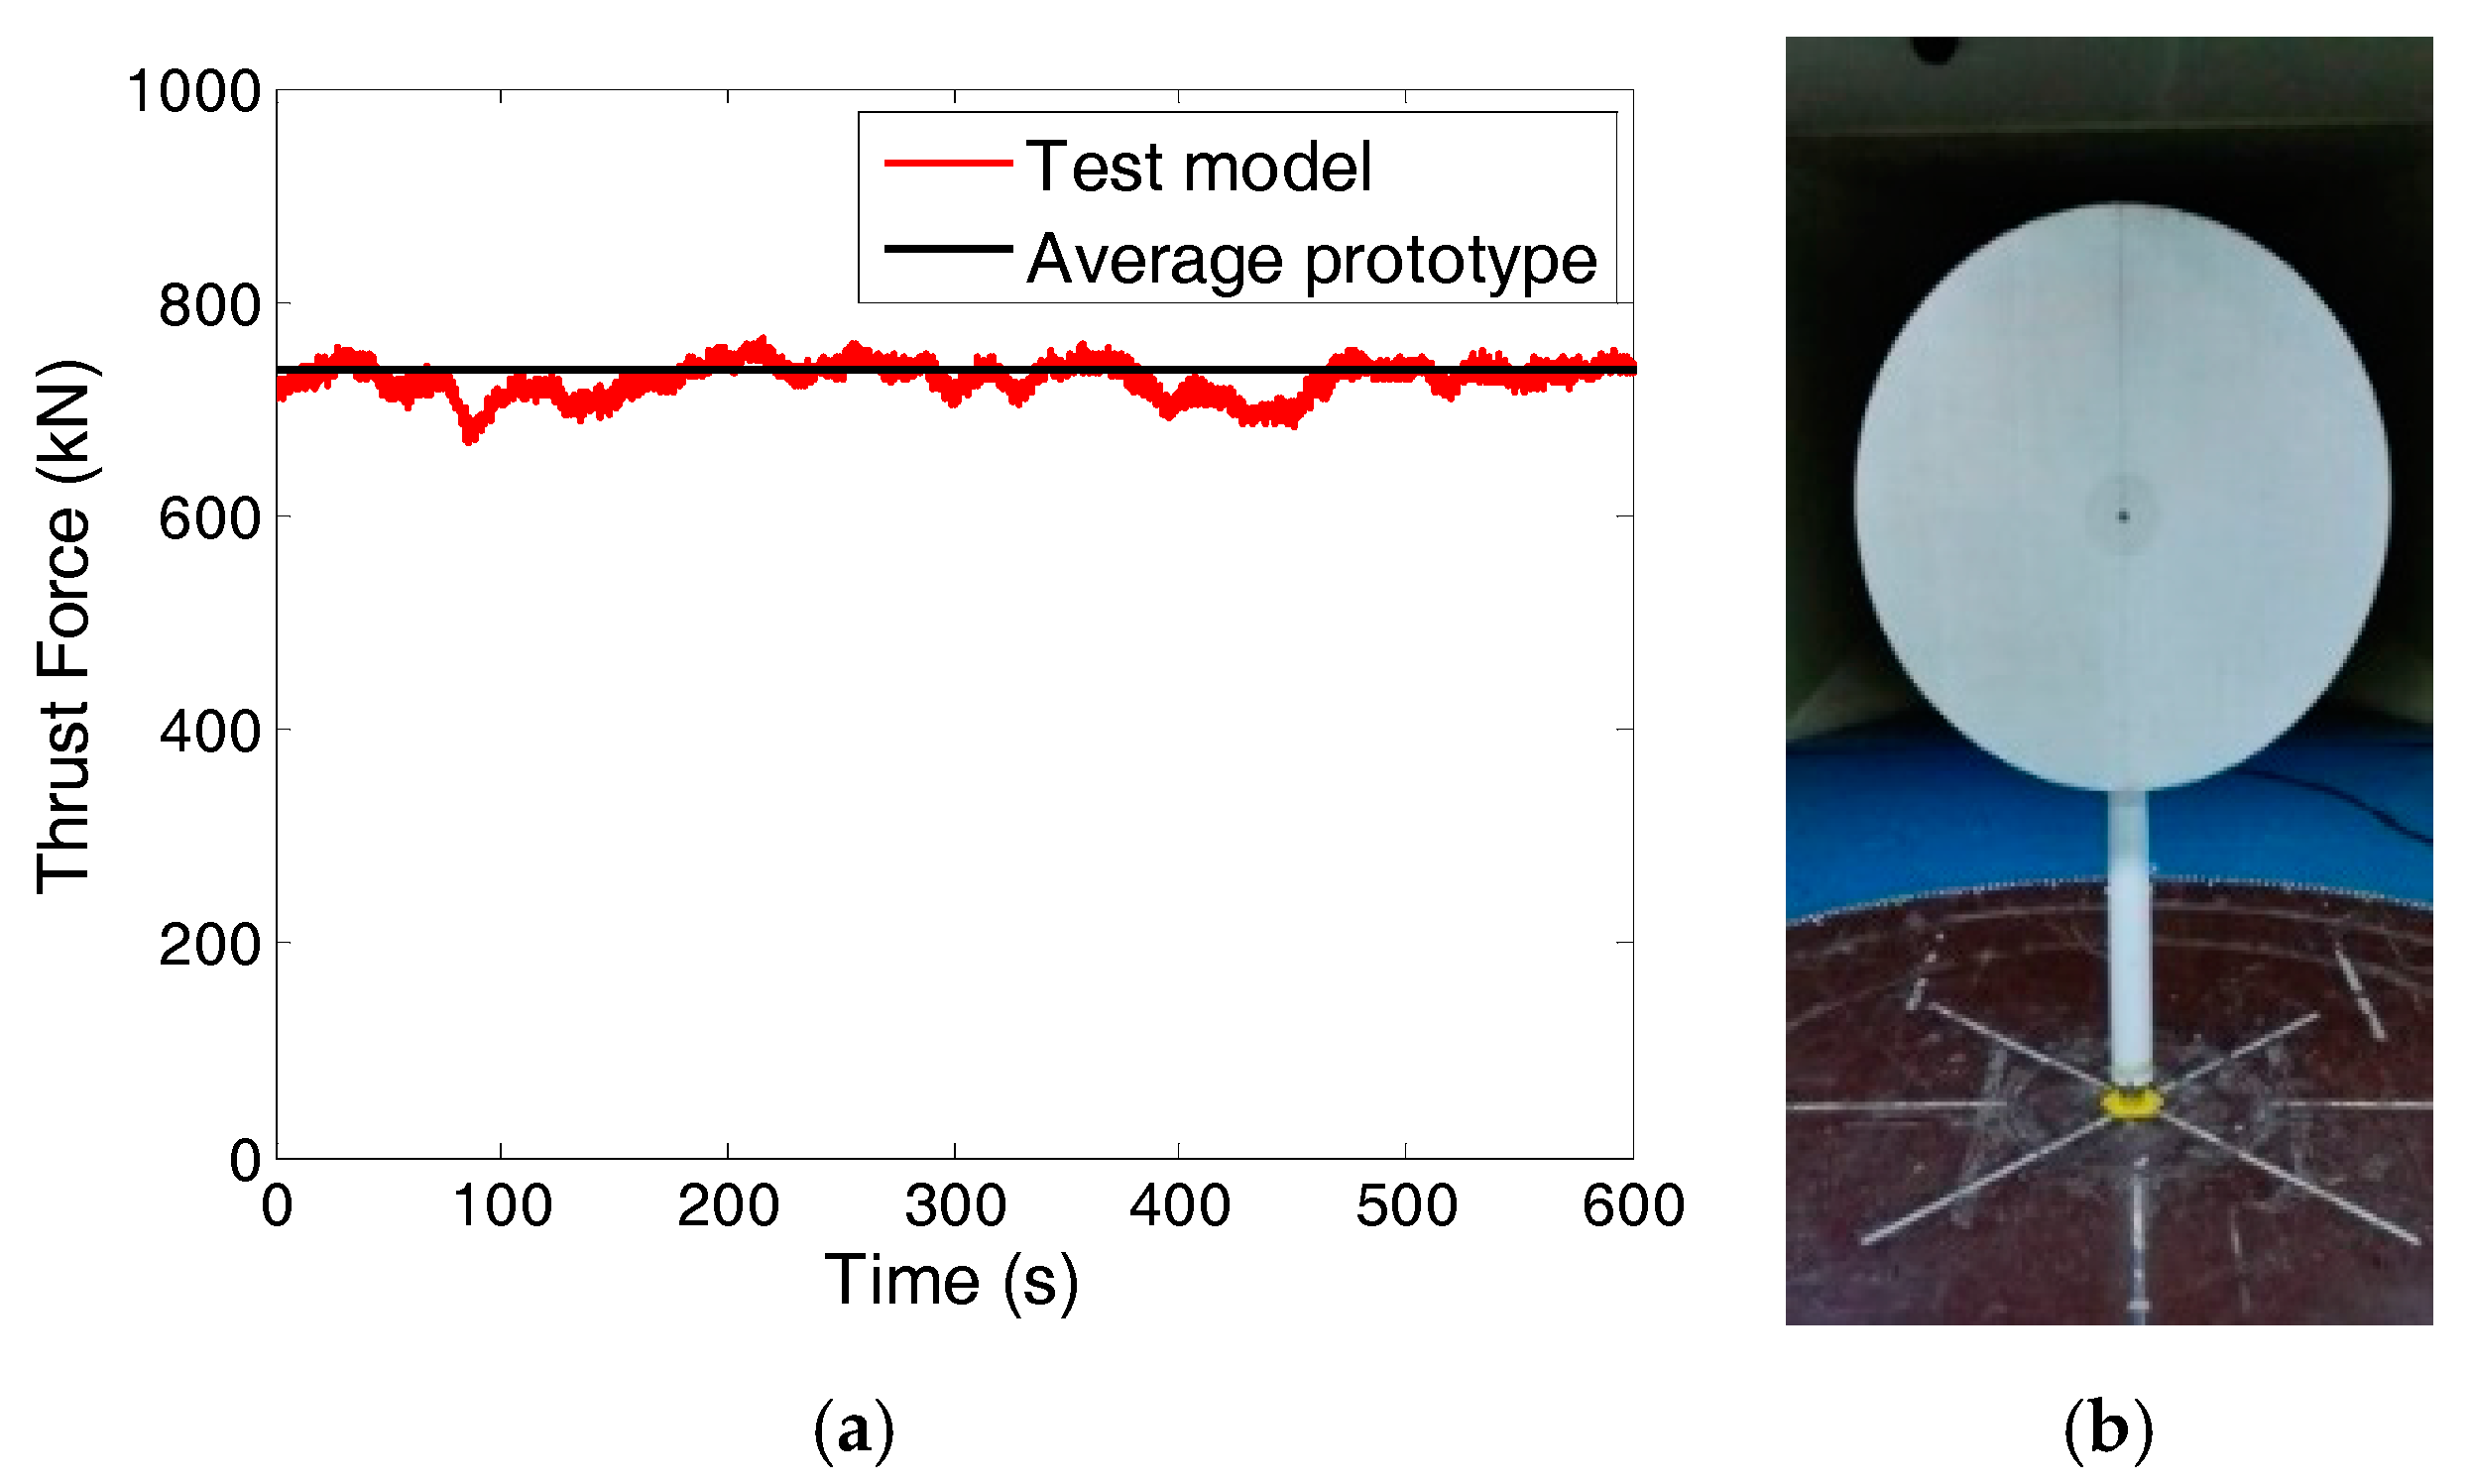
20]. Note that the average wind effects on the rotor were simulated by a drag disc rather than a full rotor in the tests. To ensure consistency, the wake model was turned off and the numerical wind turbine model was also modeled as an irrotational bluff body whose total wind thrust force can be simply estimated by the following formula:
F Aero ( t ) = i = 1 N 1 2 C d , i WT ρ | v w i ( t ) v i ( t ) | 2 A i
where C d , i WT is the wind drag coefficient of the i-th component of the wind turbine; ρ is the air density; vwi(t) is the wind speed at the height of the i-th component at time t; vi(t) is the motion velocity of the ith component along the incoming wind direction at time t; Ai is the projected area of the i-th component along the incoming wind direction. Before the dynamic simulations of the FOWT system started, the hydrodynamics module was switched off and the wind drag coefficients of the blades and tower were tuned to match the average tower base forces/moments measured in the wind turbine calibration test.

4.3. Mooring Line Modeling

For modeling the catenary mooring lines or tension legs, three approaches are provided in FAST, i.e., the quasi-static method [21], the finite element method (FEM) and the lumped-mass approach [
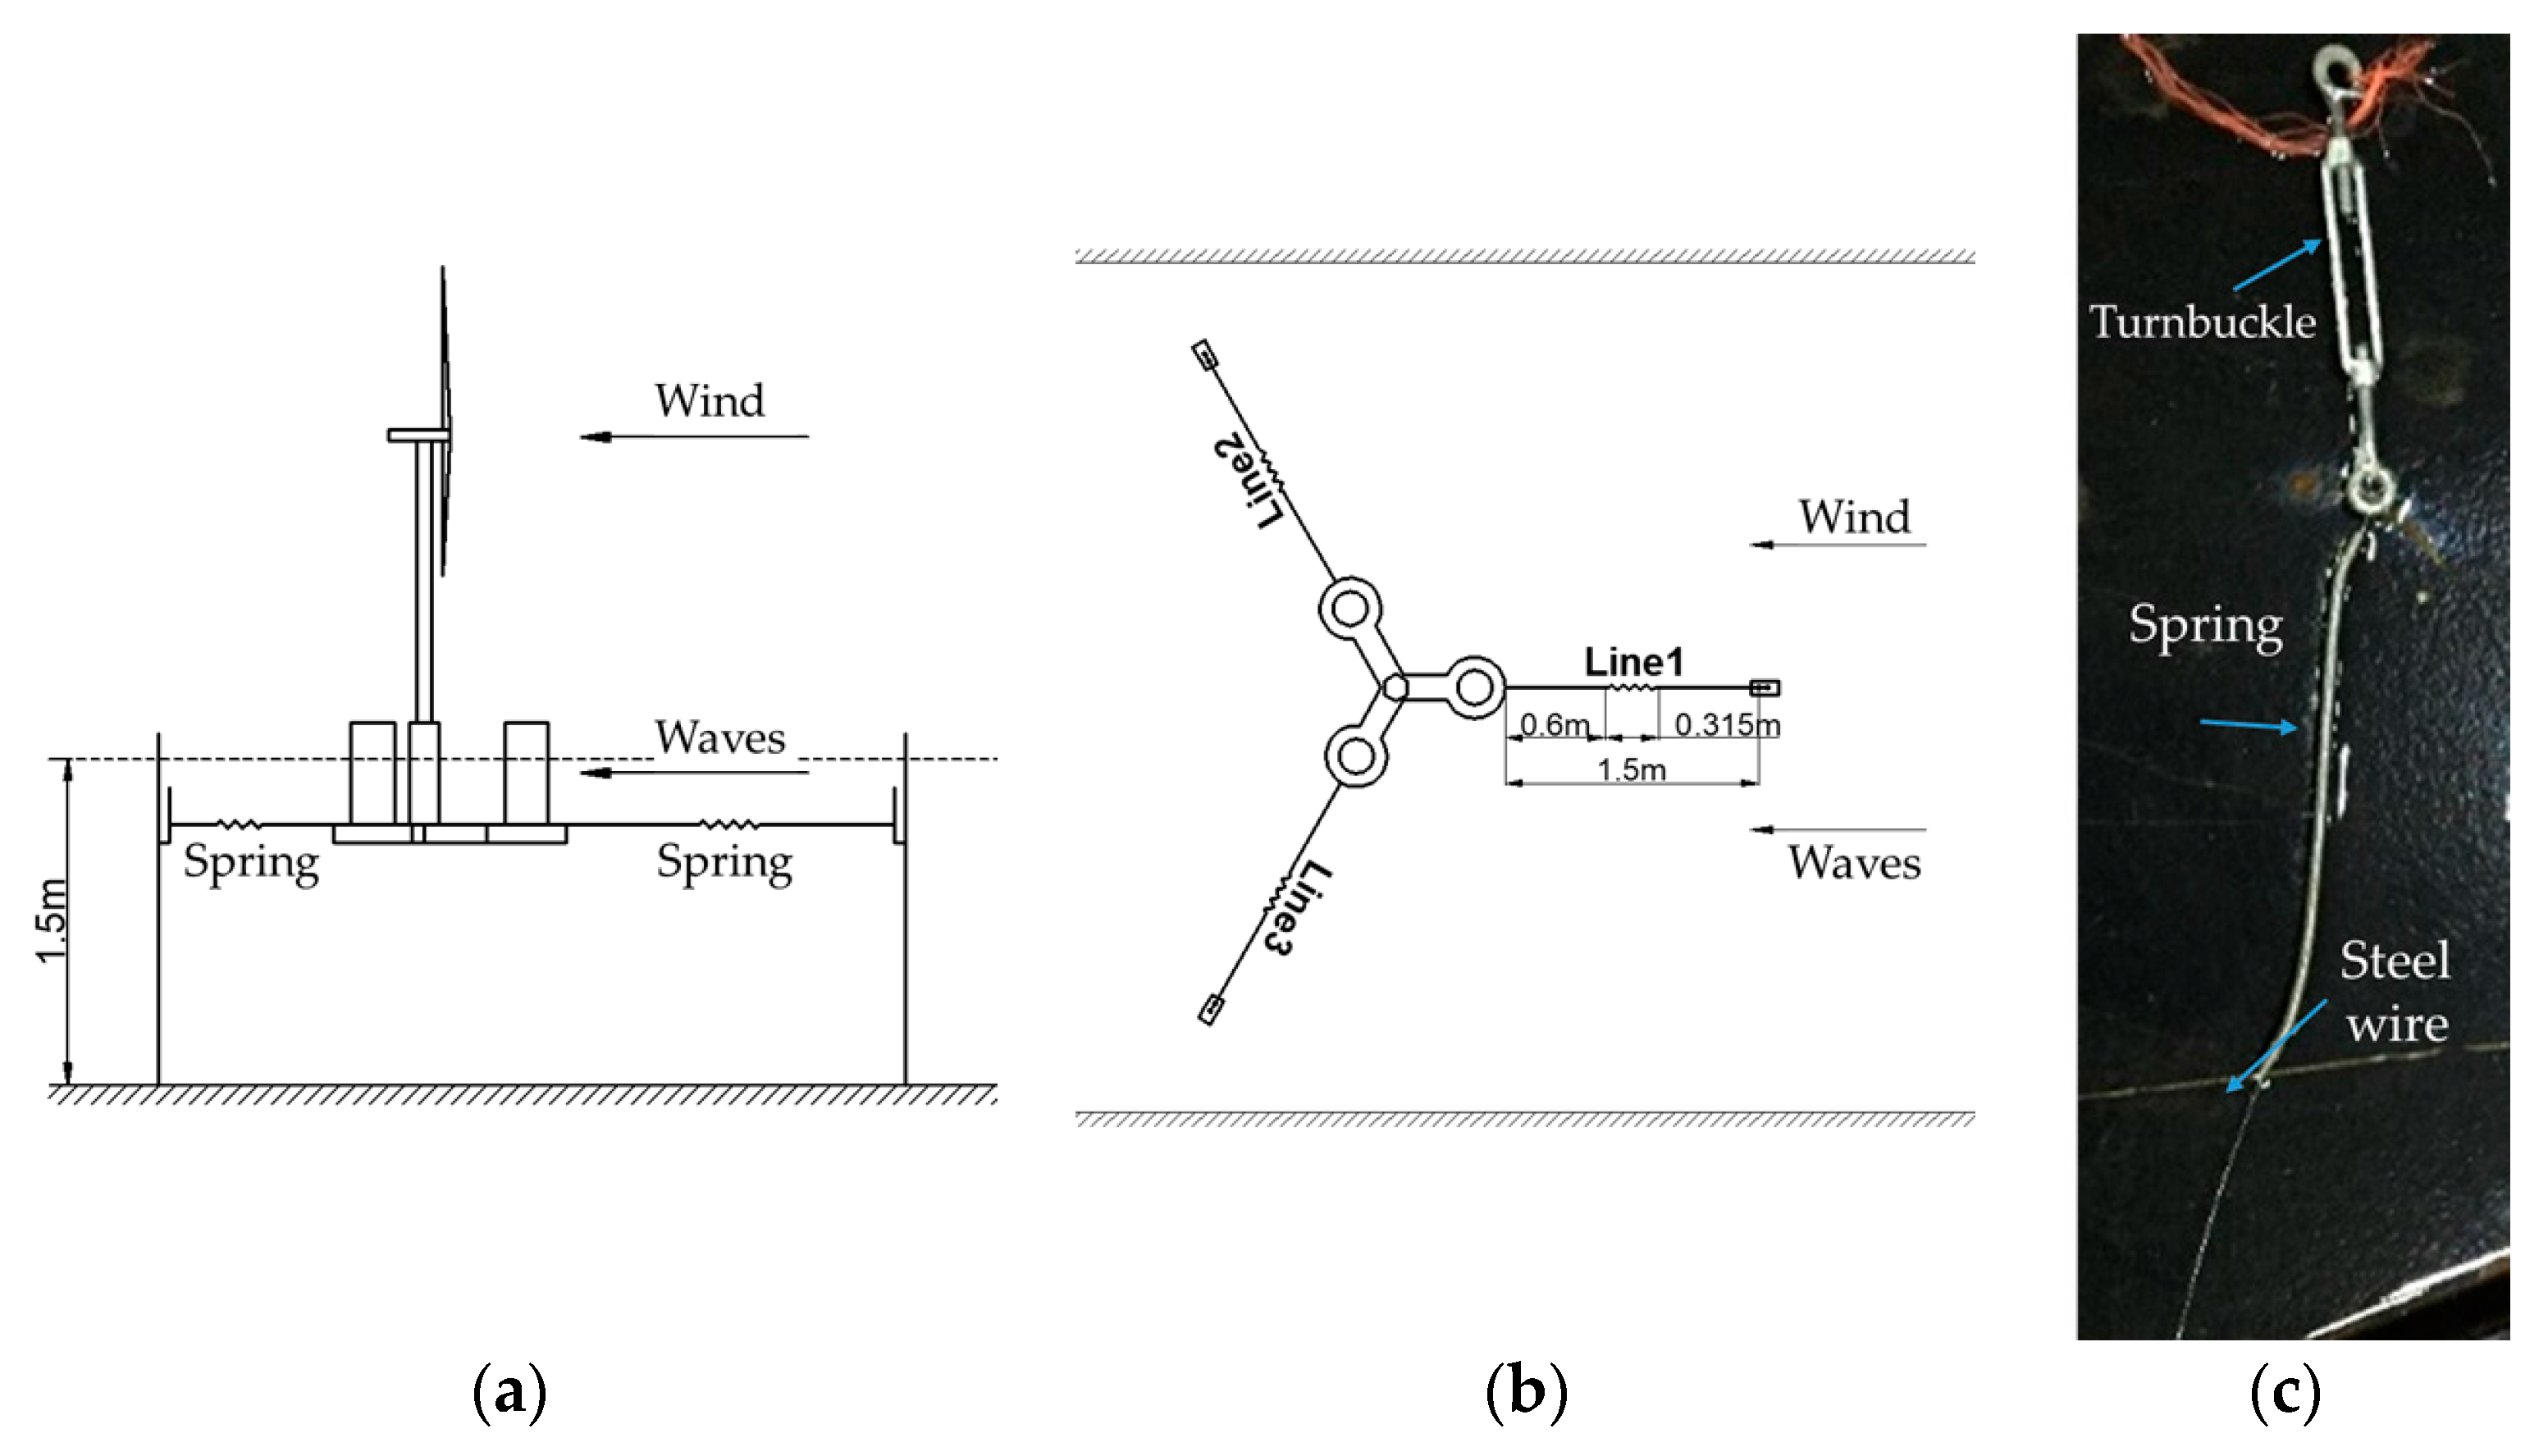
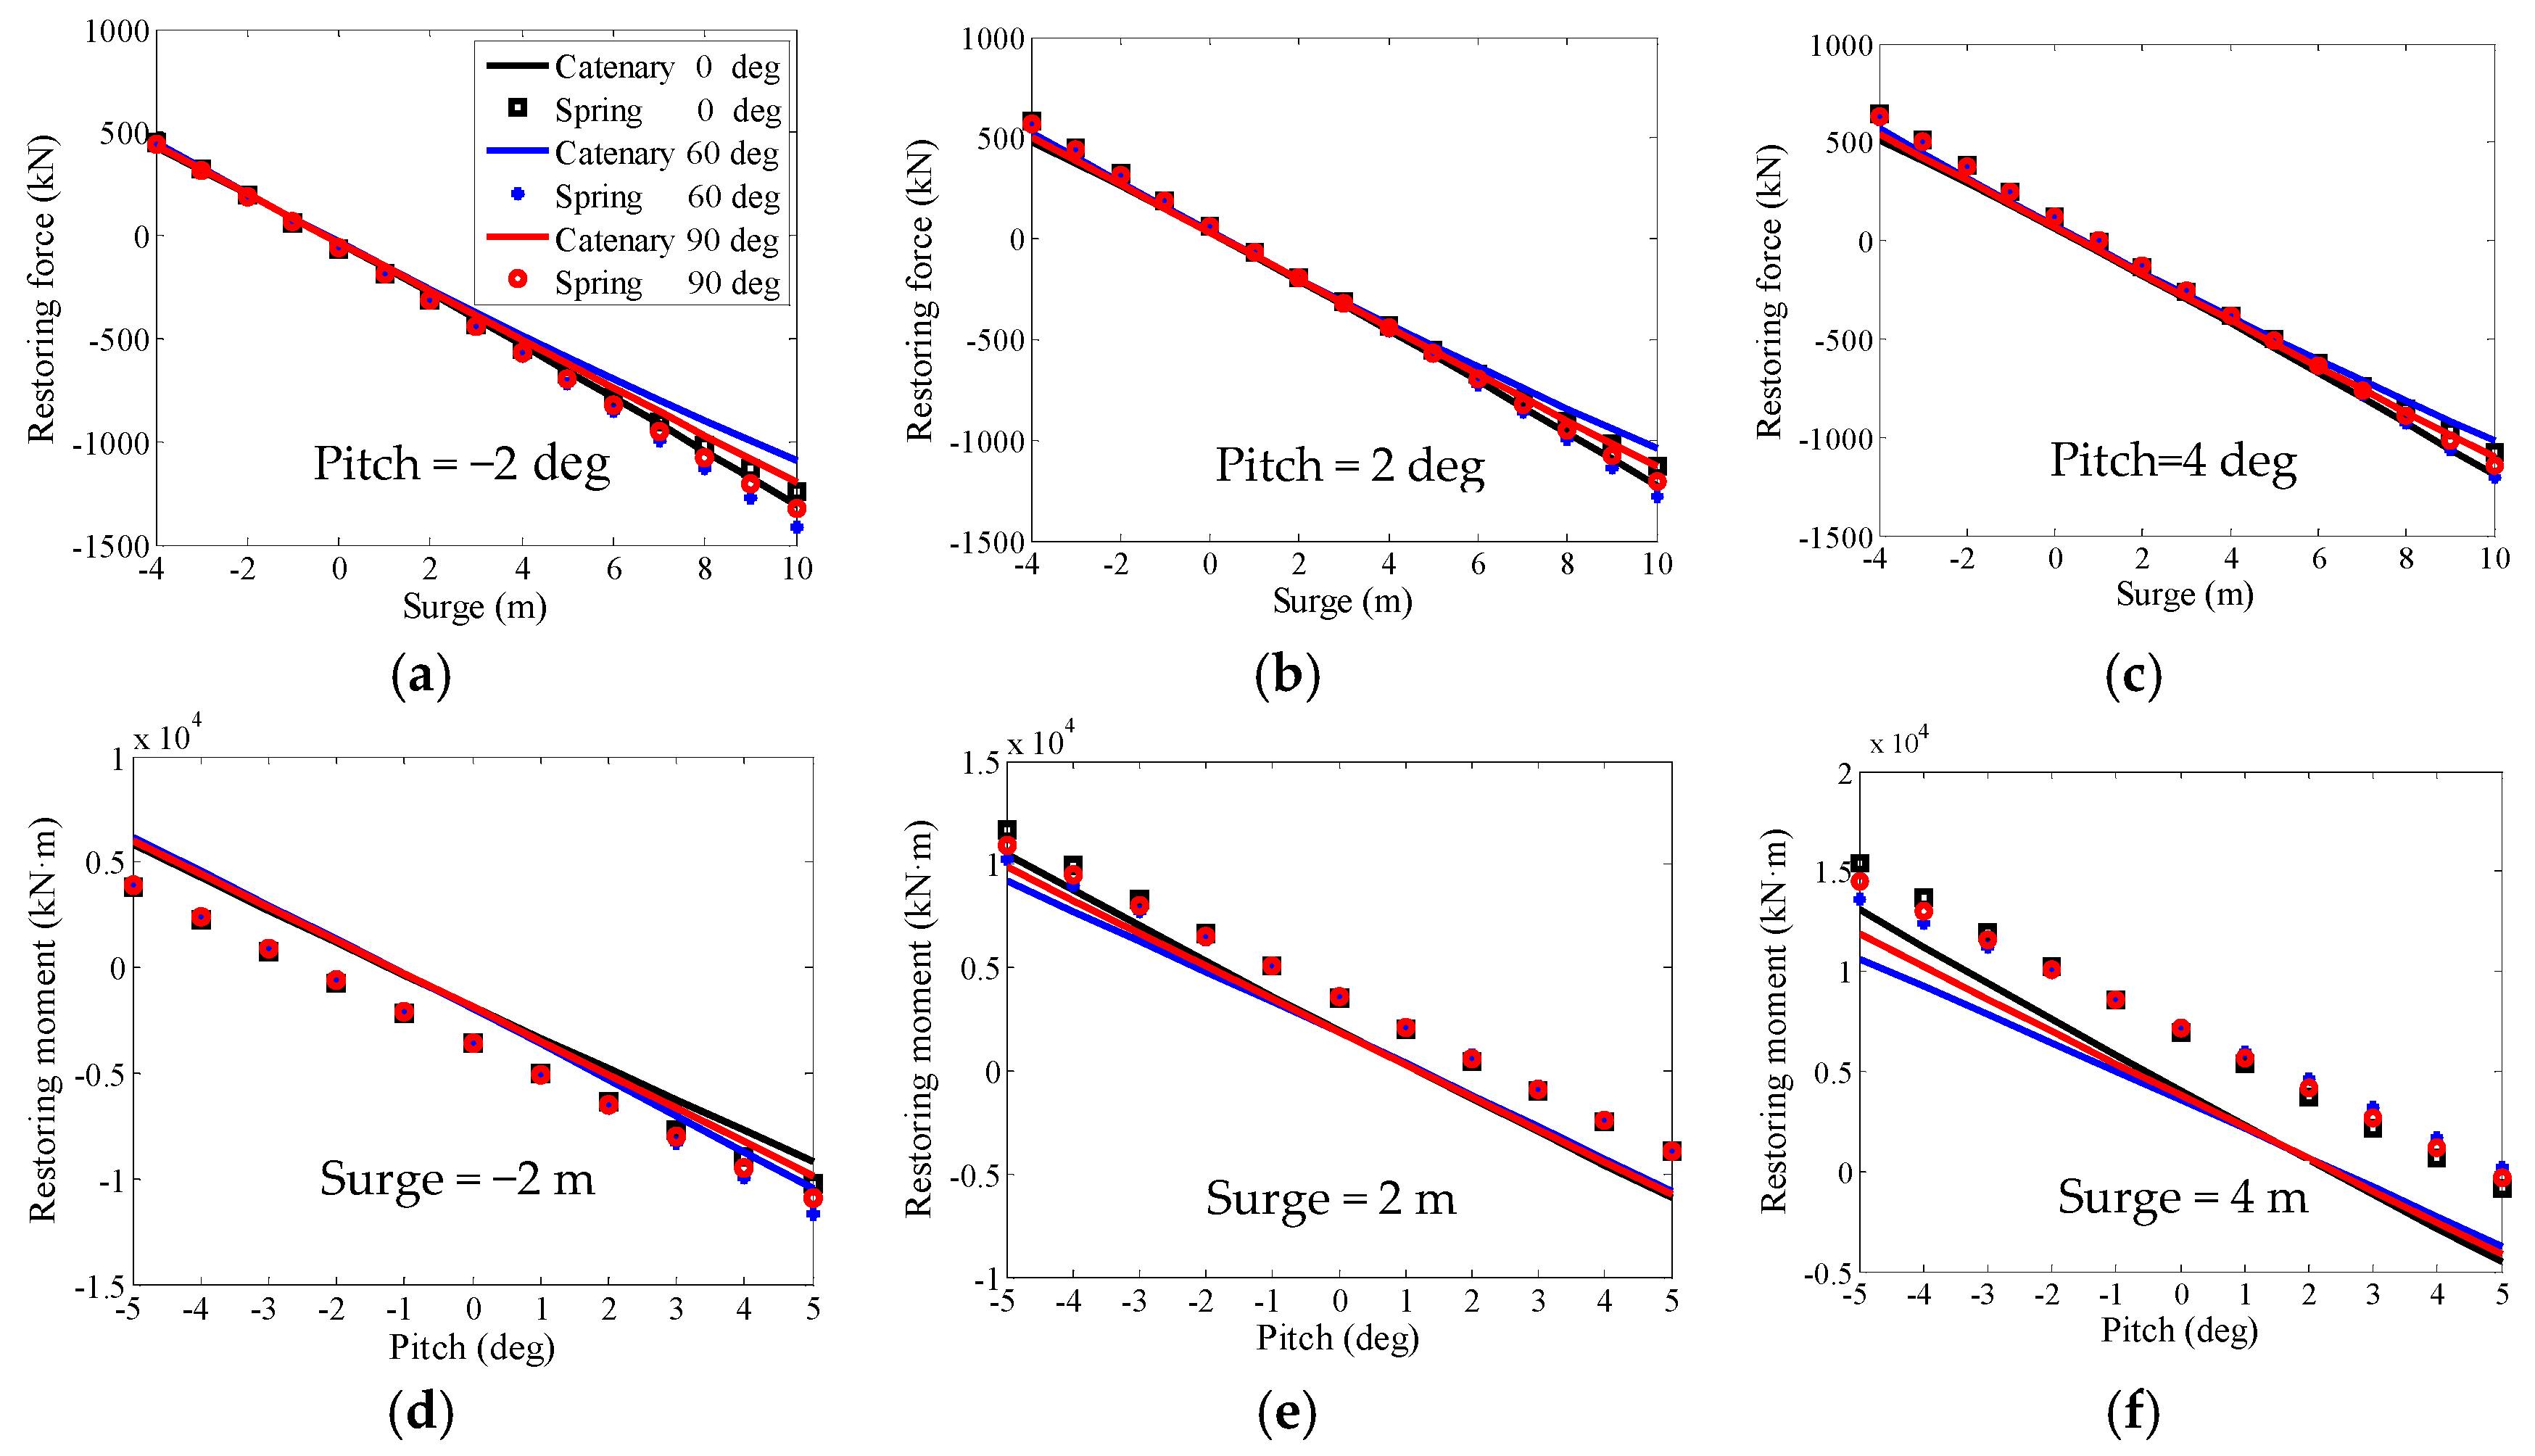
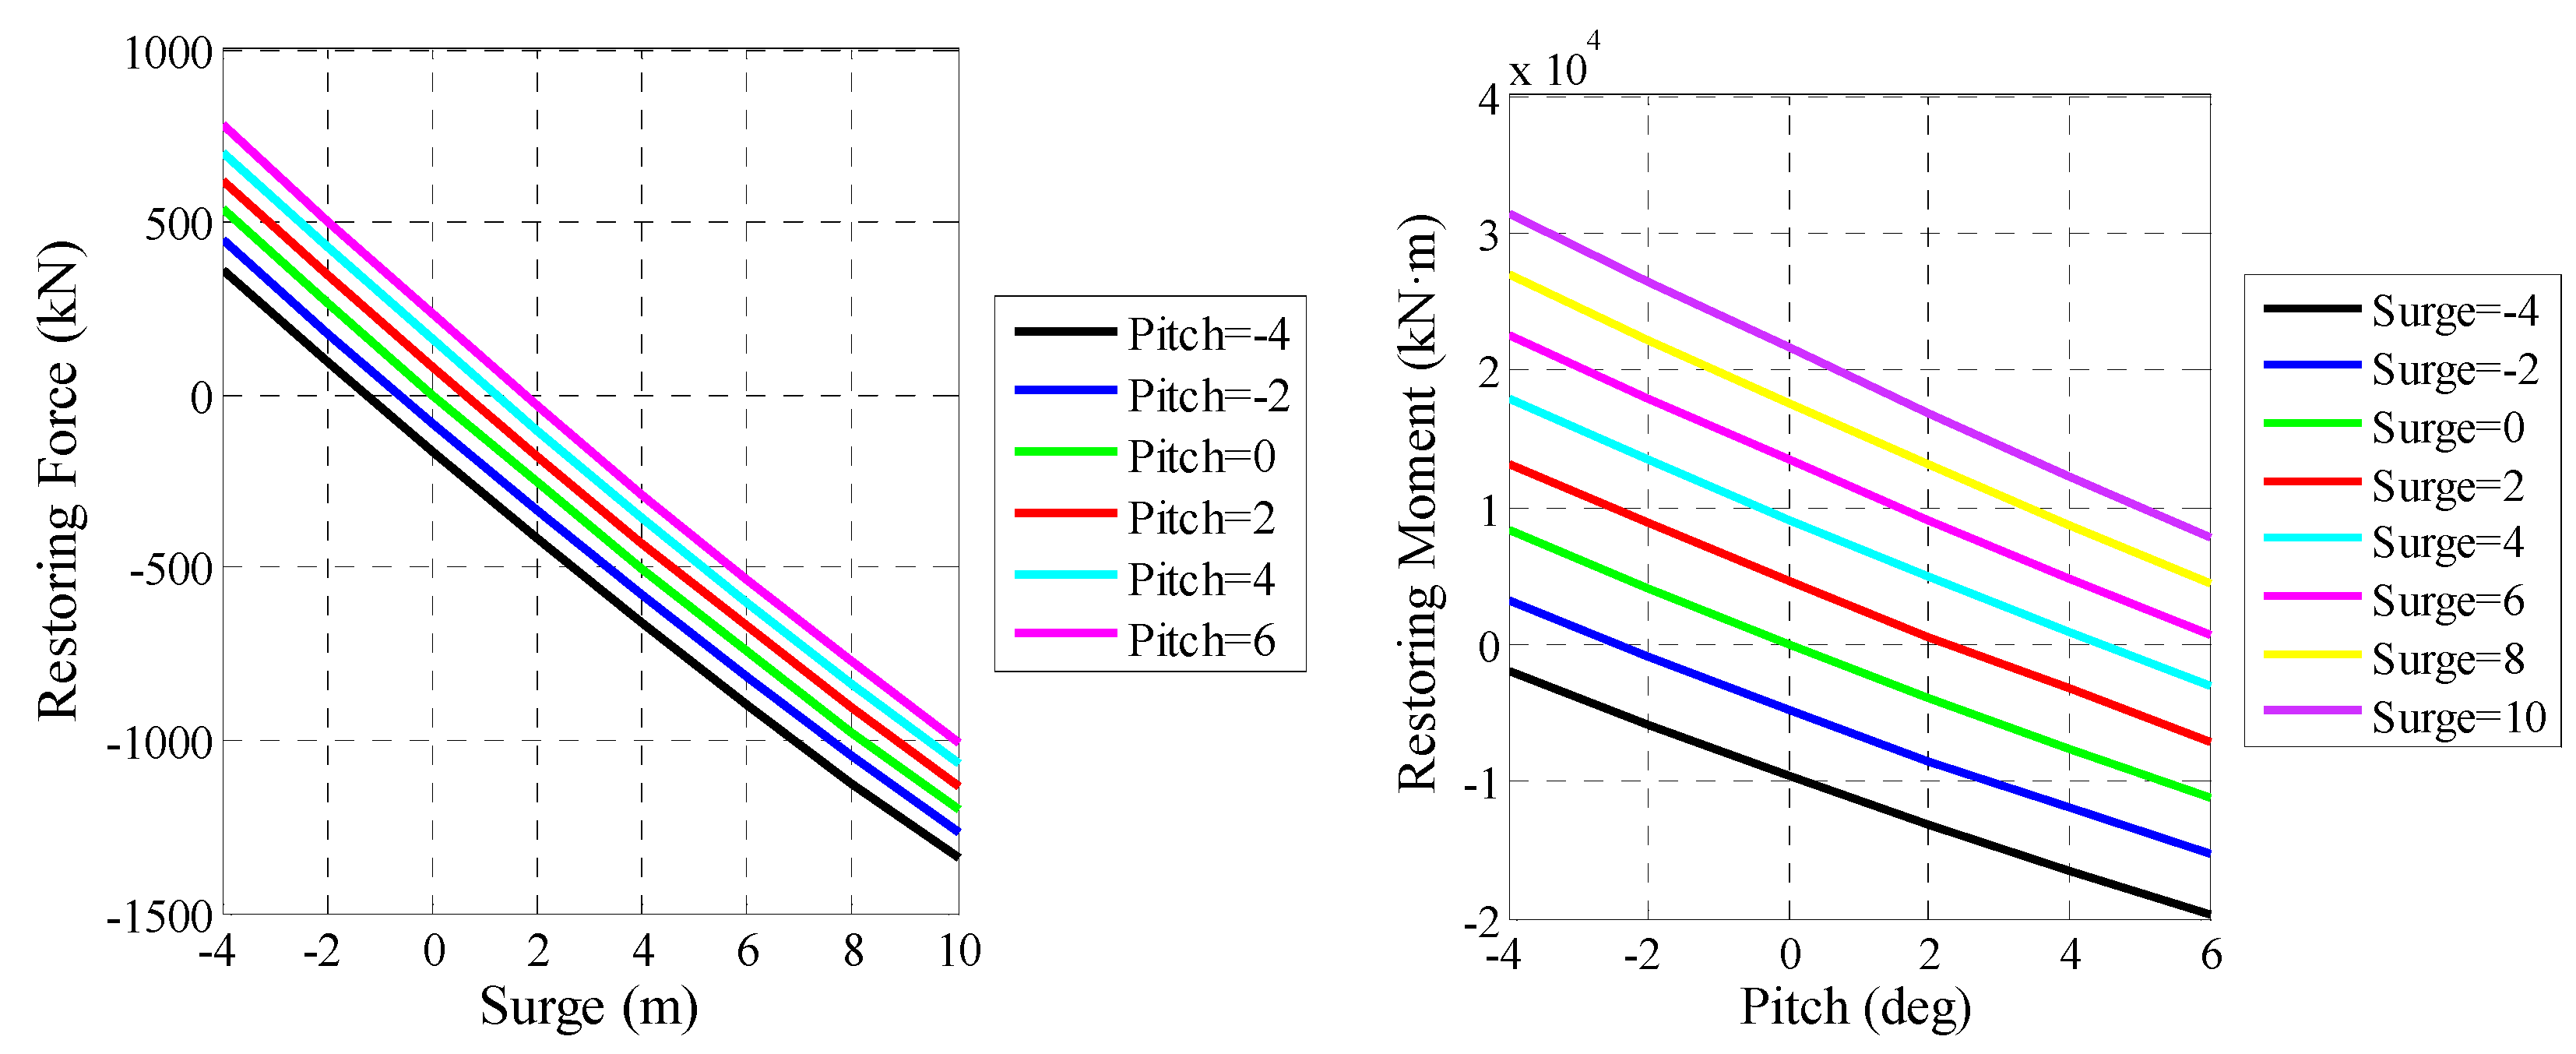
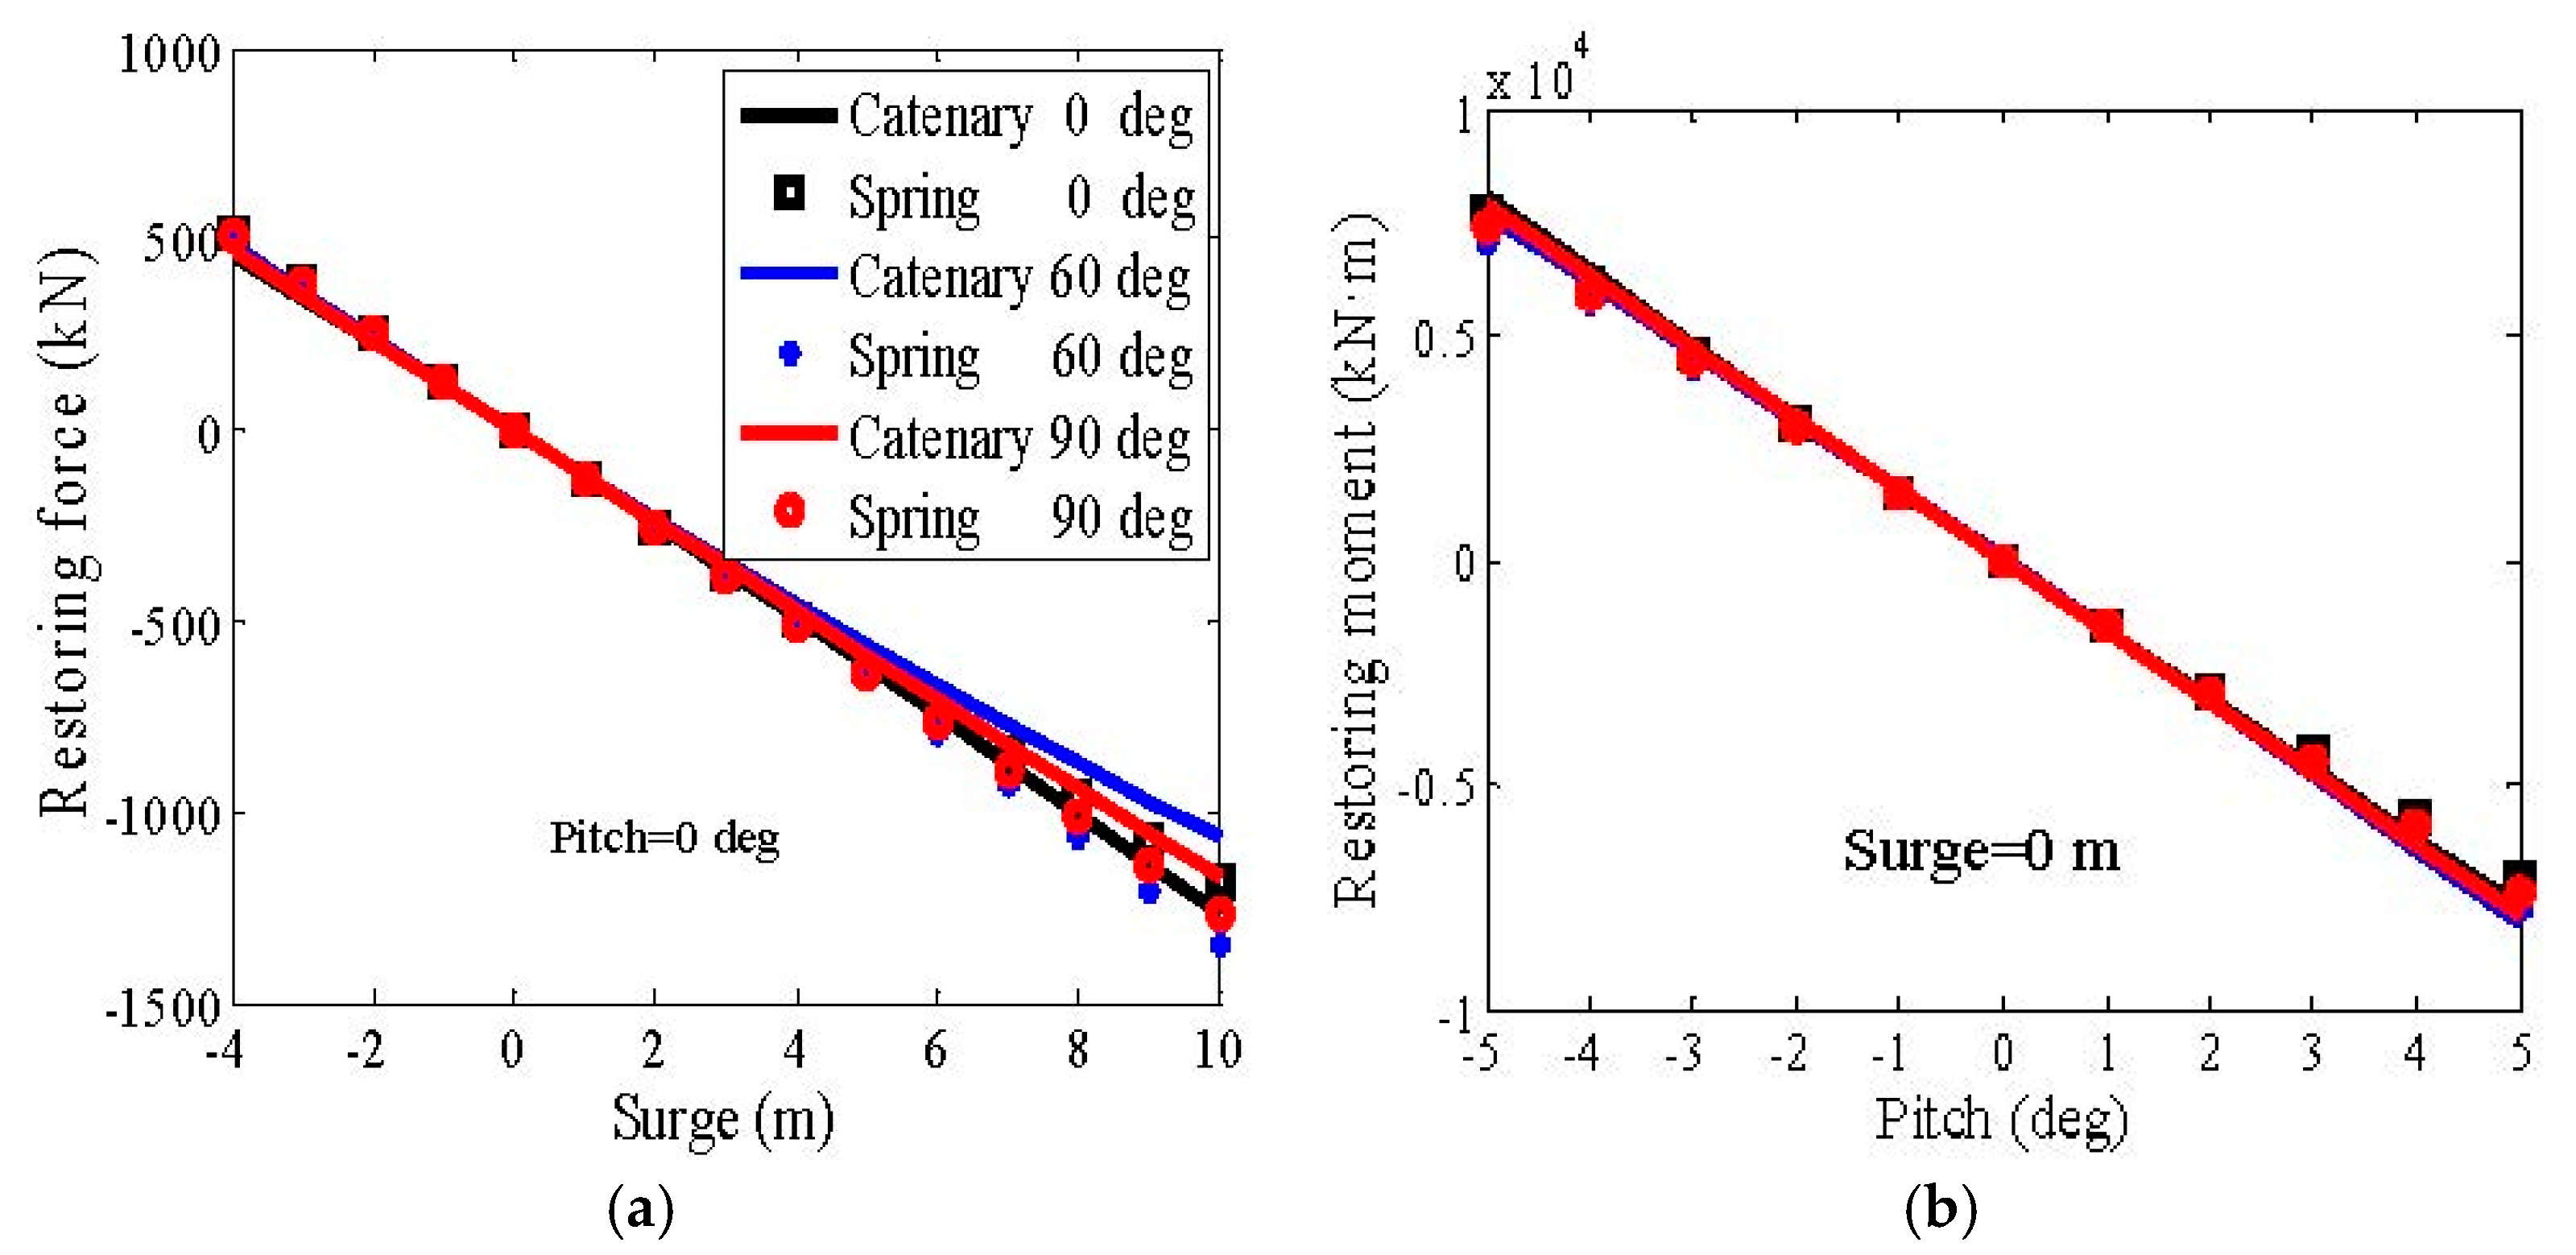
22]. As for the horizontal spring mooring system employed in the tests, good linearity of the load-displacement curves is shown in Figure 10. Hence, it is feasible to simulate its effects by a linear restoring matrix [12]. Similar with the catenary mooring lines, the surging and pitching (the swaying and rolling) restoring loads from the spring mooring lines are coupled. In this study, the restoring matrix is estimated by the linear least-squares fitting of the load-displacement curves of the spring mooring system. The slope of the fitted line is the diagonal element for each DOF and the gradient of the intercept against the coupling displacement is the off-diagonal element, namely the coupling term. The spring storing force in the heave DOF is neglected since it is minimal compared with the hydrostatic restoring force. The linear restoring matrix in three load directions, 0°, 60° and 90° in order, are shown in Equation (3). It is found that although the surging and pitching stiffness in 60° are slightly larger than the ones in 0° and 90° loads, the consistency of the spring mooring system between load directions is fair.
F Lines ( t ) = C Lines q ( t ) = [ 124578 134984 129927 N / m   0   0   0 2287592 2364732 2326108 N / rad   0   0 130040 130040 130040 N / m   0 2332444 2332444 2332456 N / rad   0   0 0 0 0 0 0 0   0 2334553 2334553 2334552 N · m / m   0 113627244 113627239 113626996 N · m / rad   0   0 2332716 2332407 2332563 N · m / m   0   0   0 111233315 116159579 113696678 N · m / rad   0   0   0   0   0   0 143894662 143894662 143894662 N · m / rad ] q ( t )

4.4. Structural Modeling of the Tower

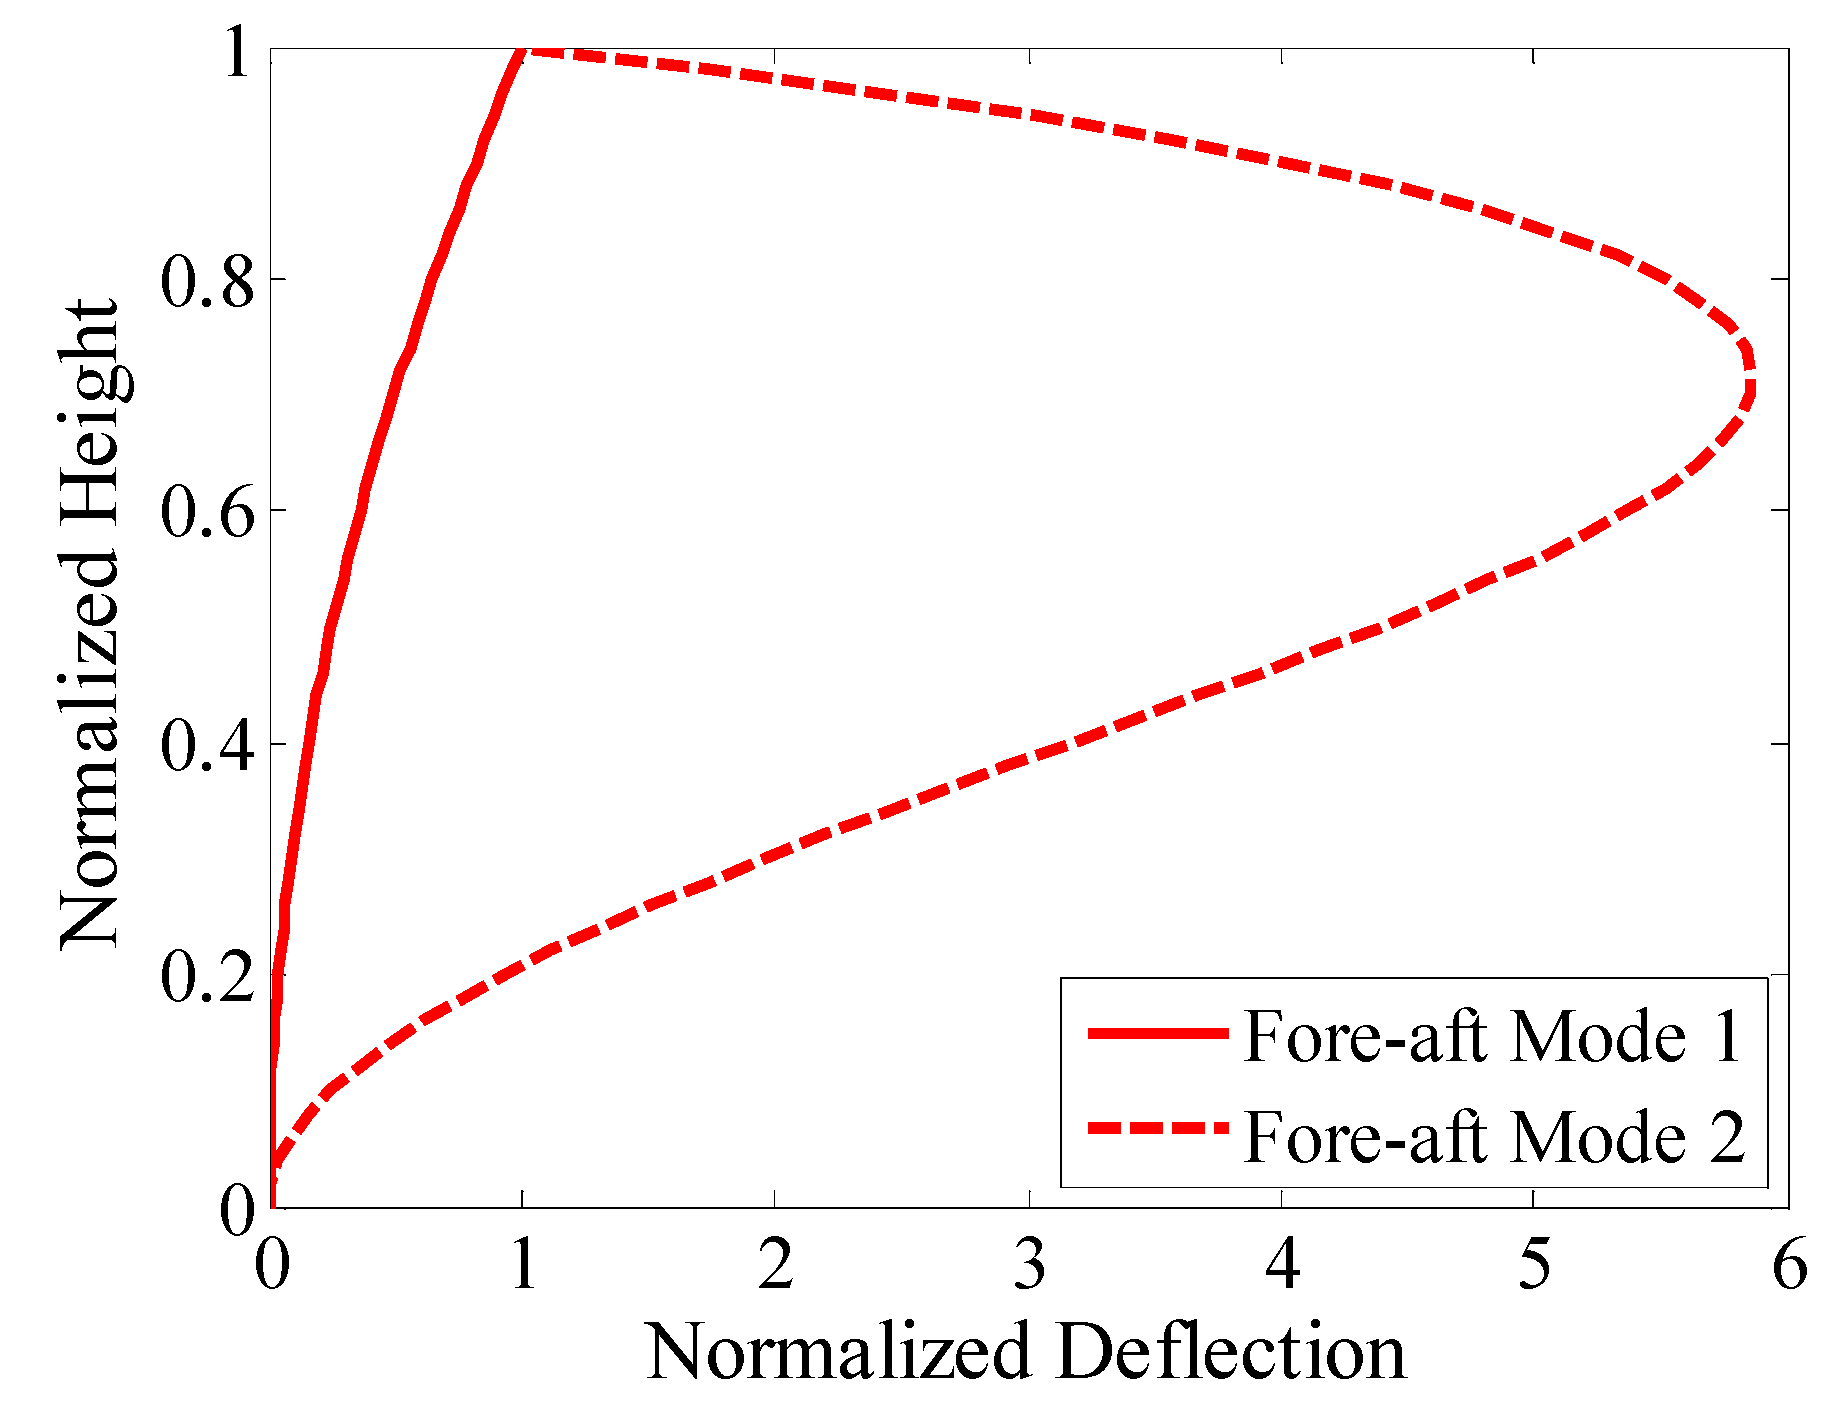
FAST employs an assumed-modes approach to model the tower flexibility and it needs the first two elastic bending mode shapes as well as structural properties to compute modal intergrals for the motion equations of the system. Since the tower mode shapes are strongly affected by the tower-base boundary conditions especially as mounted on a floating platform, the finite-element-method (FEM) based software BModes [50] capable of handling the coupled modal issues with complex boundary conditions was adopted in this study. The parameters that related to the tower vibration mode shapes such as the tower mass and stiffness distribution, tower-top mass, floating platform mass, added mass, hydrostaric stiffness and mooring stiffness were served as input to BModes, then the inertial and stiffness matrices of the whole system were constructed. Finally, by solving the eigenvalue problem, the tower fore-aft mode shapes are obtained and plotted in Figure 11. The first- and second-order natural frequencies of the employed turbine tower are 0.444 Hz and 2.949 Hz, respectively.

5. Results and Discussion

In this section, through comparing the experimental and numerical simulation results, the directionality effects of aligned wind and wave load on the dynamics of the ConFloat FOWT system are discussed.

5.1. Free Decay Tests

The purpose of free decay tests is to identify the natural periods of surge, sway, heave, roll, pitch and yaw. The natural periods of experimental and numerical models listed in Table 5 show a good agreement, which indicates that the mooring stiffness, the center of gravity and the moment of inertia of the numerical model are consistent with the test model. Moreover, the quadratic damping coefficients for six DOFs, which were tuned to match the free decay data, are given in Table 6. The coupling terms are not considered in this study, hence only the diagonal terms of the quadratic damping matrix are nonzero.

5.2. Regular Wave Tests

Regular wave tests can be used to investigate the directionality effects of wave heading on the linear hydrodynamic properties of the FOWT system. The harmonic, steady-state response data in both the model tests and the FAST simulations was processed to calculate the RAO, which is the linear response amplitude per wave height.
Figure 12 shows the comparisons of surge, heave and pitch RAOs in three wave headings. The surge RAO magnitudes show a good agreement between the simulated and experimental models, and rise with the increase of period from 5 s to 17 s. Beyond the period of 17 s, the test results show a local minimum at 21 s and reach peak at 23 s. However, numerical surge RAO increases continuously throughout the tested periods and drops down to 1.1 at 27 s before rising again at 29 s. Referring to the influences of wave headings, the magnitudes for the 0° and 60° wave are remarkably larger than those for the 90° from the period of 5 s to 9 s. Beyond that range, the surge RAO values are basically the same. This trend can be well explained by Figure 13 in which the surging force RAOs are compared between the three wave directions.
Figure 12b demonstrates that the heave RAOs are also little affected by the wave headings. The heave RAOs are relatively small for the periods smaller than 15 s. A sharp increase can be seen as the periods get close to the natural period of heave motion. The numerical results match well with the test data in most of the wave periods except the long periods around 23 s and 25 s and predict that the heave RAO values will gradually drop down after 19 s, going towards 1.
For the pitch RAOs in Figure 12c, although the differences are minor between wave headings in most of the wave periods, the wave directional effects are significant at 25 s, which is close to the natural pitch period. The measured pitch RAO for the 60° wave is almost 1.5 times as large as the ones for the 0° and 90°. The simulation results also predict a similar trend, but overestimate the magnitudes in the long-period waves. The pitch RAO values will peak at 27 s and fall down at 29 s.
The discrepancies between the numerical simulations and the model tests may result from the FAST model’s incapability of capturing the real damping behavior of the platform [11]. In fact, the viscous damping varies from different wave conditions. For the downscaled models, the magnitude of the Reynolds number, which can be estimated by using the method introduced in the literature [12], is 105 for the low-period waves, whereas 104 for the long-period waves. Correspondingly, the drag coefficients for circular section in the former circumstance (below 1.0) are smaller than the latter (over 1.1) according to Schewe’s study [51]. Since flow-separation-induced drag is a large component of the total hydrodynamic damping [11], the viscous damping effects tend to be more significant in the long-period waves than those in the low-period waves. The quadratic damping coefficients of the numerical models are determined based on free decay tests. Figure 12a,c imply that these damping values are applicable in the low-period wave cases. For that reason, the numerical models are inclined to overestimate the motion responses in the long-period waves. Nevertheless, this study mainly focuses on the rated operational sea state whose wave periods are less than 10 s. Therefore, the selected quadratic damping coefficients meet the requirement of the study.
In addition, the tower base fore-aft shear force and bending moment are critical for the strength and fatigue design of the structure. Besides, the nacelle acceleration is closely correlated with the operation of driver train. Thus, even though they were not measured in the tests, their RAOs are also calculated with the aid of the numerical simulations and plotted in Figure 12. Interestingly, the impacts of wave direction are also significant in the short-period waves. For the period of 5 s, the tower base load and nacelle acceleration RAOs for 0° and 60° are nearly three/four times larger than the ones for 90°. The differences become smaller as the wave period increases and disappear in the periods from 13 s to 23 s. Between 25 s and 27 s, the values for 60° are larger than the ones for 0° and 90°. This trend is quite similar with the surge as well as the pitch RAOs. Undoubtedly, the responses of the wind turbine rely on the platform motions. The time series of the surge, tower base loads and nacelle acceleration under the 5-s regular wave are present in Figure 14, which indicates that the directionality differences in tower base loads and nacelle acceleration are attributable to the first-order surge motion. This can be explained by Figure 13, which shows that the platform tends to suffer from larger surging wave loads in 60°.

5.3. Steady Wind Tests

Model tests and numerical simulations of the ConFloat platform subjected to steady wind conditions were performed to examine the wind directionality effects on the platform motions. The comparisons of average surge and pitch motions are presented in Figure 15. The agreement between the test and simulation data implies that the averaged aerodynamic characteristics of wind turbine are accurately captured by the numerical model.
Without wave effects, the surge motions are determined by an equilibrium between the wind thrusts on the rotor and restoring forces provided by moorings. As Equation (3) shows, the surging restoring stiffness of the spring mooring system in 60° is larger than other directions, so slightly smaller surges are observed. The figure also shows a fairly good consistency of pitch motion between wind directions, indicating that the ability of such a four-column semi-submersible platform to resist wind-induced heeling moment from different directions is identical.

5.4. Irregular Wave Tests

To minimize the modeling uncertainties in the comparison, the wave height time series measured in the upstream of flume were imposed directly as the incident waves for the numerical simulations [15,37]. All the simulations were run for 4650 s in full scale to achieve the desired steady-state results.
The comparisons of surge and pitch power spectral density (PSD) for the three wave headings are displayed in Figure 16. The simulations accurately predict the surge and pitch motion responses in frequency domain. The resonant surge and pitch motions dominate the wave-induced responses, while the components in the incident wave frequency range of 0.1 Hz to 0.3 Hz are minimal. Considering the wave headings, the surge PSD magnitude for the 90° wave is larger than the ones for 0° and 60°. For the pitch motion, the responses reach maximum in the 60° wave and are inhibited mostly in the 90°. The maximum values and standard deviation provided in Figure 17 present a similar trend, but the mean values are basically identical between wave headings. These phenomena indicate it is the second-order hydrodynamic forces that give rise to the notable differences between wave directions.
In order to further illustrate how the second-order hydrodynamic loads contribute to the wave directionality effects, the load and motion QTFs for the three wave headings are compared in Figure 18. The resonant responses are dominant for the semi-submersible FOWT, hence only the QTF values in the surge and pitch natural frequency are plotted. The horizontal ordinate f1 is one of the frequency pairs which makes | f 1 f 2 | equal to the surge/pitch natural frequency. Figure 18a shows that the second-order surging forces for the 90° wave are remarkably larger than those for the other two wave headings between 0.15 and 0.18 Hz, which belong to the prominent range of the rated operational wave condition. Beyond that range, the QTF values for 90° drop down rapidly and the local maximum values tend to occur in the 60° wave. However, the wave energy in such a high frequency range is less influential. Figure 18b demonstrates that the floating platform is more likely to suffer from the largest pitching moment under the 60° wave attack.
With the load QTFs, the corresponding motion QTFs can be calculated based on the following Equation [18]:
Q T F M ( ω d ) = [ ω d 2 [ M + A ( ω d ) ] + i ω d B ( ω d ) + C ] 1 Q T F F ( ω d )
where ωd is the difference frequency; QTFF (ωd) and QTFM (ωd) are the load and motion QTF vector respectively; B is the radiation damping matrix.
As shown in Figure 18c,d, the surge QTF curves are quite similar to the corresponding load QTFs, while some differences are observed in the pitch QTFs. The distinctions between wave directions are amplified, the pitch QTF value for 60° can be five times as large as the 0° wave.
Furthermore, the second-order motion responses in the rated operational wave condition can be computed as [49]:
q ( ω d ) = | ω d = ω m ω n | Q T F M ( ω d ) | 2 S ( ω m ) d ω 2 S ( ω n ) d ω e i ( φ m n + φ m + φ n ) |
where S(ω) is the one-sided wave spectrum; φmn is the phase of motion QTFs; φm and φn are the random phases of stochastic waves at the frequency of ωm and ωn, respectively, which are assumed to uniformly distribute between 0 and 2π [49]. It is worth noting that the magnitudes of motion response differ from different wave phase values. To get an overall impression of the differences between the three wave directions, the summation is done for 300 different wave seeds. For comparative purpose, identical wave phase values are taken between the three wave headings for each wave seed. The second-order motion responses along with different wave seeds are presented in Figure 19. In accordance with the phenomena observed in the tests, larger surge motion tends to occur in the 90° wave, while larger pitch motion more likely to be seen in the 60° wave. For clarity, the response values are averaged and plotted by the dash lines in the figures. This analysis verifies the inference that the wave load directionality effects are attributable to the second-order hydrodynamic loads.
Based on the aforementioned validated numerical models, the fore-aft tower base bending moment Mtwr and nacelle acceleration ancl are also investigated and the simulation results are shown in Figure 20. The wind turbine is excited in three frequency components, i.e., the platform pitch natural frequency, the incident wave frequency and the fundamental tower-bending frequency. Thereinto, the wave-frequency excitation, which is induced by the first-order hydrodynamic loads, is the most significant component for the wind turbine dynamic responses. The largest and smallest Mtwr and ancl PSD values are seen in the 60° and 90° wave respectively. This trend is consistent with the RAO results shown in Figure 12e,f and it is fundamentally correlated to the first-order wave loads in the surge DOF (as Figure 13 shows). Figure 20 also shows that Mtwr is more sensitive to the platform pitch motion compared with ancl. Large Mtwr PSD values are predicted in the pitch natural frequency, which can be explained by the larger moments induced by the gravitational loads as the wind turbine tilts. Once again, the dynamic responses for 60° are larger than the other two directions. Based on the above analysis, it can be appreciated that this part of the difference originates from the second-order hydrodynamic loads. As a whole, both the first- and second-order hydrodynamic loads contribute to the differences of Mtwr and ancl between wave directions. It seems that the former is more influential.
As shown in Figure 21, the maximum and standard deviation of the simulated Mtwr and ancl varies a lot with wave directions. The maximum values of Mtwr and ancl in the 60° wave are nearly two times larger than those of the 90° wave, demonstrating the great impact of the wave load directionality effects on the wind turbine dynamics.

5.5. Combined Wind and Waves Tests

In the case of combined wind and wave tests, the incoming wind speeds and wave heights measured in the tunnel are served as input to the numerical models. The PSDs of the platform motion in three load directions are presented in Figure 22. The predicted surge motion agrees well with the model test data. Although the surge PSD values are slightly augmented due to the fluctuating wind loads, the relative magnitudes between load headings are in conformance with the irregular wave tests. With regard to the pitch motion, the oscillations in pitch natural frequency are significantly suppressed by the quasi-static wind loads. Nevertheless, larger pitch PSD values can still be observed in the 60° load direction. In addition, it is observed that the wind loads excite some low-frequency oscillations. Since only the average aerodynamic loads are modeled, the numerical models fail to capture this part of response. Interestingly, the descending order of the low-frequency responses between load directions, i.e., 60°, 90° and 0°, is consistent with the one of the resonant components, implying that the second-order wave loads may have an effect on these wind-induced low-frequency responses. In summary, it is still the second-order wave loads responsible for the differences of the platform surge and pitch motions between aligned wind/wave load directions.
The statistical surge and pitch data for three aligned wind and wave directions is given in Figure 23. Good agreement between the simulation and the test data is achieved. Owing to the wind load inhibiting effects, the pitch differences between load directions, which are mainly induced by the second-order wave loads, are relatively small compared with the irregular wave tests.
Moreover, Mtwr and ancl under the rated combined wind and wave condition are also examined and the PSD diagrams are presented in Figure 24. By comparing the results shown in Figure 20 and Figure 24, the influence of wind loads on the dynamic characteristics of the wind turbine can be summed up as follows: firstly, the responses in pitch natural frequency are suppressed into a very small level; secondly, the components in incident wave frequencies are augmented. As mentioned above, the former is related to the second-order pitch motion which is suppressed by the quasi-static wind loads, while the latter is correlated with the first-order surge motion which is slightly amplified by the wind loads, eventually leading to such Mtwr and ancl responses under the rated combined wind and wave condition. In this case, the Mtwr and ancl distinctions between load directions mainly attribute to the first-order wave loads. However, it is worth noting that these conclusions are restricted to the equivalent irrotational wind turbine model and the steady wind conditions used in the tests.
The statistical data of the Mtwr and ancl is shown in Figure 25. The mean Mtwr depends on average wind loads. As Figure 15 shows, the platform motions are independent of wind load directions. Hence, it can be appreciated that the mean Mtwr values are identical between load directions. The directionality differences in the maximum and standard deviation values once again demonstrate the importance of load directions for the Y-shape semi-submersible floating wind turbine.

5.6. Simulations with a Fully Operational Wind Turbine and Realistic Wind and Waves

In order to figure out the physics in more realistic situation, numerical simulations with an operating wind turbine and turbulent wind conditions were carried out and discussed in this section.
The stochastic waves measured in the wave flume and the turbulent wind fields generated by TurbSim [52], a stochastic inflow turbulence simulator developed by NREL, are served as input to the numerical models. The turbulent wind fields follow the Kaimal spectrum recommended by IEC61400-1 [53]. The mean wind speed and turbulent intensity at hub height are 11.4 m/s and 14.48% respectively. The mean wind profile is described by the power law with an exponent of 0.14.
The surge and pitch PSDs in three load directions are compared in Figure 26. Larger surge and pitch PSD values can be observed in the 90° and 60° load heading respectively, which is in accordance with the aforementioned analysis. By comparing with the simplified model (Figure 22), the oscillations of the actual model are much more significant, which demonstrates the important contributions of the rotating rotor and the turbulent wind to the overall response. Similar phenomena can be found in the statistical data shown in Figure 27.
The dynamic responses of the operational wind turbine are shown in Figure 28 and Figure 29. The tower base bending moment PSDs show that there are noticeable peaks in low frequencies. This component is excited by the low-frequency turbulent wind and the platform pitch motion. Besides, the oscillations near the three times of the rotor’s rotational frequency (3P) are also captured by the actual model, even though they are relatively small compared with other components. The frequency range of 3P oscillations are distributed from 0.5 Hz to 0.65 Hz because the rotor speed varies with the fluctuating wind speed. The comparison between Figure 29a and Figure 25a shows that the maximum values of the actual model are nearly 20% larger than those of the simplified model, which indicates the significance of this low-frequency excitation. As for the nacelle acceleration, the PSDs figures of the actual and the simplified model are roughly the same in the wave frequency. The main differences exhibit around the 3P and the pitch-natural-frequency. The actual model shows that compared with the tower base loads, the nacelle acceleration is more sensitive to the 3P excitation. Consequently, as Figure 29 shows, statistical responses of the actual model are larger than the simplified model. Additionally, the results of tower top thrust are also plotted in the figures. Compared with the tower base bending moments, the PSDs of tower top thrusts display similar trends but lower sensitivities to wave-induced oscillations. Overall, apart from these differences between the two models, they both demonstrate that the most unfavorable load direction is 60° and the directionality differences are mostly induced by the first-order wave loads.

6. Conclusions

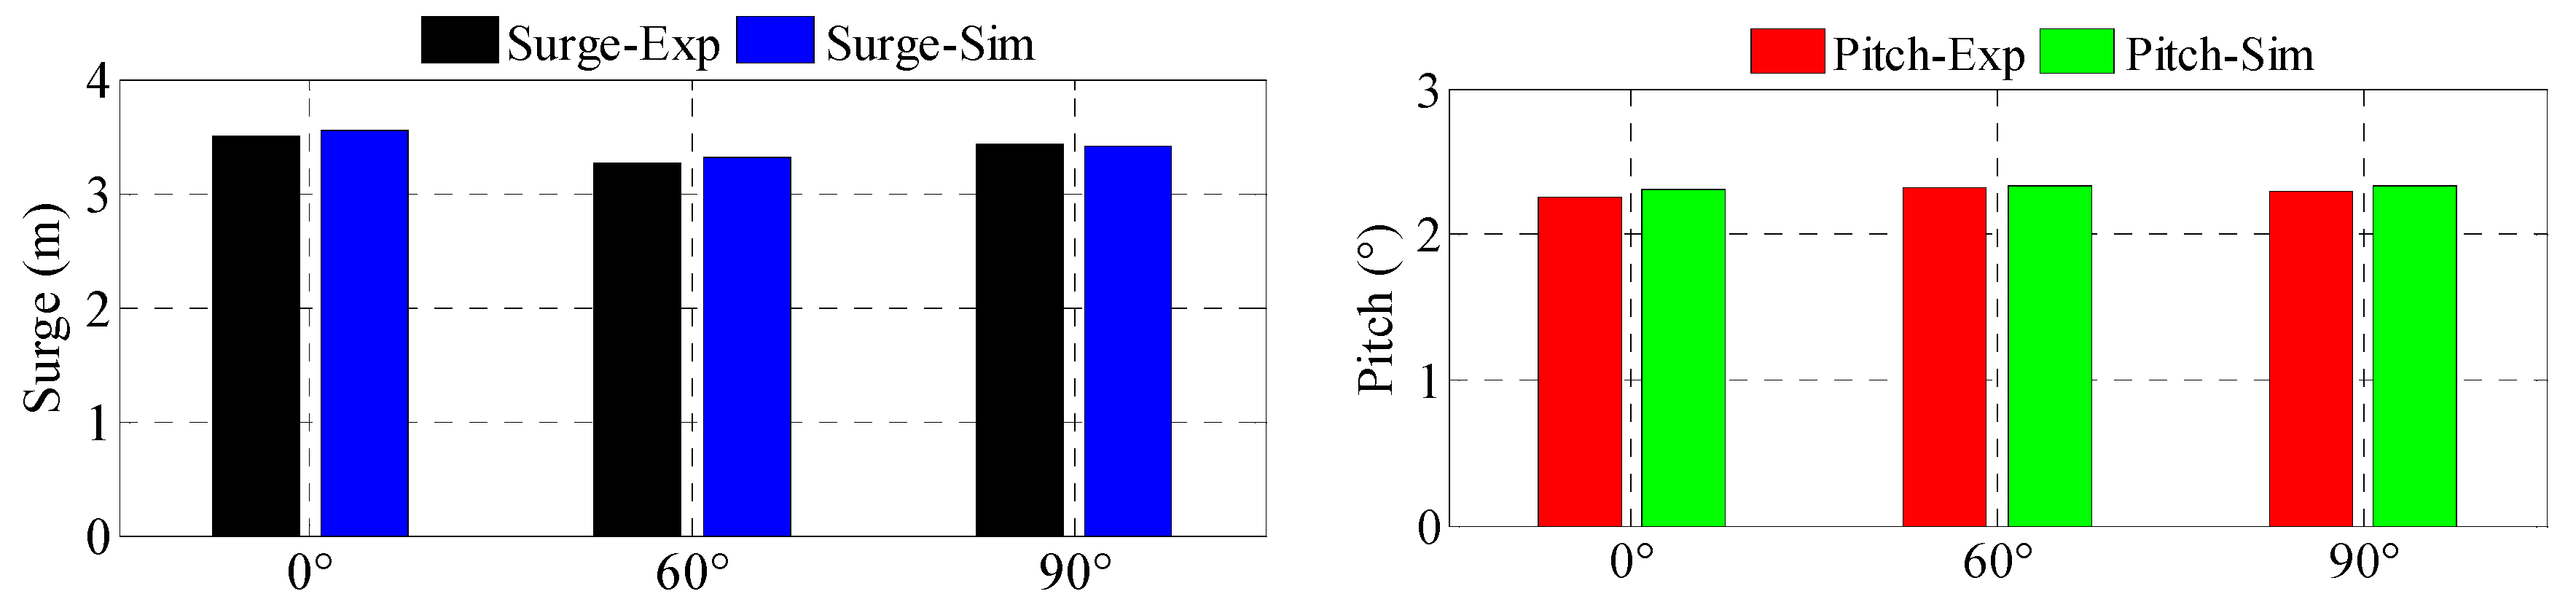
In this paper, the performance of a Y-shape semi-submersible wind turbine in three load directions (0°, 60° and 90°) was investigated by means of model tests and numerical simulations. 1:60 scaled model tests were carried out in the rated operational sea state and the test data validated the numerical models. The effects of aligned wind and wave load direction on the surge, pitch, tower base fore-aft bending moment and nacelle acceleration of the FOWT system are discussed in detail. The main conclusions are summarized as follows:
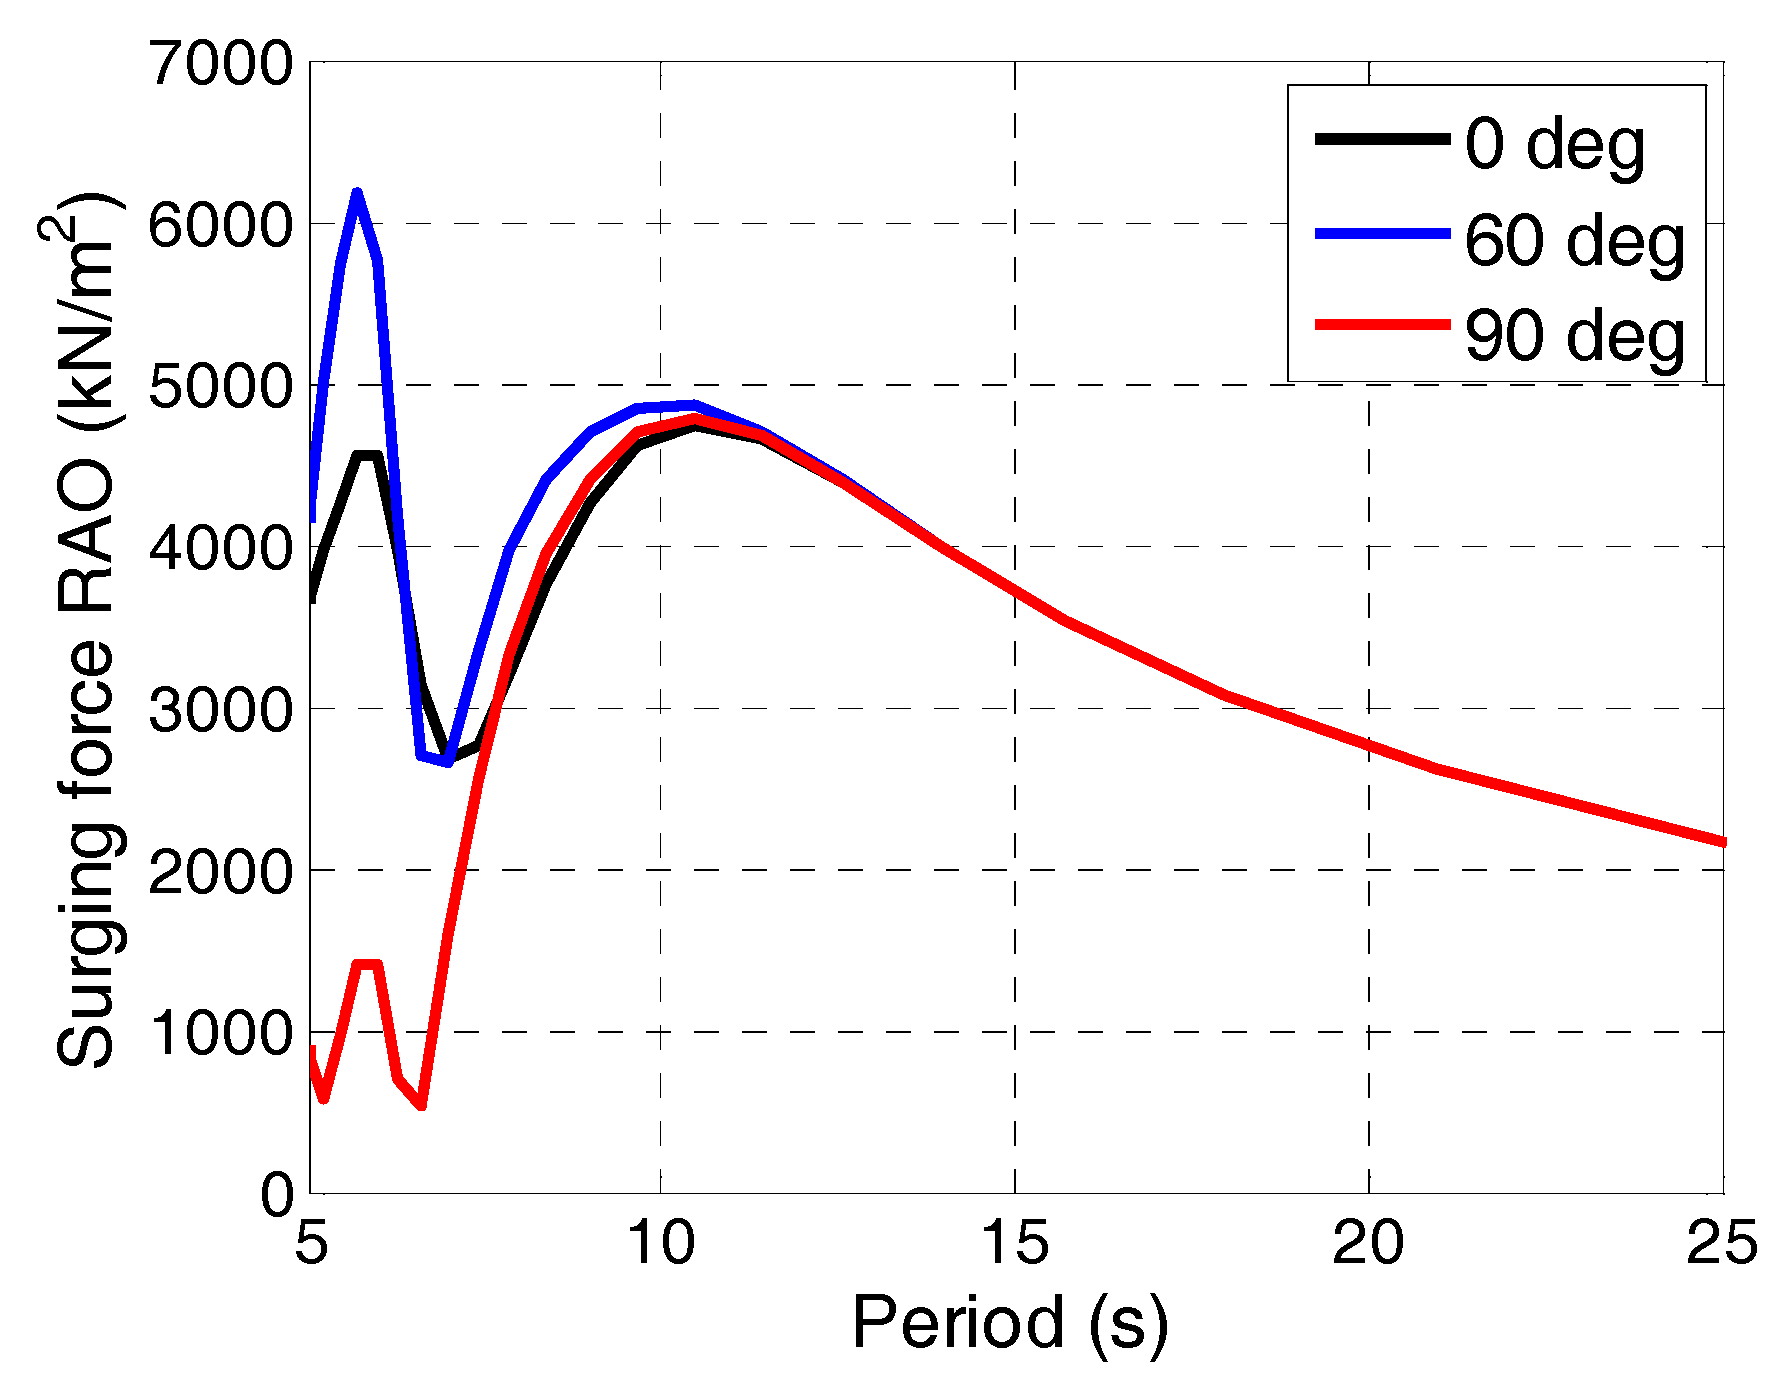
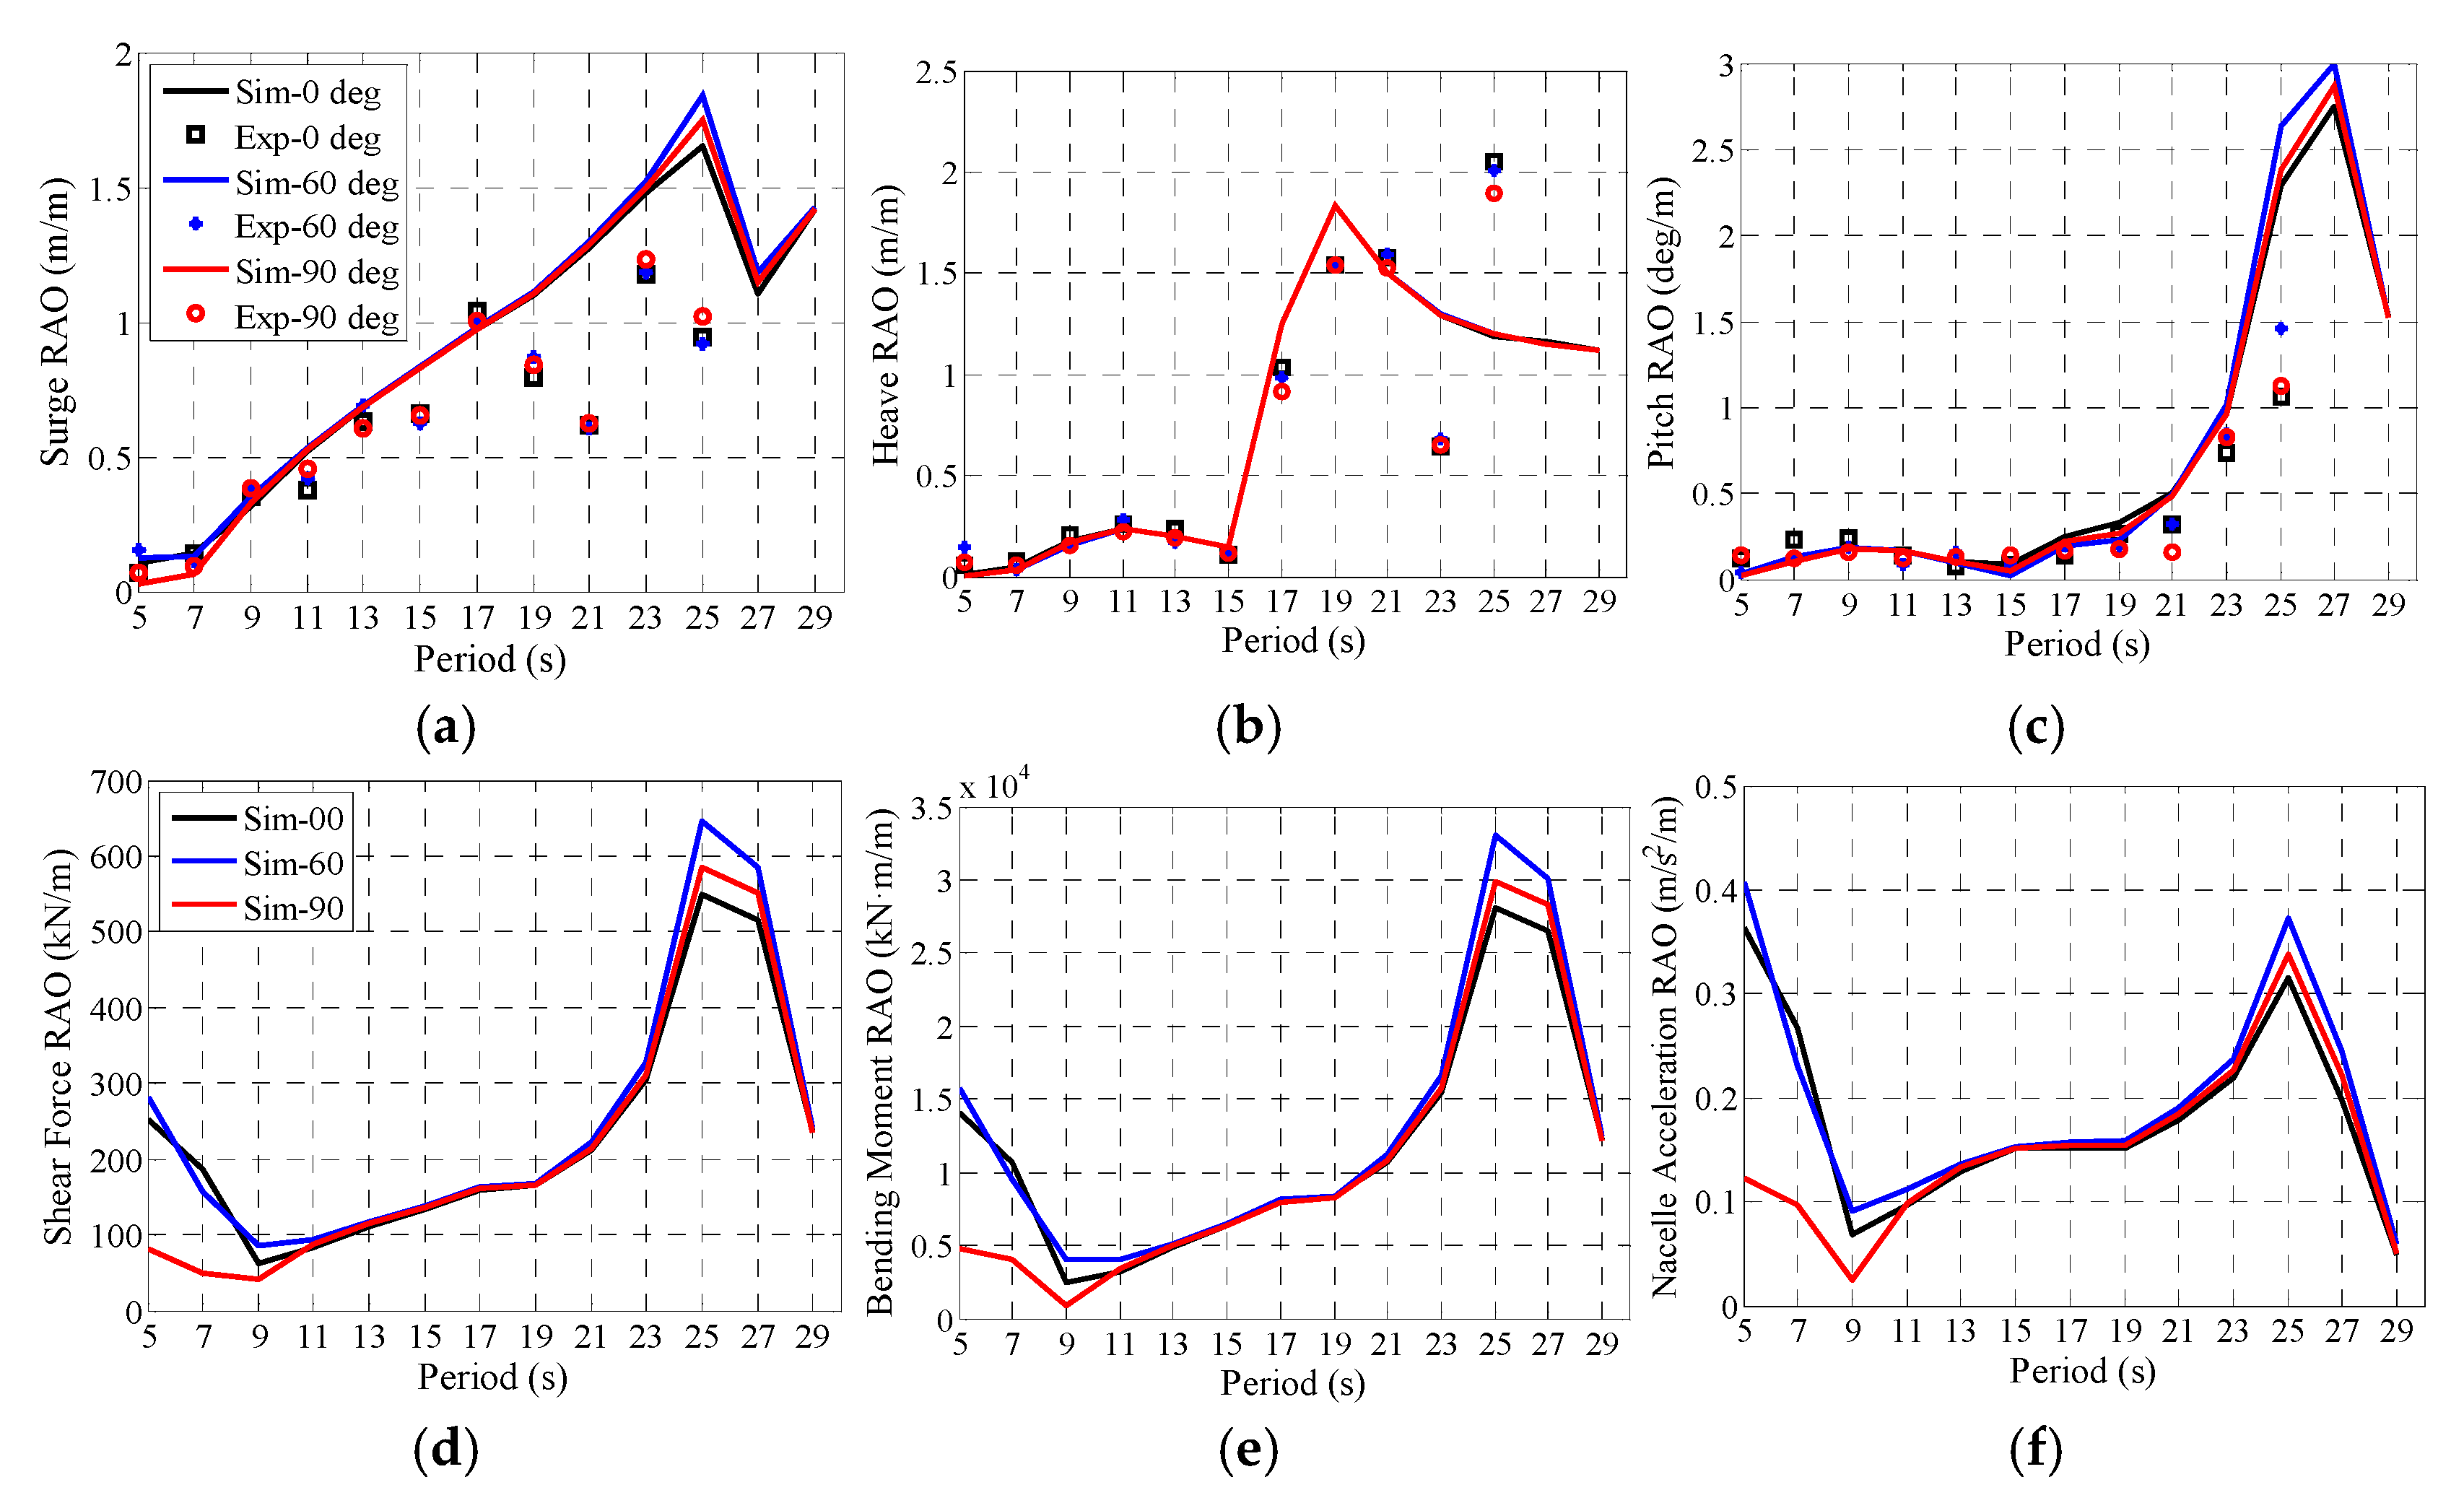
Both the experimental and numerical results for regular wave tests show that the wave load direction has little influence on the first-order heave and pitch motions in most periods (except the period of 25 s). However, remarkable surge differences between the three wave headings are observed in the period of 5 s to 9 s. The RAO magnitudes for the 0° and 60° wave are larger than those for 90°. These differences could be important for the mild or moderate sea states because they will further lead to a large difference in the first-order wind turbine dynamic responses, such as tower base loads and nacelle acceleration. It is found that the RAO values for 0° and 60° are nearly three/four times larger than those for 90°.
The wind only test results show a very good consistency of pitch motion between wind directions because the ability of the Y-shape semi-submersible platform to resist wind-induced heeling moment from different directions is nearly identical. In other words, the platform motions are less affected by wind load directions.
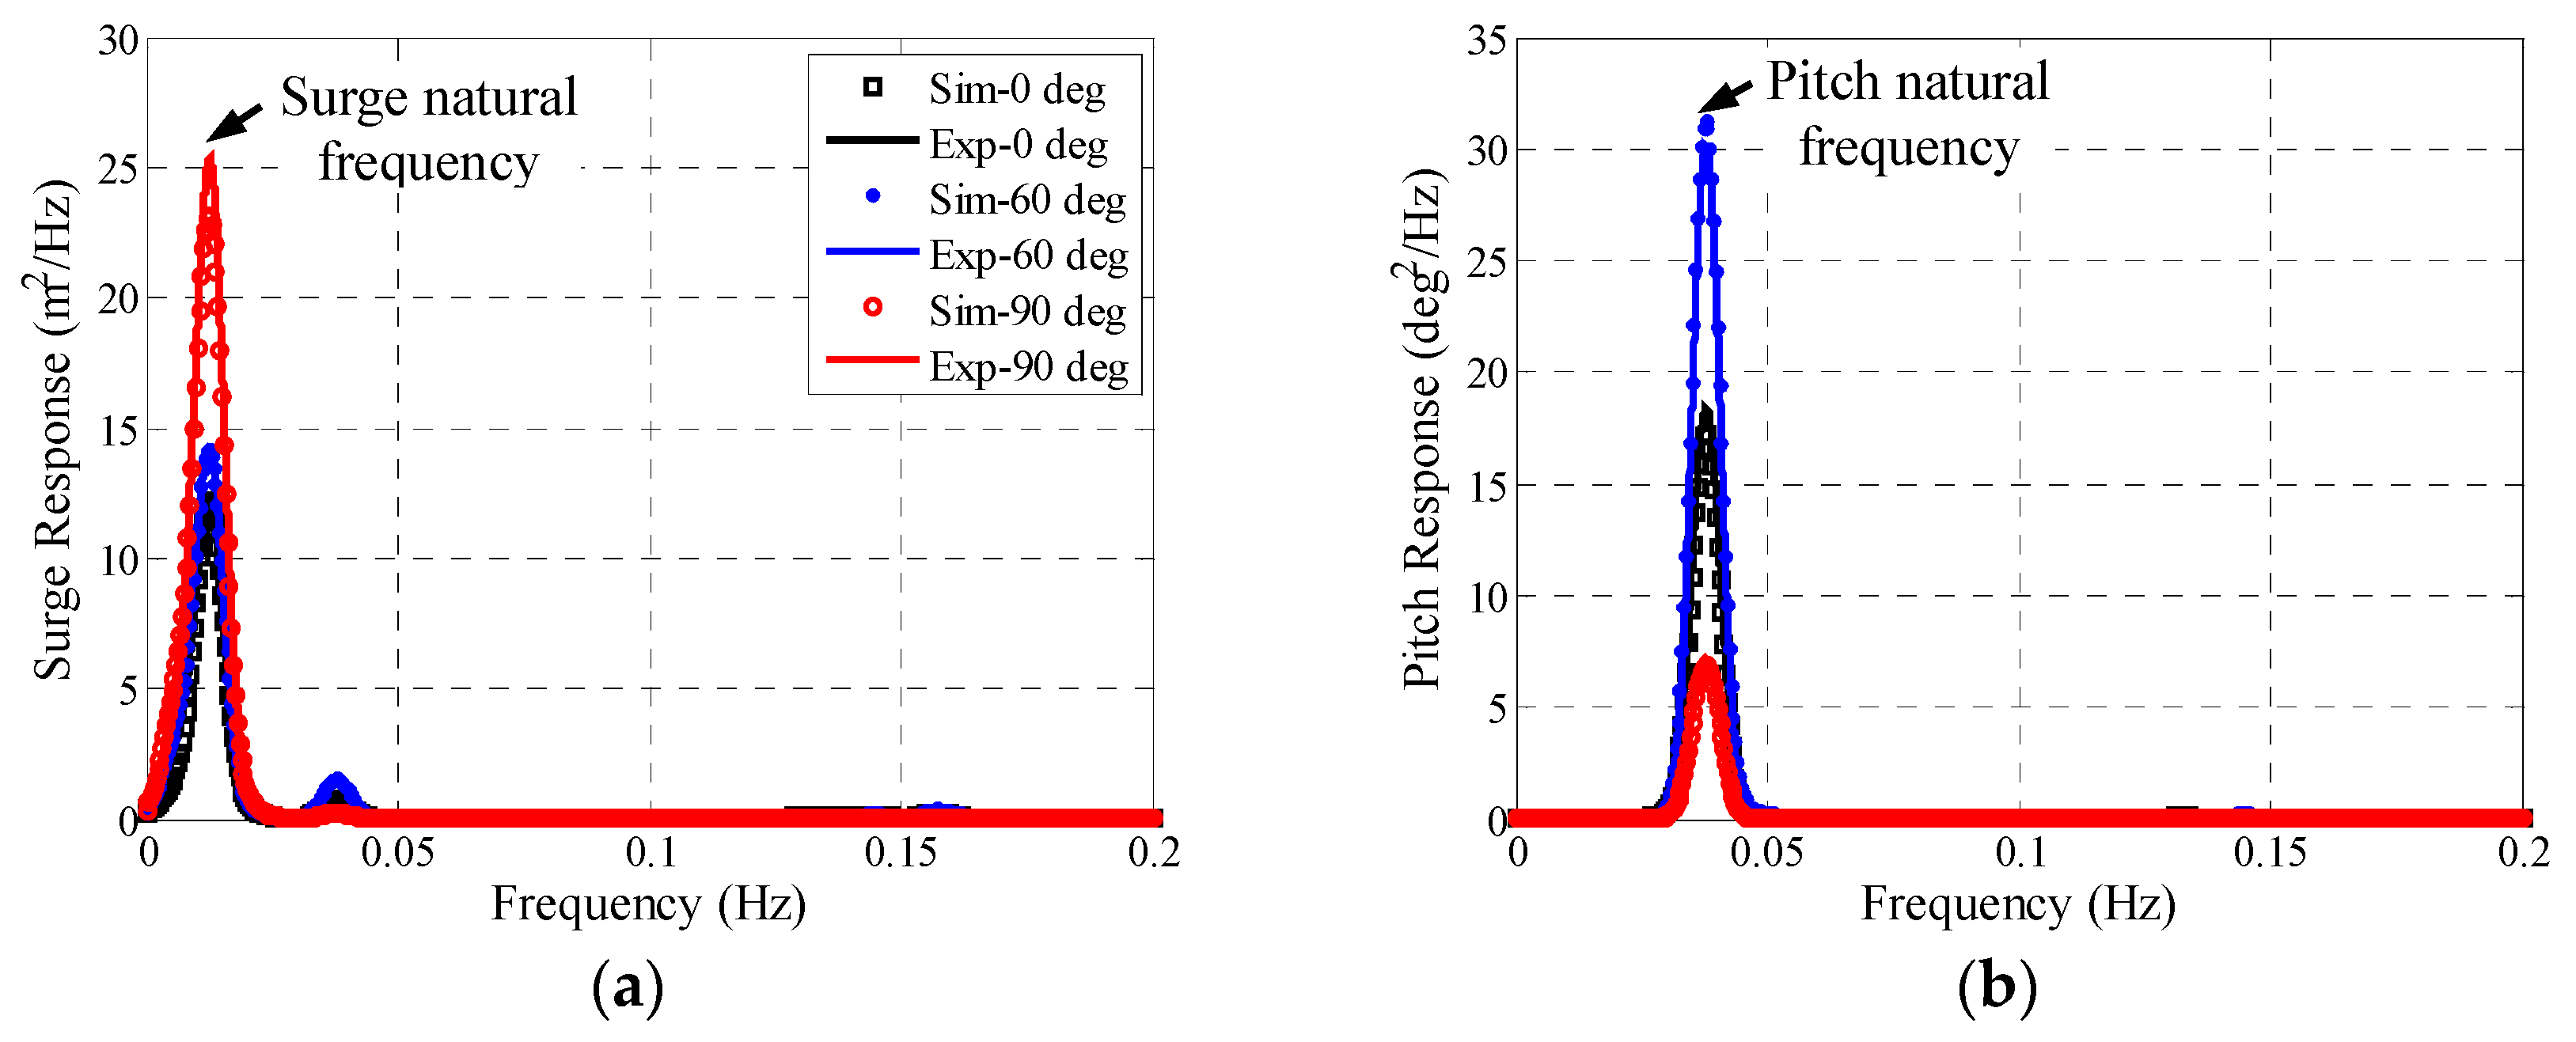
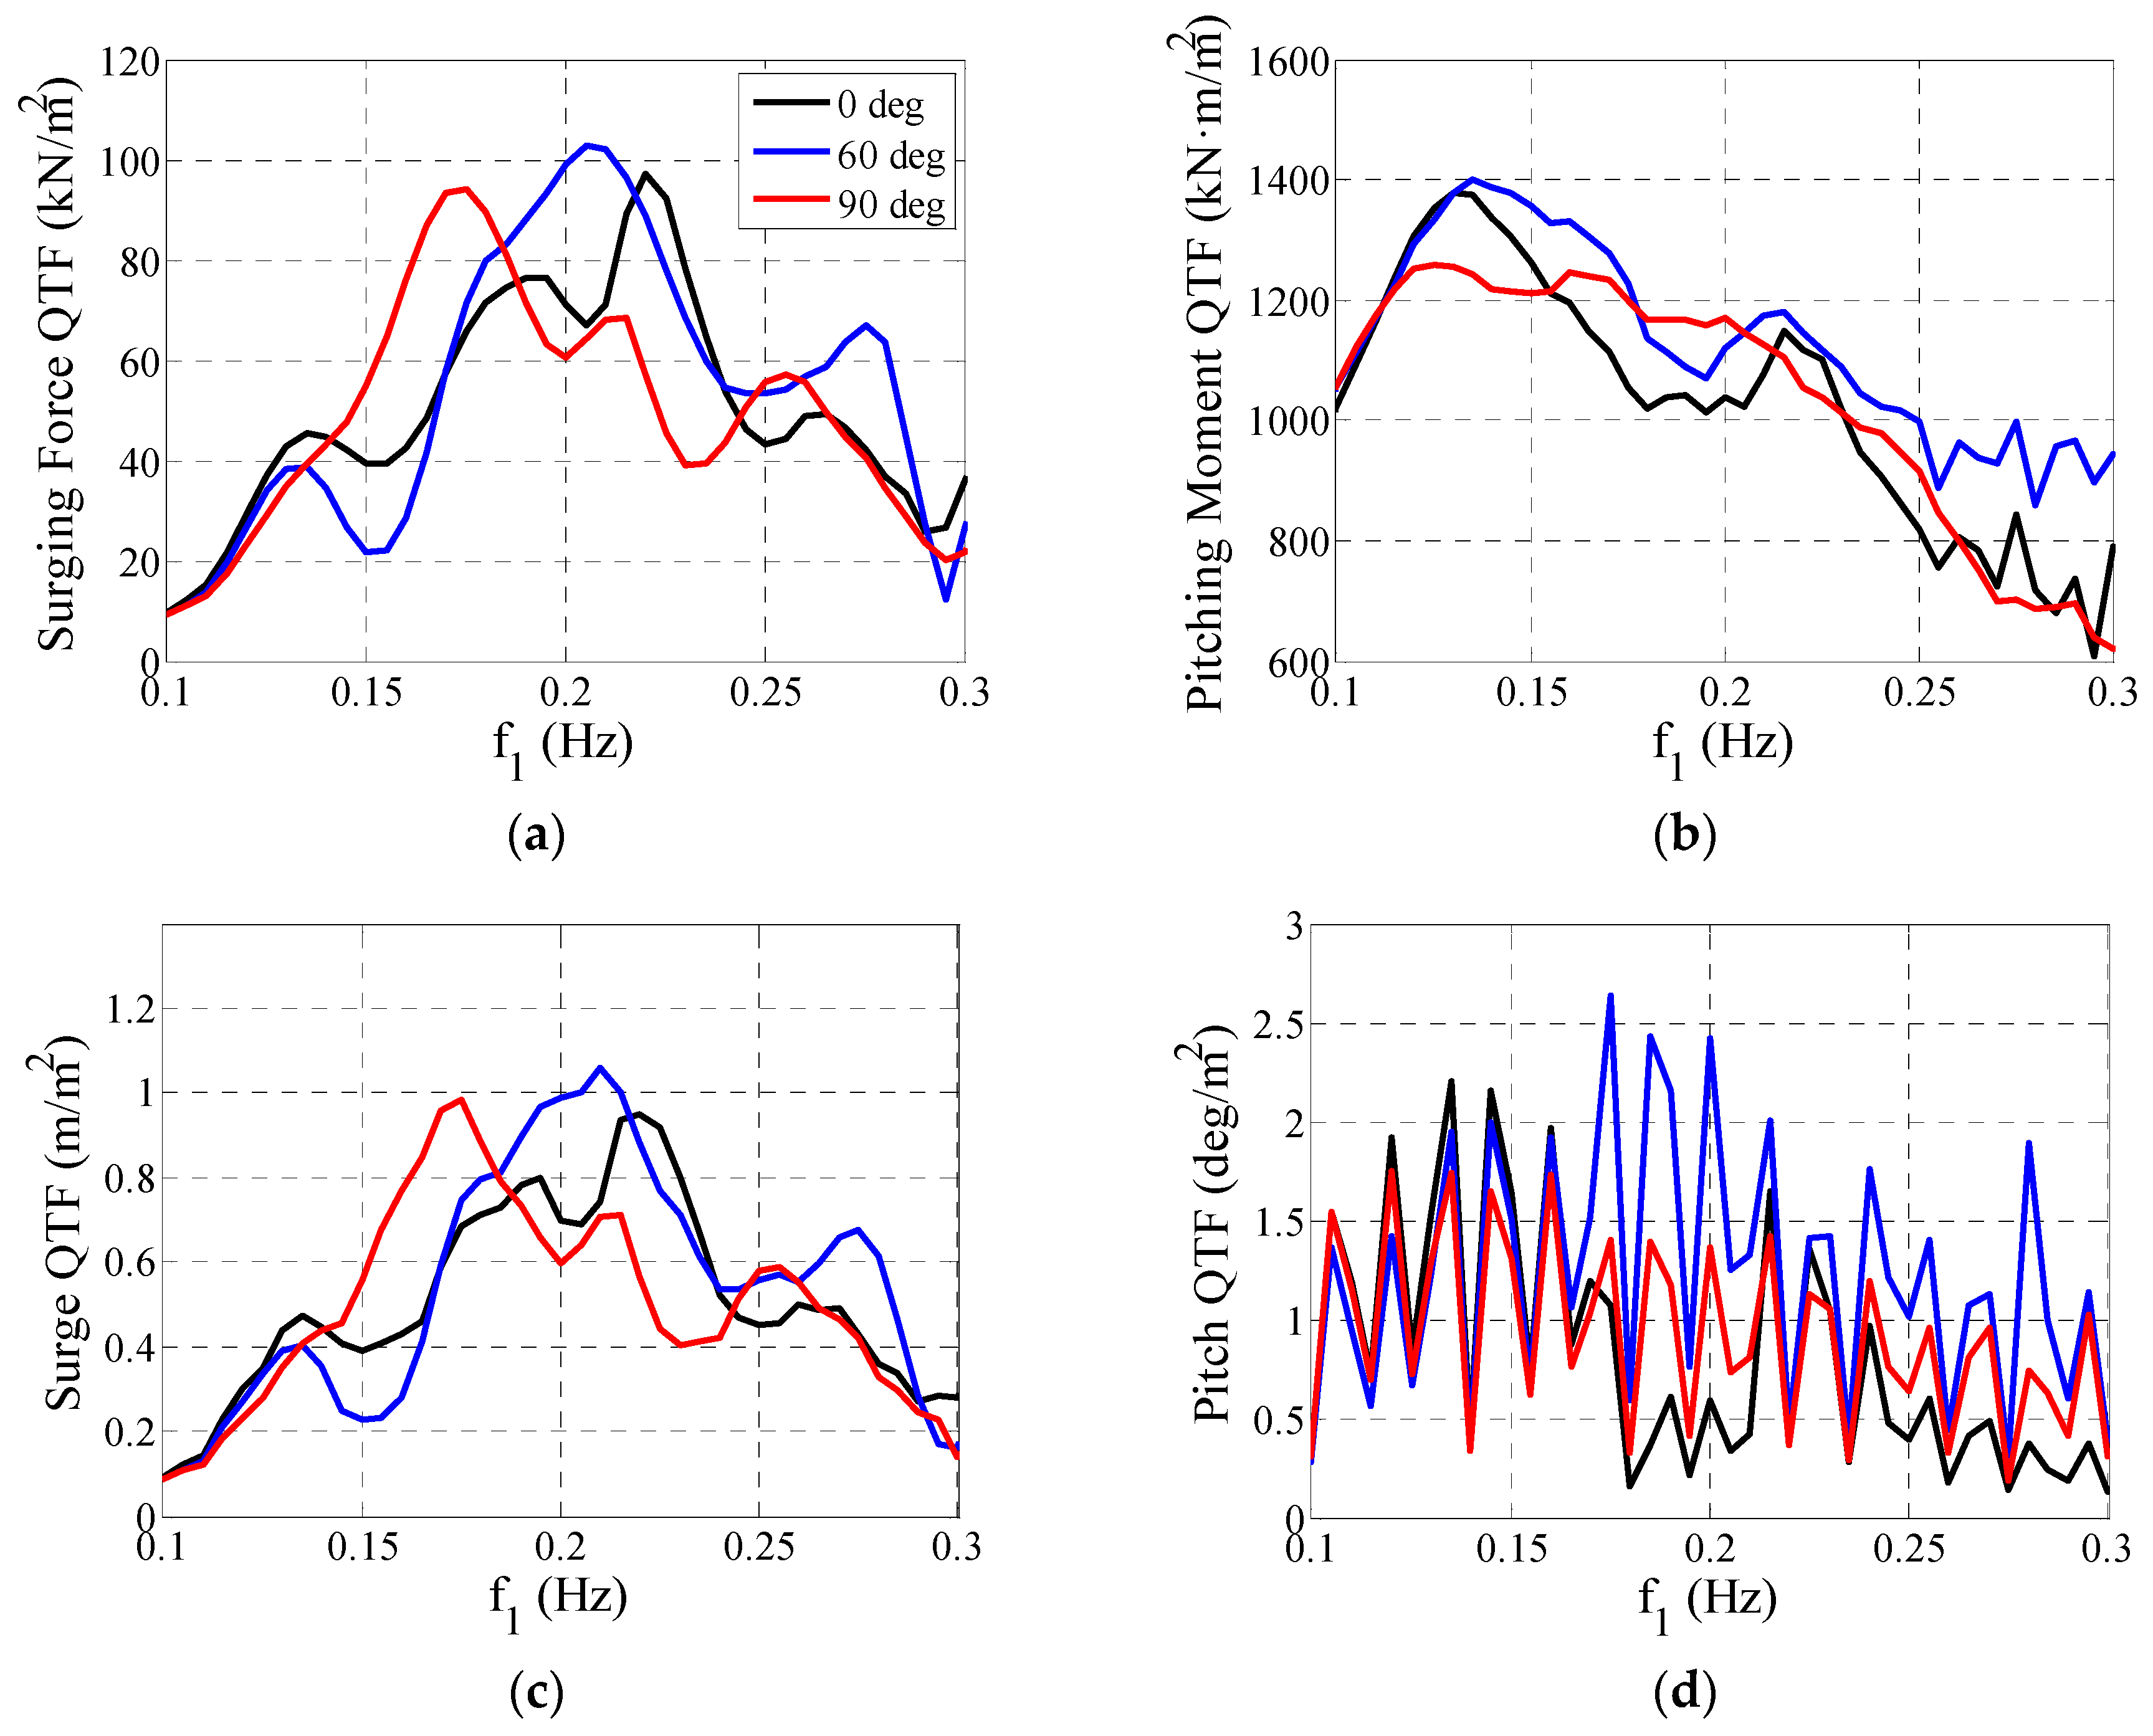
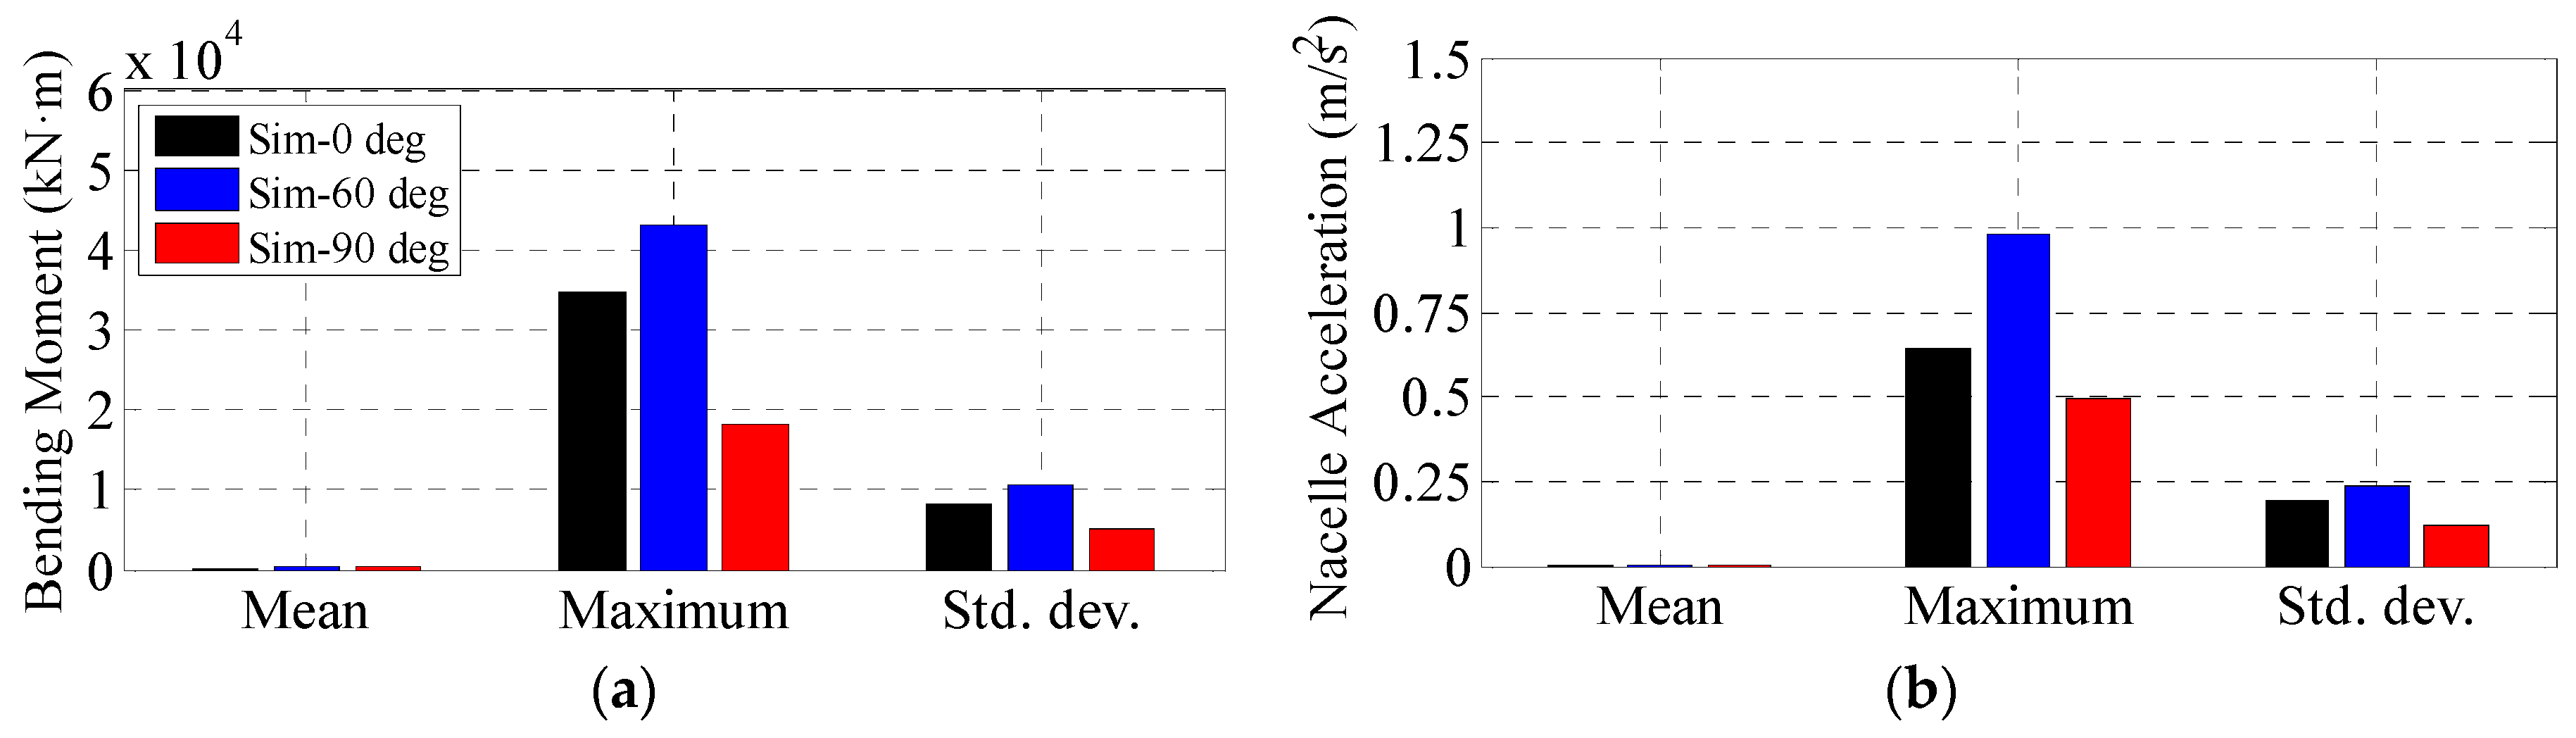
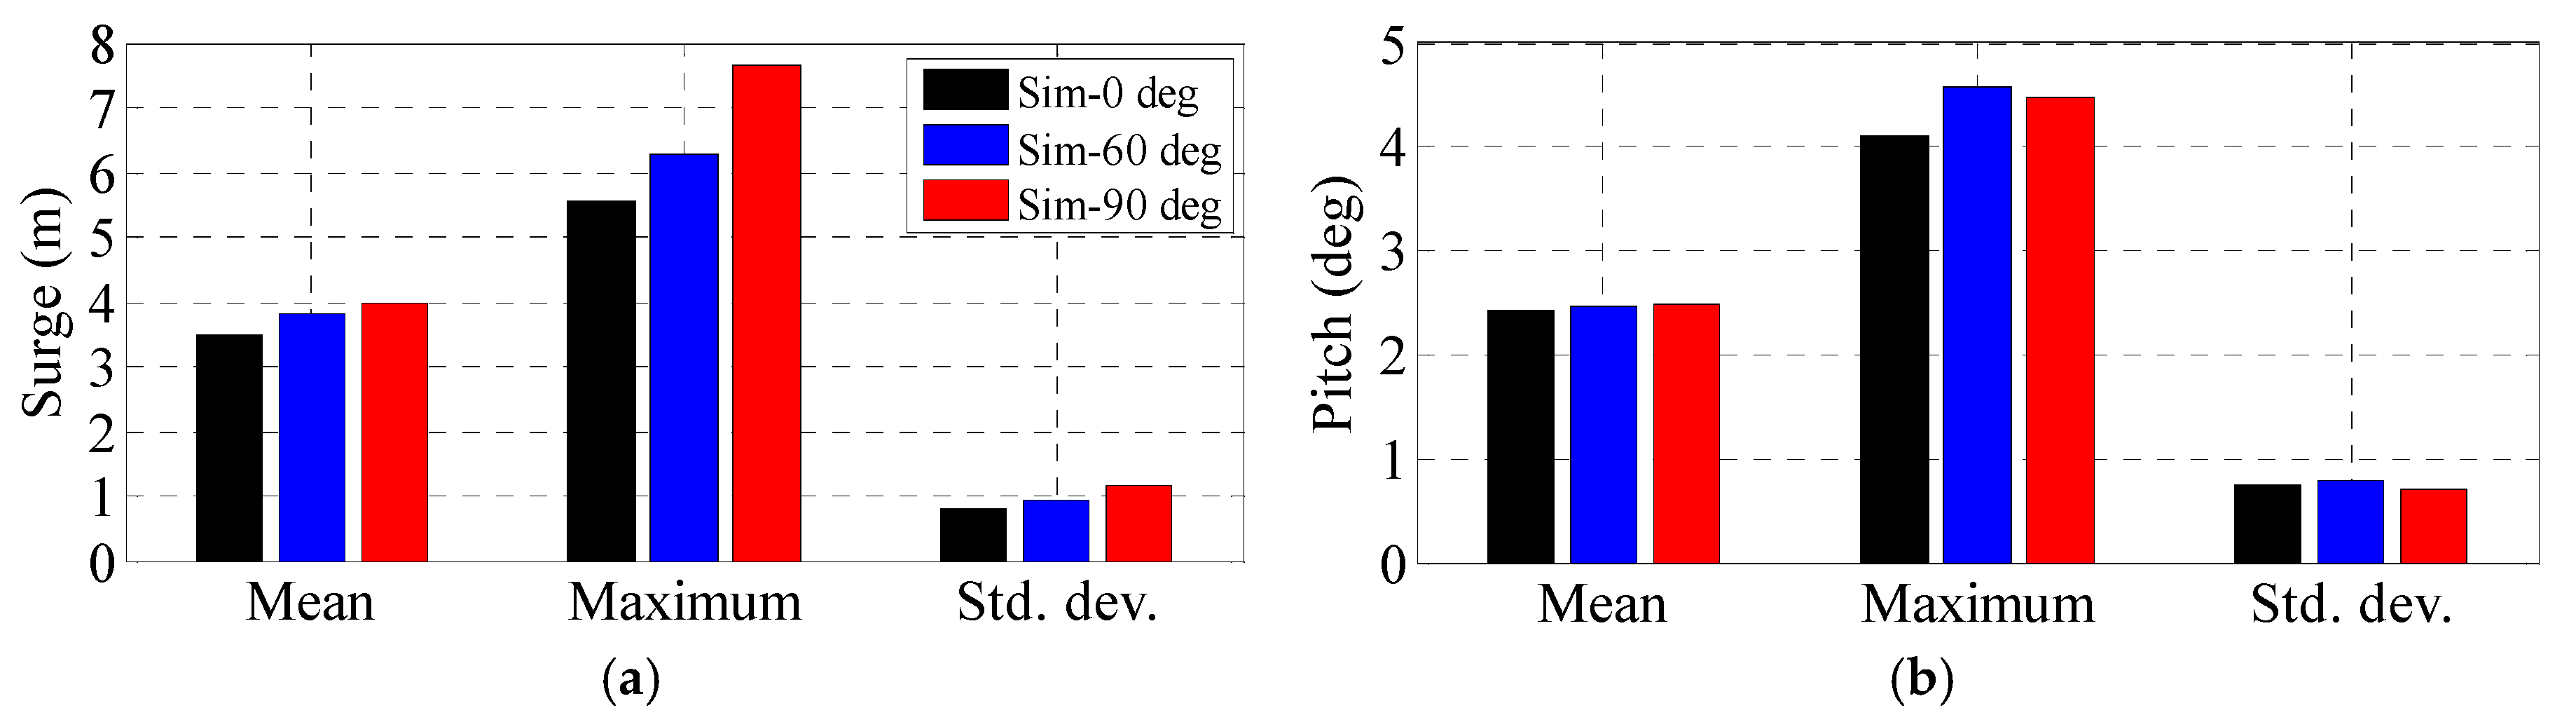
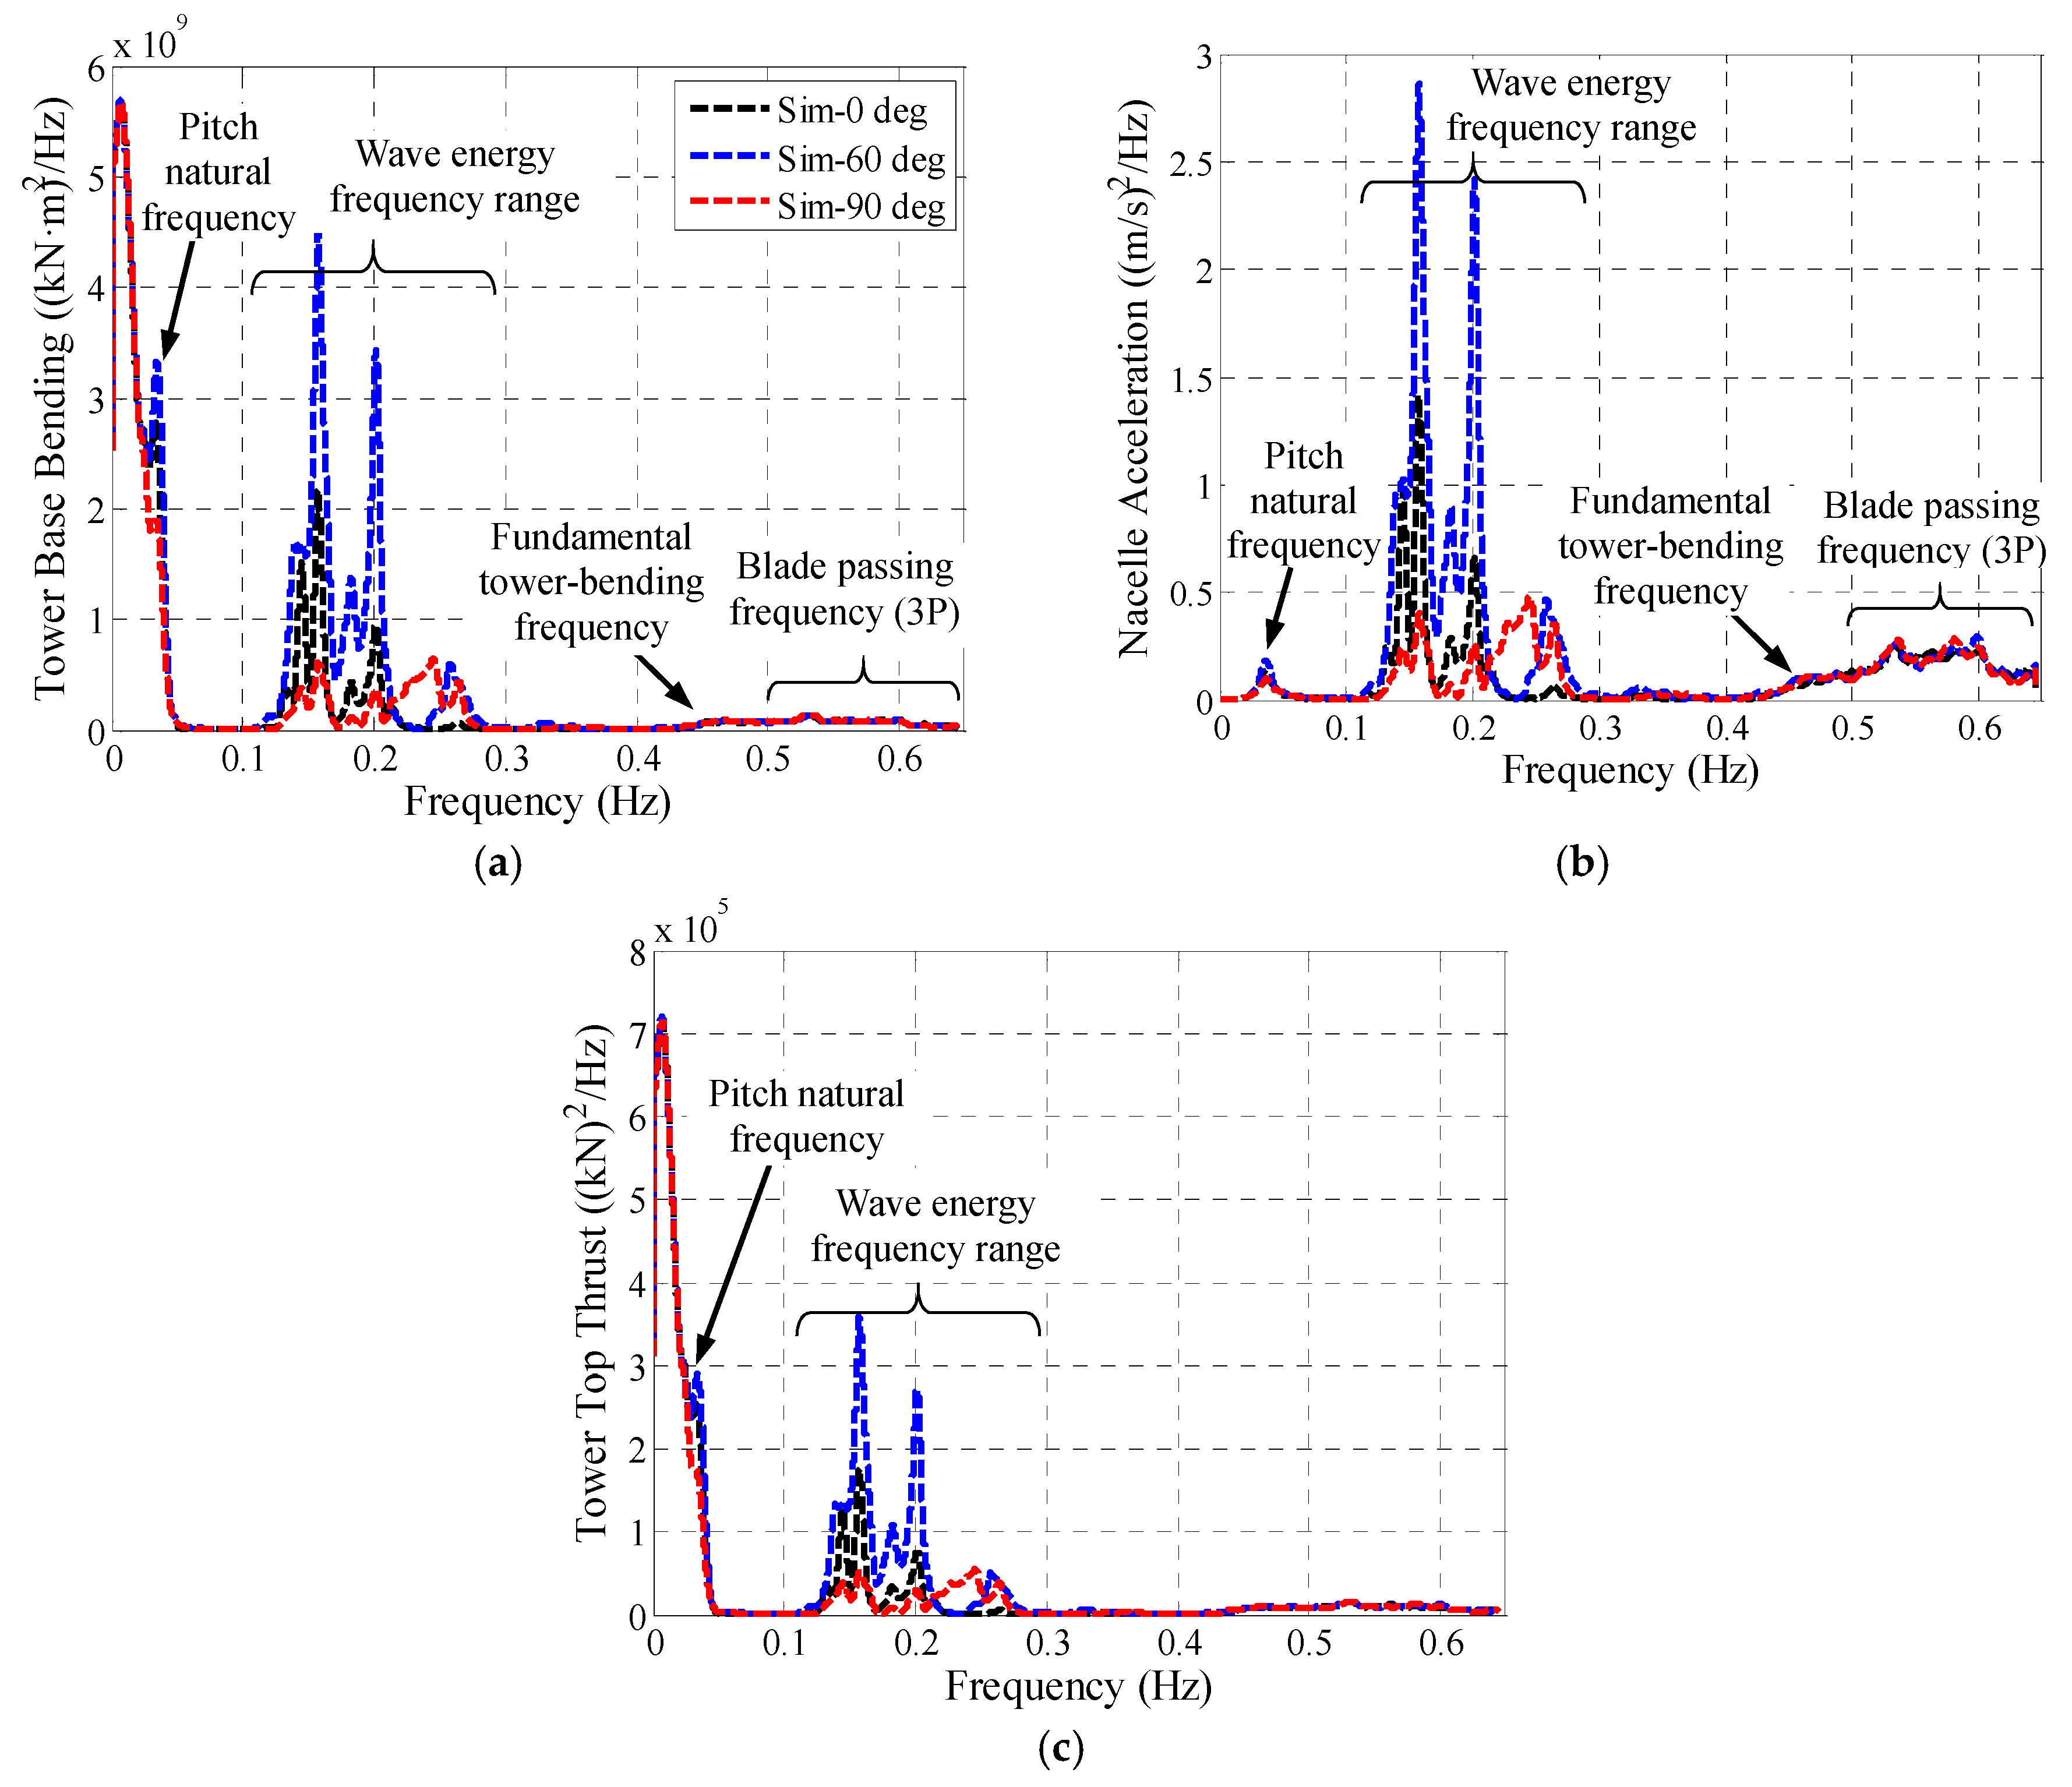
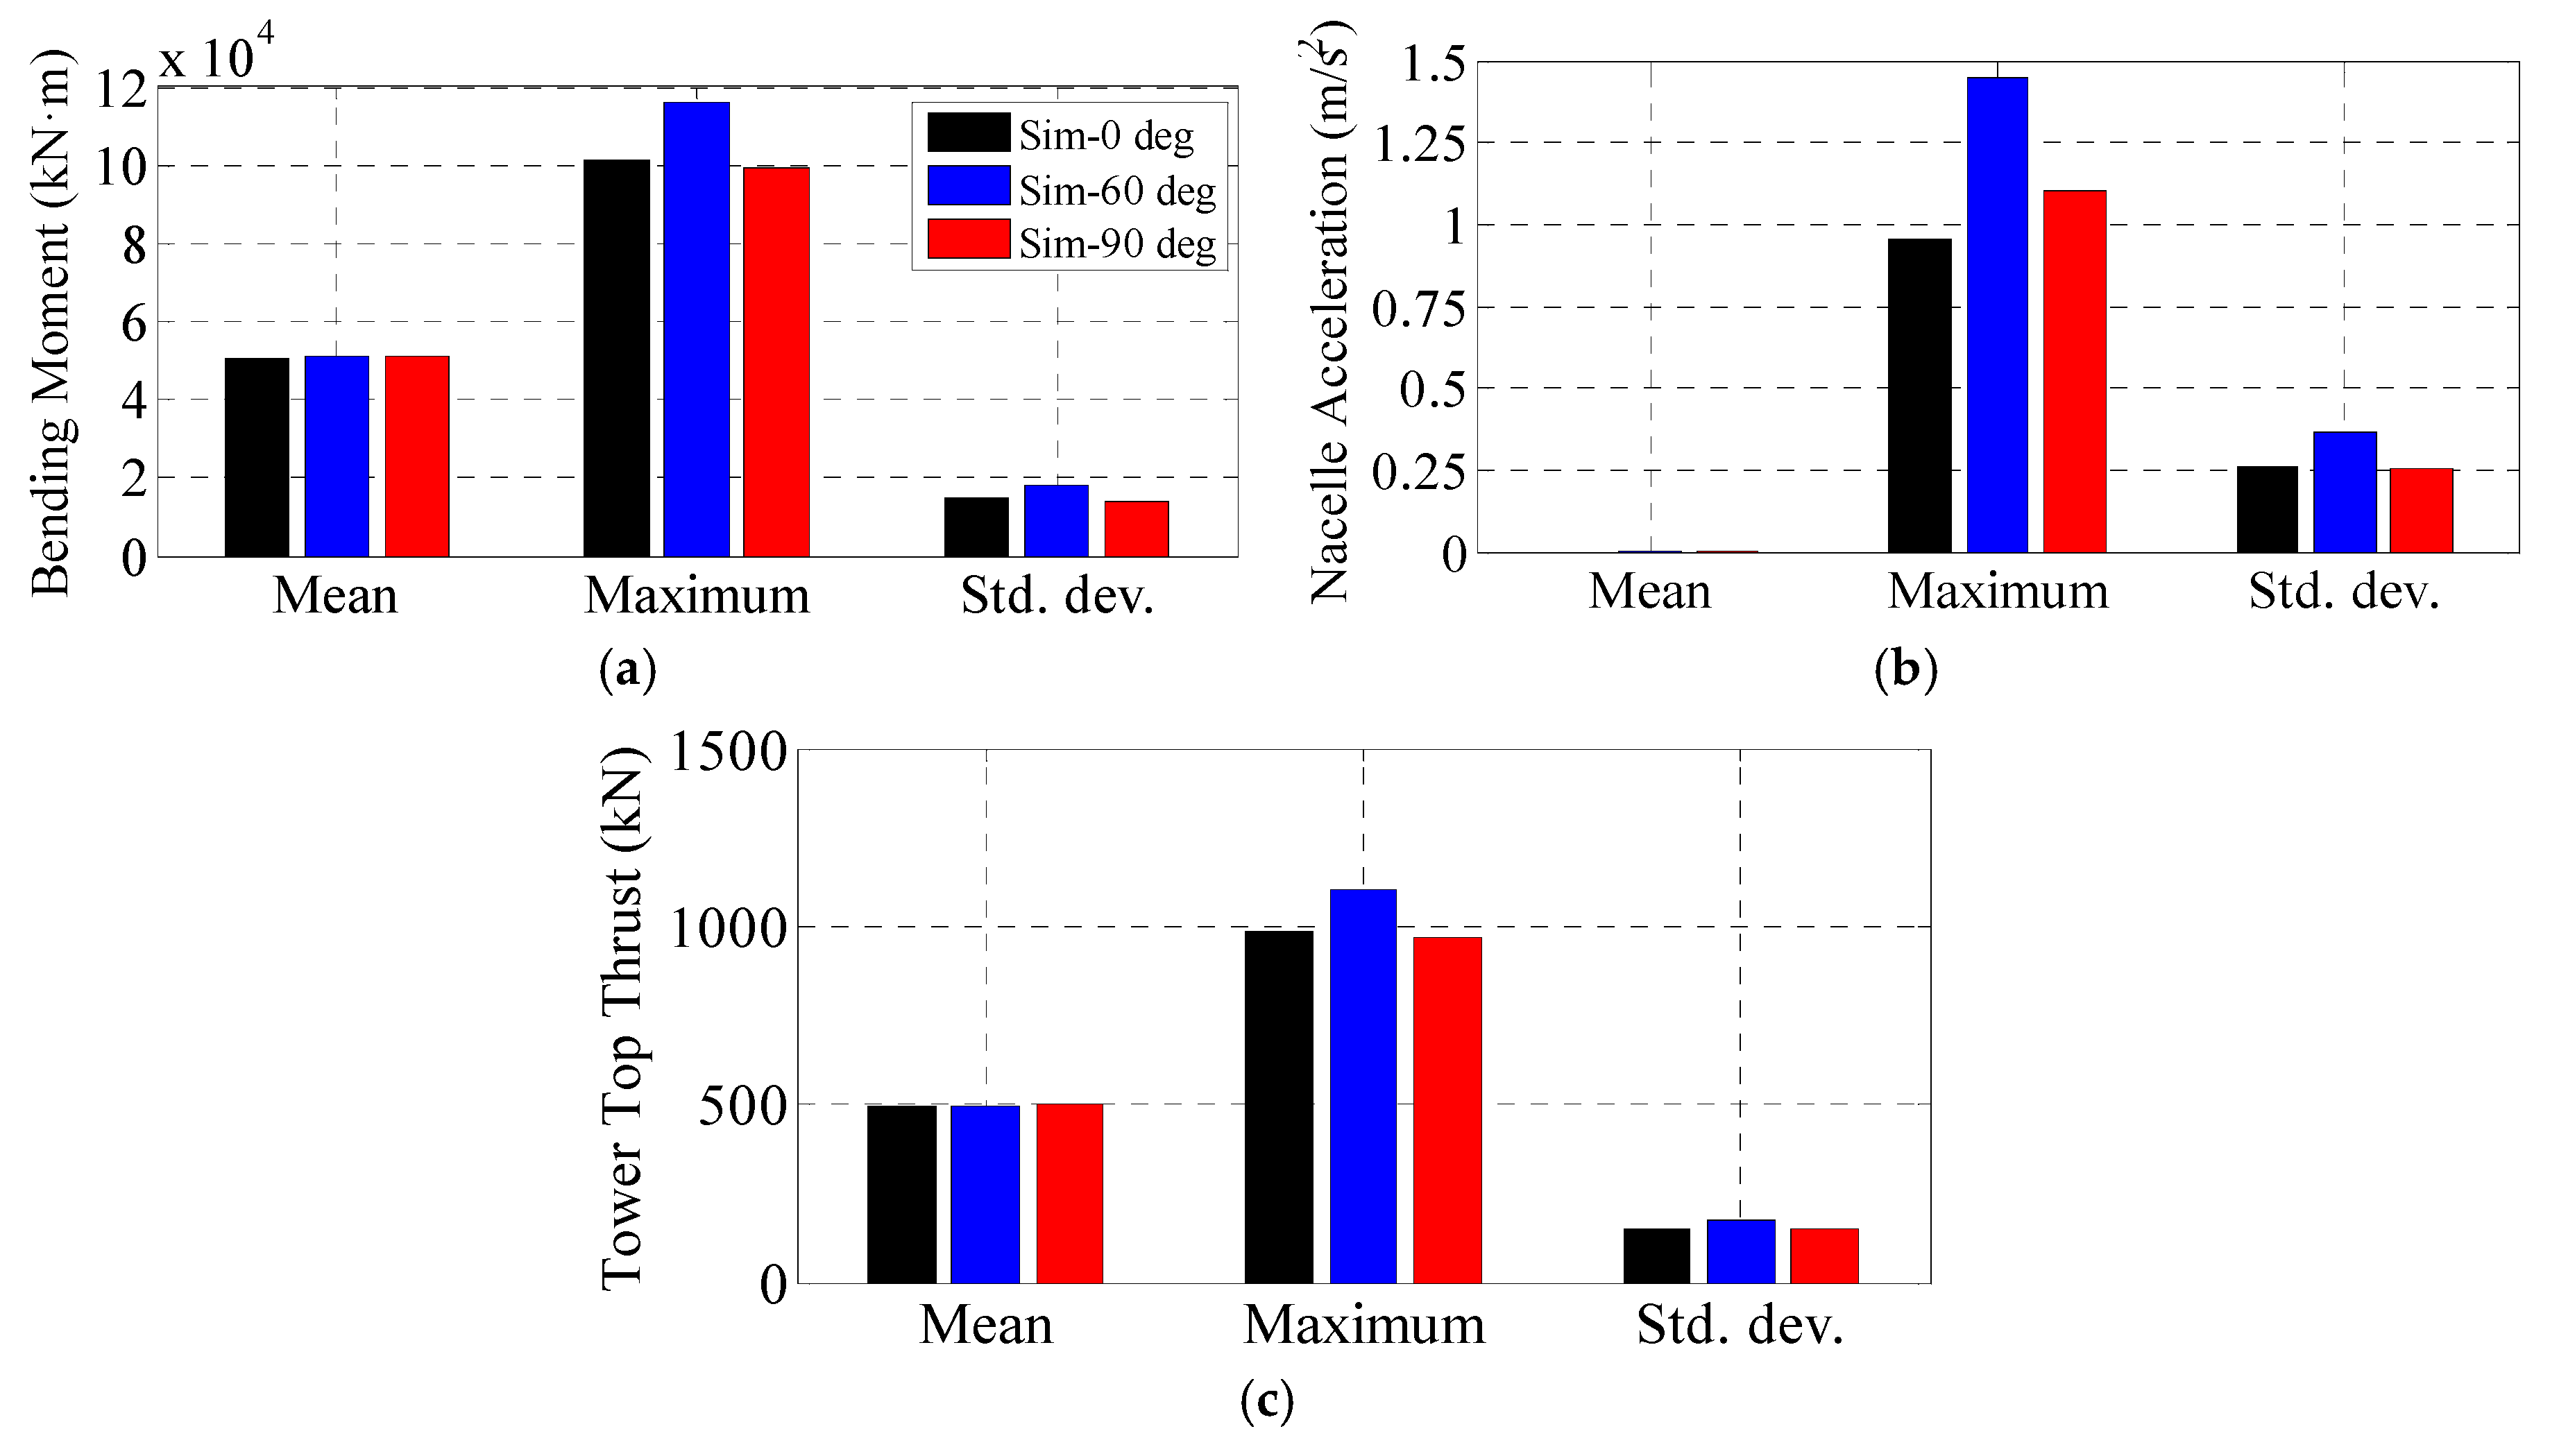
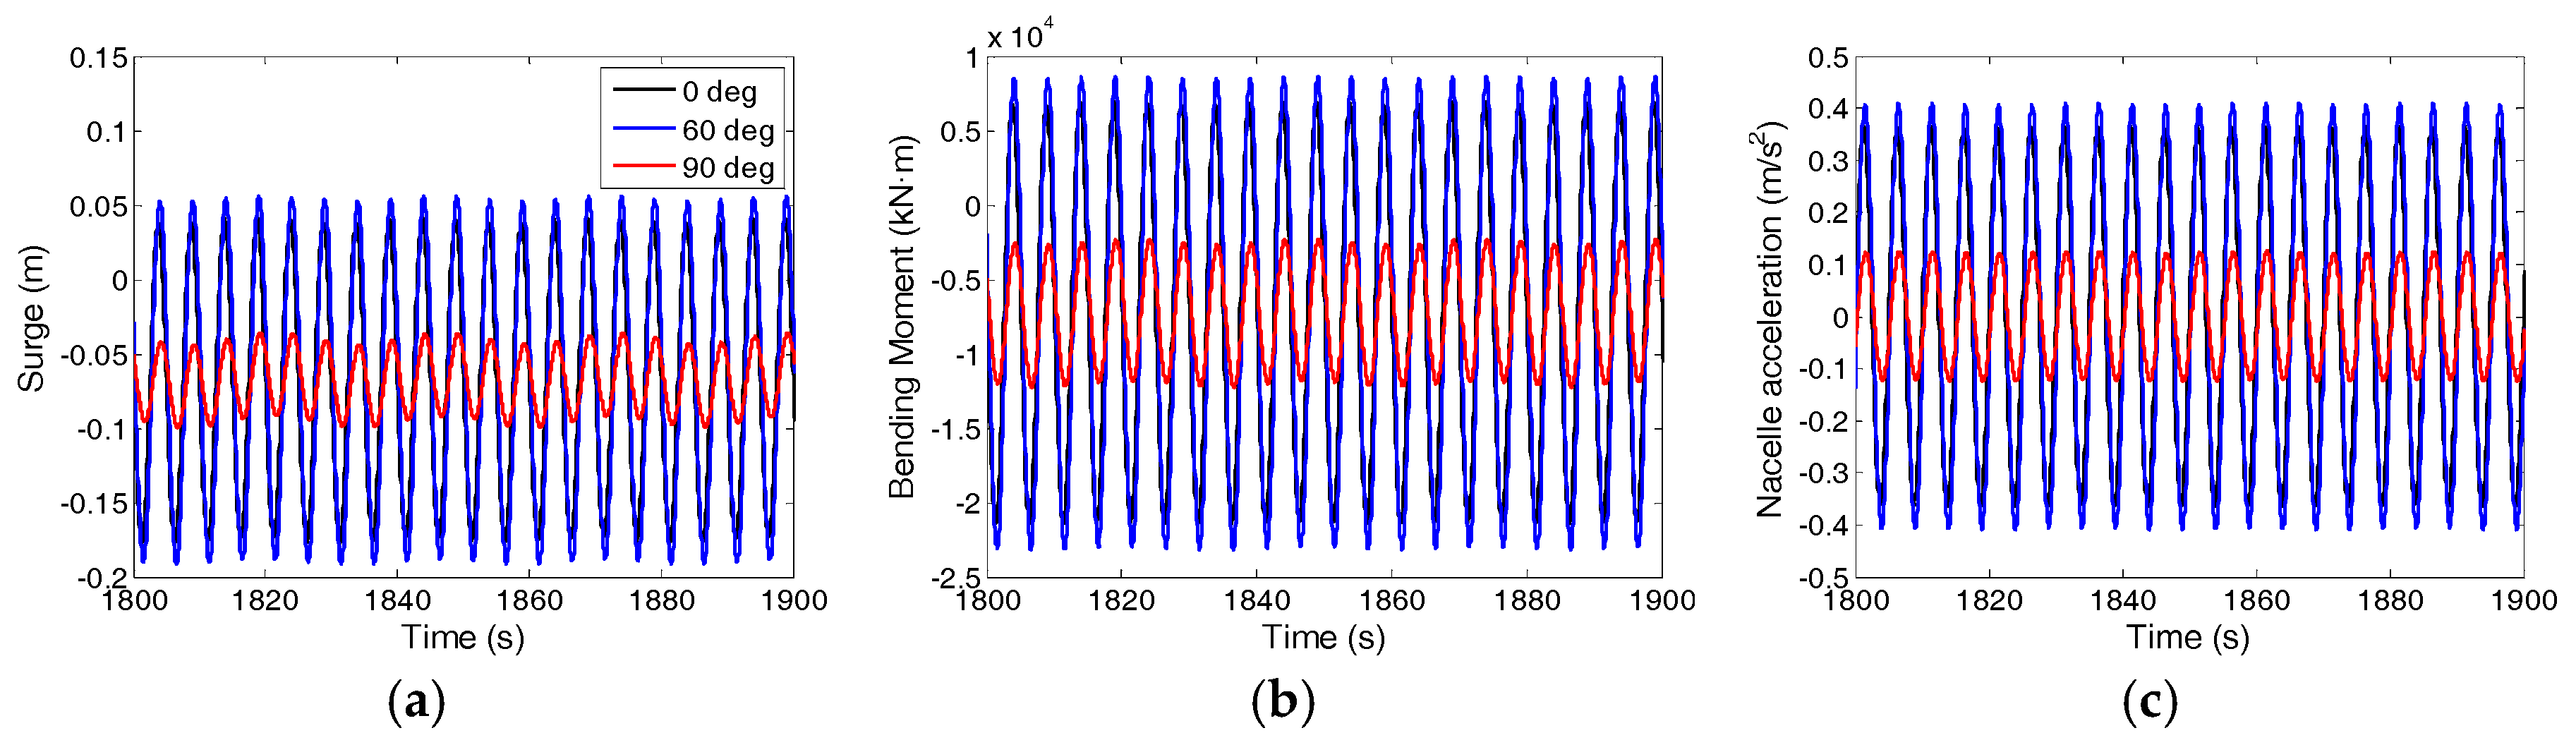
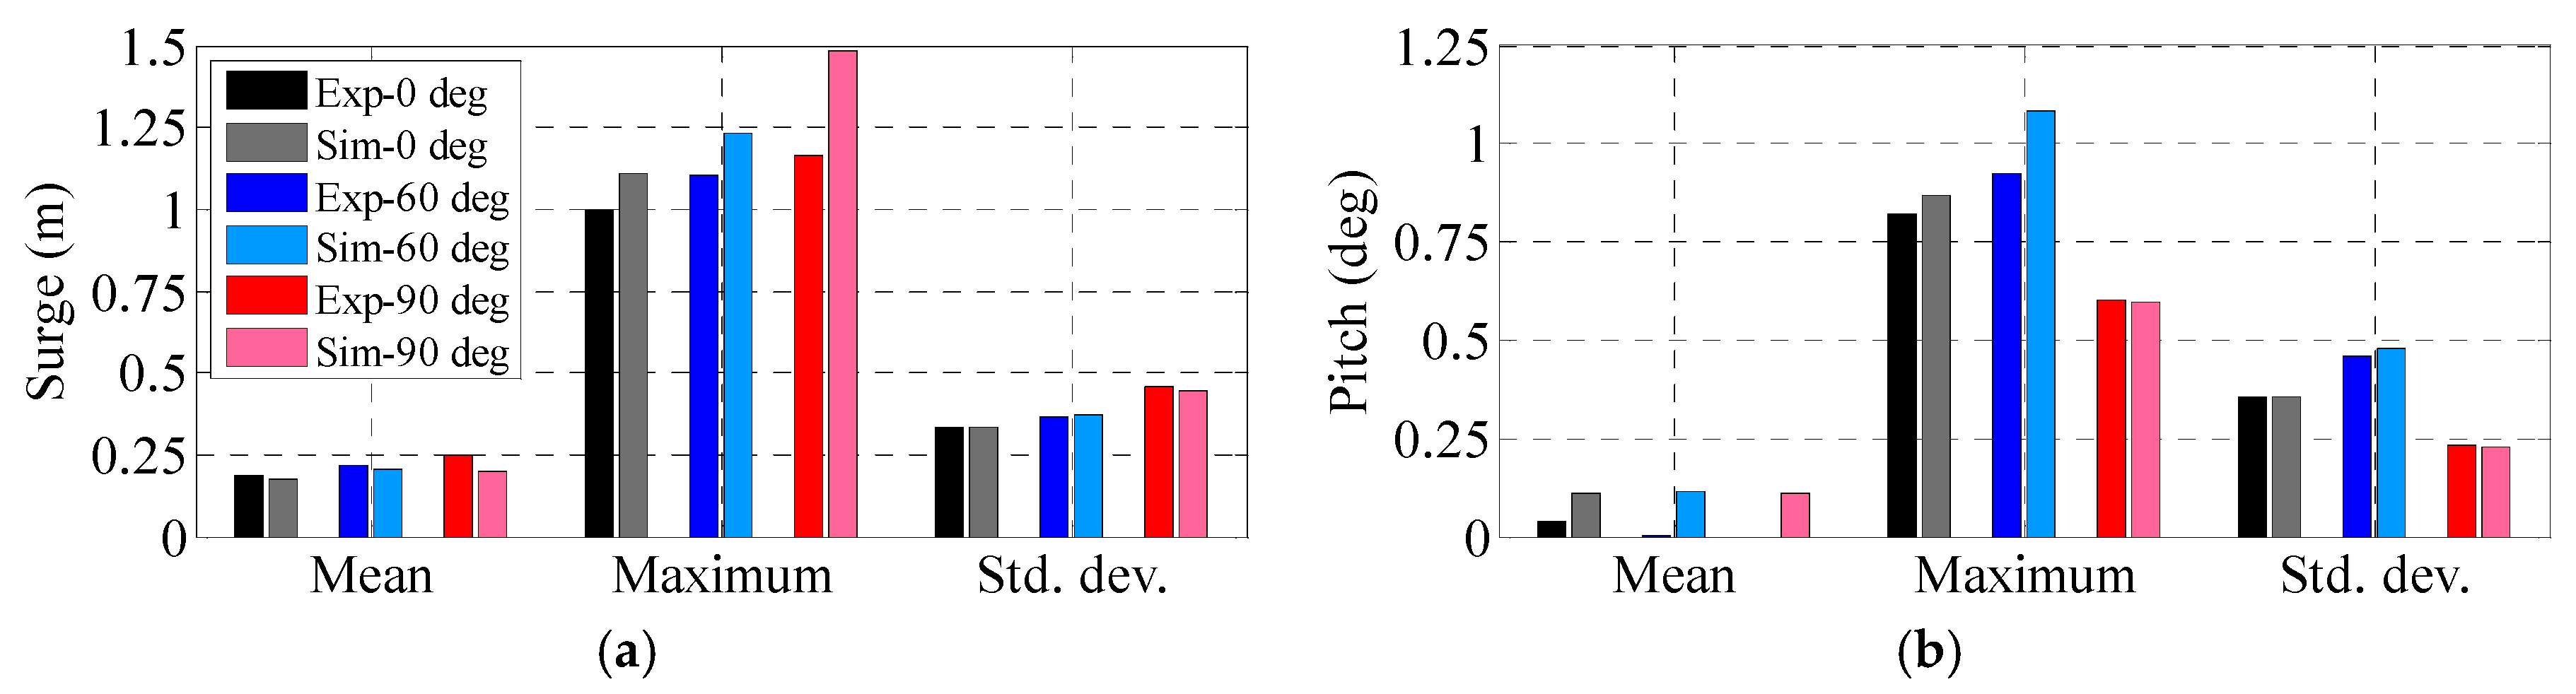
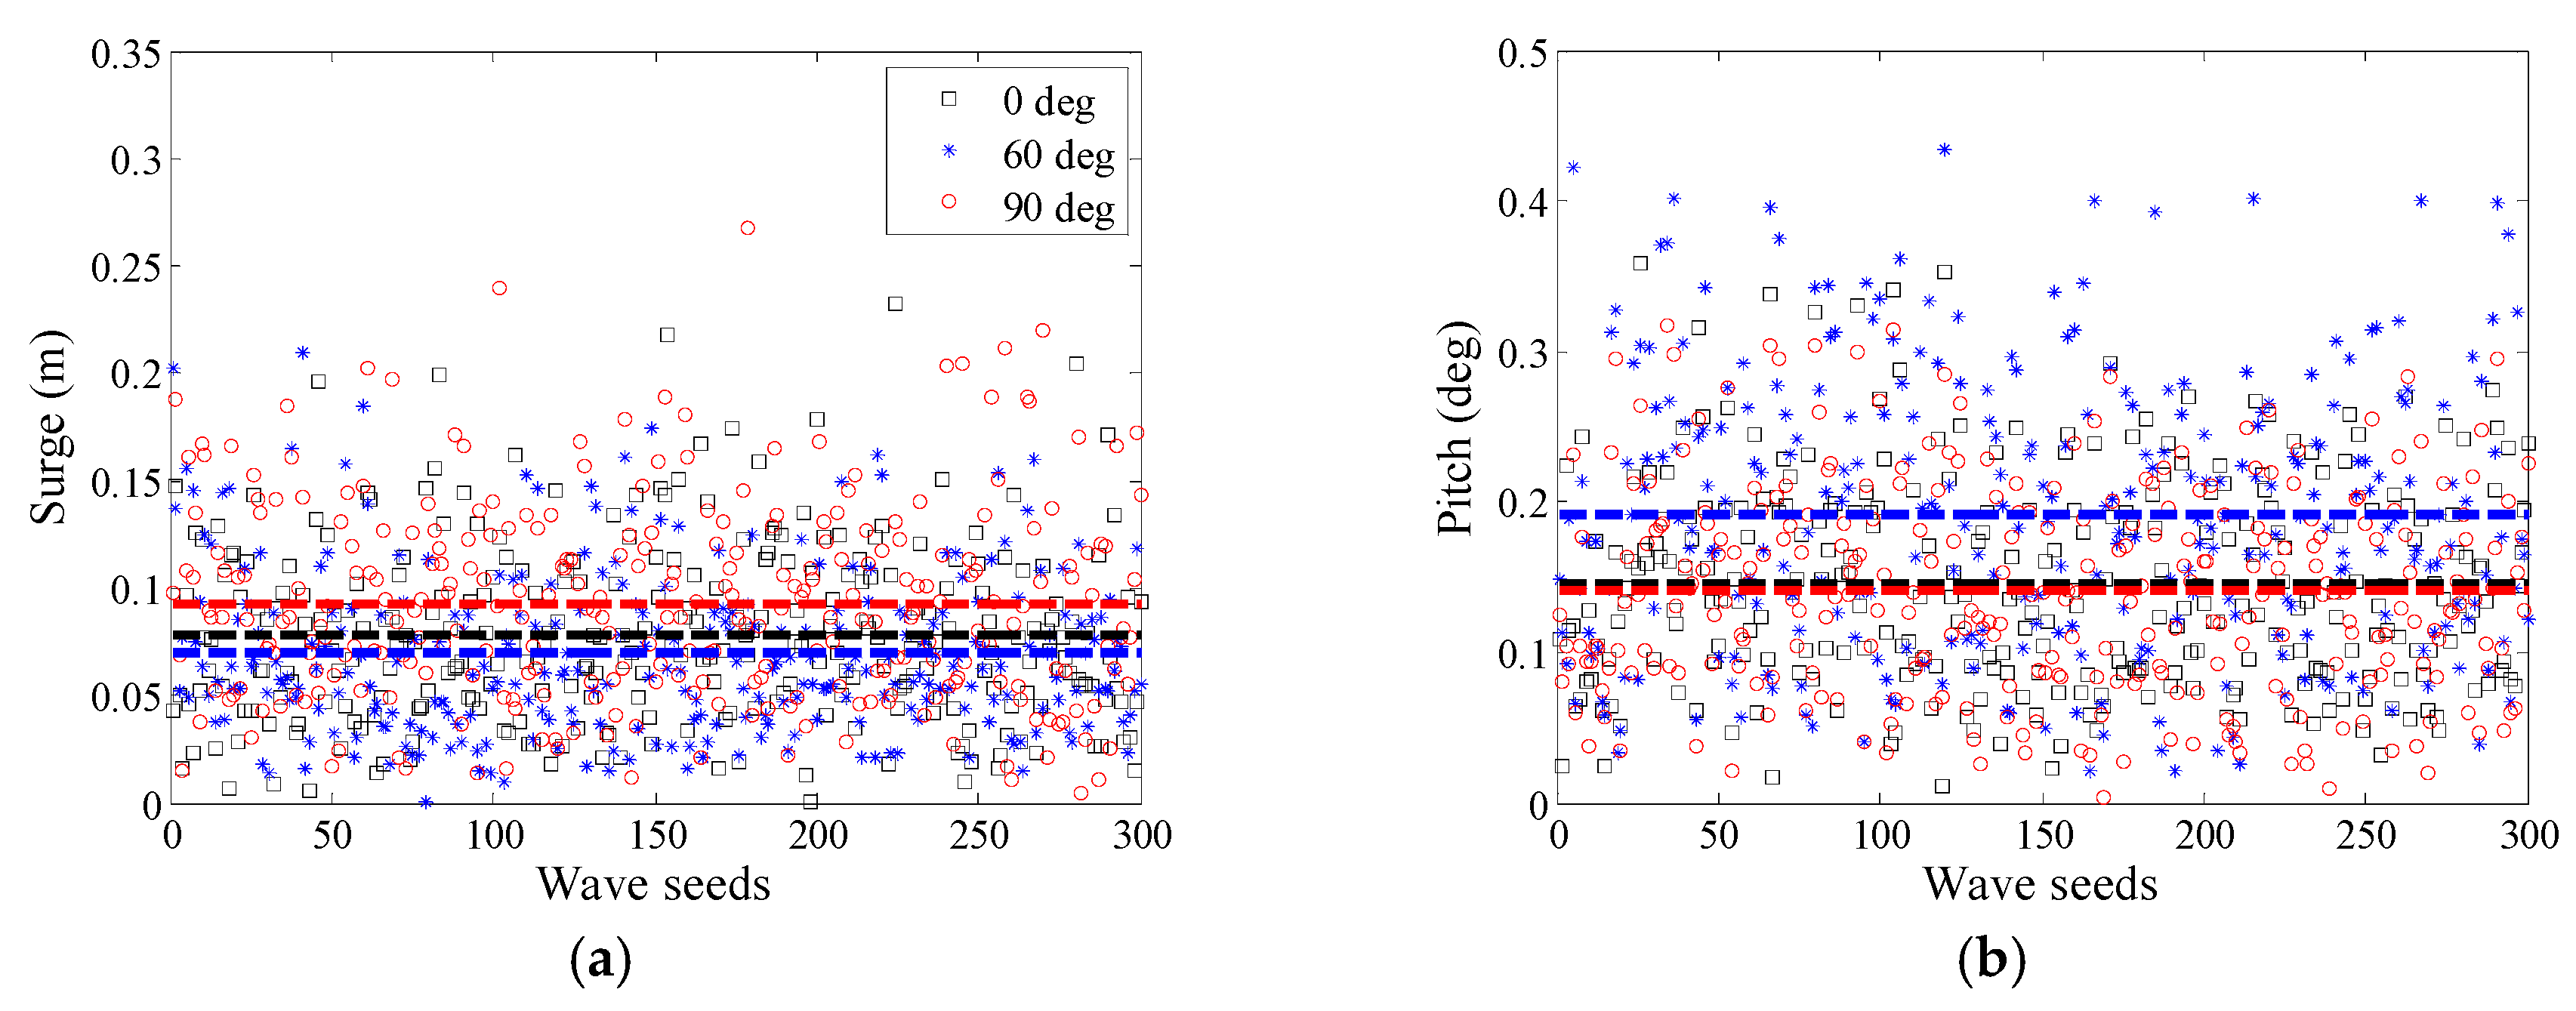
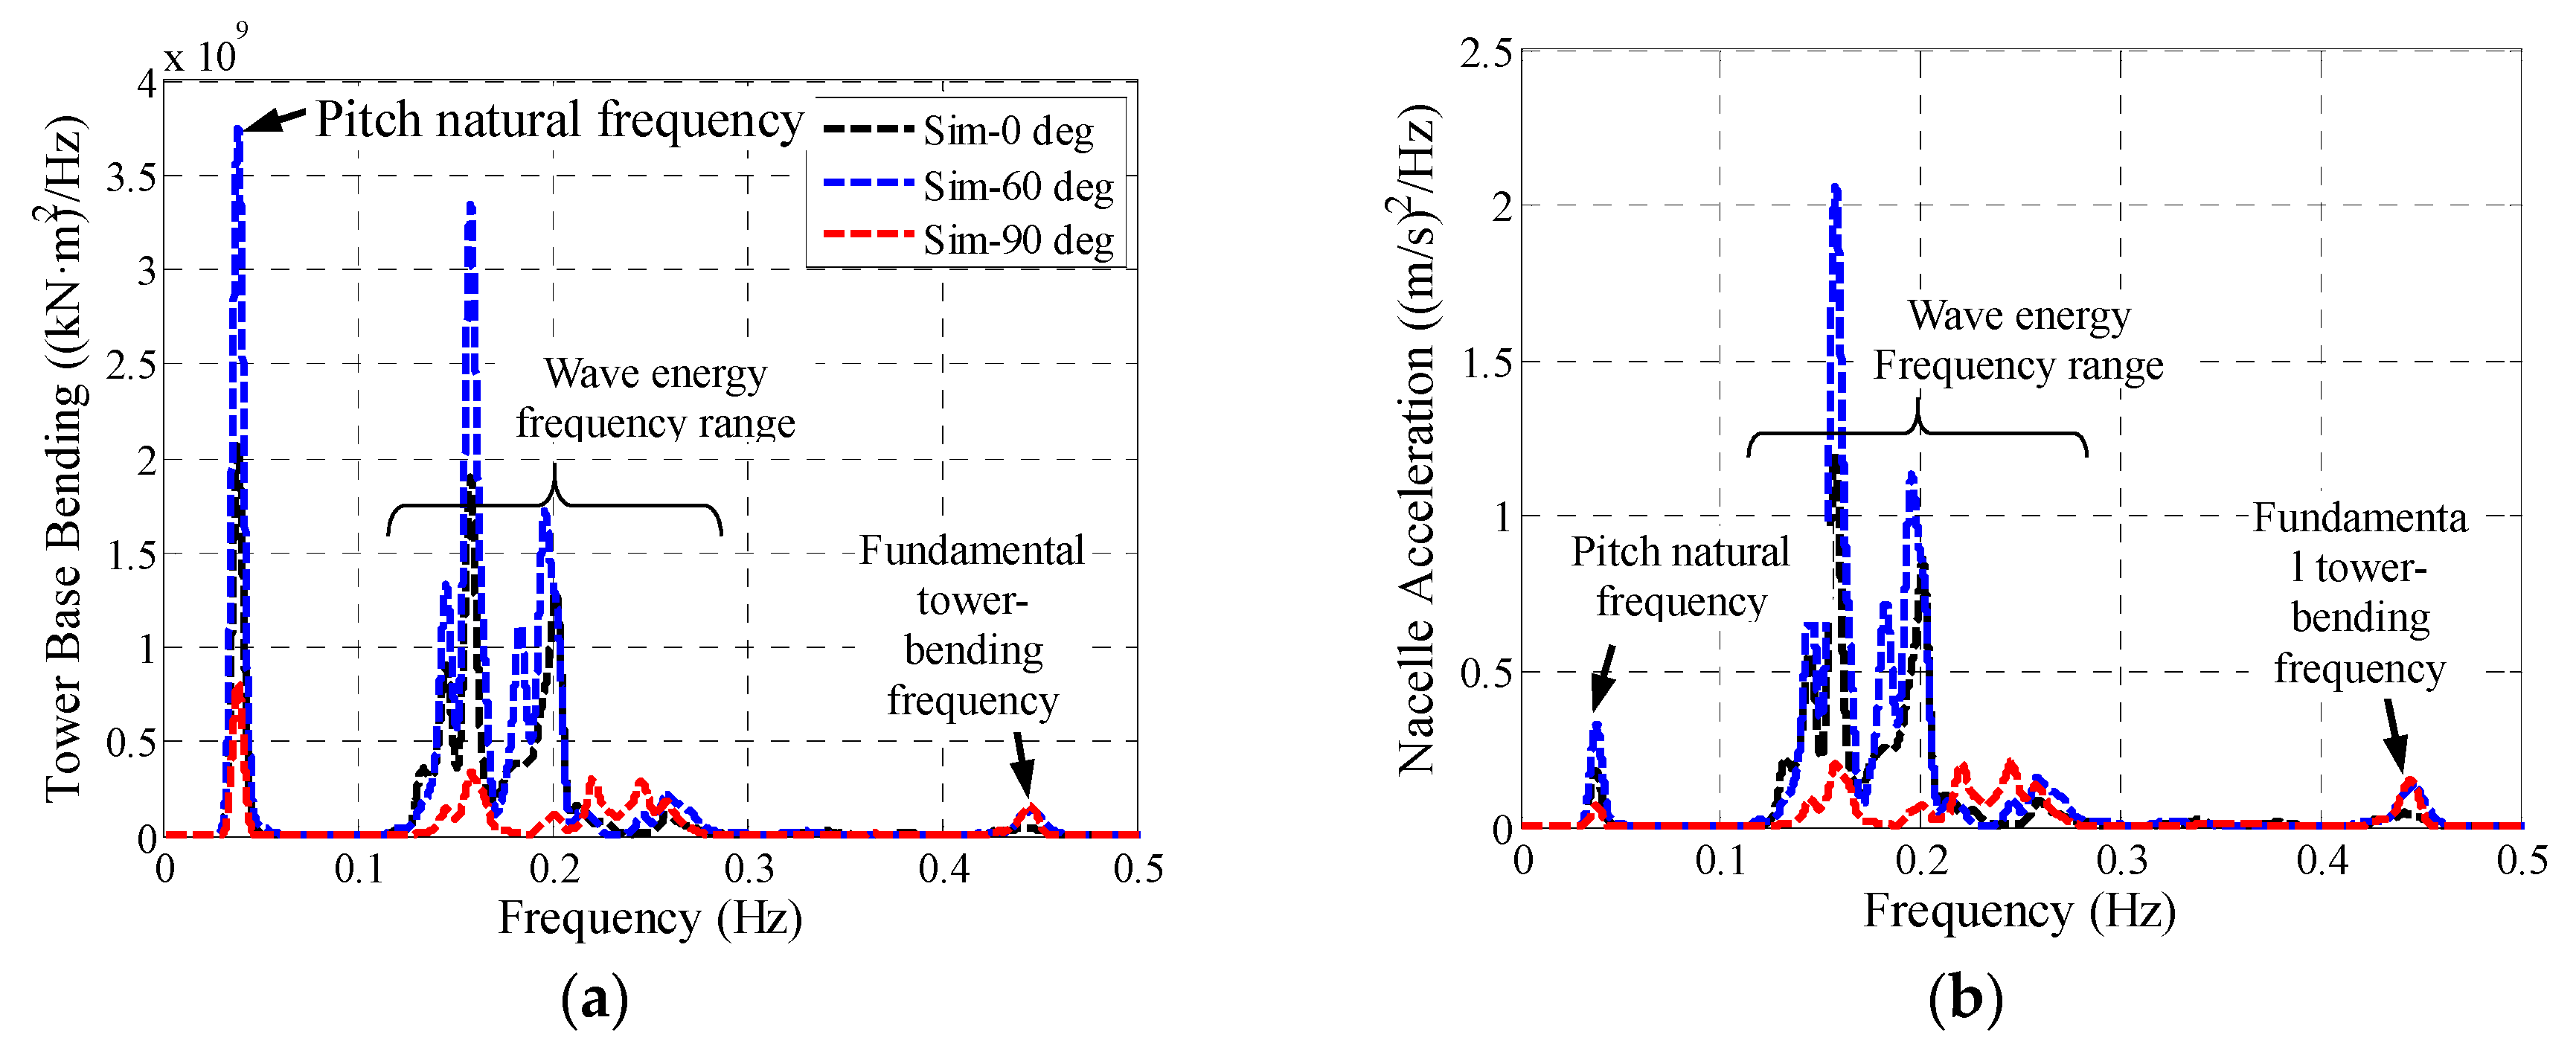
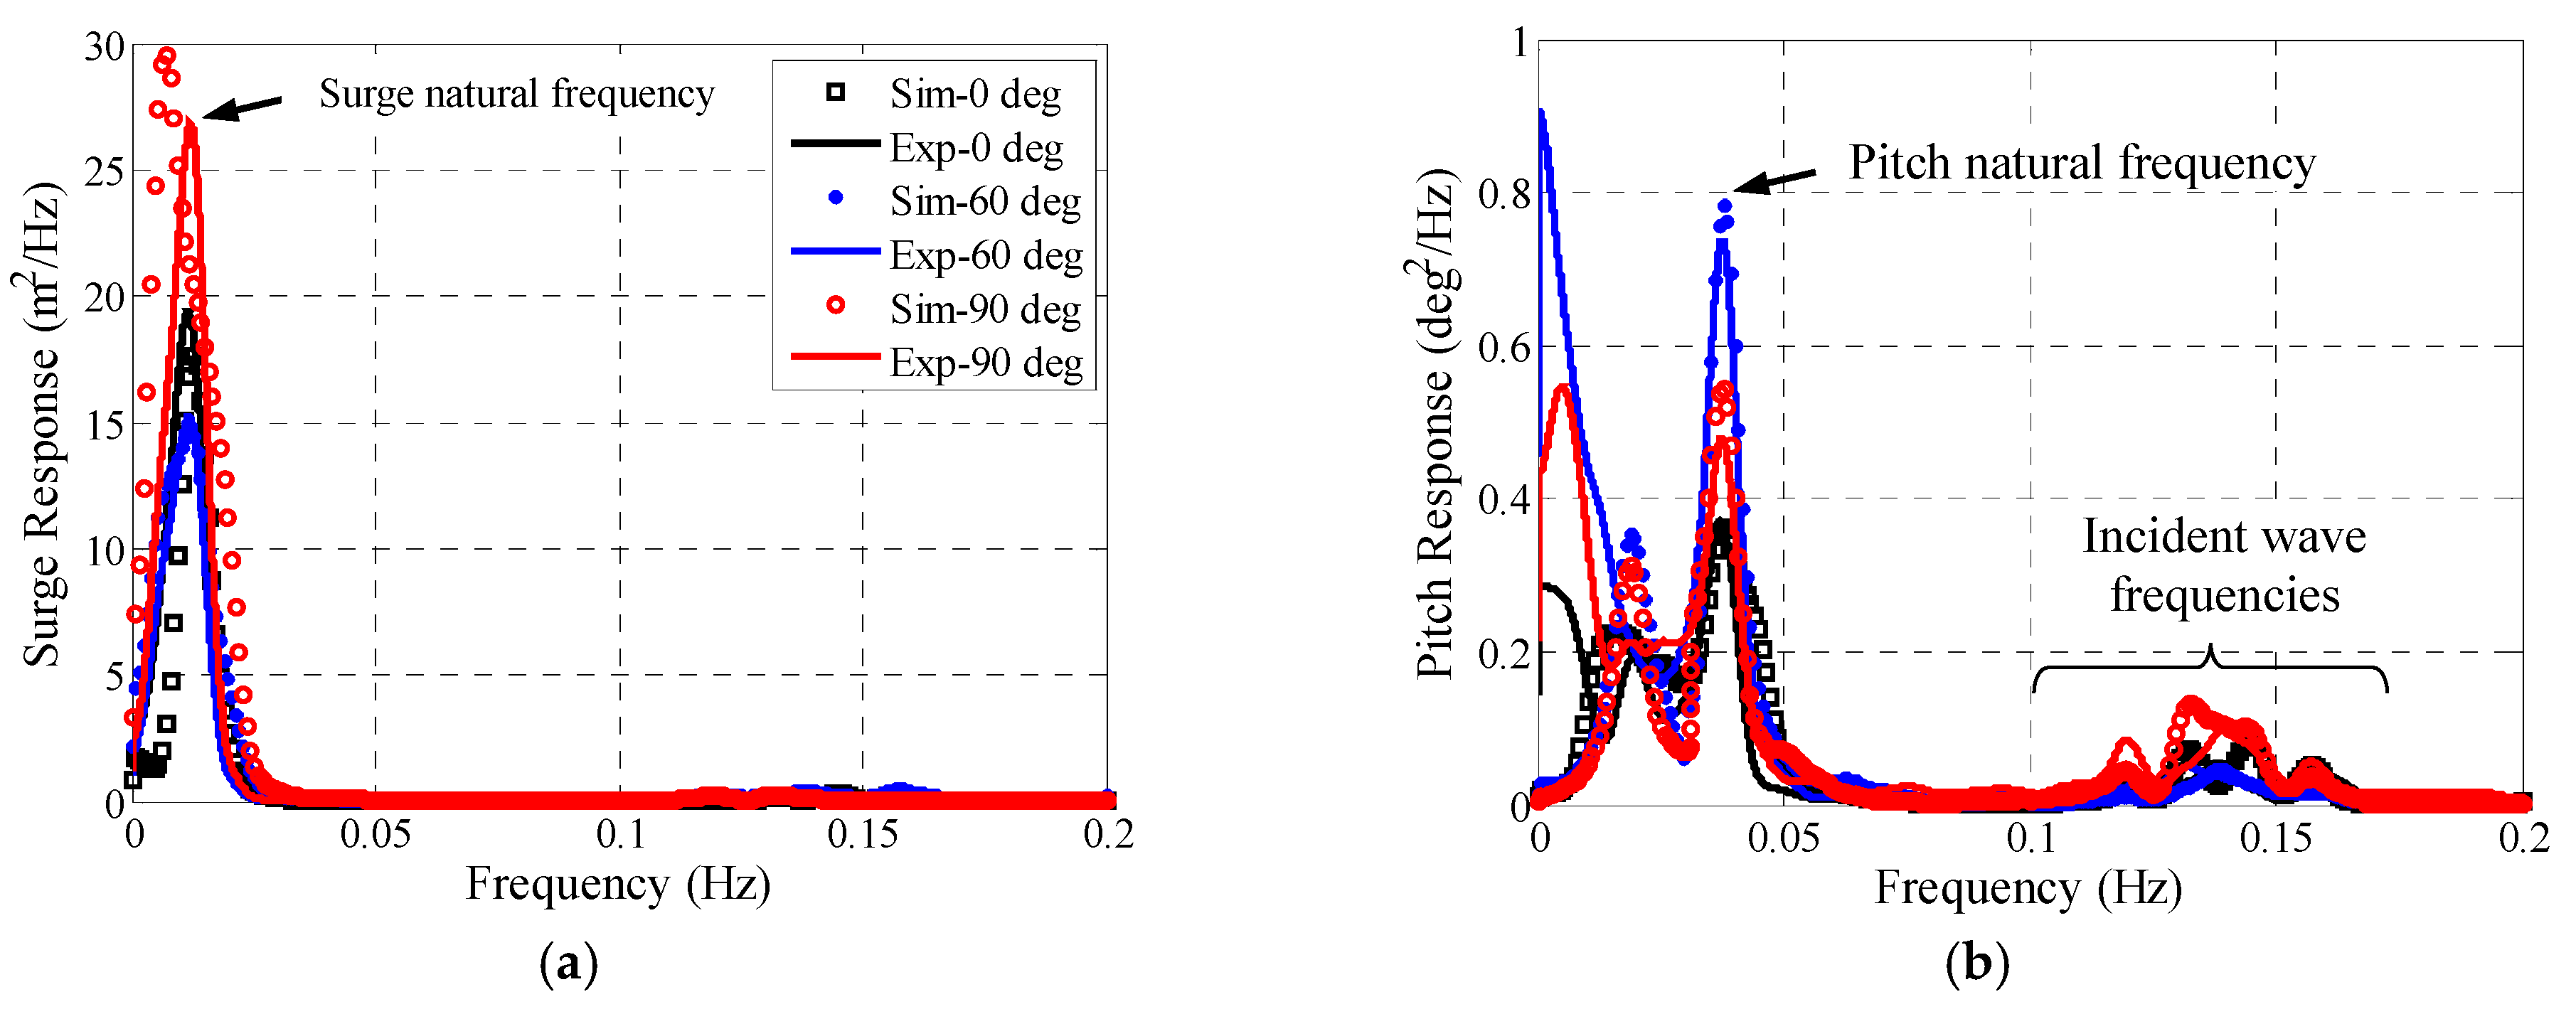
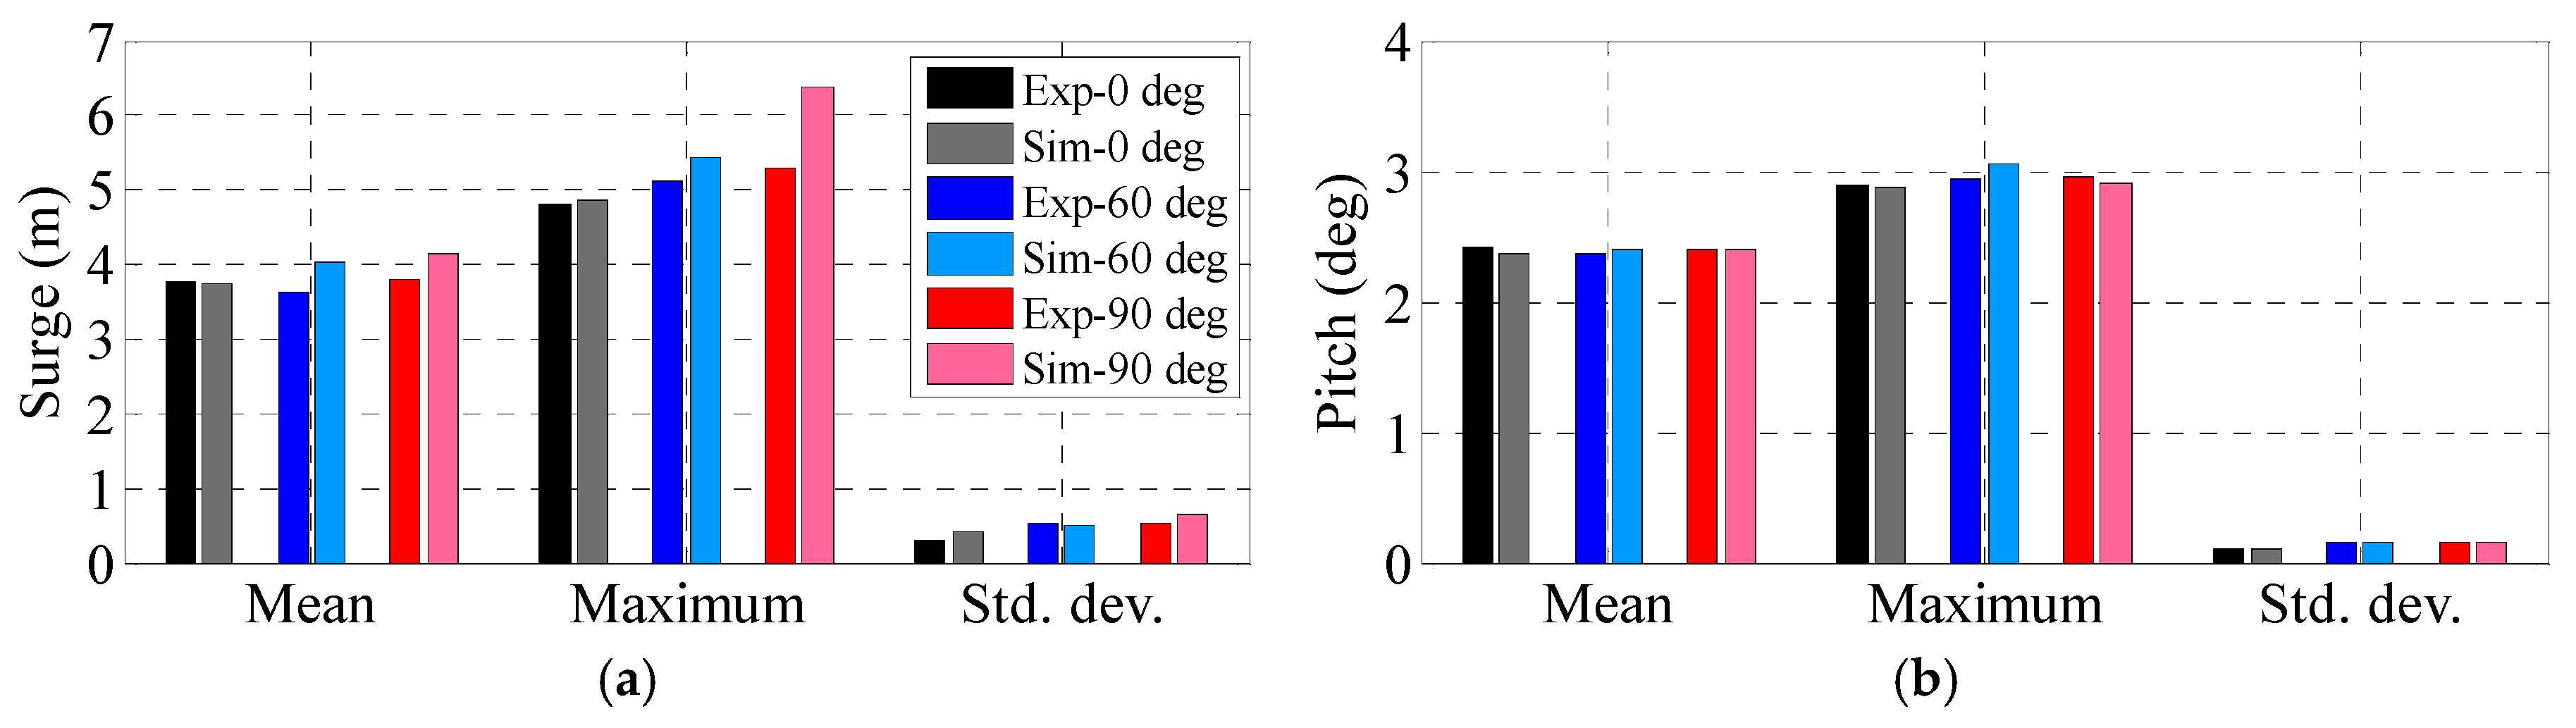
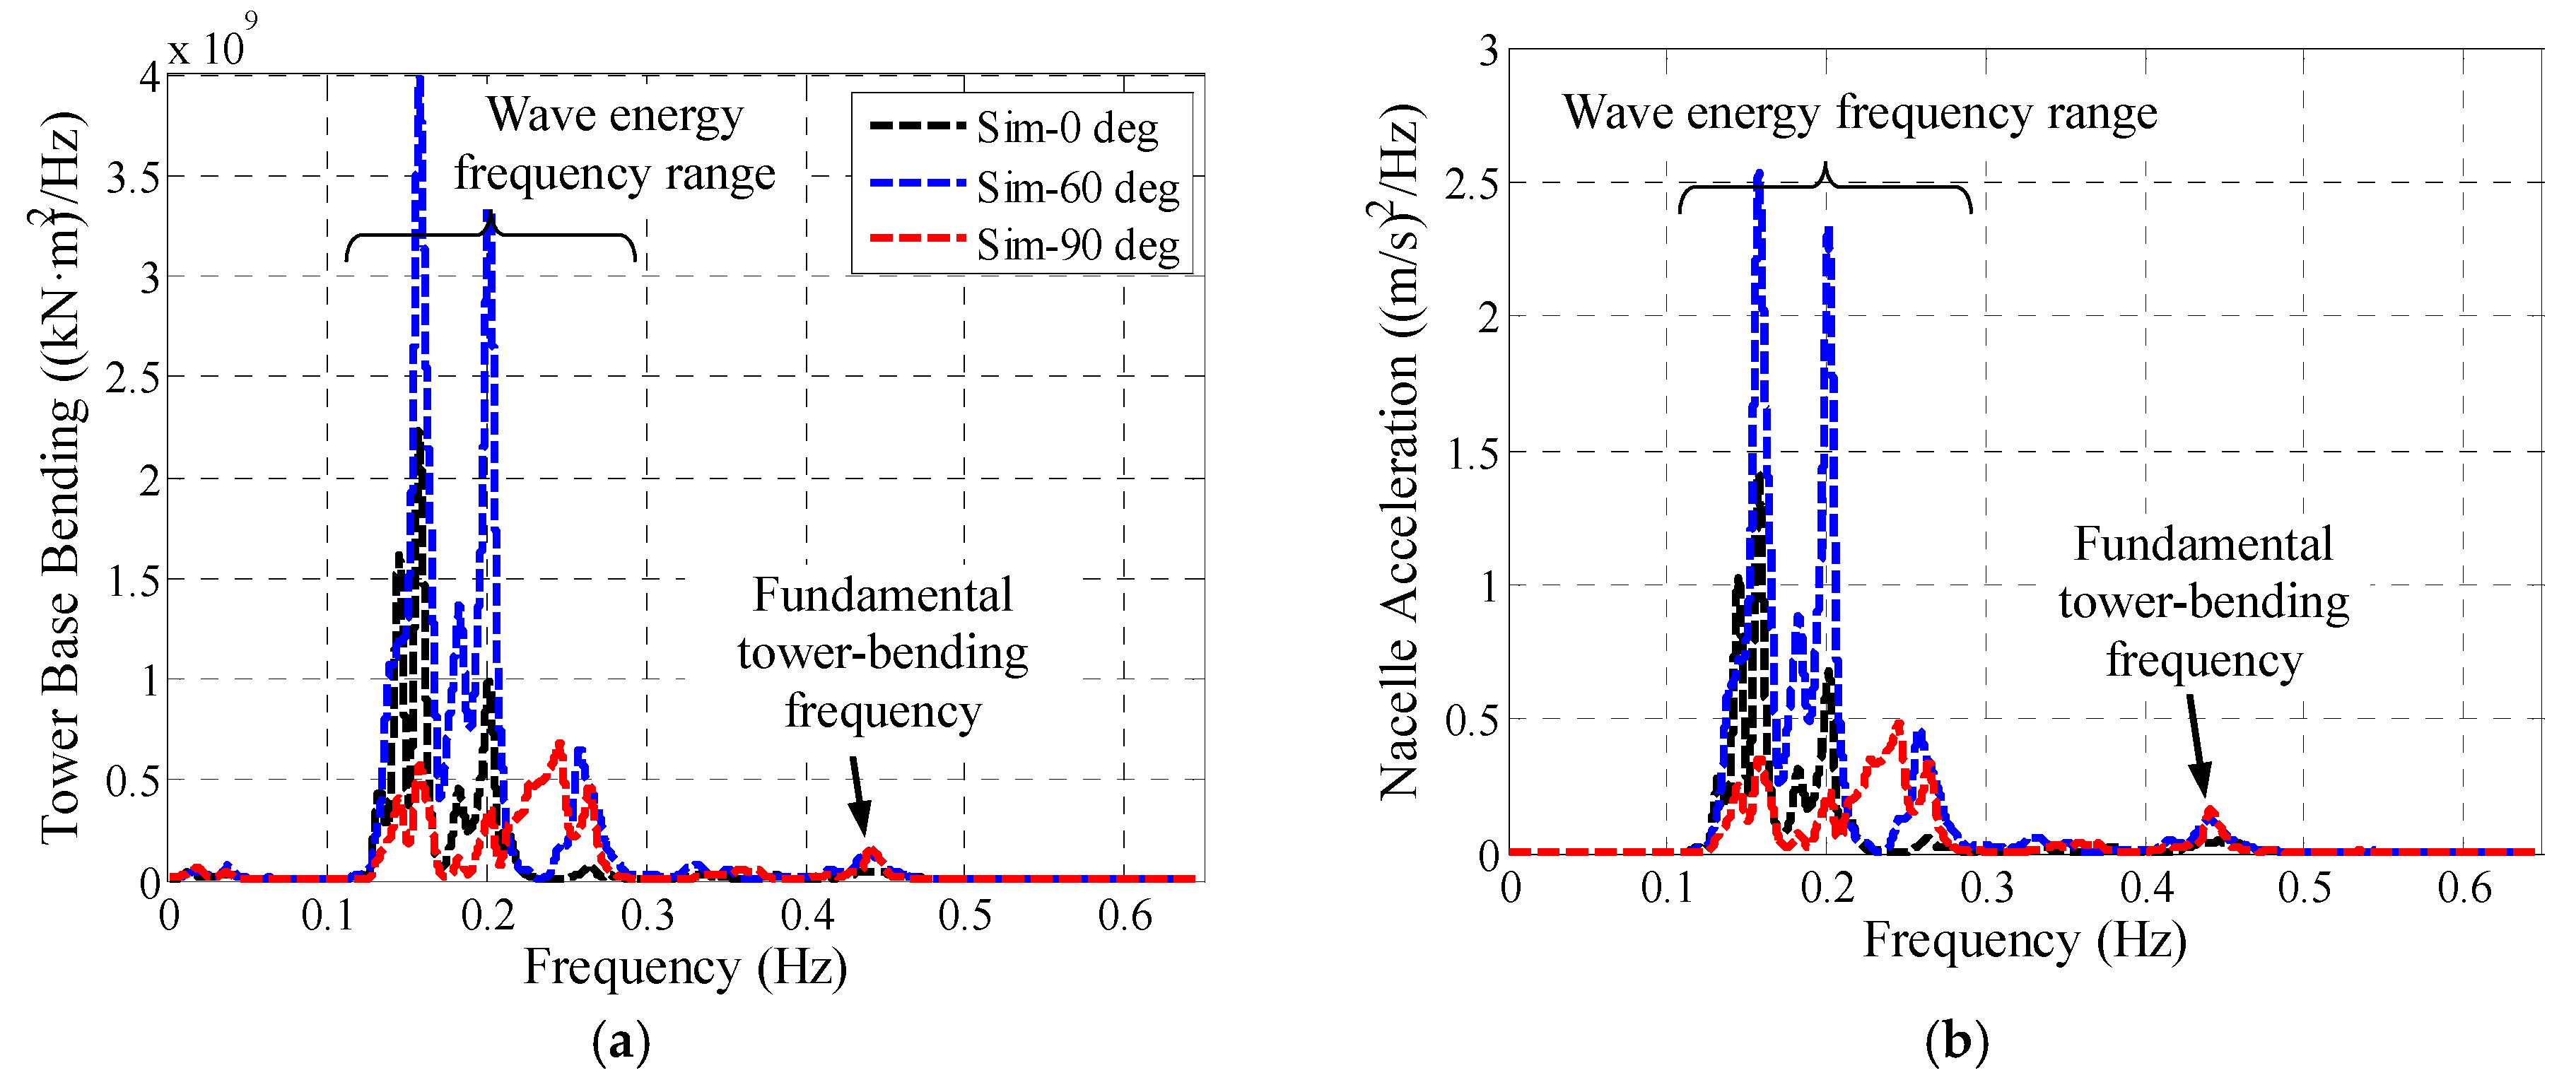
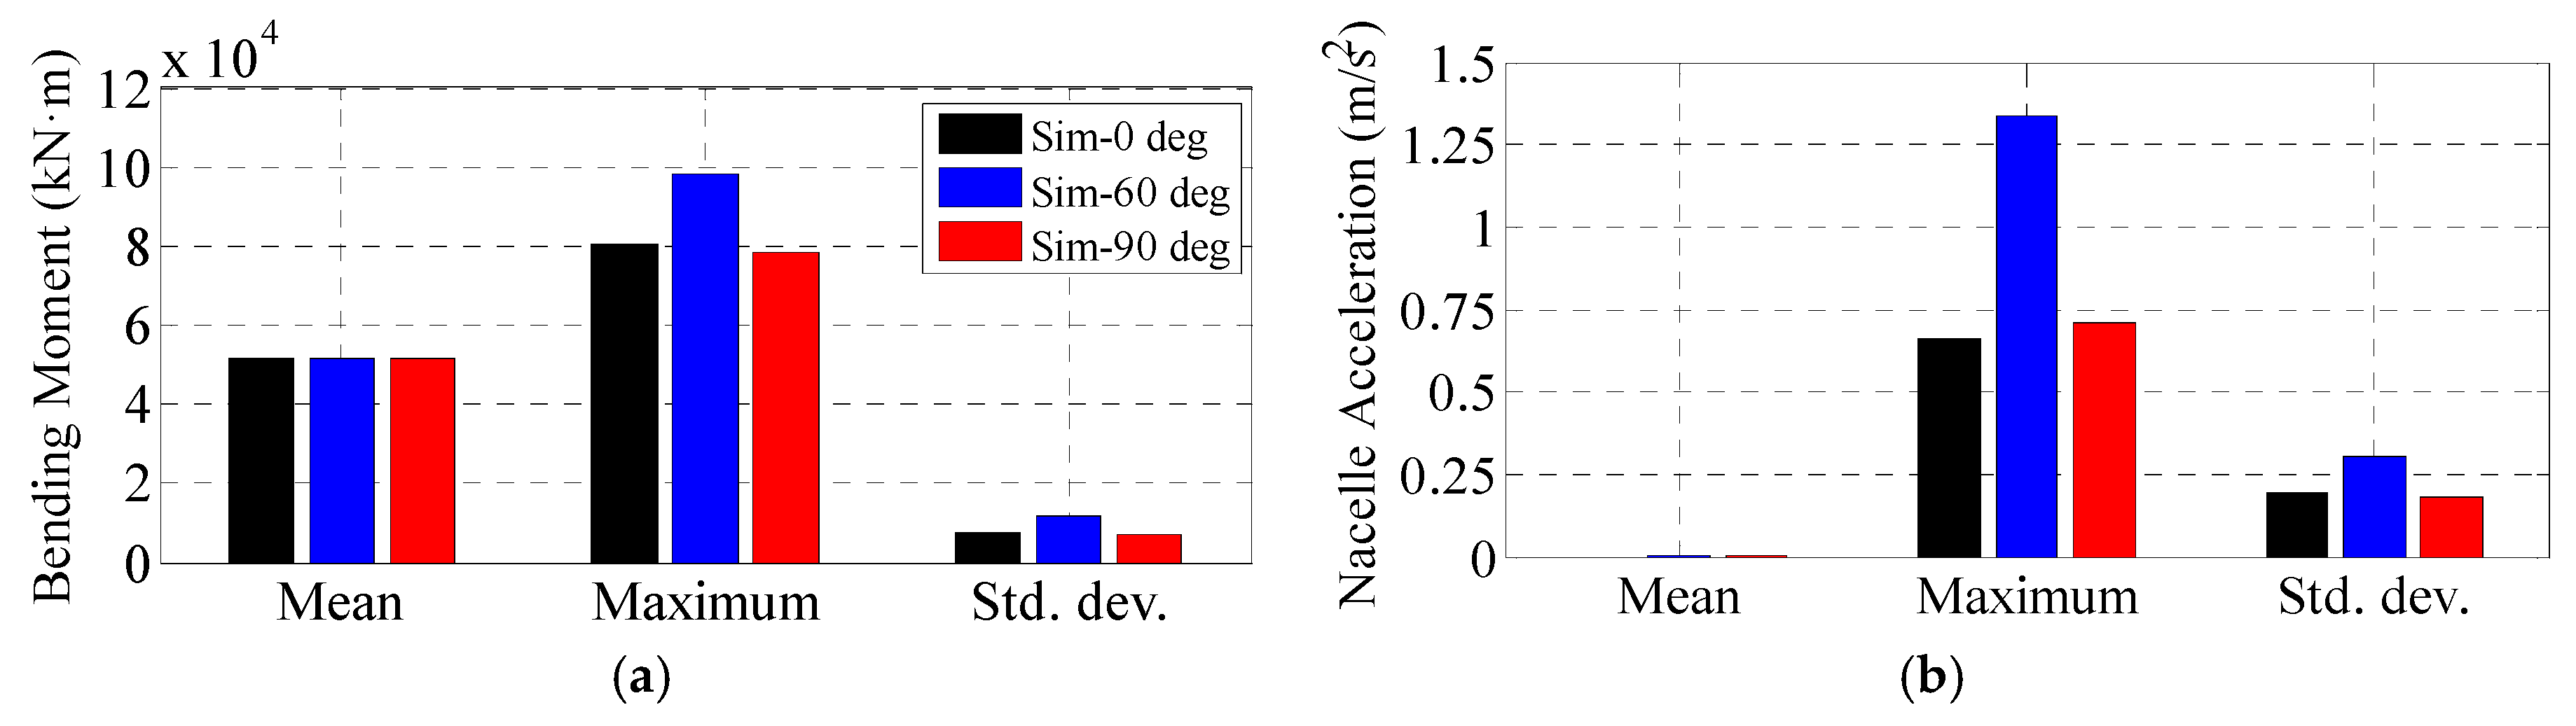
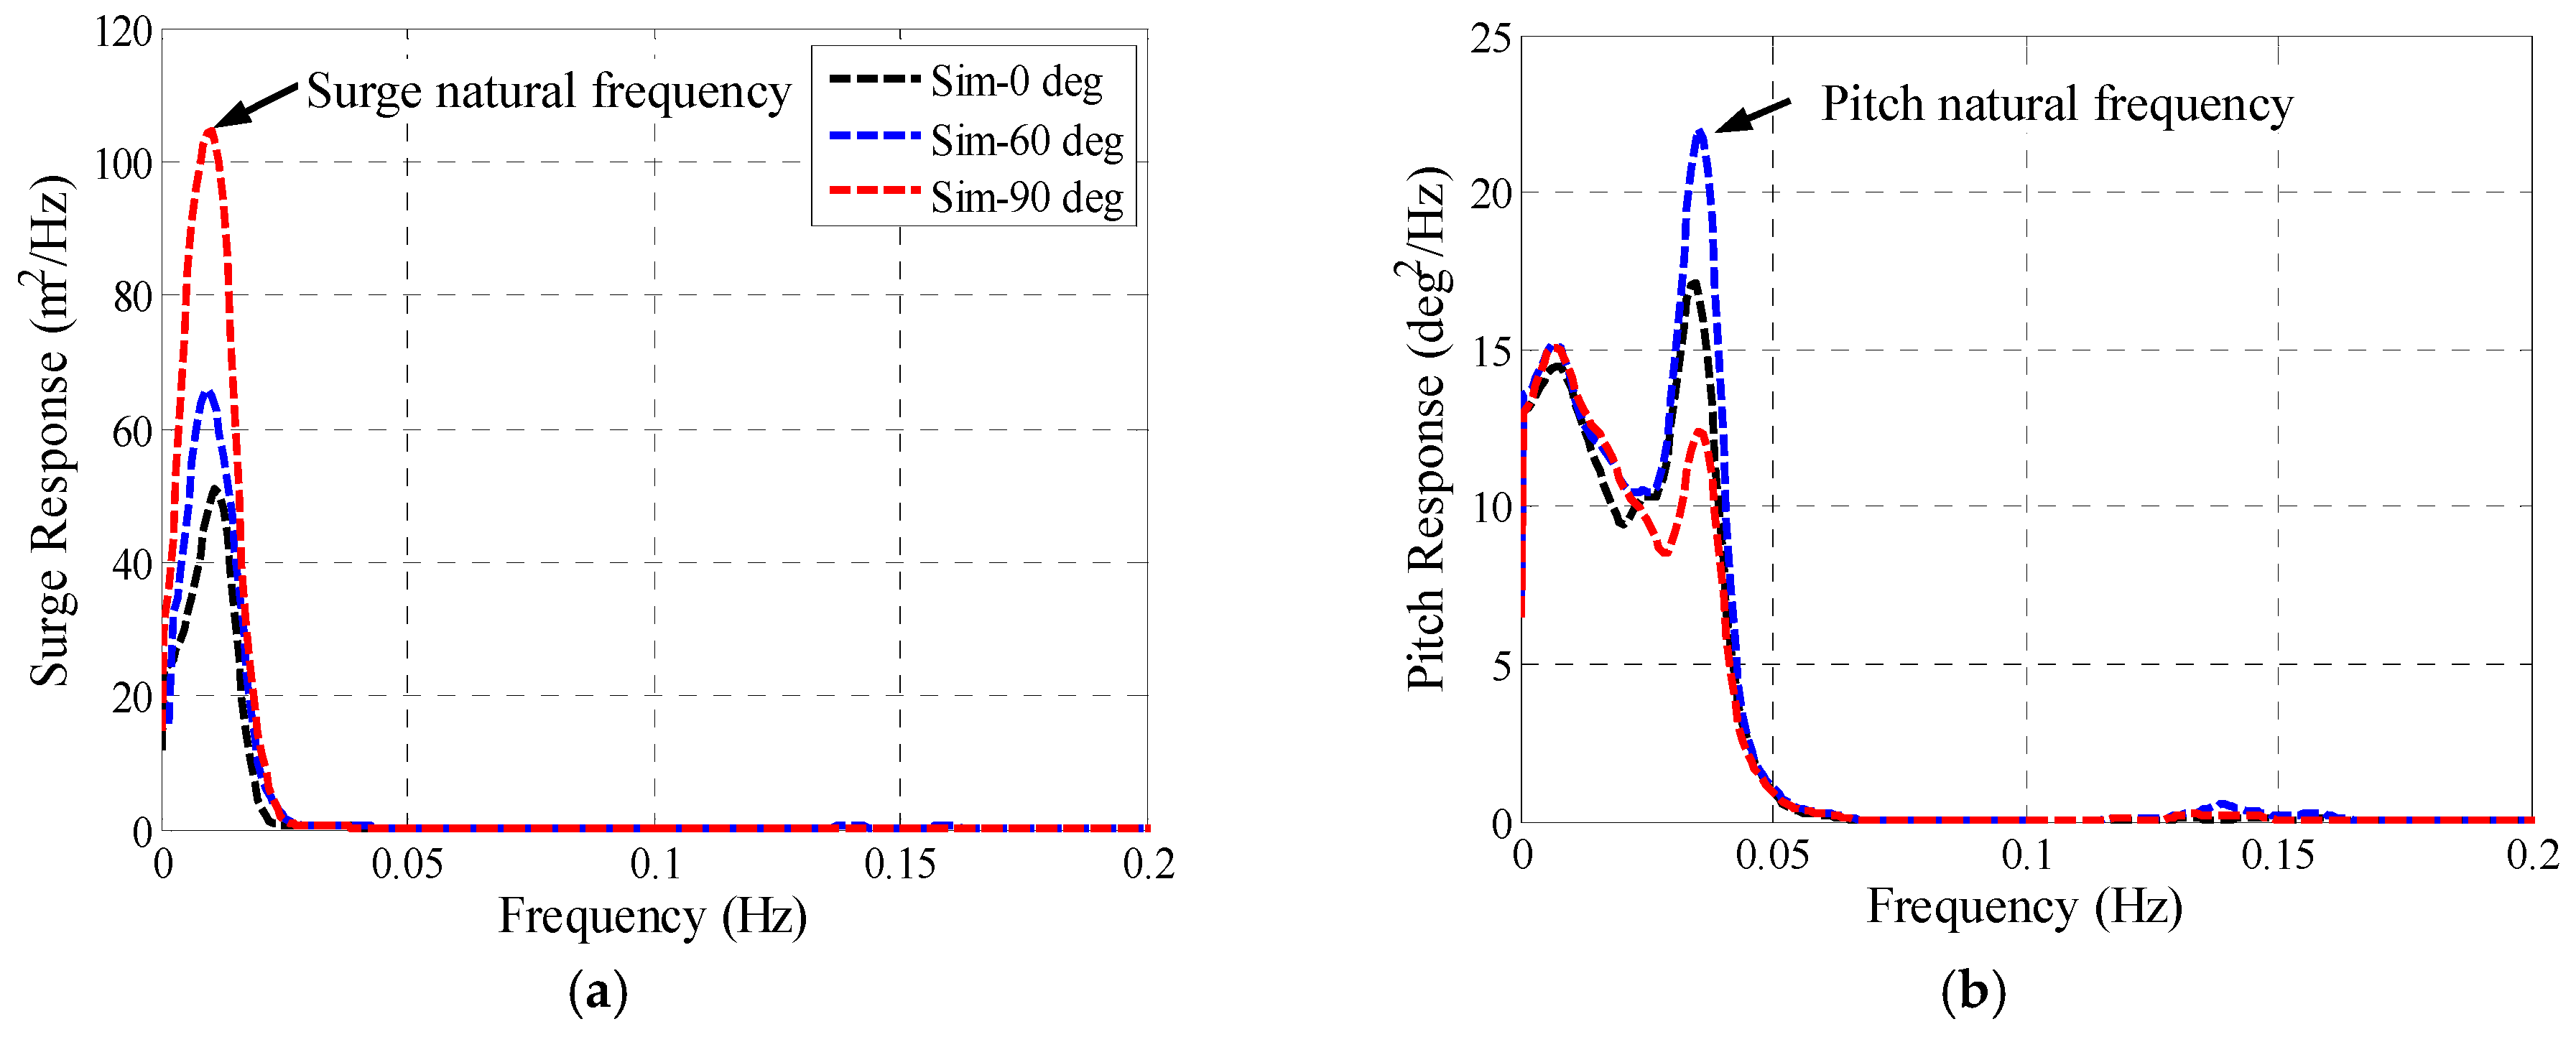
In irregular wave tests, resonant oscillations dominate the platform surge and pitch responses. Notable differences between wave headings are observed. The largest surge motion tends to occur in the 90° wave, while the largest pitch motion can always be found in 60°. The comparisons of the force as well as the motion QTF between the three wave directions demonstrate that it is the second-order hydrodynamic forces giving rise to these motion differences. In addition, the numerical models predict that the directions of stochastic waves also greatly affect the wind turbine dynamics. The largest and smallest fore-aft tower base bending moment/nacelle acceleration always occur in the 60° and 90° wave respectively. Stochastic waves evoke the first- and second-order platform motions. Thereinto, the directionality distinctions of the first-order surge and the second-order pitch motions result in the different tower base loads/nacelle acceleration in the incident wave frequencies and the pitch natural frequency respectively.
For the combined wind and wave tests, the comparisons between the actual and the simplified models indicate that platform surge and pitch oscillations are augmented in the predominant frequency range of the fluctuating wind. Nevertheless, the primary cause of the motion differences between load directions still lies in the second-order hydrodynamic forces. With regard to the tower base loads and the nacelle acceleration, the low-frequency and 3P oscillations can be excited by the turbulent wind and the rotating effect respectively, but these components do not contribute to the response differences between load directions. Instead, it is the directionality differences of the first-order hydrodynamic forces that lead to different tower base loads and nacelle acceleration.
On the whole, these findings indicate the directionality effects should be predetermined comprehensively before installation at sea, which is important for the operation and maintenance of the Y-shape floating wind turbines.

Acknowledgments

This study was supported by the National Key Research and Development Program of China [grant numbers 2016YFC0701107] and Shenzhen Knowledge Innovation program [grant numbers KQJSCX20160226201838], all of which are gratefully acknowledged.

Author Contributions

Yiqing Xiao and Chao Li conceived the concept of ConFloat semi-submersible platform and designed the experiments; Shengtao Zhou, Baohua Shan, Xiaoping Song, Yongqing Liu and Yimin Hu performed the experiments; Shengtao Zhou and Gang Hu analyzed the test data and carried out the numerical simulations; Shengtao Zhou and Chao Li wrote the paper.

Conflicts of Interest

The authors declare no conflict of interest.

References

  1. Breton, S.; Moe, G. Status, plans and technologies for offshore wind turbines in Europe and North America. Renew. Energy 2009, 34, 646–654. [Google Scholar] [CrossRef]
  2. Ederer, N. The market value and impact of offshore wind on the electricity spot market: Evidence from Germany. Appl. Energy 2015, 154, 805–814. [Google Scholar] [CrossRef]
  3. Esteban, M.; Leary, D. Current developments and future prospects of offshore wind and ocean energy. Appl. Energy 2012, 90, 128–136. [Google Scholar] [CrossRef]
  4. Musial, W.; Butterfield, S.; Boone, A. Feasibility of floating platform systems for wind turbines. In Proceedings of the 42nd AIAA Aerospace Sciences Meeting and Exhibit, Reno, NV, USA, 5–8 January 2004; The American Institute of Aeronautics and Astronautics: Reston, VA, USA, 2004. [Google Scholar]
  5. Stiesdal, H. Hywind: The world’s first floating MW-scale wind turbine. Wind Dir. 2009, 52, 1–9. [Google Scholar]
  6. Roddier, D.; Cermelli, C.; Aubault, A.; Weinstein, A. WindFloat: A floating foundation for offshore wind turbines. J. Renew. Sustain. Energy 2010, 2, 33104. [Google Scholar] [CrossRef]
  7. Fukushima Offshore Wind Consortium. Fukushima Floating Offshore Wind Farm Demonstration Project (Fukushima FORWARD). Available online: http://www.fukushima-forward.jp/pdf/pamphlet3.pdf (accessed on 8 December 2017).
  8. Karimirad, M.; Michailides, C. V-shaped semisubmersible offshore wind turbine: An alternative concept for offshore wind technology. Renew. Energy 2015, 83, 126–143. [Google Scholar] [CrossRef]
  9. Bruinsma, N. Validation and Application of a Fully Nonlinear Numerical Wave Tank. Master’s Thesis, Delft University of Technology, Delft, The Netherlands, 2016. [Google Scholar]
  10. Liu, Y.; Li, S.; Yi, Q.; Chen, D. Developments in semi-submersible floating foundations supporting wind turbines: A comprehensive review. Renew. Sustain. Energy Rev. 2016, 83, 433–449. [Google Scholar] [CrossRef]
  11. Coulling, A.J.; Goupee, A.J.; Robertson, A.N.; Jonkman, J.M.; Dagher, H.J. Validation of a FAST semi-submersible floating wind turbine numerical model with DeepCwind test data. J. Renew. Sustain. Energy 2013, 5, 023116. [Google Scholar] [CrossRef]
  12. Robertson, A.; Jonkman, J.M.; Masciola, M.; Song, H.; Goupee, A.; Coulling, A.; Luan, C. Definition of the Semisubmersible Floating System for Phase II of OC4; Report No. NREL/TP-5000-60601; Contract No. DE-AC36-08-GO28308; National Renewable Energy Laboratory: Golden, CO, USA, 2014.
  13. Jonkman, J.M.; Buhl, M.L., Jr. FAST User’s Guide; Report No. NREL/EL-500-38230; Contract No. DE-AC36-99-GO10337; National Renewable Energy Laboratory: Golden, CO, USA, 2005.
  14. Michailides, C.; Gao, Z.; Moan, T. Experimental study of the functionality of a semisubmersible wind turbine combined with flap-type Wave Energy Converters. Renew. Energy 2016, 93, 675–690. [Google Scholar] [CrossRef]
  15. Gao, Z.; Moan, T.; Wan, L.; Michailides, C. Comparative numerical and experimental study of two combined wind and wave energy concepts. J. Ocean Eng. Sci. 2016, 1, 36–51. [Google Scholar] [CrossRef]
  16. Chen, J.; Hu, Z. Experimental investigation of aerodynamic effect–induced dynamic characteristics of an OC4 semi-submersible floating wind turbine. Proc. Inst. Mech. Eng. Part M 2017. [Google Scholar] [CrossRef]
  17. Bachynski, E.E.; Thys, M.; Sauder, T.; Chabaud, V.; Sæther, L.O. Real-Time Hybrid Model Testing of a Braceless Semi-Submersible Wind Turbine: Part II—Experimental Results. In Proceedings of the 35th International Conference on Ocean, Offshore and Arctic Engineering, Busan, Korea, 19–24 June 2016; American Society of Mechanical Engineers: New York, NY, USA, 2016. [Google Scholar]
  18. Naess, A.; Moan, T. Stochastic Dynamics of Marine Structures; Cambridge University Press: Cambridge, UK, 2012. [Google Scholar]
  19. Wan, L.; Greco, M.; Lugni, C.; Gao, Z.; Moan, T. A combined wind and wave energy-converter concept in survival mode: Numerical and experimental study in regular waves with a focus on water entry and exit. Appl. Ocean Res. 2017, 63, 200–216. [Google Scholar] [CrossRef]
  20. Moriarty, P.J.; Hansen, A.C. AeroDyn Theory Manual; National Renewable Energy Laboratory: Golden, CO, USA, 2005.
  21. Jonkman, J.M. Dynamics Modeling and Loads Analysis of an Offshore Floating Wind Turbine. Ph.D. Thesis, University of Colorado, Golden, CO, USA, 2007. [Google Scholar]
  22. Hall, M.; Goupee, A. Validation of a lumped-mass mooring line model with DeepCwind semisubmersible model test data. Ocean Eng. 2015, 104, 590–603. [Google Scholar] [CrossRef]
  23. Wang, L.; Sweetman, B. Multibody dynamics of floating wind turbines with large-amplitude motion. Appl. Ocean Res. 2013, 43, 1–10. [Google Scholar] [CrossRef]
  24. Ormberg, H.; Bachynski, E.E. Global analysis of floating wind turbines: Code development, model sensitivity and benchmark study. In Proceedings of the 21st International Offshore and Polar Engineering Conference, Rhodes, Greece, 17–22 June 2012; International Society of Offshore and Polar Engineers: Mountain View, CA, USA, 2012. [Google Scholar]
  25. Philippe, M.; Babarit, A.; Ferrand, P. Effect of wave direction relative to wind on the motions of offshore floating wind turbine systems. In Proceedings of the 3rd International Conference and Exhibition on Ocean Energy, Bilbao, Spain, 6–8 October 2010; Ocean Energy Systems: Lisbon, Spain, 2010. [Google Scholar]
  26. Philippe, M.; Babarit, A.; Ferrant, P. Modes of response of an offshore wind turbine with directional wind and waves. Renew. Energy 2013, 49, 151–155. [Google Scholar] [CrossRef]
  27. Wayman, E.N. Coupled Dynamics and Economic Analysis of Floating Wind Turbine Systems. Master’s Thesis, Massachusetts Institute of Technology, Cambridge, MA, USA, 2006. [Google Scholar]
  28. Ramachandran, G.K.V.; Bredmose, H.; Sorensen, J.N.; Jensen, J.J. Fully Coupled Three-Dimensional Dynamic Response of a Tension-Leg Platform Floating Wind Turbine in Waves and Wind. J. Offshore Mech. Arct. Eng. 2014, 136, 020901. [Google Scholar] [CrossRef]
  29. Barj, L. Influence of Met-Ocean Conditions on the Loads Analysis of a Floating Wind Turbine. Master’s Thesis, The Pennsylvania State University, State College, PA, USA, 2013. [Google Scholar]
  30. Barj, L.; Stewart, S.; Stewart, G.; Lackner, M.; Jonkman, J.; Robertson, A.; Matha, D. Wind/wave misalignment in the loads analysis of a floating offshore wind turbine. In Proceedings of the 32nd ASME Wind Energy Symposium, National Harbor, MD, USA, 13–17 January 2014; The American Institute of Aeronautics and Astronautics: Reston, VA, USA, 2014. [Google Scholar]
  31. Bachynski, E.E.; Kvittem, M.I.; Luan, C.; Moan, T. Wind-wave misalignment effects on floating wind turbines: Motions and tower load effects. J. Offshore Mech. Arct. Eng. 2014, 136, 0419024. [Google Scholar] [CrossRef]
  32. Karimirad, M.; Michailides, C. V-shaped semisubmersible offshore wind turbine subjected to misaligned wave and wind. J. Renew. Sustain. Energy 2016, 83, 126–143. [Google Scholar] [CrossRef]
  33. Jonkman, J.; Butterfield, S.; Musial, W.; Scott, G. Definition of a 5-MW Reference Wind Turbine for Offshore System Development; Report No. NREL/TP-500-38060; Contract No. DE-AC36-08-GO28308; National Renewable Energy Laboratory: Golden, CO, USA, 2009.
  34. Martin, H.R. Development of a Scale Model Wind Turbine for Testing of Offshore Floating Wind Turbine Systems. Master’s Thesis, University of Maine, Orono, ME, USA, 2011. [Google Scholar]
  35. Martin, H.R.; Kimball, R.W.; Viselli, A.M.; Goupee, A.J. Methodology for wind/wave basin testing of floating offshore wind turbines. J. Offshore Mech. Arct. Eng. 2012, 136, 020905. [Google Scholar]
  36. Fowler, M.J.; Kimball, R.W.; Thomas, I.D.A.; Goupee, A.J. Design and testing of scale model wind turbines for use in wind/wave basin model tests of floating offshore wind turbines. In Proceedings of the 32nd International Conference on Ocean, Offshore and Arctic Engineering, Nantes, France, 9–14 June 2013; American Society of Mechanical Engineers: New York, NY, USA, 2013. [Google Scholar]
  37. Wan, L.; Gao, Z.; Moan, T. Experimental and numerical study of hydrodynamic responses of a combined wind and wave energy converter concept in survival modes. Coast. Eng. 2015, 104, 151–169. [Google Scholar] [CrossRef]
  38. Wan, L.; Gao, Z.; Moan, T.; Lugni, C. Experimental and numerical comparisons of hydrodynamic responses for a combined wind and wave energy converter concept under operational conditions. Renew. Energy 2016, 93, 87–100. [Google Scholar] [CrossRef]
  39. Wan, L.; Gao, Z.; Moan, T.; Lugni, C. Comparative experimental study of the survivability of a combined wind and wave energy converter in two testing facilities. Ocean Eng. 2016, 111, 82–94. [Google Scholar] [CrossRef]
  40. Det Norske Veritas. Recommended practice dnv-rp-c205. In Environmental Conditions and Environmental Loads; Det Norske Veritas: Oslo, Norway, 2010. [Google Scholar]
  41. Ishihara, T.; Phuc, P.V.; Sukegawa, H.; Shimada, K.; Ohyama, T. A study on the dynamic response of a semi-submersible floating offshore wind turbine system Part 1: A water tank test. In Proceedings of the 12th International Conference on Wind Engineering, Gairns, Australia, 1–6 July 2007; Australasian Wind Engineering Society: Gairns, Australia, 2007. [Google Scholar]
  42. Shan, B.; Zheng, S.; Ou, J. Free vibration monitoring experiment of a stayed-cable model based on stereovision. Measurement 2015, 76, 228–239. [Google Scholar] [CrossRef]
  43. Shan, B.; Zheng, S.; Ou, J. A stereovision-based crack width detection approach for concrete surface assessment. KSCE J. Civ. Eng. 2016, 20, 803–812. [Google Scholar] [CrossRef]
  44. Faltinsen, O. Sea Loads on Ships and Offshore Structures; Cambridge University Press: Cambridge, UK, 1993. [Google Scholar]
  45. Lee, C. WAMIT Theory Manual; Massachusetts Institute of Technology: Cambridge, MA, USA, 1995. [Google Scholar]
  46. Duarte, T.; Sarmento, A.; Jonkman, J. Effects of second-order hydrodynamic forces on floating offshore wind turbines. In Proceedings of the 32nd ASME Wind Energy Symposium, National Harbor, MD, USA, 13–17 January 2014; The American Institute of Aeronautics and Astronautics: Reston, VA, USA, 2014. [Google Scholar]
  47. Bayati, I.; Jonkman, J.; Robertson, A.; Platt, A. The Effects of Second-Order Hydrodynamics on a Semisubmersible Floating Offshore Wind Turbine; Report No. NREL/CP-5000-61752; Contract No. DE-AC36-08-GO28308; National Renewable Energy Laboratory: Golden, CO, USA, 2014.
  48. Coulling, A.J.; Goupee, A.J.; Robertson, A.N.; Jonkman, J.M. Importance of second-order difference-frequency wave-diffraction forces in the validation of a fast semi-submersible floating wind turbine model. In Proceedings of the 32nd International Conference on Ocean, Offshore and Arctic Engineering, Nantes, France, 9–14 June 2013; American Society of Mechanical Engineers: New York, NY, USA, 2013. [Google Scholar]
  49. Roald, L.; Jonkman, J.; Robertson, A.; Chokani, N. The effect of second-order hydrodynamics on floating offshore wind turbines. Energy Procedia 2013, 35, 253–264. [Google Scholar] [CrossRef]
  50. Bir, G. User’s Guide to BModes (Software for Computing Rotating Beam-Coupled Modes); Report No. NREL/TP-500-39133; Contract No. DE-AC36-99-GO10337; National Renewable Energy Laboratory: Golden, CO, USA, 2005.
  51. Schewe, G. On the force fluctuations acting on a circular cylinder in crossflow from subcritical up to transcritical Reynolds numbers. J. Fluid Mech. 1983, 133, 265–285. [Google Scholar] [CrossRef]
  52. Kelley, N.D.; Jonkman, B.J. Overview of the TurbSim Stochastic Inflow Turbulence Simulator; Report No. NREL/TP-500-41137; Contract No. DE-AC36-99-GO10337; National Renewable Energy Laboratory: Golden, CO, USA, 2007.
  53. International Electrotechnical Commission. Wind Turbines—Part 1: Design Requirements; IEC61400-1; International Electrotechnical Commission: Geneva, Switzerland, 2005. [Google Scholar]
Figure 1. The ConFloat semi-submersible platform: (a) 3D model; (b) Dimensions of the platform; (c) Side view of the platform; (d) Definition of wind/wave load directions.
Energies 10 02097 g001
Figure 2. The wind tunnel and wave flume joint laboratory: (a) Plane diagram; (b) Small test section; (c) large test section.
Energies 10 02097 g002
Figure 3. Wind turbine calibration test: (a) Thrust force comparison between the model and the prototype; (b) Simplified wind turbine model for rated operational condition.
Energies 10 02097 g003
Figure 4. Arrangement of the spring mooring system (under 0° load direction) in (a) lateral view (b) top view and its (c) components.
Energies 10 02097 g004
Figure 5. Comparison of (a) the surge-restoring force curves and (b) the pitch-restoring moment curves between the catenary mooring system and the spring mooring system in three load directions.
Energies 10 02097 g005
Figure 6. Surge-restoring force curves with pitch motion: (a) pitch= −2 deg; (b) pitch = 2 deg; (c) pitch = 4 deg and pitch-restoring moment curves with surge motion: (d) surge = −2 m; (e) surge = 2 m; (f) surge = 4 m.
Energies 10 02097 g006
Figure 7. Measuring instruments: (a) A micromanometer installed onto a lifting frame; (b) Three wave probes; (c) The stereo vision measurement system.
Energies 10 02097 g007
Figure 8. The measured wind and wave fields: (a) Average wind speed profile; (b) Turbulence intensity profile; (c) Stochastic wave spectrum.
Energies 10 02097 g008
Figure 9. Grids for the hydrodynamics computation: (a) Panel model for the ConFloat semi-submersible platform; (b) Free surface grids.
Energies 10 02097 g009
Figure 10. Load-displacement relationships for the horizontal spring mooring system (under 0° load direction).
Energies 10 02097 g010
Figure 11. The tower fore-aft mode shapes.
Energies 10 02097 g011
Figure 12. Comparisons of RAOs in three wave headings: (a) Surge; (b) Heave; (c) Pitch; (d) Tower base shear force; (e) Tower base bending moment; (f) Nacelle fore-aft acceleration.
Energies 10 02097 g012
Figure 13. Comparisons of surging force RAOs between three wave directions.
Energies 10 02097 g013
Figure 14. Time series of (a) surge; (b) tower base bending moment and (c) nacelle acceleration under the 5-s regular wave.
Energies 10 02097 g014
Figure 15. Comparisons of average surge and pitch motion in three wind headings.
Energies 10 02097 g015
Figure 16. Comparisons of (a) surge and (b) pitch PSD in three wave headings.
Energies 10 02097 g016
Figure 17. Statistical comparisons of the FAST simulation and model test data in three wave headings: (a) Surge motion; (b) Pitch motion.
Energies 10 02097 g017
Figure 18. Comparisons of load and motion QTFs between three wave directions: (a) Surging force QTF; (b) Pitch moment QTF; (c) Surge QTF; (d) Pitch QTF.
Energies 10 02097 g018
Figure 19. Second-order (a) surge and (b) pitch motion responses under the rated operational wave condition.
Energies 10 02097 g019
Figure 20. Comparisons of (a) tower base fore-aft bending and (b) nacelle acceleration PSD in three wave headings.
Energies 10 02097 g020
Figure 21. Statistical comparisons of (a) tower base bending moment and (b) nacelle acceleration between three wave headings.
Energies 10 02097 g021
Figure 22. Comparisons of (a) surge and (b) pitch PSD between three aligned wind/wave directions.
Energies 10 02097 g022
Figure 23. Statistical comparisons of the FAST simulation and model test data between three aligned wind/wave directions: (a) Surge response; (b) Pitch response.
Energies 10 02097 g023
Figure 24. Comparisons of (a) tower base fore-aft bending and (b) nacelle acceleration PSD between three aligned wind and wave directions.
Energies 10 02097 g024
Figure 25. Statistical comparisons of (a) tower base bending moment and (b) nacelle acceleration between three aligned wind/wave directions.
Energies 10 02097 g025
Figure 26. PSD plot of (a) surge motion and (b) pitch motion.
Energies 10 02097 g026
Figure 27. Statistical data of (a) surge and (b) pitch motion.
Energies 10 02097 g027
Figure 28. PSD plot of fore-aft (a) tower base bending moment, (b) nacelle acceleration and (c) wind thrust.
Energies 10 02097 g028
Figure 29. Statistical data of fore-aft (a) tower base bending moment; (b) nacelle acceleration and (c) wind thrust.
Energies 10 02097 g029
Table 1. Platform structural properties.
Structural PropertiesValue without Wind TurbineValue with Wind Turbine
Mass, including ballast (kg)1.4560 × 1071.5237 × 107
Center of mass (CM) location below MSL (m)16.06311.797
Roll inertia around CM (kg·m2)5.780 × 1091.109 × 1010
Pitch inertia around CM (kg·m2)5.780 × 1091.109 × 1010
Yaw inertia around CM (kg·m2)9.630 × 1099.970 × 109
Table 2. Properties of the catenary mooring system.
PropertiesValue
Number of mooring lines3
Depth of fairleads below MSL (m)18
Depth of anchors below MSL (m)90
Horizontal distance between anchors and the z-axis (m)424.8
Unstretched length of mooring line (m)392
Diameter of mooring line (m)0.08
Equivalent apparent mass in fluid per unit length (kg/m)136.248
Equivalent extensional stiffness (MN)50
Table 3. Sizes and performance parameters of the WTWF joint laboratory.
CategoryClosed Return Wind Tunnel with Two Test Sections
Sizes of the small test section4.0 m (W) × 3.0 m (H) × 25 m (L)
Sizes of the large test section6.0 m (W) × 3.6 m (H) × 50 m (L)
Sizes of the wave flume5.0 m (W) × 4.5 m (H) × 50 m (L)
Maximum wind speed50 m/s for the small test section
30 m/s for the large test section
Maximum wave height0.4 m
Range of wave periods0.5 s to 5 s
Table 4. Test matrix.
TestsWind Speed at Hub Height (m/s)Wave Period (s)Wave Height (m)Wind/Wave Headings
Free decay tests----
Regular wave tests-5:2:151.80°/60°/90°
-17:2:252
Wind-only tests11.5--0°/60°/90°
Irregular wave tests-6.742.230°/60°/90°
Combined wind and wave tests11.56.742.230°/60°/90°
Table 5. Comparison of test and simulation free decay results.
DOFTestsSimulationsRelative Errors
Surge80.5 s79.9 s−0.7%
Sway79.7 s78.6 s−1.4%
Heave17.7 s17.6 s−0.6%
Roll25.8 s26.0 s0.8%
Pitch26.0 s26.0 s0%
Yaw79.0 s79.7 s0.9%
Table 6. Global quadratic damping coefficients.
DOFGlobal Quadratic Coefficient
Surge4.0 × 106 N·s2/m2
Sway4.0 × 106 N·s2/m2
Heave1.0 × 106 N·s2/m2
Roll2.0 × 109 N·m·s2/rad2
Pitch2.0 × 109 N·m·s2/rad2
Yaw4.0 × 109 N·m·s2/rad2

