Article

Performance Prediction of Centrifugal Compressor for Drop-In Testing Using Low Global Warming Potential Alternative Refrigerants and Performance Test Codes

1
Department of Mechanical Engineering, Graduate School of Korea University, 02841 Seoul, Korea
2
Centre for Urban Energy Research, Korea Institute of Science and Technology, 02792 Seoul, Korea
3
Department of Mechanical Engineering, Korea University, 02841 Seoul, Korea
*
Authors to whom correspondence should be addressed.
Energies 2017, 10(12), 2043; https://doi.org/10.3390/en10122043
Submission received: 19 October 2017 / Revised: 23 November 2017 / Accepted: 26 November 2017 / Published: 3 December 2017

Abstract

:
As environmental regulations to stall global warming are strengthened around the world, studies using newly developed low global warming potential (GWP) alternative refrigerants are increasing. In this study, substitute refrigerants, R-1234ze (E) and R-1233zd (E), were used in the centrifugal compressor of an R-134a 2-stage centrifugal chiller with a fixed rotational speed. Performance predictions and thermodynamic analyses of the centrifugal compressor for drop-in testing were performed. A performance prediction method based on the existing ASME PTC-10 performance test code was proposed. The proposed method yielded the expected operating area and operating point of the centrifugal compressor with alternative refrigerants. The thermodynamic performance of the first and second stages of the centrifugal compressor was calculated as the polytropic state. To verify the suitability of the proposed method, the drop-in test results of the two alternative refrigerants were compared. The predicted operating range based on the permissible deviation of ASME PTC-10 confirmed that the temperature difference was very small at the same efficiency. Because the drop-in test of R-1234ze (E) was performed within the expected operating range, the centrifugal compressor using R-1234ze (E) is considered well predicted. However, the predictions of the operating point and operating range of R-1233zd (E) were lower than those of the drop-in test. The proposed performance prediction method will assist in understanding thermodynamic performance at the expected operating point and operating area of a centrifugal compressor using alternative gases based on limited design and structure information.

1. Introduction

At present, hydrofluorocarbon (HFC)-series refrigerants are the main working refrigerants used in turbo chillers. Since such refrigerants have a high global warming potential (GWP), their use is being phased out worldwide. Refrigerants that have little or no effect on global warming have been continuously developed to replace the existing high-GWP refrigerants. Low-GWP refrigerants include hydrocarbon-based refrigerants, natural refrigerants, and hydrofluoroolefin (HFO)-based refrigerants. Of these, HFO-based refrigerants, R-1234yf, R-1234ze (E), R-1233zd (E), and R-1336mzz, are attracting attention as new alternative refrigerants owing to their low-GWP characteristics and compatibility with existing turbo chiller refrigerants. These alternative refrigerants have been subjected to drop-in tests in existing facilities for applicability and thermodynamic evaluation. In this regard, studies using HFO-based low-GWP alternative refrigerants have been conducted in various ways.
Wang et al. [1] introduced the Air-Conditioning, Heating, and Refrigeration Institute (AHRI)’s Low-GWP Alternative Refrigerant Evaluation Program (Low-GWP AREP) and outlined the overall scope and procedures of the program. In addition, for the low-GWP candidate refrigerants, they provided the cycle count up to the current state and the actual test result.
Spatz et al. [2] analysed the theoretical performance of several low-GWP refrigerants in a volumetric chiller and centrifugal chiller used for air conditioning. The centrifugal chiller is divided into a low-pressure chiller using R-123 and a medium-pressure chiller using R-134a. The rotational speed, impeller outlet diameter, and coefficient of performance (COP) of the compressor were compared to those of conventional high-GWP refrigerants, and the results were analysed. This study showed that these refrigerants could be applied to existing devices without significant hardware modifications.
Ueda et al. [3] performed a drop-in test of the R-1234ze (E) alternative refrigerant in an R-134a centrifugal chiller. They analysed the compatibility of products related to lubrication and the performance of the chiller via full- and partial-load refrigerator tests. The results of the drop-in test under full load conditions showed that the cooling capacity and COP were reduced by approximately 29% and 3%, respectively, at the same inlet volumetric flow rate.
Brasz [4] predicted the capacity and performance of a centrifugal compressor using an ideal cycle and a thermodynamic property calculation for R-1234ze (E). In the study, R-1234ze (E) was injected into an existing R-134a centrifugal compressor to compare the aerodynamic performance with rotational speed. The author found that, when using alternative refrigerants, the efficiency of the chiller increased because of the low rotational speed and viscous loss compared to conventional centrifugal compressors, which are larger than the centrifugal compressor used in the conventional chiller. However, it was suggested that a condenser redesign is necessary to prevent a pressure drop from the condenser.
Pearson [5] analysed the method and characteristics of R-134a for alternative refrigerants and explained the primary issues to consider in alternative-refrigerant centrifugal compressor and chiller design. The performance of the developed centrifugal compressor was compared and analysed with the COP of R-134a, and R-1234ze (E) was found to be a viable alternative to the existing R-134a centrifugal compressor.
Mota-Babiloni et al. [6] performed a drop-in test of two alternative refrigerants (R-1234yf and R-1234ze (E)) in an R-134a vapor compression plant. It was confirmed that the volume efficiency, cooling capacity, and COP were decreased compared with those of R-134a, and the use of an internal heat exchanger could reduce the COP difference between alternative refrigerants.
Wu and Thilges [7] experimentally analysed the performance of one centrifugal compressor with three alternative refrigerants for various types of refrigerators with R-123 as the working fluid. The effects of the isentropic exponent, Reynolds number, blade Mach number, impeller diameter, rotational speed, etc. were studied.
Janković et al. [8] analysed the performance of the system and the heat transfer characteristics of a condenser when R-1234yf and R-1234ze (E) were applied to the simulation model of an R-134a small-power refrigeration system, considering the actual dimensions. The authors concluded that R-1234ze (E) could perform better than R-1234yf as an alternative refrigerant for R-134a if an overridden compressor with a cooling system could be used.
Meng et al. [9] showed the theoretical performance of three mixed gases consisting of R-1234ze (E), R-152a, and R-1234ze (E) mixed with R-152a, respectively, in drop-in tests. The COP of the R-1234ze (E) mixture was similar to that of R-134a, but the cooling capacity was significantly lower. They also showed that a refrigerant composed of R-1234ze (E) and R-152a with a mixing ratio of 50:50 would be suitable as an alternative refrigerant for R-134a.
Sethi et al. [10] analysed the theoretical performance when replacing R-447B and R-452B with a domestic reversible heat pump and a direct-expansion air-cooled chiller using R-410A. For the R-410A positive displacement chiller, the expected operating conditions of the components were analysed with the alternative refrigerants. In addition, the size and performance of the centrifugal compressors based on alternative refrigerants such as R-515A, R-1234ze (E), and R-1234yf were theoretically analysed for use in R-134a centrifugal chillers.
To summarize the previous studies to date, studies using low-GWP refrigerants have mainly focused on heat exchangers, heat pumps, and thermodynamic cycle analyses. In recent years, some companies have developed centrifugal chillers [11,12] and centrifugal compressors [13] that use a low-GWP alternative refrigerant as the operating gas. However, studies on the characteristics of a centrifugal compressor alone using a low-GWP alternative refrigerant have not yet been published. In particular, when it is difficult to supply alternative refrigerants, a method to predict the performance of the centrifugal compressor in advance would be very useful. In addition, it is necessary to evaluate and analyse the performance of centrifugal compressors when using a substitute gas.
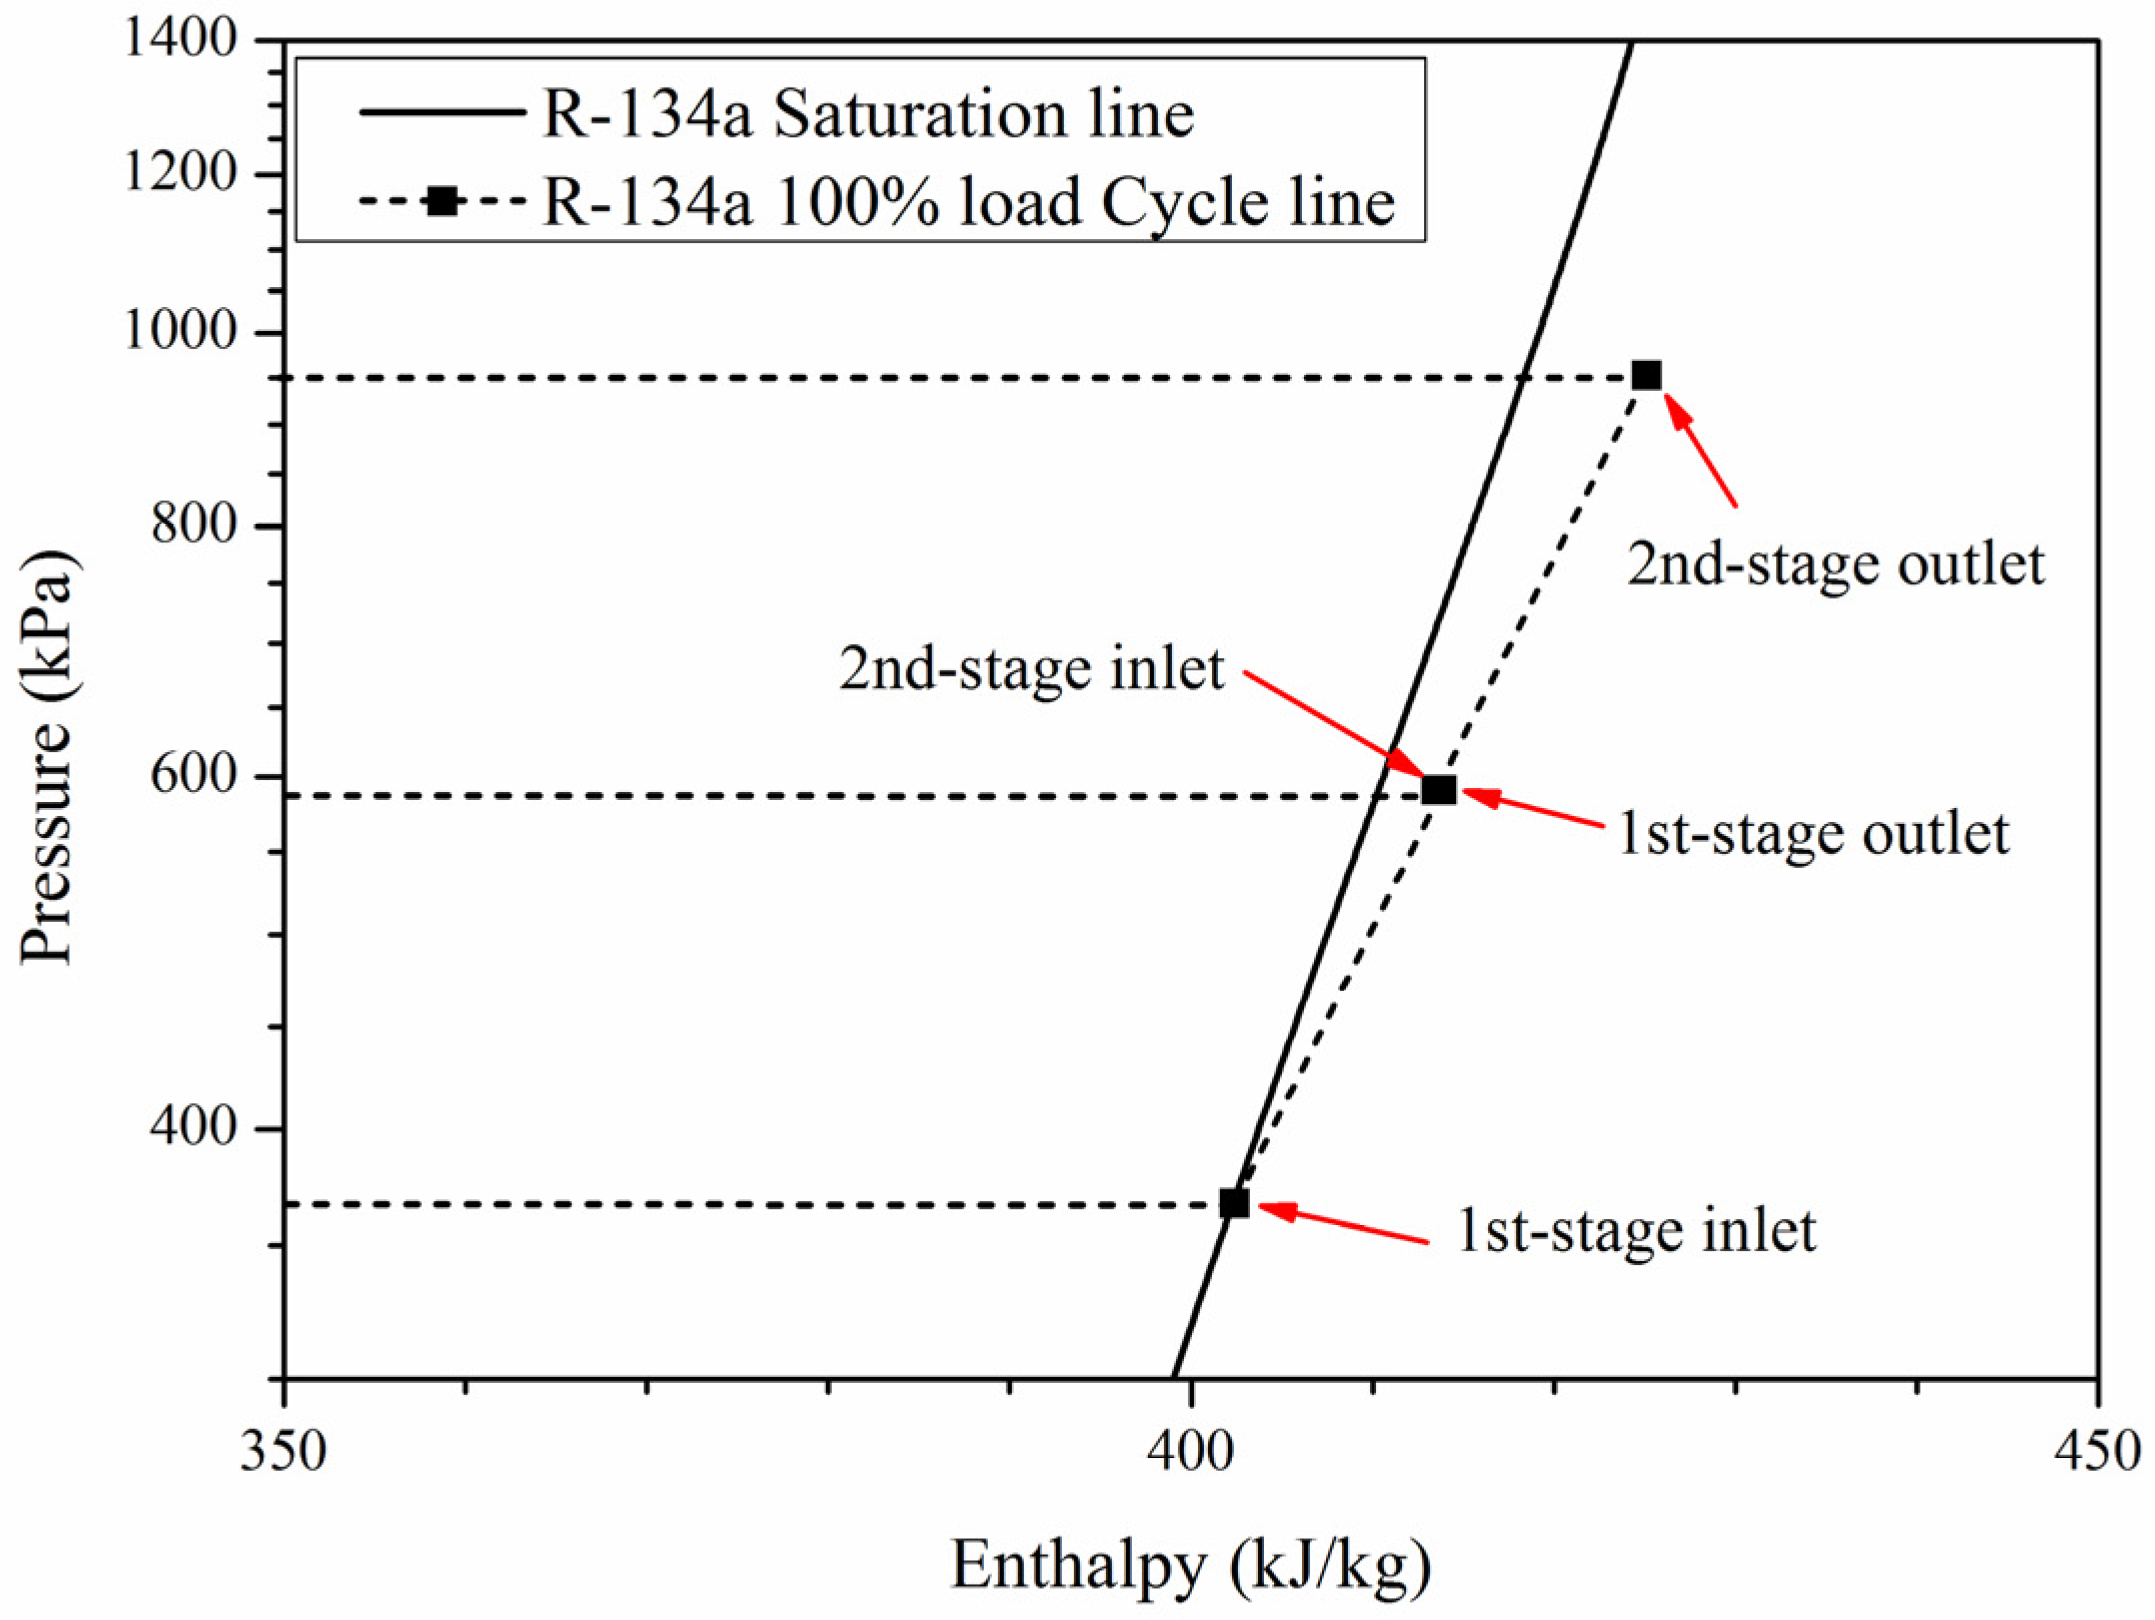
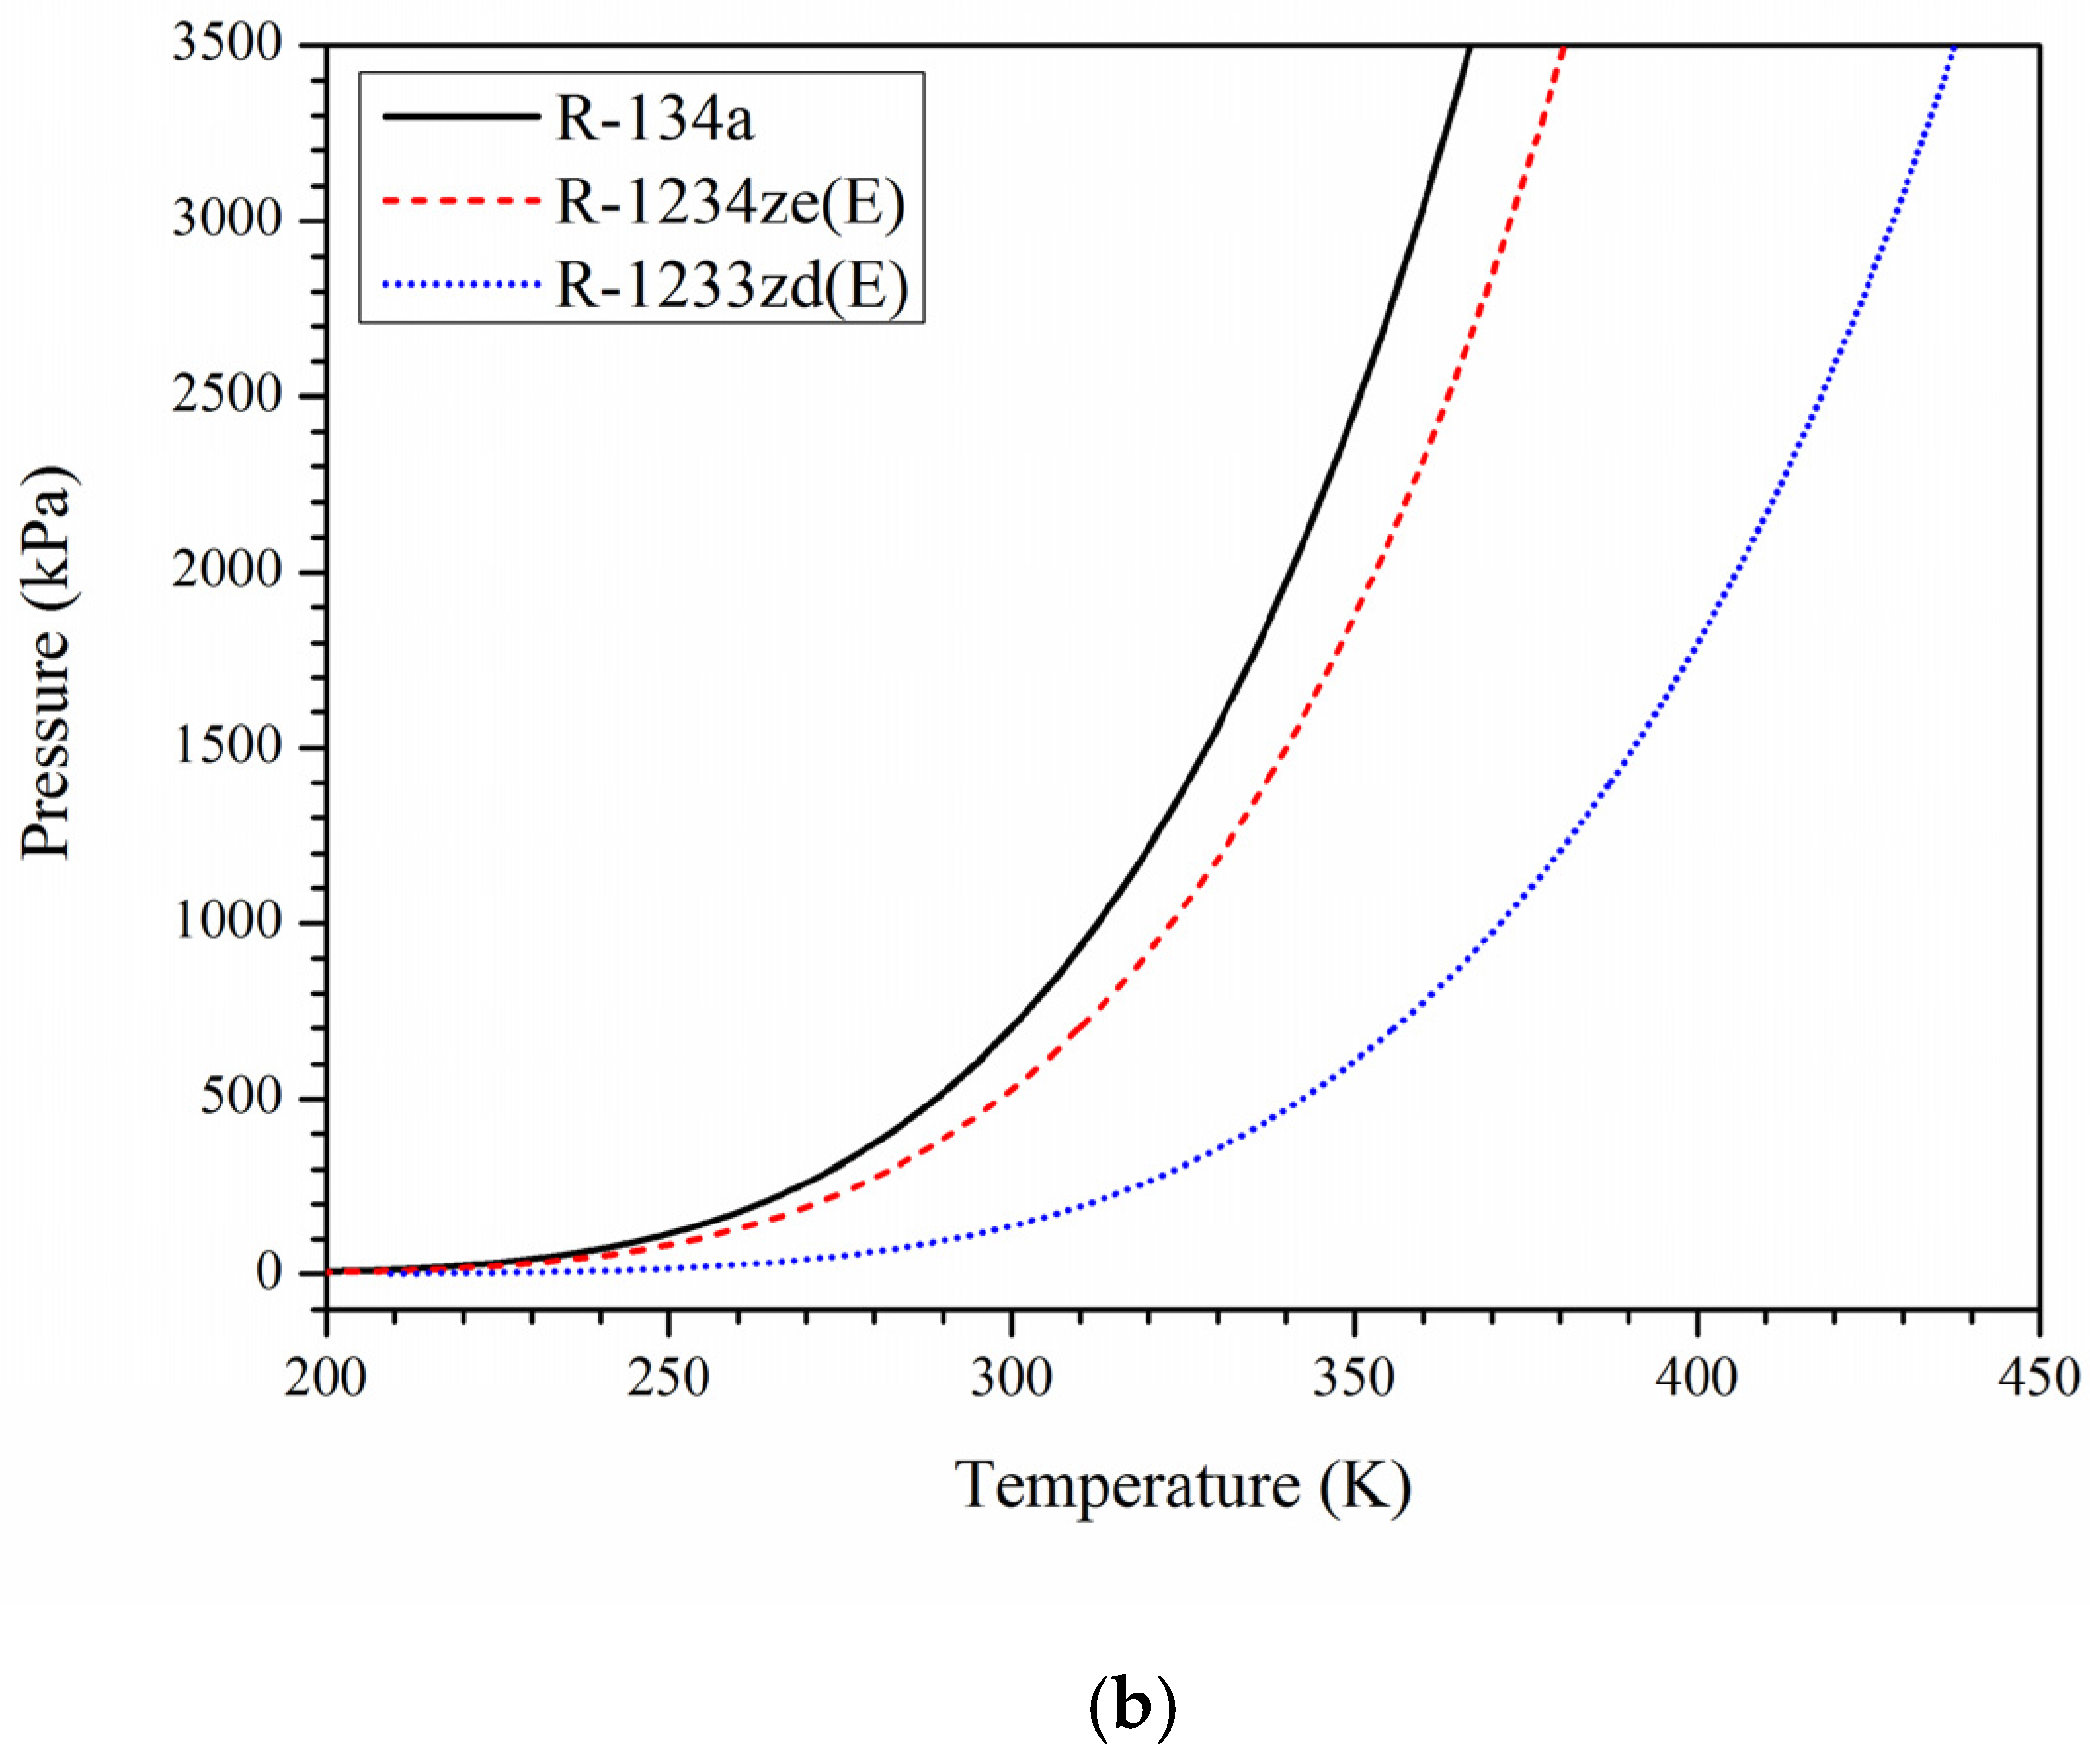
In this study, two low-GWP alternative refrigerants, R-1234ze (E) and R-1233zd (E), were applied to an R-134a centrifugal compressor with a two-stage turbo chiller. Then, the operating area and operating point of the centrifugal compressor were predicted via a drop-in test. The existing centrifugal compressor performance test code was improved, and the expected performance of a centrifugal compressor using an alternative refrigerant was calculated and thermodynamically analysed. Although R-1233zd (E) is a low-pressure refrigerant, it was used to examine the feasibility of the proposed performance prediction method.

2. Centrifugal Compressor Performance Prediction Method

AHRI provides an evaluation program for drop-in testing using low-GWP alternative refrigerants [14]. Based on this program, the centrifugal compressor test is applied according to The American Society of Mechanical Engineers, Performance Test Code-10 (ASME PTC-10) [15]. ASME PTC-10 provides a performance test procedure and the permissible deviation required for thermodynamic evaluation of the centrifugal compressor and axial compressor.
The ASME PTC-10 performance tests are classified into two types, type 1 and type 2, depending on the test gas. The type 1 method is used when the components of the design gas and test gas are the same or similar. The type 2 method is used when the components of the design gas and test gas are different. In both types of tests, the performance of the centrifugal compressor is compared with the design performance, and the feasibility of the result is thermodynamically evaluated. However, for each type of test result, there is a difference between the design performance, the type of comparison variable, and the permissible deviation. For a multi-stage compressor, the performance is evaluated using information about the operating conditions of the inlet and outlet (inlet duct and outlet duct) of the compressor, the impeller outlet diameter at each stage, and the impeller outlet width at the first stage. Here, the mass flow rate at the inlet and outlet should be the same.
In this study, we used the ASME PTC-10 type 2 method for predicting performance and improved the method to calculate the expected operating range and the expected performance of the centrifugal compressor using an alternative refrigerant. Performance prediction was conducted for each stage.

2.1. Performance Prediction Procedure

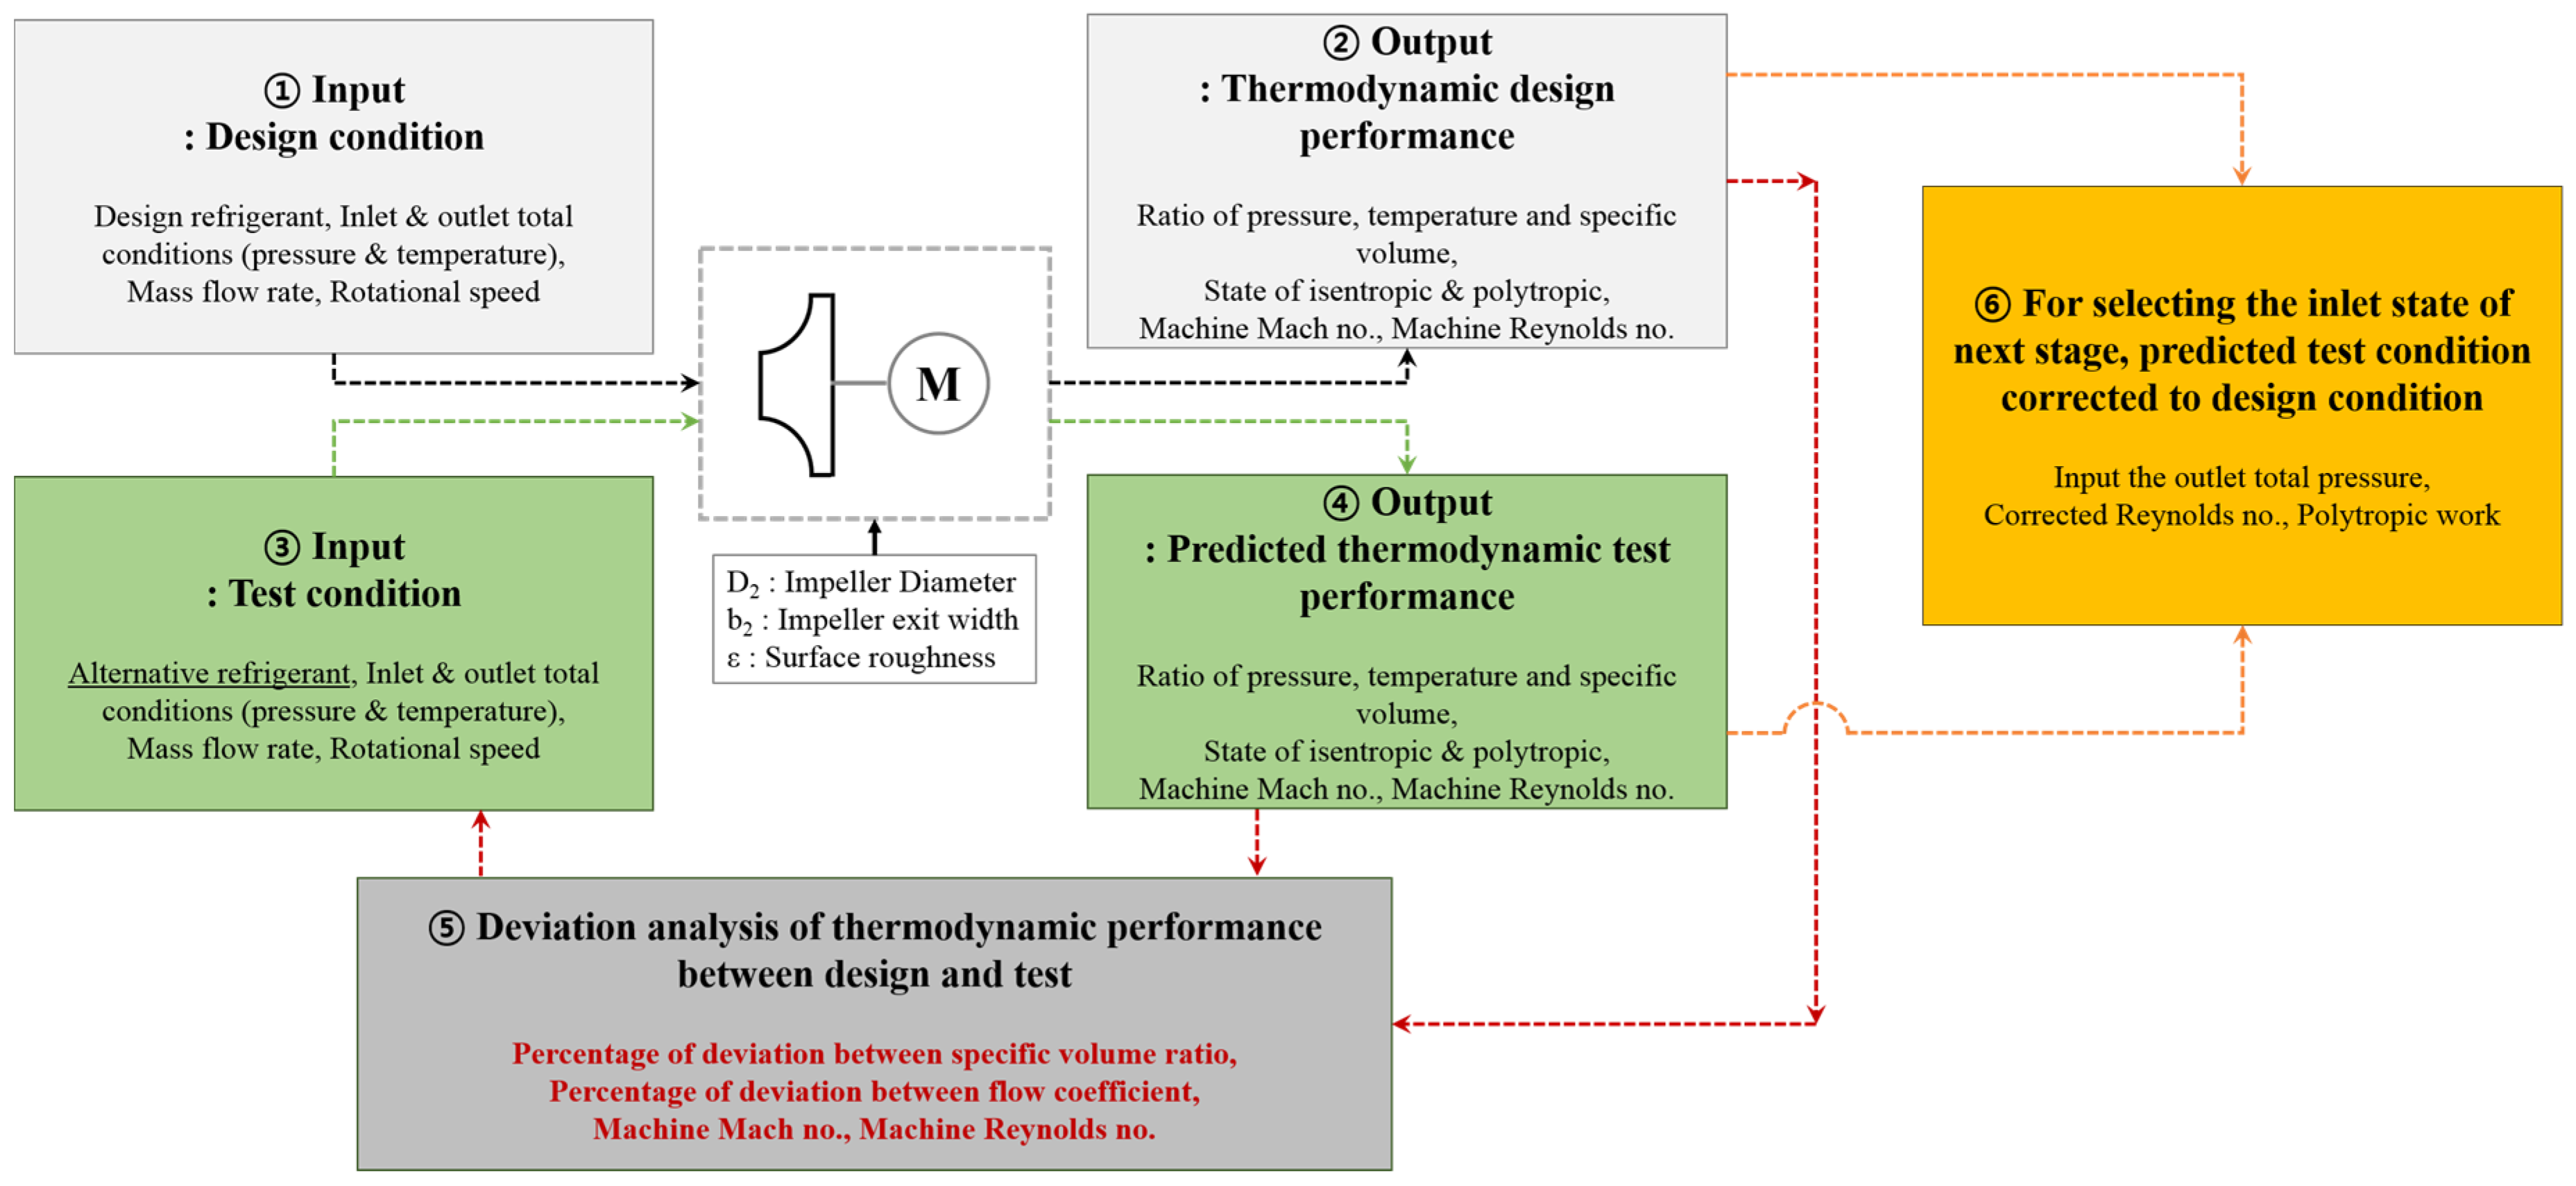
Figure 1 shows the performance prediction process using an alternative refrigerant. The impeller diameter, impeller outlet width, and surface roughness of the impeller remain constant because the centrifugal compressor’s shape does not vary with the type of refrigerant used. The performance prediction process using alternative refrigerants is as follows:
STEP-1: Enter information about the design conditions. The required information includes the name of the design refrigerant, the total pressure and total temperature of the inlet and outlet, the mass flow rate, and the rotational speed.
STEP-2: Calculate thermodynamic performance based on the design conditions. These conditions include the total pressure ratio, total temperature ratio, ratio of inlet and outlet specific volumes, isentropic and polytropic states, machine Mach number (defined in Equation (3)), machine Reynolds number (defined Equation (4)), and so on.
STEP-3: Enter information about the expected test conditions. This input information is similar to the design conditions. The name of the selected alternative refrigerant is entered as the test operation refrigerant.
STEP-4: Calculate thermodynamic performance based on the expected test conditions. The items to be calculated are the same as those in STEP-2.
STEP-5: Compare the following four results obtained from STEP-2 and STEP-4: ratio of inlet and outlet specific volumes, flow coefficient, machine Mach number, and machine Reynolds number. The expected operation range of the drop-in test is calculated based on the design result (STEP-2). The allowable deviation in the operation range is calculated based on the type-2 ASME PTC-10 criteria.
STEP-6: Select the expected operating point that meets the design result in the expected operation range derived in STEP-5. The expected operating point is selected after comparison with the design results via the correction process. The outlet temperature and pressure of the selected operating point are reflected in the inlet conditions of the next connected stage.
Table 1 shows the permissible deviation range required for performance prediction. The calculation formulas for each comparison variable are as follows:
% v r = v r t v r d ( v r = v i n v o u t )
Φ = 60 × m ˙ ρ i n × 2 π N × D i m p , o u t 3
M m = U i m p , o u t a i n
R e m = U i m p , o u t × b i m p , o u t ν i n = U i m p , o u t × b i m p , o u t μ i n × v i n
where, %vr is the percentage of deviation between specific volume ratios, vr is specific volume ratio, Φ is the flow coefficient, Mm is the machine Mach number, Uimp,out (m/s) is tangential speed at the impeller outlet, ain (m/s) is the acoustic velocity, Rem is the machine Reynolds number, bimp,out is the impeller outlet width, νin (m2/s) is the kinematic viscosity, μin (kg/m·s) is the absolute viscosity, and vin (m3/kg) is the specific volume. The subscript in signifies a specific point of the inlet duct.
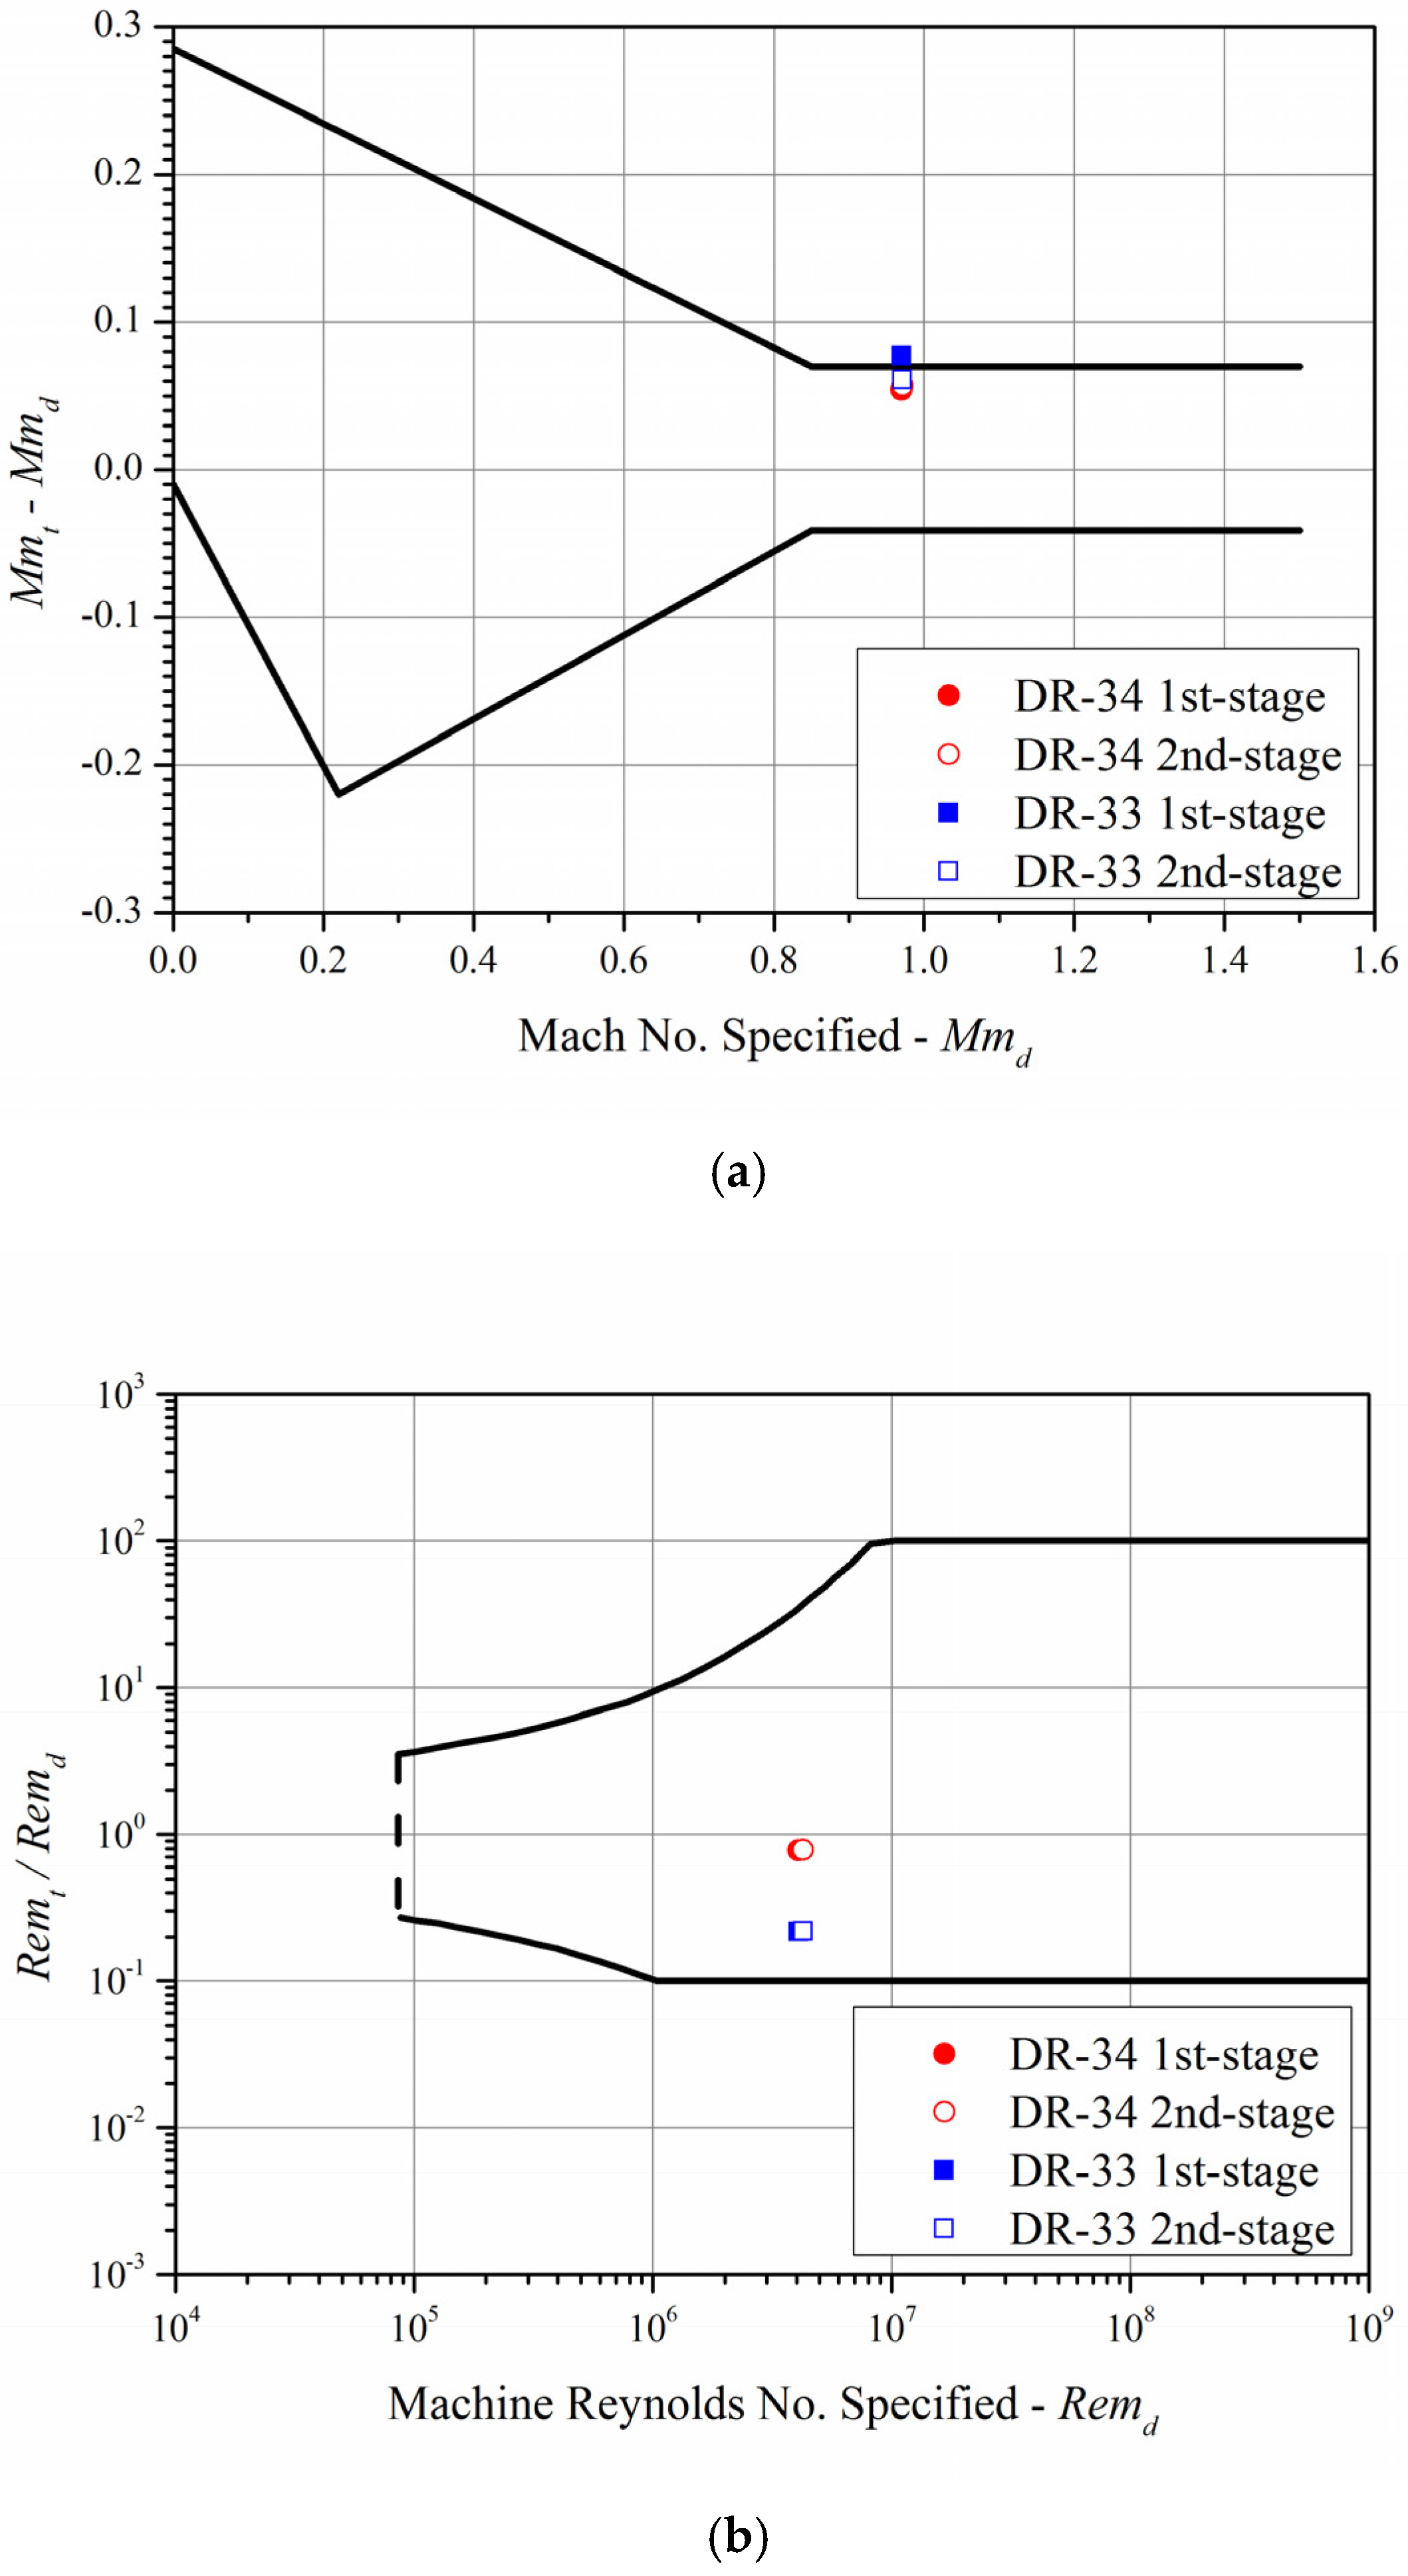
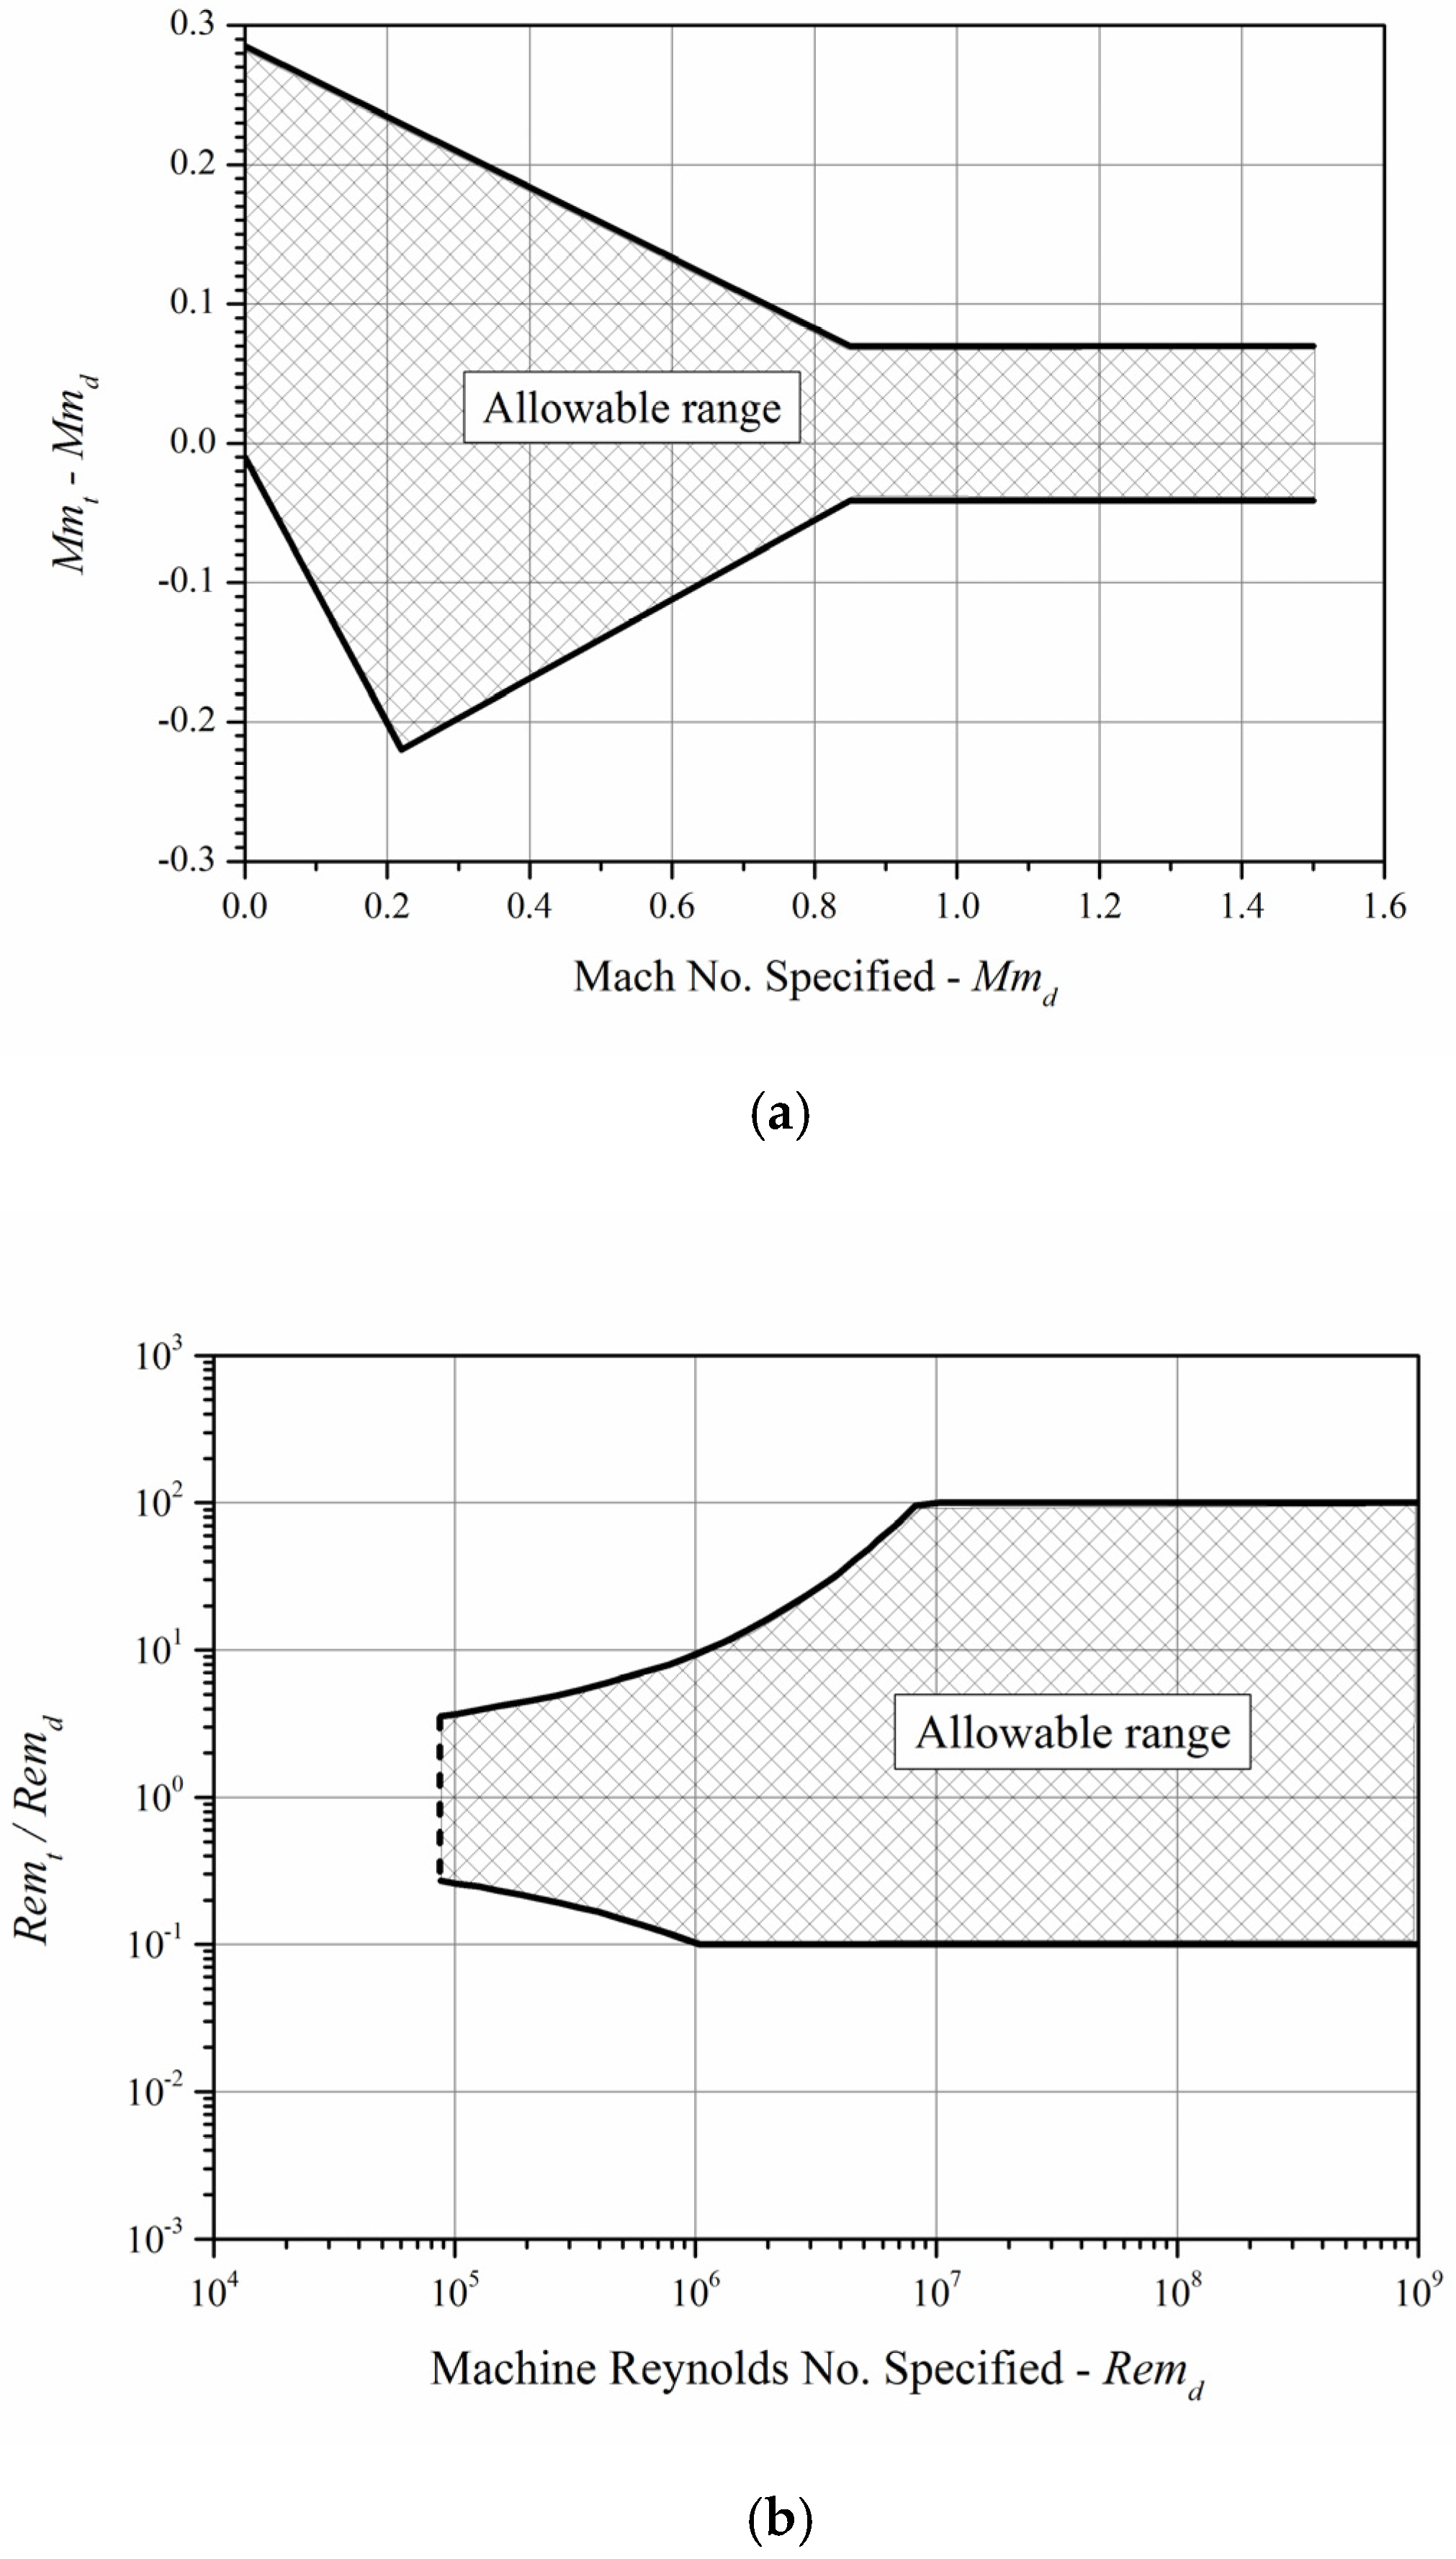
Figure 2a,b show the minimum and maximum deviation ranges for the design conditions and test conditions, respectively, as the permissible range of the machine Mach number and machine Reynolds number. The minimum machine Reynolds number in Figure 2b is greater than 90,000 [15].
In ASME PTC-10, the performance of a centrifugal compressor is evaluated with the polytropic method. Because the operating refrigerant and alternative refrigerant are all real gases, the method proposed by Schultz [16] is used to calculate the polytropic parameters for a real gas.

2.2. Calculation of Polytropic Exponents

The polytropic exponents for a real gas can be calculated using the compressibility function proposed by Schultz. The Schultz compressibility functions X and Y are:
X = T v ( v T ) p 1
Y = p v ( v p ) T
Here, the Schultz compressibility functions X and Y can be calculated by converting the volume expansivity calculated using Equation (7) and the isothermal bulk modulus calculated using Equation (8) into Equations (9) and (10), respectively:
α = 1 v ( v T ) p
K T = v ( p v ) T
X = T v ( v T ) p 1 = T [ 1 v ( v T ) p ] 1 = α T 1
Y = p v ( v p ) T = p [ 1 v ( v p ) T ] = p K T
X m = X i n + X o u t 2
Y m = Y i n + Y o u t 2
where α (1/K) is the volume expansivity and KT (kPa) is the isothermal bulk modulus. Since the temperature and pressure states are different at the compressor inlet and outlet, the compressibility function at the compressor inlet and outlet are averaged and then used. Xm and Ym, calculated using Equations (11) and (12), respectively, are used to calculate the polytropic volume exponent, n, and polytropic temperature exponent, m. The polytropic exponents are given by Equations (13) and (14) [17]. Equation (15) gives the isentropic volume exponent (kv) used to obtain the polytropic temperature exponent:
n = 1 + X m 1 k V ( 1 η p + X ) Y m ( 1 η p 1 )
m = ( k V · Y m 1 k V ) ( 1 η p + X m ) ( 1 + X m ) 2
k V = l n ( p o u t p i n ) l n ( v i n v , i s , o u t )
where ηp is polytropic efficiency and vis,out (m3/kg) is the specific volume at the outlet duct in the isentropic state.

2.3. Calculation of Polytropic State

In this study, the method proposed by ISO 5389 [17] was used to calculate the polytropic efficiency of a centrifugal compressor. The formula for calculating the polytropic efficiency is given by Equation (16) using the compressibility functions X and Y proposed by Schultz. To evaluate the thermodynamic performance of the centrifugal compressor according to the operating point, we can calculate the polytropic work Wp (N·m/kg) and gas power Pg (kW) using Equations (17) and (18). Equation (19) gives Schultz’s work factor, f, for calculating polytropic work [16]:
η p = 1 k V × ( 1 + X m ) 2 k V × Y m 1 × l n T o u t T i n l n p o u t p i n X m
W p = f   R   Z i n T i n × ( n n 1 ) × [ ( p o u t p i n ) ( n 1 n ) 1 ]
P g = ( W p × m ˙ ) η p
f = h i s , o u t h i n [ ( k V k V 1 ) × ( p o u t v i s , o u t p i n v i n ) ]
where R (N·m/kg·K) is the gas constant, Zin is the compressibility factor of the refrigerant at the inlet duct, m ˙ (kg/s) is the mass flow rate, and h is the enthalpy at a specific point.

2.4. Correction and Selection Method for the Drop-In Test’s Expected Operating Point

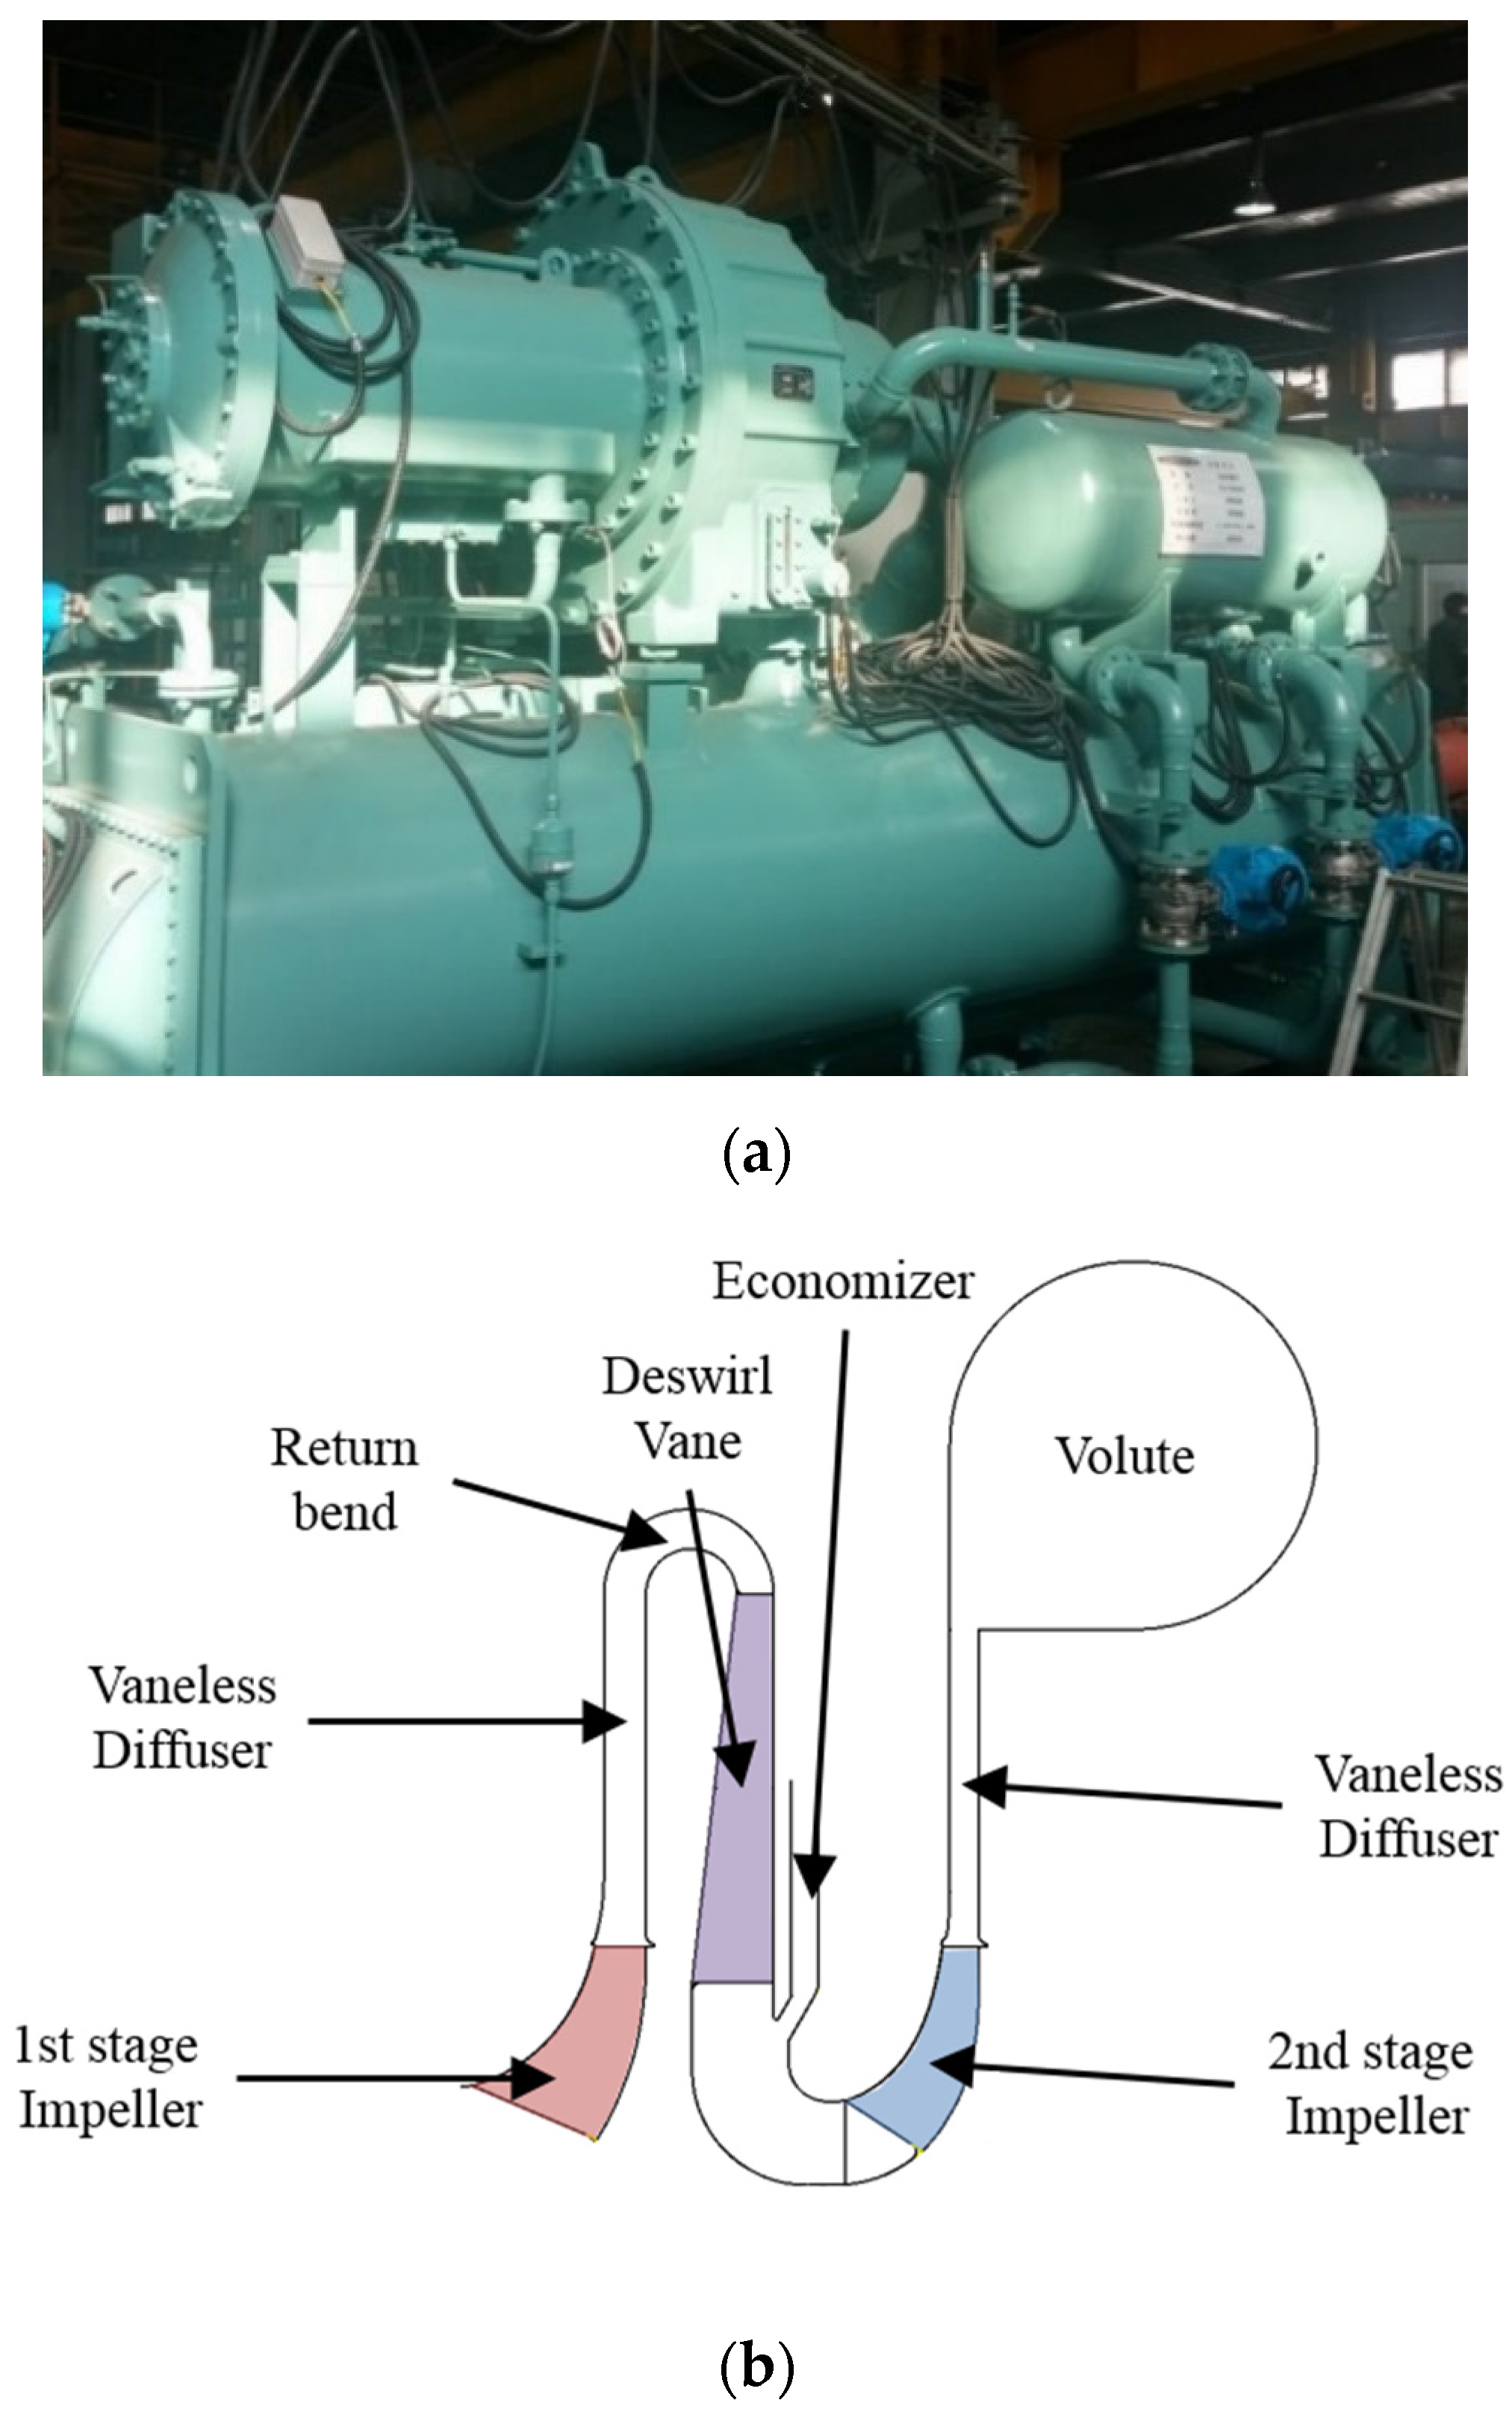
For a single-shaft multi-stage centrifugal compressor connected to the return channel, the outlet pressure of the return channel is designed to equalize the inlet pressure of the next stage connected. Therefore, an appropriate predicted operating point should be selected as the entry state of the next stage among the calculated expected operation areas. STEP-6 in Figure 1 is the step in which an expected operating point is selected based on the predicted operating area. In this step, the design performance is corrected using the results of the predicted driving range. The predicted operating point of the drop-in test was selected when the polytropic work value of the calculated correction was equal to the polytropic work of the design performance. If the value of the polytropic work of the correction result is greater or less than the design performance value, the outlet temperature and pressure of the predicted operating point can be adjusted. To correct the expected operating point of the drop-in test to match the design performance, the following equations are sequentially calculated:
Q c o r r = Q t × N d N t
m ˙ c o r r = Q t × N d N t × ( 1 v i n , c o r r ) ( v i n , c o r r = v i n , d )
N c o r r = N t × Q d Q t
η p , c o r r = 1 [ ( 1 η p , t ) × ( R A d R A t ) × ( R B d R B t ) ] R A = 0.066 + 0.934 × [ ( 4.8 × 10 6 × b i m p , o u t ) R e m ] R C R B = l o g ( 0.000125 + 13.67 R e m ) l o g ( ε + 13.67 R e m ) R C = 0.988 R e m 0.243
R e m c o r r = η p , d η p , t
W p , c o r r = W p , t × ( N d N t ) 2 × R e m c o r r
where Q (m3/s) is the volume flow rate at the inlet. RA, RB, and RC are machine Reynolds number correction constant constants. The subscript corr signifies the corrected state.

2.5. Thermodynamic Properties of Refrigerants

The thermodynamic properties of all refrigerants used for performance prediction were obtained from NIST REFPROP 9.1 [18]. However, those of R-1234ze (E) and R-1233zd (E) were obtained from the file uploaded to the FAQ of NIST REFPROP [19]. The refrigerant state equation is the Helmholtz equation of state recommended by NIST [20]. Microsoft Excel was used for performance prediction, and it was possible to acquire the state quantity of the refrigerant in conjunction with the REFPROP data.

3. Comparison of Thermodynamic Characteristics of Low-GWP Alternative Refrigerants

Figure 3a,b compare the thermodynamic properties of R-134a, R-1234ze (E), and R-1233zd (E). Figure 3a shows the saturation curve of the three refrigerants in a pressure-enthalpy diagram, and Figure 3b shows the pressure-temperature plot. At the same pressure, we can observe that R-1234ze (E) is similar to R-134a and the deviation is not large. However, R-1233zd (E) has a relatively higher enthalpy and higher temperature than R-134a. Although it is a qualitative comparison, R-1234ze (E) is considered to be suitable as an alternative refrigerant for R-134a, which is well explained in the previous research. Table 2 lists the environmental impact (ODP and GWP) and thermodynamic properties for each refrigerant.

4. Description of the Centrifugal Compressor in a Centrifugal Chiller for a Drop-In Test

4.1. Specifications and Operational State

Figure 4a shows the R-134a centrifugal chiller (500 RT) for the drop-in test using an alternative refrigerant. Figure 4b shows the meridional plane of the two-stage centrifugal compressor used in the chiller. The centrifugal compressor is composed of two stages but with a single shaft. There is a return channel between the first and second stage, and the economizer is connected before the second stage’s entrance. Therefore, the mass flow rate of the refrigerant entering the second stage is larger than that entering the first stage. The first- and second-stage diffusers are all vaneless. Figure 5 shows the theoretical operating cycle of the R-134a centrifugal compressor for a 100% load condition via a pressure-enthalpy diagram. There is no superheat degree at the first-stage inlet of the centrifugal compressor, and the pressure at the first-stage outlet and second-stage inlet are the same. The inlet temperature of the second stage is reduced by approximately 0.3 K from the temperature of the first-stage outlet via the flow from the economizer.
The measurement device and installation position in the performance test of the centrifugal chiller are as follows. A relative pressure transmitter was used for static pressure measurement. The accuracy of the pressure transmitter is 0.1%FS. For temperature measurement, a platinum resistance temperature detector (RTD) with a two-wire-type 1000-Ω sensor was used. The class of the RTD sensor is A (±(0.15 °C + 0.002t) °C), and the temperature coefficient of resistance is 0.00385 Ω/°C. The temperature and pressure sensors are installed at the first-stage inlet and the second-stage volute outlet. The measured data were acquired through an in-house system, and the measured results were used to verify the performance prediction results.

4.2. Constraint Conditions of Centrifugal Compressor for Predicting Performance

Table 3 lists the inlet pressure and temperature, specific volume ratio, and flow coefficient for a full load (100% load) of the R-134a centrifugal compressor. In the centrifugal chiller used in this study, the outlet temperature of chilled water of the evaporator was 280.15 ± 0.3 K even if the refrigerant was changed. Therefore, the performance of the compressor was predicted while assuming that the inlet temperatures of the first stage of the compressor were all identical. Because the rotational speed of the compressor is fixed, there is no change in rotational speed, even with an alternative refrigerant. The percentage of deviation of the specific volume ratio was calculated within the tolerance range described in Table 1. In addition, the flow coefficient was assumed to be unchanged. The performance of each stage of the centrifugal compressor was analysed based on the above constraints. In addition, in this study, the centrifugal compressor using R-1234ze (E) was designated as DR-34, and the centrifugal compressor using R-1233zd (E) was designated as DR-33 for convenience.

5. Results and Discussion

5.1. Comparison of Permissible Deviation by Alternative Gases

Figure 6 shows a comparison between the results of DR-34 and DR-33 in the permissible range diagram of Figure 2. Figure 6a shows the results for each stage of DR-34 and DR-33 in the permissible range of the machine Mach number. All of the stages except for the first stage of DR-33 were within the permissible range. For the first stage of DR-33 to return to the permissible range, the rotational speed must be reduced or the sound speed at the inlet must increase, as indicated by Equation (3). There are two theoretical methods for increasing the sound speed at the inlet: increasing the inlet temperature and decreasing the inlet pressure. In the former case, if a superheat degree of approximately 4 K is applied under the assumption that there is no pressure decrease by absorption at the inlet of the compressor, the machine Mach number shifts into the permissible range. In the latter case, the inlet pressure of the compressor can be reduced by controlling the chilled water, but it moves further away from the permissible range because the inlet temperature is also decreased. Therefore, the effect of adding superheat needs to be considered. However, for a more precise analysis, this effect should be analysed comprehensively via a cycle simulation and performance test.
Figure 6b shows the results of each stage of DR-34 and DR-33 in the permissible range of the machine Reynolds number. The ratio of the machine Reynolds number of DR-33 was relatively lower than that of DR-34, but the operating points of both refrigerants were in the permissible range.

5.2. Prediction of Allowable Range and Theoretical Operating Point

Figure 7a,b show the changes in total temperature, polytropic efficiency, and polytropic work as a function of the changing total pressure in the first- and second-stage outlets of DR-34, respectively. Here, the flow coefficients of DR-1 and DR-2 were fixed at 0.036 and 0.026, respectively. The deviation of specific volume ratios varied from −5% to +6%, which is the permissible error range. The polytropic efficiency was compared by limiting the calculation range from 50% to 95%. Figure 7a shows that, as the first-stage outlet pressure of DR-34 increases, the outlet temperature and polytropic work increase, while the polytropic efficiency decreases. When the specific volume ratio increases, the minimum and maximum values of the operating ranges of outlet pressure, outlet temperature, and polytropic work increase. When the specific volume ratio decreases, the opposite occurs. In Figure 7b, changes in the outlet temperature and polytropic efficiency as a function of increasing DR-34 outlet pressure at the second stage show the same tendency as that at the first stage. However, at the first stage, the polytropic work decreases, and the minimum and maximum values of the operating range of polytropic work increase identically. To analyse the difference in the tendency of the polytropic work of the first and second stages, the work factor and isentropic volume exponent of each stage were compared, as shown in Figure 8. The work factor increases gradually with increasing pressure ratio in the first stage, but it decreases in the second stage. To compare the values of the isentropic volume exponent in the work-factor equation, Equation (19), even when the pressure ratio changes, the isentropic volume exponent is greater than 1 (kV > 1) in the first stage but less than 1 in the second stage (kV < 1). Therefore, the first term of the denominator in Equation (19) becomes negative in the second stage. Furthermore, the product of the outlet pressure and the outlet isentropic specific volume of the second term becomes smaller than the product of the inlet pressure and the inlet specific volume. Thus, the second term also becomes negative. Because of the product of the first and second terms of the denominator, the total value of the denominator becomes greater than the difference between the enthalpies of the numerator. As a result, the work factor decreases.
Figure 9a shows the expected operating range and operating point of the first-stage outlet of DR-34 calculated theoretically via the proposed method. Figure 9b shows the expected operating range and expected operating point of the inlet and outlet in the second stage based on the expected operating point of the outlet in the first stage of DR-34.
The expected operating range is defined as the pressure range when the deviation of the specific volume ratio is between −5% and +5% and the enthalpy range when the calculated polytropic efficiency is between 50% and 95%, under the condition that the specific volume ratio of the R-134a design and the DR-34 deviation of the specific volume ratio are 0%. Within the expected operating range at this time, the centrifugal compressor has various operating points. Therefore, the theoretical expected operating point needs to be calculated using STEP-6 in Figure 1. The outlet operating points of each stage in Figure 9a,b were obtained under the following limitations: the percentage of deviation of the specific volume ratio is 0% and the deviation ratio of polytropic work between the design condition and correction result is 0%.
Figure 10a,b show the expected operating range and expected operating points in each stage of DR-33. The overall results are similar to those for DR-34 owing to the thermodynamic characteristics of R-1233zd (E). However, it has a lower density compared to R-1234ze (E); thus, the outlet pressure in each stage of DR-33 is lower than that of DR-34.
The minimum and maximum values of pressure and temperature in the expected operating range at the outlet in each stage of DR-34 and DR-33 are listed in Table 4. At the same deviation of specific volume ratios, the lower the efficiency is, the higher are the pressure and temperature. When the deviation of specific volume ratios increases from −5% to +5%, both the pressure and temperature increase. When the difference of deviation, Δ%vr, is analysed, the pressure difference of DR-34 is greater than that of DR-33, and the pressure difference of the second stage is greater than that of the first stage. Furthermore, the pressure difference increases further if the efficiency decreases. The temperature difference is approximately 3 K at a polytropic efficiency of 95% for both DR-34 and DR-33 and approximately 6 K at 50% efficiency. Because results are generally more sensitive to temperature than to pressure at the same efficiency point, more attention should be focused on temperature control during the drop-in test.

5.3. Validation of Thermodynamic Performance Prediction

Figure 11a shows a diagram comparing the prediction results for the first and second stages of DR-34 with the measurement results from the drop-in test. The static pressure ps (kPa) and static temperature Ts (K) at the inlet duct of the first stage of the centrifugal compressor and at the outlet of the second stage were converted to total pressure and total temperature using Equations (26) and (29), respectively, and compared with the prediction results. In ASME PTC-10, when the fluid Mach number at the measured position, Ma, is less than 0.2, it is regarded as incompressible because the compressive effect decreases, and the total pressure is calculated as shown in Equation (26). If the fluid Mach number is 0.2 or higher, the total pressure should be calculated as shown in Equation (27). Because the fluid Mach numbers at the inlet and outlet ducts are both less than 0.2, the total pressure was calculated using Equation (26). Equation (30) gives the average fluid speed V (m/s) using the cross-sectional area at the measured position:
p = p s + V 2 2 × v s   ( Incompressible   flow ,   M a < 0.2 )
p = p s [ 1 + k 1 2 × M a 2 ] k k 1   ( Compressible   flow ,   M a 0.2 )
M a = V a
T = T s + ( 1 0.65 ) × ( V 2 2 × C p , s )
V = m ˙ × v s A
where k is the ratio of specific heats and Cp (N·m/kg·K) is the specific heat at constant pressure. The subscript s signifies the static state.
The measured point at the inlet in the first stage of DR-34 is lower by approximately 11 kPa (approximately 4%) than the theoretically predicted operating point. The deviation of the inlet temperature seems to be due to the operating environment during the actual operation of the closed-circuit cycle chiller.
Under the assumption that the inlet temperature is identical to the design condition and the deviation of the specific volume ratio is 0%, the predicted operating point is indicated by a solid symbol and a solid line in Figure 11a. The pressure at the measured point of the outlet in the second stage is lower by approximately 8.7 kPa (approximately 1.2%) than the predicted operating point, but it is in the predicted operating range. Under the assumption that the inlet condition in the first stage of DR-34 is converted to the measured temperature and pressure and the deviation of specific volume ratio is 0%, the predicted operating point is indicated by an open symbol and a short-dashed line in Figure 11a.
When the inlet temperature and pressure decrease, the predicted operating points at the first- and second-stage outlets decrease. Even when the inlet conditions are changed, the measured point is within the predicted operating range. Figure 11b compares the prediction results in the first and second stages of DR-33 with the measurements obtained via the drop-in test. The solid symbol and solid line indicate the predicted operating point at 0%vr. The pressure and temperature measured at the inlet of the first stage are very close to the theoretically predicted operating point with a difference of less than 0.5%. However, the pressure and temperature at the measured point of the second-stage outlet are higher by approximately 20 kPa (approximately 15%) and by approximately 2.4 K than those at the predicted operating point, respectively. This shows that the predicted operating point is low. The predicted operating point when operated at +5%vr in the first stage of DR-33 is indicated by an open symbol and a short-dashed line in Figure 11b. Even when the deviation of the specific volume ratio increases in the first stage, the predicted operating point at the second-stage outlet is low, and the predicted operating range is lower than the measured point. When we examine the operation characteristics of a general centrifugal compressor, if the operating flow rate decreases at a fixed rotational speed, the outlet pressure and temperature become higher than the design points. Because a decrease in the flow rate implies operation at an off-design point, the operation information for the off-design point of R-134a needs to be compared. On the other hand, from the systematic viewpoint of the chiller, because a low-pressure refrigerant was injected into a medium-pressure refrigerant system, the thermodynamic problem occurring in the condenser and evaporator can be considered. If the drop-in test of R-1234ze (E) and R-1233zd (E) can be performed on a turbo chiller for a low-pressure refrigerant, the thermodynamic influence of the heat exchanger can be analysed with complexity.
Table 5 compares the total pressure ratio, polytropic efficiency, and gas power at the calculated operating point of the alternative refrigerant with the design conditions of R-134a. This shows that the operating pressure ratios of the first and second stages are similar even with a different refrigerant. In the case of DR-34, the efficiency of the second stage is lower than that of the first stage, but they are more similar in the case of DR-33. The gas power increases in the second stage for both compressors because the increase of flow rate due to the economizer in the second stage of R-134a was reflected when the predicted performance of the drop-in test was calculated. Furthermore, DR-33 has a very low gas power owing to the lower density and operating flow rate compared to other refrigerants.

6. Conclusions

In this study, a low-GWP alternative refrigerant was used in the centrifugal compressor of a conventional R-134a turbo chiller, and the performance of the centrifugal compressor in each stage, which is required for the drop-in test, was predicted. A performance prediction method was proposed by changing the existing performance test code, and the predicted operating range and operating point were calculated using the proposed method. The following conclusions were obtained from this study.
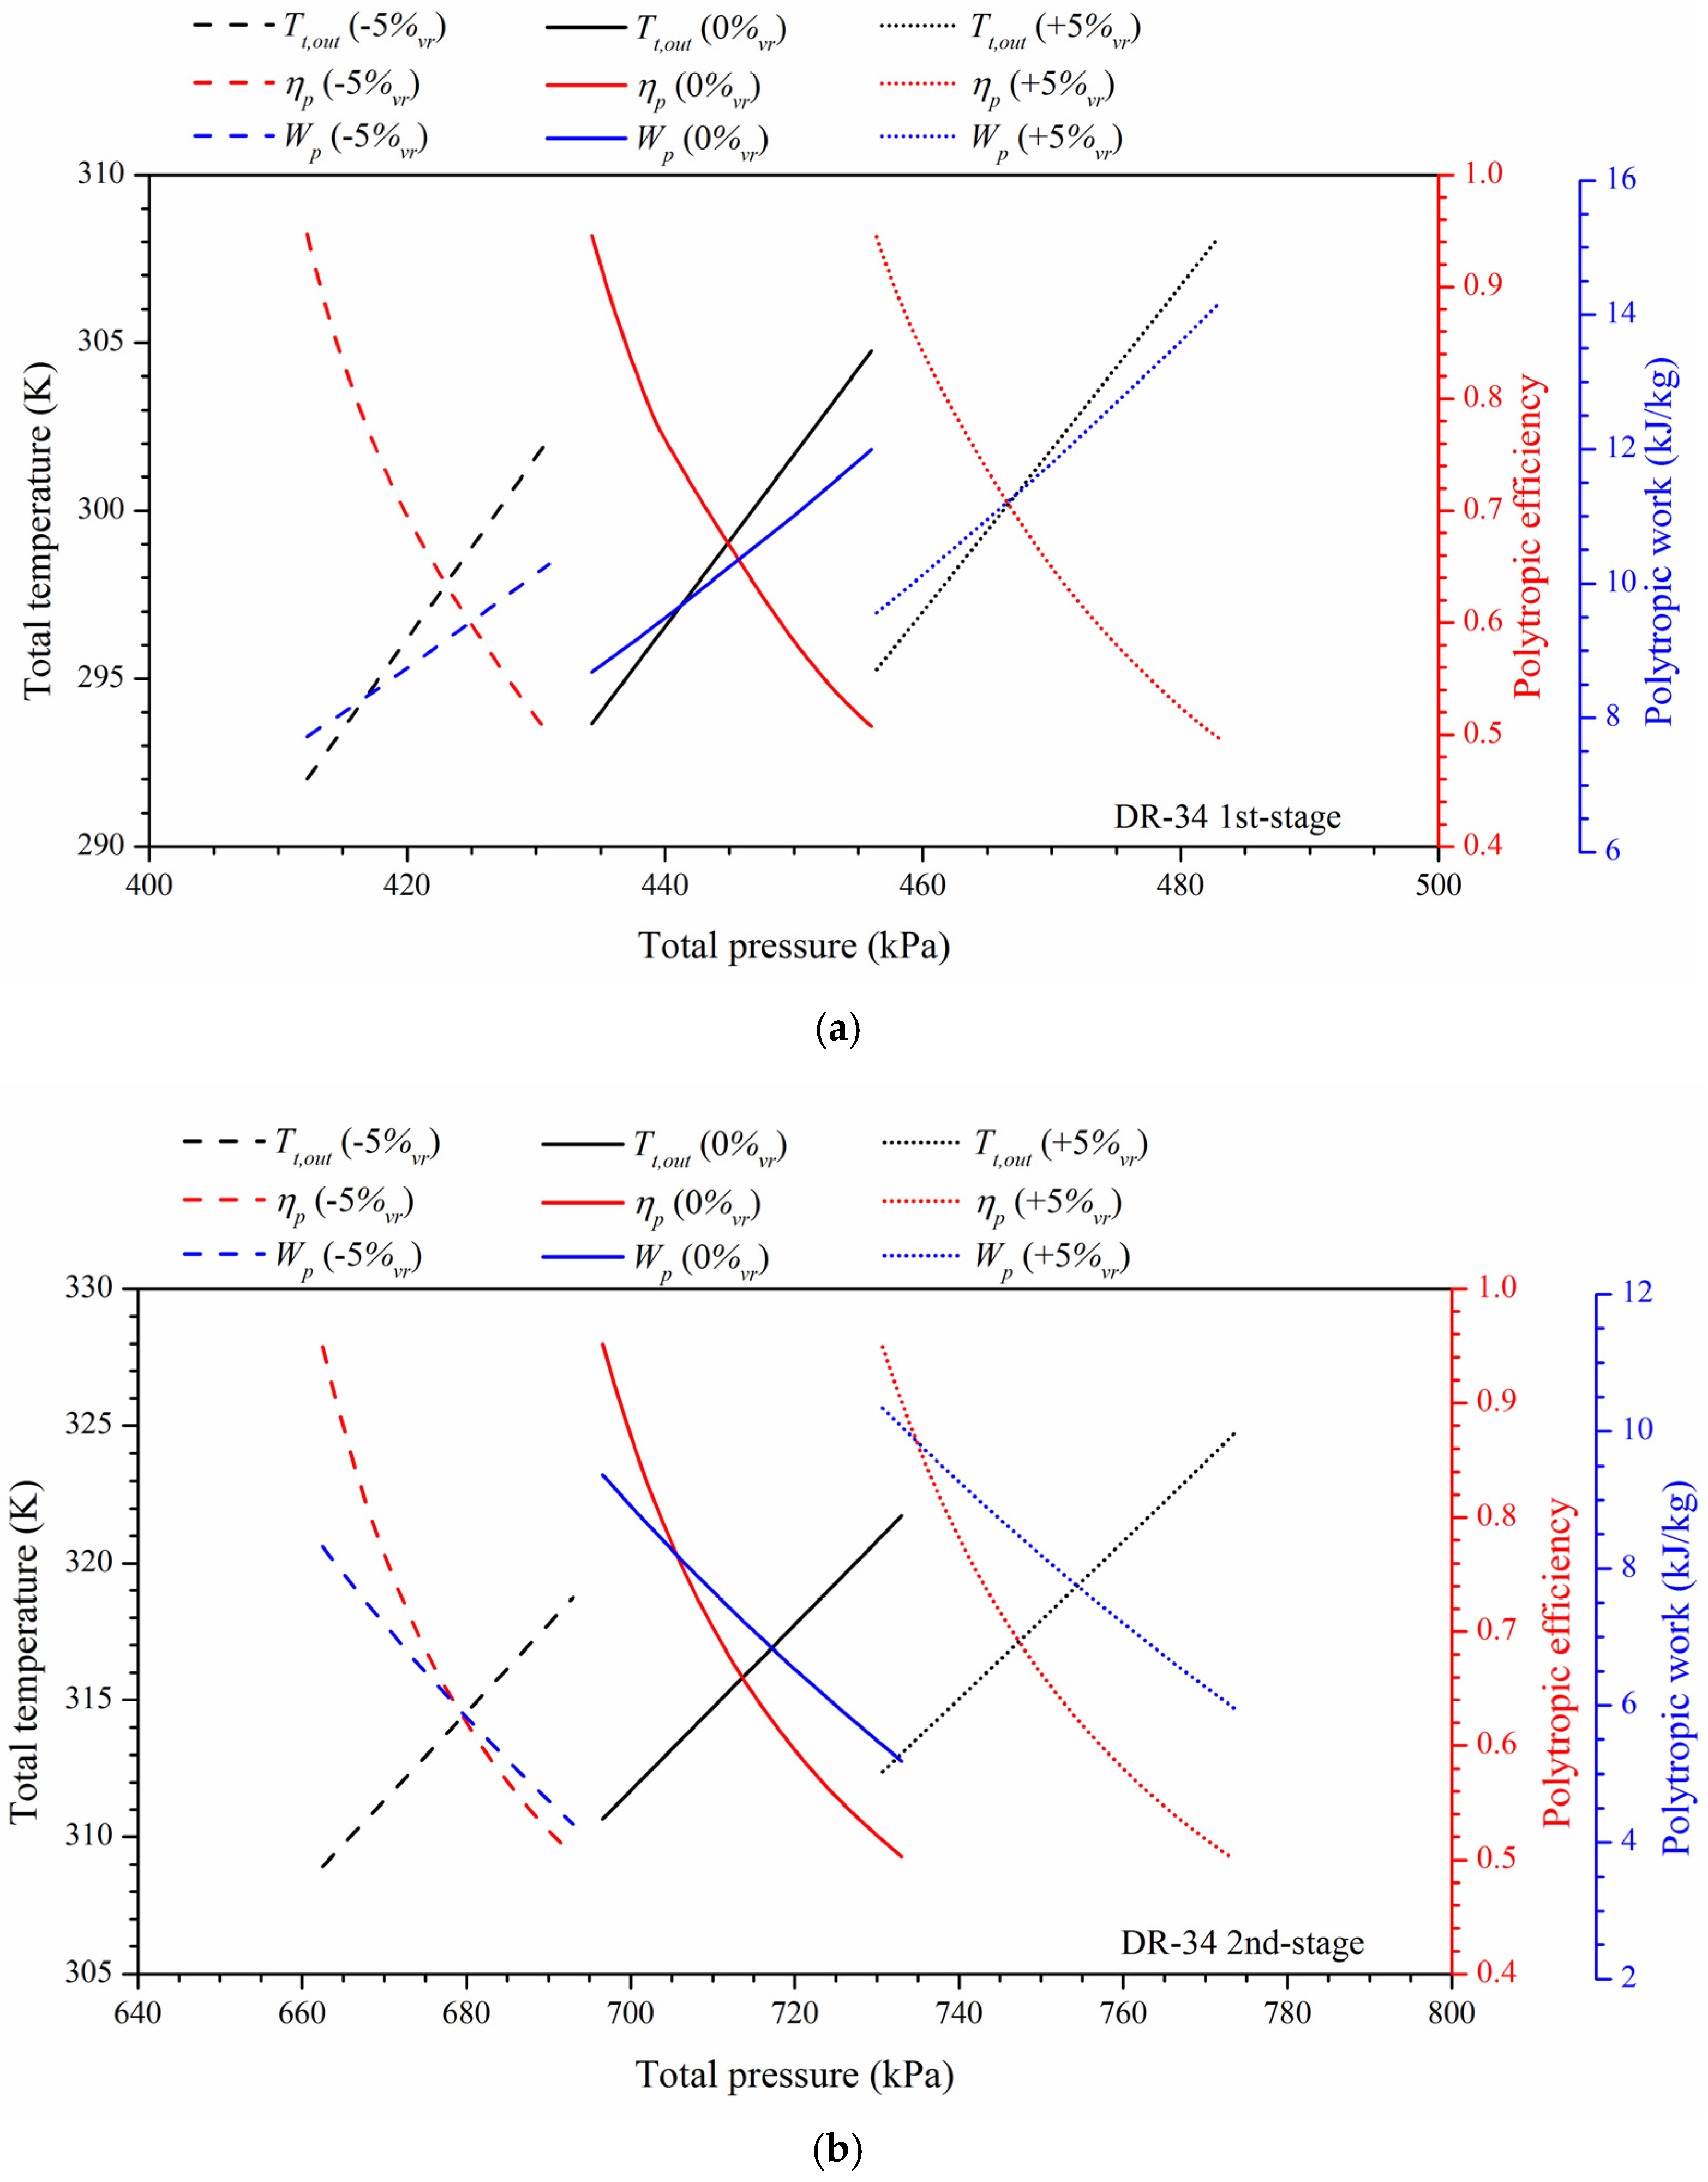
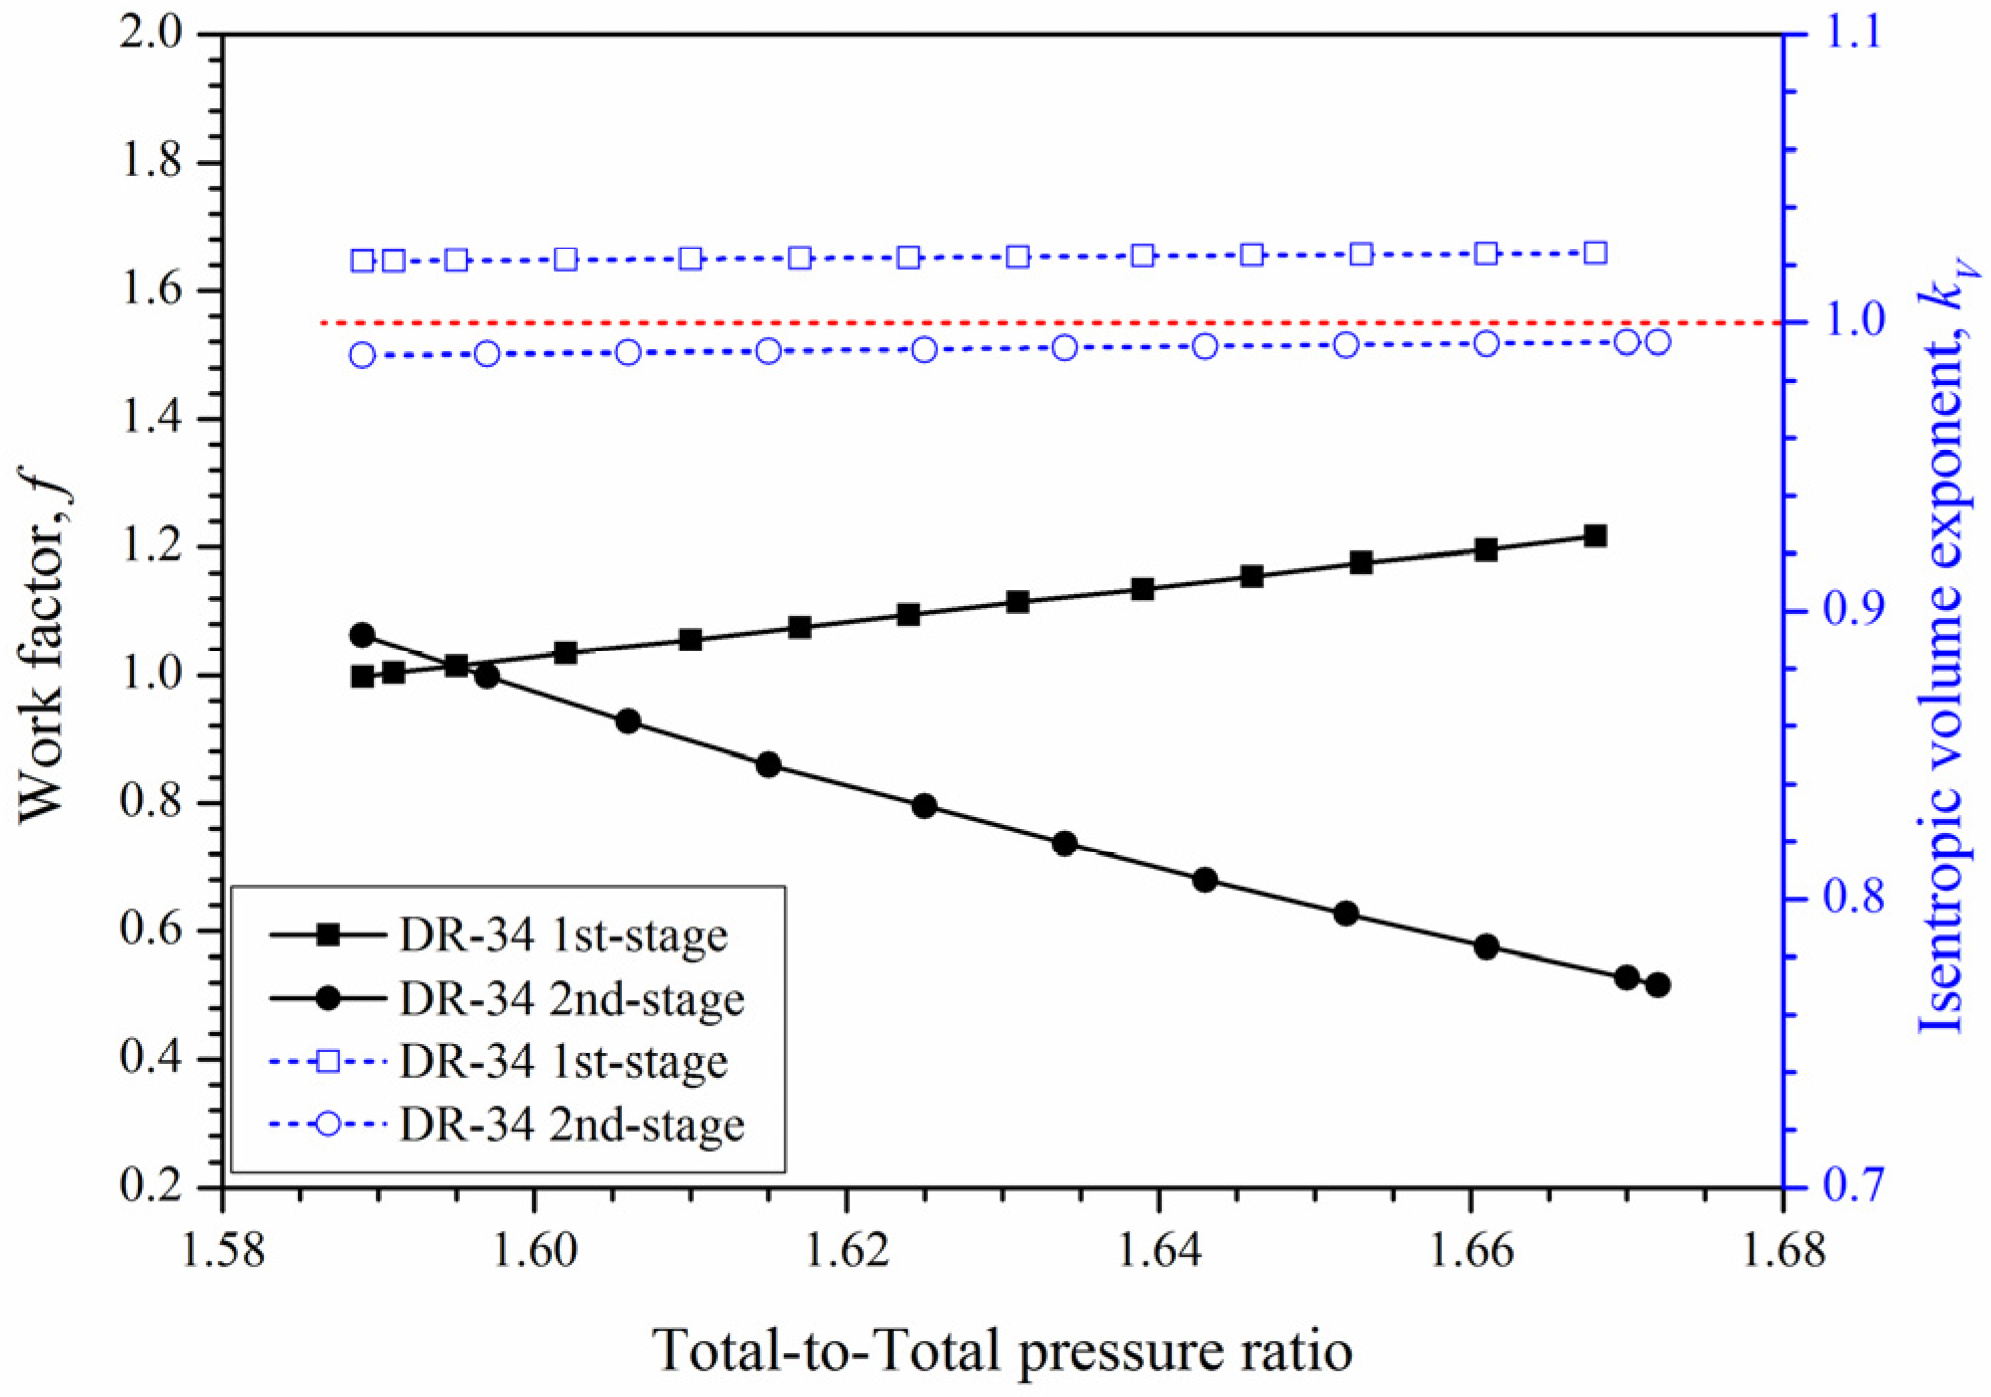
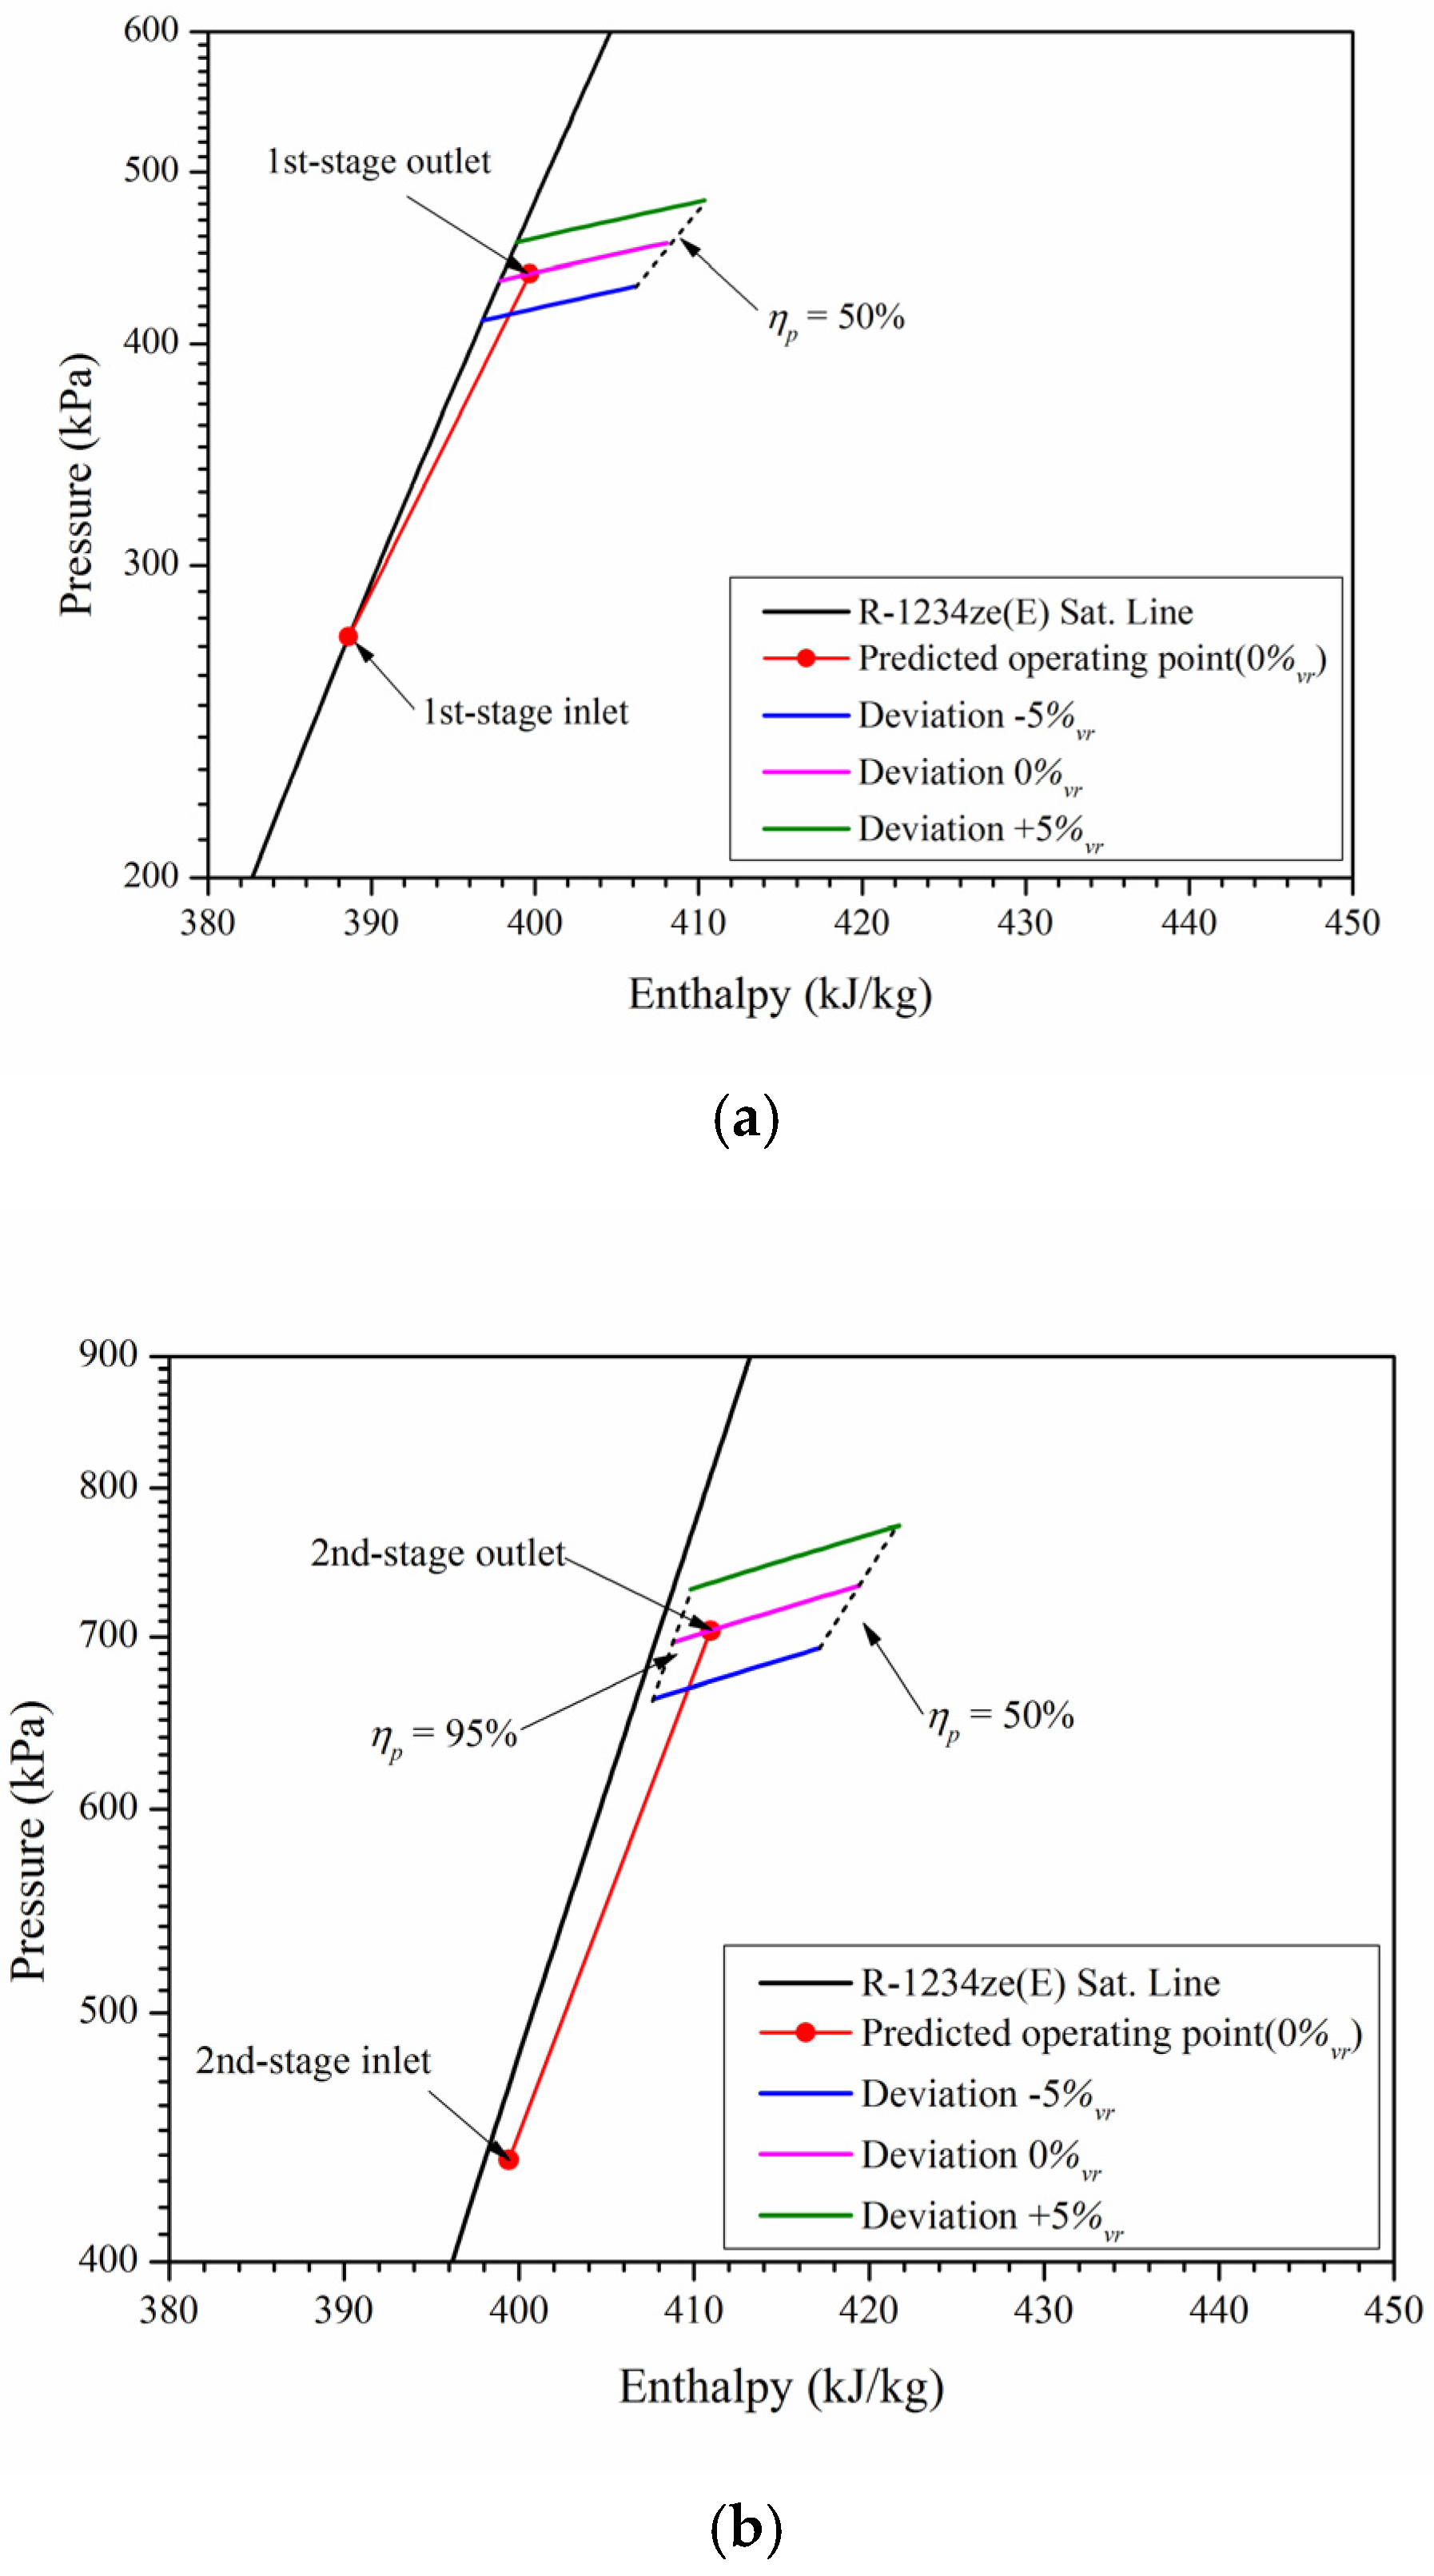
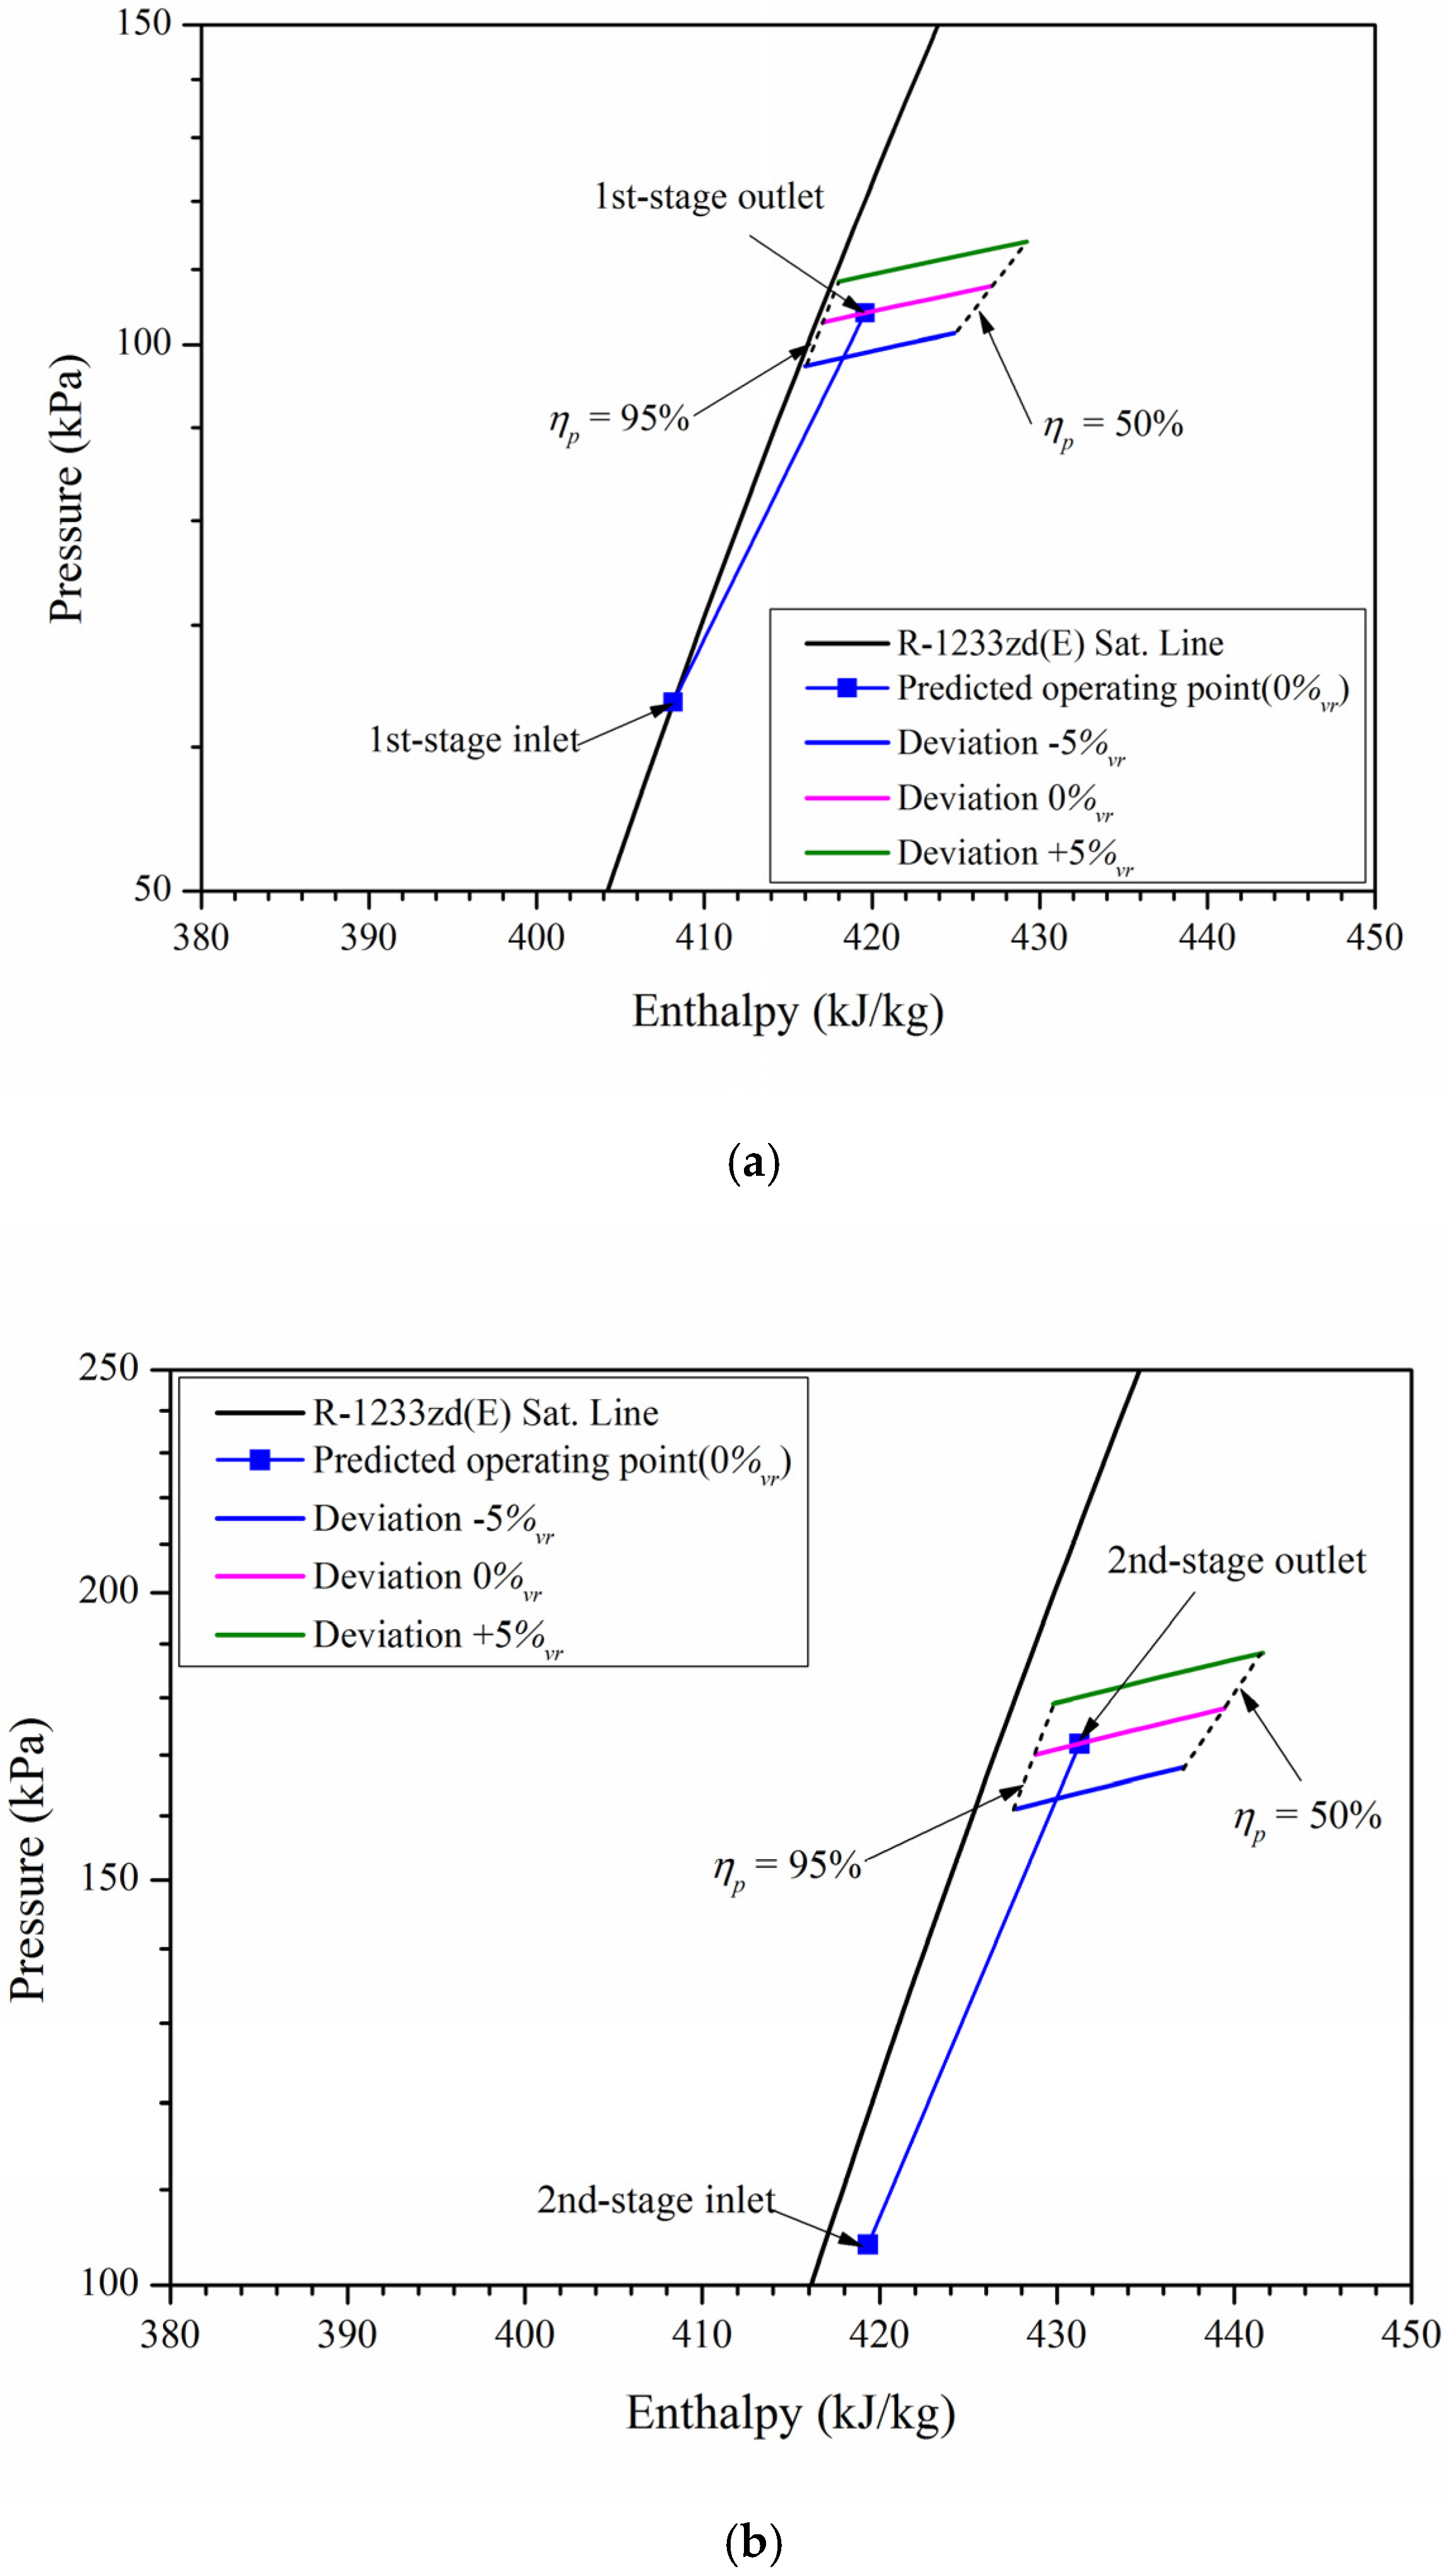
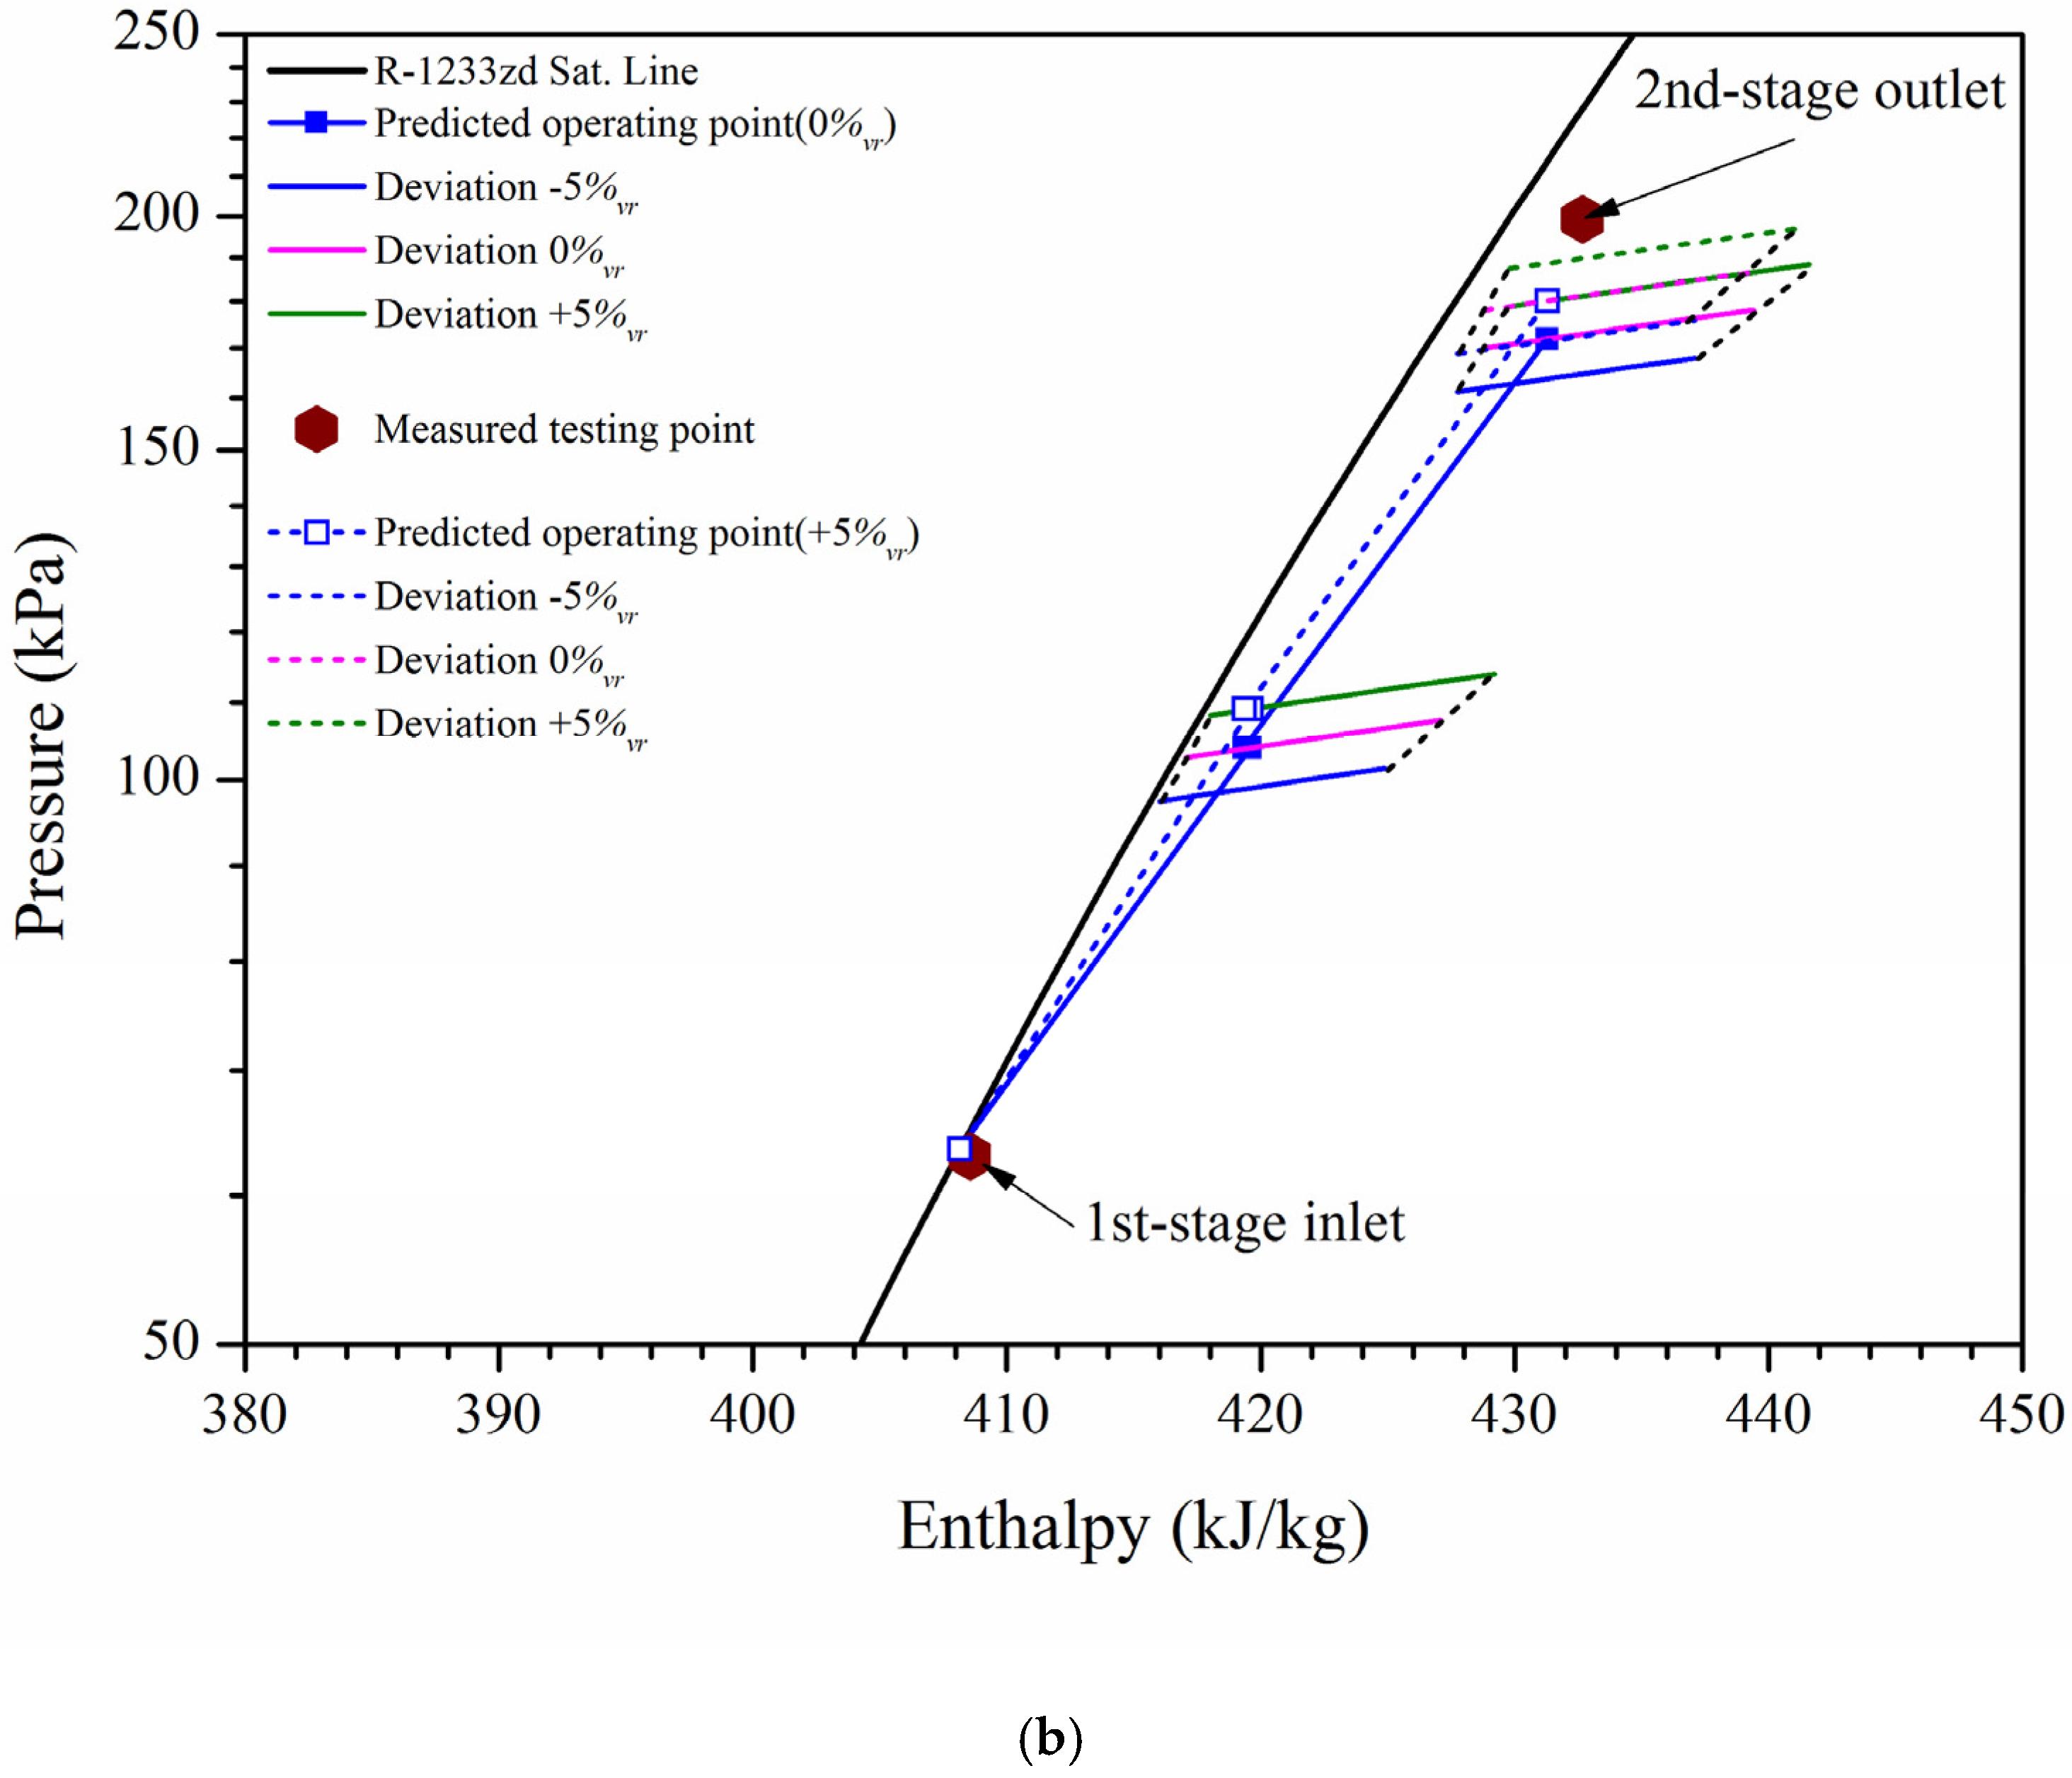
Polytropic work, which is one of the thermodynamic performance variables of a centrifugal compressor, was found to be affected by the isentropic volume exponent value. In the predicted operating ranges of DR-34 and DR-33, the temperature difference between the deviations of the specific volume ratios was approximately 3 K at 95% polytropic efficiency and approximately 6 K or less at 50% polytropic efficiency. This shows that the predicted operating range calculated based on the permissible deviation of ASME PTC-10 is sensitive to temperature at the same efficiency point. The predicted operating range of DR-33 was small because the pressure difference between the deviations of the specific volume ratio was smaller than that of DR-34.
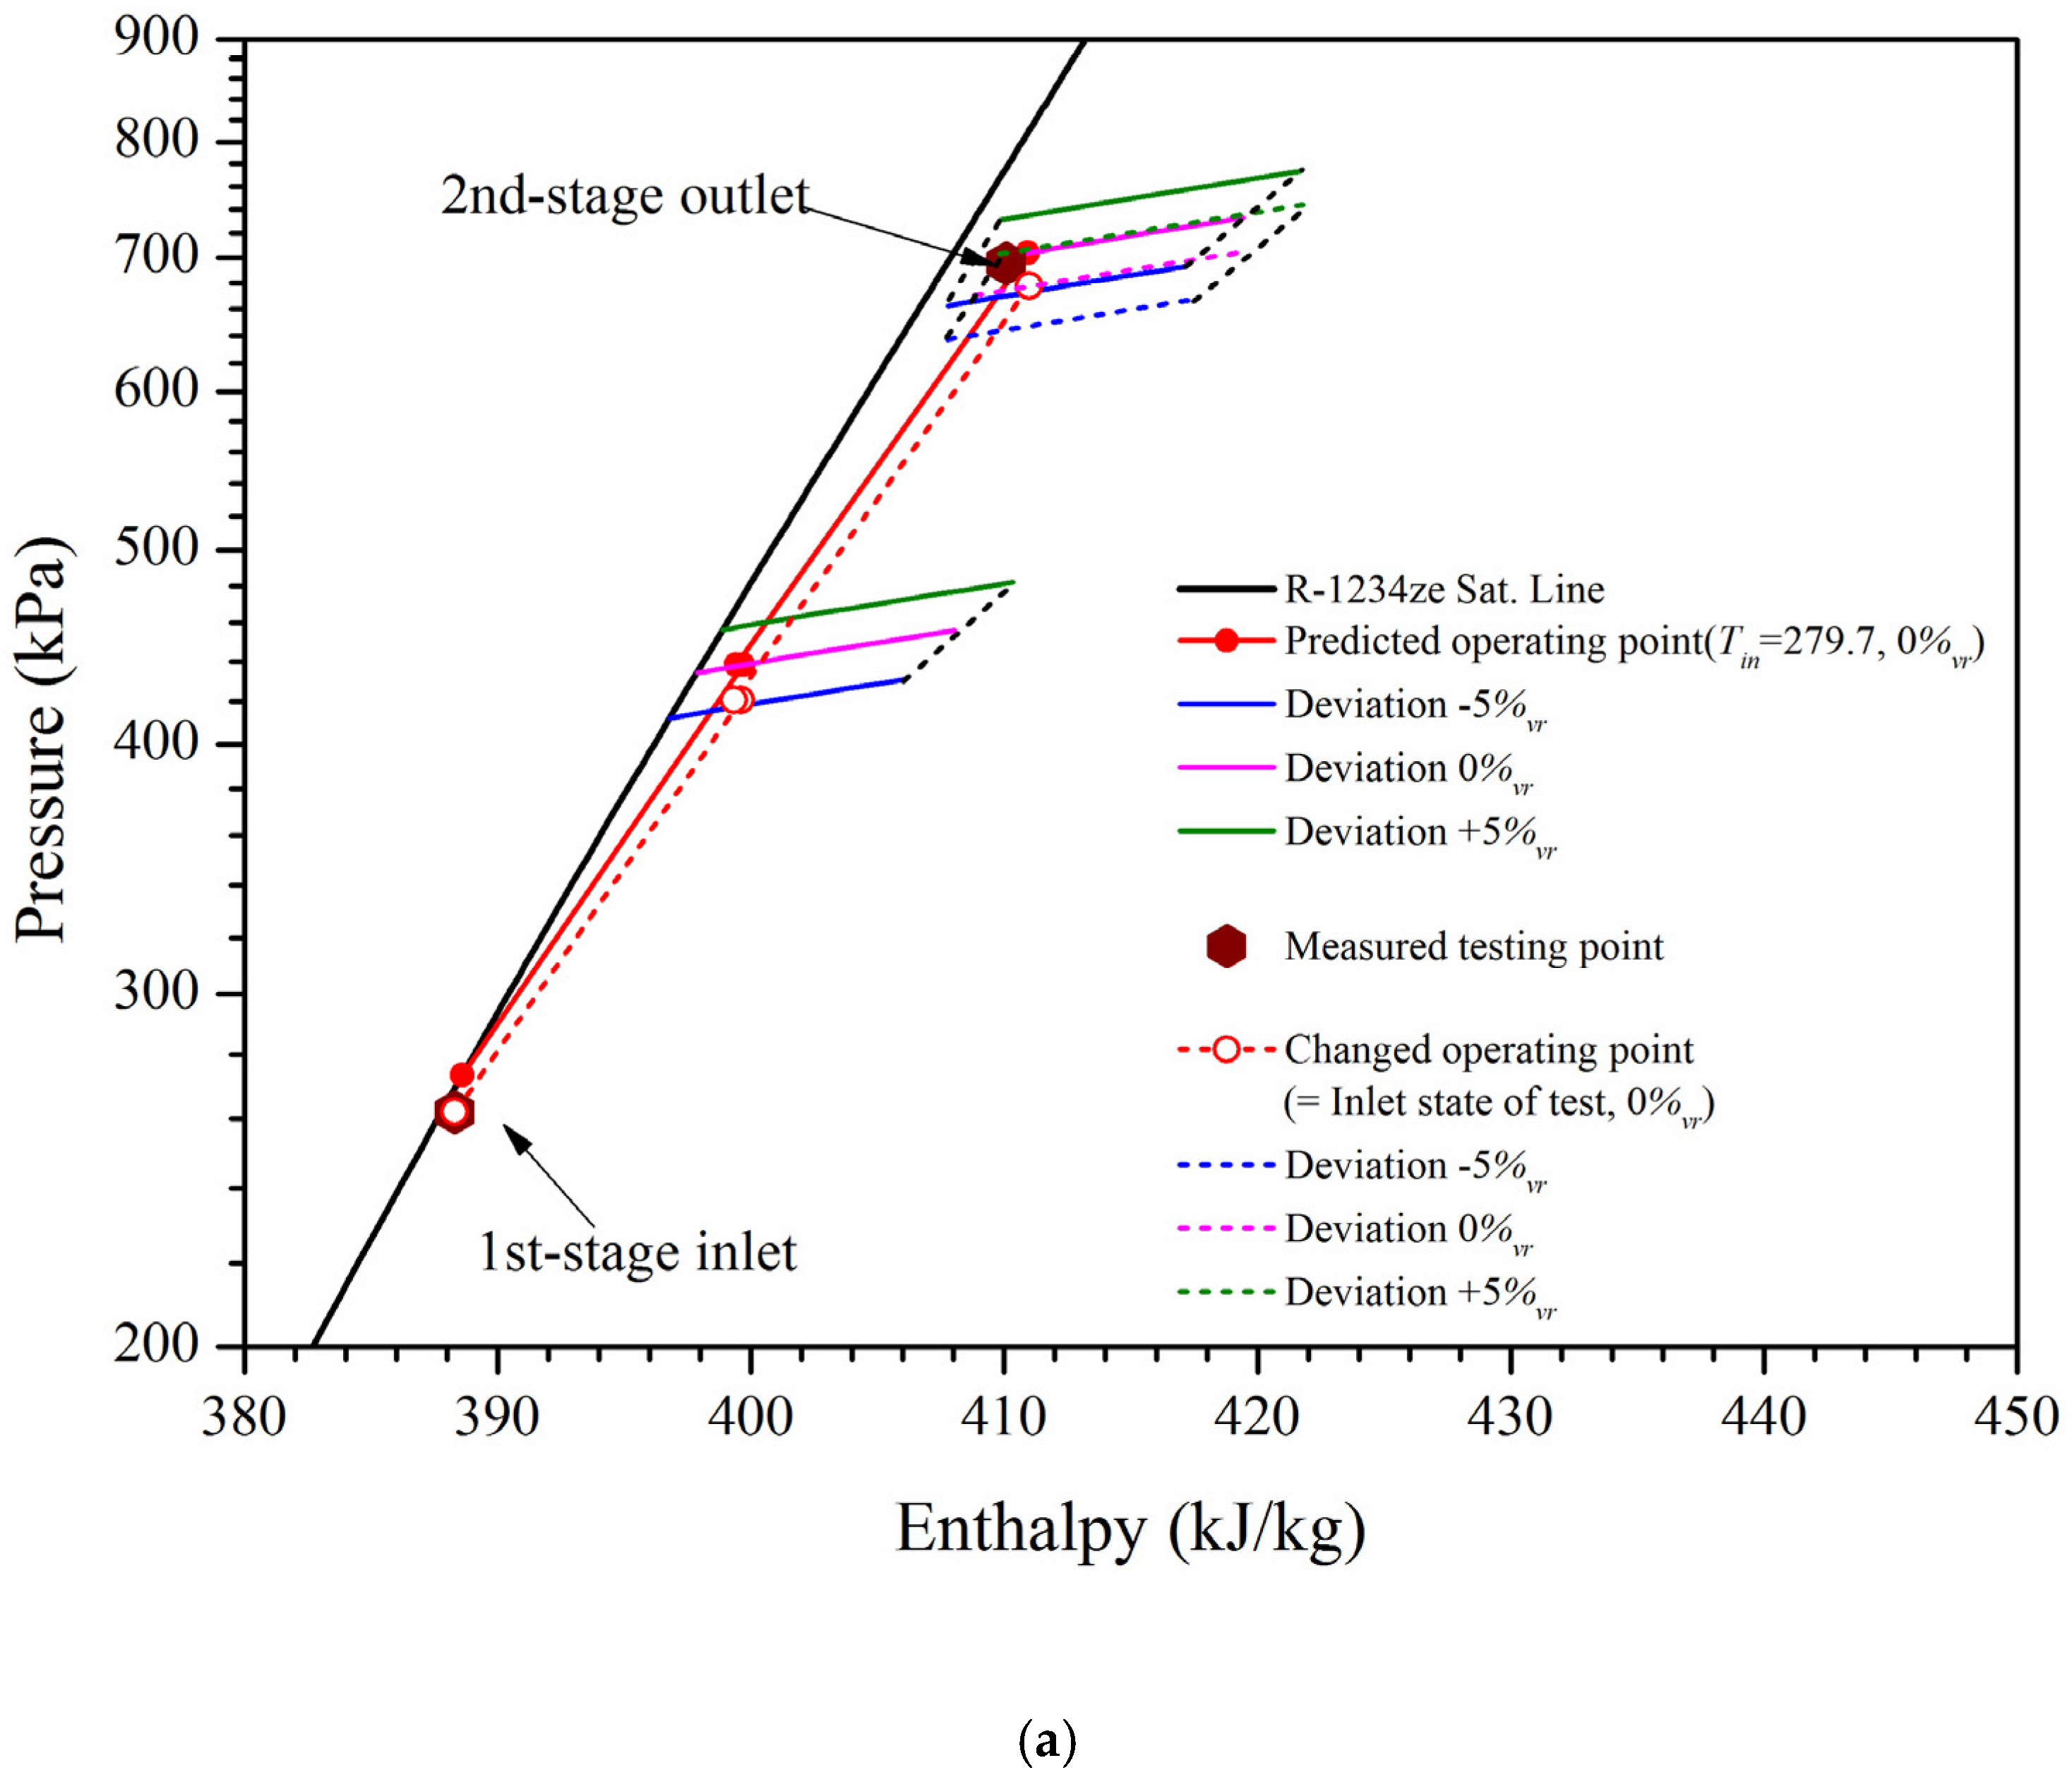
The predicted operating point at the stage-two outlet of DR-34 was higher by approximately 1.2% than that of the drop-in test. If the operating point was predicted by changing the stage-one inlet condition to the test result, the pressure at the stage-two outlet was lower by approximately 2.6% compared to the measured value. Although there was a quantitative deviation between the measured and predicted operating points because the test result was in the predicted operating ranges for the two conditions, the proposed method predicted the operating range of DR-34 well.
In the case of DR-33, the predicted operating point and operating range were generally lower than the test results. A more accurate evaluation requires additional analysis based on the off-design points of R-134a and thermodynamic influence of the heat exchanger.
In this study, we proposed a performance prediction method that can be used to predict the operating range and operating point of the drop-in test of alternative gases by using the performance test code of an existing centrifugal compressor. The proposed method can be used to predict and evaluate the performance in each stage of a multi-stage centrifugal compressor. The results proved that the performance of a centrifugal compressor can be predicted when operated with an alternative gas based on limited information about factors such as design conditions and shapes.
Furthermore, additional information about the off-design points of a centrifugal compressor will be helpful for identifying the predicted operating range and operating point more precisely.

Acknowledgments

This research was supported by the Technology Innovation Program (Grant No. 10052999) by the Ministry of Trade, Industry & Energy.

Author Contributions

All authors contributed to this work by collaboration. Joo Hoon Park is the main author of this manuscript. Youhwan Shin and Jin Taek Chung assisted and provided useful suggestions in the contents of research. All authors revised and approved the publication.

Conflicts of Interest

The authors declare no conflict of interest.

Nomenclature

GWPGlobal warming potential
HFOsHydrofluoroolefins
ODPOzone depletion potential
ACross-sectional area of flow channel (m2)
aAcoustic velocity (m/s)
bTip width (m)
CpSpecific heat at constant pressure (N·m/kg·K)
DDiameter (m)
fWork factor of Schultz
hEnthalpy of total state (kJ/kg)
KTIsothermal bulk modulus (kPa)
kVIsentropic volume exponent
kRatio of specific heats (Cp/Cv)
MmMachine Mach number
MaFluid Mach number
mPolytropic temperature exponent
NRotational speed (rpm)
nPolytropic volume exponent
PgGas power (kW)
pPressure of total state
QVolume flow rate at inlet (m3/s)
RGas constant (N·m/kg·K)
RAMachine Reynolds number correction constant
RBMachine Reynolds number correction constant
RCMachine Reynolds number correction constant
RemMachine Reynolds number
TTemperature of total state (K)
UTangential speed (m/s)
VAveraged fluid velocity (m/s)
vSpecific volume (m3/kg)
vrSpecific volume ratio
%vrPercentage of deviation between specific volume ratios
WWork (N·m/kg)
XCompressibility function of Schultz
YCompressibility function of Schultz
ZCompressibility factor
m ˙ Mass flow rate (kg/s)
αVolume expansivity (1/K)
ηEfficiency
μAbsolute viscosity (kg/m·s)
νKinematic viscosity (m2/s)
ρDensity (kg/m3)
ΦFlow coefficient

Subscripts

imp, outImpeller outlet
corrCorrected state
dDesign condition or result
inInlet
isIsentropic state
mArithmetic mean
maxMaximum value
minMinimum value
outOutlet
pPolytropic state
recalRecalculation
sStatic state
tTest condition or result
vrSpecific volume ratio

References

  1. Wang, X.; Amrane, K.; Johnson, P. Low global warming potential (GWP) alternative refrigerants evaluation program (Low-GWP AREP). In Proceedings of the International Refrigeration and Air Conditioning Conference, West Lafayette, IN, USA, 16–19 July 2012; Volume 2233, pp. 1–7. [Google Scholar]
  2. Spatz, M.W.; Sethi, A.; Yana Motta, S.F. Latest Developments of Low Global Warming Refrigerants for Chillers. In Proceedings of the International Refrigeration and Air Conditioning Conference, West Lafayette, IN, USA, 16–19 July 2012; Volume 2595, pp. 1–7. [Google Scholar]
  3. Ueda, K.; Hasegawa, Y.; Wajima, K.; Nitta, M.; Kamada, Y.; Yokoyama, A. Deployment of a new series of eco turbo ETI chillers. Mitsubishi Heavy Ind. Tech. Rev. 2012, 49, 56–62. [Google Scholar]
  4. Brasz, J.J. Oil-free Centrifugal Refrigeration Compressors: From HFC134a to HFO1234ze (E). In Proceedings of the 8th International Conference on Compressors and their Systems, London, UK, 9–10 September 2013; pp. 9–10. [Google Scholar]
  5. Pearson, A.B. R-1234ze for Variable Speed Centrifugal Chillers. In Proceedings of the Institute of Refrigeration Session 2012–2013; The Institute of Refrigeration: London, UK, 2013; pp. 1–16. Available online: http://turbocor.com/uploaded/1304_Pearson%20TG310%20in%20London.pdf (accessed on 4 September 2017).
  6. Mota-Babiloni, A.; Navarro-Esbrí, J.; Barragan, A.; Moles, F.; Peris, B. Drop-in energy performance evaluation of R1234yf and R1234ze (E) in a vapor compression system as R134a replacements. Appl. Therm. Eng. 2014, 71, 259–265. [Google Scholar] [CrossRef]
  7. Wu, Y.; Thilges, C. Centrifugal Compressor Performance Deviations with Various Refrigerants, Impeller Sizes and Shaft Speeds. In Proceedings of the International Compressor Engineering Conference, West Lafayette, IN, USA, 14–17 July 2014; Volume 1225, pp. 1–12. [Google Scholar]
  8. Janković, Z.; Atienza, J.S.; Suárez, J.A.M. Thermodynamic and heat transfer analyses for R1234yf and R1234ze (E) as drop-in replacements for R134a in a small power refrigerating system. Appl. Therm. Eng. 2015, 80, 42–54. [Google Scholar] [CrossRef]
  9. Meng, Z.; Zhang, H.; Qiu, J.; Lei, M. Theoretical analysis of R1234ze (E), R152a, and R1234ze (E)/R152a mixtures as replacements of R134a in vapor compression system. Adv. Mech. Eng. 2016, 8, 1–10. [Google Scholar] [CrossRef]
  10. Sethi, A.; Yana Motta, S. Low GWP Refrigerants for Air Conditioning and Chiller Applications. In Proceedings of the International Refrigeration and Air Conditioning Conference, West Lafayette, IN, USA, 11–14 July 2016; Volume 2649, pp. 1–8. [Google Scholar]
  11. TRANE CenTraVac Chillers. Available online: http://www.trane.com/commercial/north-america/us/en/products-systems/equipment/chillers/water-cooled-chiller/centrifugal-liquid-cooled-chillers/earthwise-centravac.html (accessed on 4 September 2017).
  12. Mitsubishi Heavy Industries. Development of Centrifugal Chiller and Heat Pump Using Low GWP Refrigerant. Available online: http://hpc2017.org/wp-content/uploads/2017/06/o341.pdf (accessed on 4 September 2017).
  13. Danfoss Turbocor TG310. Available online: http://refrigerationandairconditioning.danfoss.kr/products/compressors-for-air-conditioning-and-heating/tg/#/ (accessed on 4 September 2017).
  14. Air-Conditioning, Heating, and Refrigeration Institute. AHRI Low–GWP Alternative Refrigerants Evaluation Program 2015. Available online: www.ahrinet.org/arep.aspx (accessed on 1 August 2017).
  15. ASME PTC-10:1997. Performance Test code on Compressors and Exhausters; ASME: New York, NK, USA, 1997. [Google Scholar]
  16. Schultz, J.M. The polytropic analysis of centrifugal compressors. J. Eng. Power 1962, 84, 69–82. [Google Scholar] [CrossRef]
  17. ISO 5389:2005. Turbocompressors—Performance Test Code; International Organization for Standardization: Geneva, Switzerland, 2005. [Google Scholar]
  18. Lemmon, E.W.; Huber, M.L.; McLinden, M.O. NIST Standard Reference Database 23: Reference Fluid Thermodynamic and Transport Properties—REFPROP (Version 9.1); National Institute of Standards and Technology, Standard Reference Data Program: Gaithersburg, MD, USA, 2013.
  19. HFO-1234yf, 1234ze(E), 1234ze(E), 1233zd(E), and Refrigerant Mixtures in Answers to Frequently Asked Questions. Available online: https://pages.nist.gov/REFPROP-docs (accessed on 1 February 2017).
  20. Thol, M.; Lemmon, E.W. Equation of State for the Thermodynamic Properties of trans-1,3,3,3-Tetrafluoropropene [R-1234ze (E)]. Int. J. Thermophys. 2016, 37, 28. [Google Scholar] [CrossRef]
Figure 1. Procedure for predicting performance using alternative refrigerants.
Energies 10 02043 g001
Figure 2. Allowable range diagram: (a) machine Mach number and (b) machine Reynolds number adapted from [15], with permission from 2017 American Society of Mechanical Engineers, 2017.
Energies 10 02043 g002
Figure 3. Comparison of thermodynamic diagrams for R-134a, R-1234ze (E), and R-1233zd (E). (a) Pressure-enthalpy diagram and (b) pressure-temperature diagram.
Energies 10 02043 g003aEnergies 10 02043 g003b
Figure 4. Centrifugal chiller and its drop-in test using low-GWP alternative refrigerants. (a) Centrifugal chiller for the drop-in test and (b) meridional plane.
Energies 10 02043 g004
Figure 5. Pressure-enthalpy diagram with the theoretical operational cycle of the R-134a centrifugal compressor at 100% load.
Energies 10 02043 g005
Figure 6. Comparison of allowable range diagrams for alternative gases. (a) Allowable machine Mach number and (b) allowable machine Reynolds number.
Energies 10 02043 g006
Figure 7. Comparison of outlet total temperature, polytropic efficiency, and polytropic work for a permissible range of −5%vr to +5%vr for DR-34. (a) First-stage compressor at Φ = 0.036 and (b) second-stage compressor at Φ = 0.026.
Energies 10 02043 g007
Figure 8. Comparison of work factor and isentropic volume exponent for each stage of DR-34 at 0%vr.
Energies 10 02043 g008
Figure 9. Calculated operating range and operating point for DR-34. (a) First stage and (b) second stage.
Energies 10 02043 g009
Figure 10. Calculated operating range and operating point for DR-33. (a) First stage and (b) second stage.
Energies 10 02043 g010
Figure 11. Comparison of predicted results and drop-in test results for (a) DR-34 and (b) DR-33.
Energies 10 02043 g011aEnergies 10 02043 g011b
Table 1. Permissible deviations from specified operating parameters [15].
Permissible Deviations from Specified Operating Parameters
ParameterSymbolLimit of Test Values as Percentage of Design Values
Min.Max.
Specific volume ratio%vr95%105%
Flow coefficientΦ96%104%
Machine Mach numberMmSee Figure 2a
Machine Reynolds numberRemSee Figure 2b
Table 2. Environmental impact and thermodynamic properties of refrigerants.
RefrigerantR-134aR-1234ze (E)R-1233zd (E)
ODP000
GWP130065
Molar mass (kg/kmol)102.03114.04130.50
Critical temperature (K)374.21382.51439.60
Critical pressure (kPa)4059.33634.93623.7
Critical density (kg/m3)511.90489.24480.23
Table 3. Inlet conditions of R-134a compressor and constrain conditions of alternative refrigerants for performance predictions at 100% load state.
RefrigerantSymbolUnitR-134a (Ref.)R-1234ze (E)R-1233zd (E)
Rotational speedNrpmFixed rotational speed
1st stageInlet total pressurepinkPa367.0273.463.6
Inlet total temperatureTinK279.7279.7279.7
Specific volume ratiovr-1.571.49~1.651.49~1.65
Deviation of specific volume ratios%vr--−5%~+5%−5%~+5%
Flow coefficientΦ-0.036
2nd stageInlet total pressurepinkPa591.3Using calculated data from 1st stageUsing calculated data from 1st stage
Inlet total temperatureTinK297.4
Specific volume ratiovr-1.591.51~1.671.51~1.67
Deviation of specific volume ratios%vr--−5%~+5%-5%~+5%
Flow coefficientΦ-0.026
Table 4. Minimum and maximum value of pressure and temperature at outlet by deviation of specific volume ratios for polytropic efficiencies of 50% and 95%.
DR-34Deviation of Specific Volume RatiosPmin (kPa)Tmin (K)Pmax (kPa)Tmax (K)
1st stage−5%vr412.3292.0431.0302.2
0%vr434.3293.7456.0304.8
5%vr456.4295.3482.0307.7
Δ%vr (=5%vr – (−5%vr))44.13.3515.5
2nd stage−5%vr662.5308.9693.0318.7
0%vr696.6310.6733.0321.7
+5%vr730.7312.4773.5324.7
Δ%vr (=5%vr – (−5%vr))68.23.580.56
Polytropic efficiency95%50%
DR-33Deviation of Specific Volume RatiosPmin (kPa)Tmin (K)Pmax (kPa)Tmax (K)
1st stage−5%vr97.4290.8101.4301.8
0%vr102.8292.3107.7304.7
5%vr108.3293.7113.9307.4
Δ%vr (=5%vr – (−5%vr))10.92.912.55.6
2nd stage−5%vr161.1307.1167.9318.3
0%vr170.0308.7178.1321.3
+5%vr178.9310.1188.3324.1
Δ%vr (=5%vr – (−5%vr))17.8320.45.8
Polytropic efficiency95%50%
Table 5. Performance prediction results of alternative refrigerants at predicted operating points.
RefrigerantSymbolR-134aR-1234ze (E)R-1233zd (E)
Deviation of specific volume ratio%vr-00
1st stageTotal-to-total pressure ratiopr1.611.601.64
Polytropic efficiency (%)ηp86.780.776.1
Gas power (kW)Pg120.898.624.8
2nd stageTotal-to-total pressure ratiopr1.611.611.65
Polytropic efficiencyηp87.779.477.2
Gas power (kW)Pg138.7100.2528.4

