100% Renewable Energy Supply for Brazil—The Role of Sector Coupling and Regional Development


1
DLR—German Aerospace Center, Institute of Engineering Thermodynamics, Pfaffenwaldring 38-40, 70569 Stuttgart, Germany
2
Energy Planning Program, Graduate School of Engineering, Universidade Federal do Rio de Janeiro, Centro de Tecnologia, Bloco C, Sala 211, Cidade Universitária, Ilha do Fundão, 21941-972 Rio de Janeiro, RJ, Brazil
3
Departamento de Ingeniería Mecánica, Escuela Politécnica Nacional, Ladrón de Guevara E11-253, 17-01-2759 Quito, Ecuador
*
Author to whom correspondence should be addressed.
Energies 2017, 10(11), 1859; https://doi.org/10.3390/en10111859
Submission received: 29 September 2017
/
Revised: 6 November 2017
/
Accepted: 8 November 2017
/
Published: 13 November 2017
(This article belongs to the Section D: Energy Storage and Application)
Abstract
:With its abundance of renewable energy potentials, not only for hydropower and bioenergy, but also for wind and solar, Brazil provides good prospects for a carbon neutral energy system. The role of an enhanced coupling of the power, heat and transport sectors in such systems is not yet fully understood. This paper analyses the least-cost composition and operation of a fully renewable power supply system as part of a carbon neutral energy supply in Brazil. It relies on the application of the high-resolution energy system model REMix. Our analysis reveals that the expansion of wind and solar power is more cost-efficient than the construction of additional hydroelectric plants. This is favoured because the existing hydroelectric plants offer large capacity of dispatchable power to compensate for fluctuations, and thus no additional storage is necessary. Furthermore, the REMix analysis indicates that varying shares of solar and wind power technologies as well as the spatial distribution of power generation have only a small influence on supply costs. This implies that the transformation strategy in Brazil can be primarily based on other criteria such as regional development, public acceptance, environmental impact or industrial policy without major impacts on system costs.
1. Introduction
Renewable energy (RE) sources are a proven option to reduce greenhouse gas (GHG) emissions. However, it is still a major challenge to integrate large shares of variable renewable energy (VRE) into the power system. This is specifically the case for strongly developing countries, which additionally have to cope with a strong increase in energy and power demand in the future. Brazil is a typical newly industrialized country, featuring a large population and considerable economic growth. Today, Brazil already covers 60% of its power demand by hydro and another 10% by biomass and wind power (Figure 1) [1,2]. However, its primary energy supply is dominated by fossil fuels, mainly oil (36%) and gas (14%). Biomass is another main pillar, covering a broad range from traditional biomass use in the residential sector to modern biofuel applications for power generation and transport fuels. However, the future increase in energy demand is expected to be covered also by an expansion of fossil fuel installations and the dependency on hydropower leads to a high vulnerability with regard to droughts [3,4], which have recently heavily disturbed the Brazilian power supply [5].
Nevertheless, the abundance of RE potentials, not only for hydropower and energy production from biomass, but also for wind and solar energy provides good prospects for a completely renewable supply of power, heat, and transport fuels. Biofuels and the large scale use of sugar cane residues, including second generation technologies have long been one major focus of technology development [6,7,8,9]. Agricultural and agro-industrial residues also have a large energetic potential in Brazil [10]. Wind power and solar power not only have large potentials in Brazil [11,12], but are also considered to be cost efficient [13]. Resource assessments in high spatial resolution have been provided for solar global horizontal irradiation [14,15], direct normal irradiation [16] and wind speed [17], revealing that particularly good potentials are located in the western and northwestern part of the country. With reservoir hydro stations as a source of flexibility, the power system is expected to easily balance substantial shares of VRE generation without increasing demand for fossil backup power plants [5,18,19,20]. Nevertheless, Saporta [21] mentioned that the flexibility provided by hydropower plants with reservoirs in Brazil can be constrained by the multiple uses of water for environmental, social and economic purposes. Additional benefits are expected for the stability of the power system through a diversification with wind and solar [5,15,20]. Several studies have investigated the future role of RE across the whole energy system and identified considerable potential for their implementation [22,23,24,25,26]. Nevertheless, according to [27], high wind penetration (65%) in the Northeast power system of Brazil might not happen without curtailment, mainly due to inflexibility constraints in Brazilian power plants and also to transmission limits. While reference [15] explore a 100% renewable power sector, the scenarios for the whole energy system eventually require a backup from fossil resources especially for heat and transport. Their scenario is dominated by solar photovoltaic (PV), and also evaluates the potential role of a production of synthetic methane for industrial purpose from renewable electricity. Different alternatives to a hydropower expansion have been assessed by [28]. Their scenarios particularly focus on wind power and natural gas, and are also limited to the power sector. An integrated energy system model for Brazil has been applied in [26,29,30]. Their model provides a very detailed representation of sectoral energy demands, but is limited in its temporal resolution. The role of enhanced sector coupling has also been studied to some degree in [25,31].
A transformation beyond 80% RE in the overall energy system is specifically challenging: in the power sector, seasonal storage becomes almost unavoidable at high VRE shares [32]. Furthermore, a replacement of all fossil fuels for combustion engines must be provided at reasonable costs for passenger as well as freight transport vehicles [33]. Additionally, options to replace high temperature industrial process heat are essential [34]. Previous works have shown that an increased sector coupling is a prerequisite to efficiently address these challenges and that renewable power can play an increasing role in both transportation and heating, either directly or via the production of hydrogen or synthetic fuels [35,36]. Despite the high amount of model based scenario studies already available, the role of regional power exchange, sector coupling, and industrial demand response (DR) in a completely RE system is not yet fully understood for Brazil. This is particularly important as the consideration of the usage of electricity for heating, transportation and fuel production has a high impact on power demand and supply.
This paper assesses the effect of sector coupling on the power system in Brazil, both concerning the challenges arising from an additional power demand for electric mobility and hydrogen production, and the opportunities offered by the flexibility of these loads. Applying the high-resolution energy model REMix, we identify the least cost composition of different generation, grid, and storage technologies and assess the potential contribution of sector coupling and DR to a fully renewable power supply. We present a case study of four scenarios that provide insight into the impact of RE technology choice, regional distribution of generation capacities and future drought risks on the supply costs. The case study relies on a scenario assessment for a 100% renewable supply considering the whole energy system across the power, heat, and transport sectors.
2. Materials and Methods
2.1. Optimization Model REMix
The case study relies on the application of the REMix energy system model [32]. It combines an assessment of wind and solar power generation potentials in high temporal and spatial resolution with an energy system optimization (Figure 2). REMix is focused on a detailed representation of the power system, but also considers all relevant links to the heat and transport sectors, including electric heating, electric mobility and production of synthetic fuels [37]. The model optimizes the capacity installation and hourly operation of all system components in a perfect foresight approach over one typical year. Its objective function comprises annuities of endogenously added assets and operational costs of all assets. In the case study presented here, REMix is applied in a partial greenfield approach. This implies that some power generation and transmission capacities are exogenously defined, for example considering existing infrastructures, whereas others are endogenously determined by REMix (Section 2.2). A detailed description of REMix appears in [32]. In contrast to previous studies [37,38], we use a simplified model representation of DR, which is described in Appendix A and documented in Equations (A1)–(A9) and Table A1. For countries with abundance of dispatchable renewable potentials, such as Brazil, the contribution of DR to load balancing is rather limited. This justifies the application of a simplified model, which significantly reduces the model complexity and solution time. Furthermore, it requires less input data and is thus more easily transferrable to other countries. The model representation contains the main features of DR, which are load shedding and shifting to an earlier as well as later time. Load shifting is modelled as fictitious energy storage whose storage costs increase with the period between charging and discharging. In contrast to the more detailed representation, it does not explicitly consider the duration between a load reduction and subsequent increase. Furthermore, the duration of load interventions is not directly limited. However, both these durations can be limited to reasonable values of a few hours by the approach chosen.
2.2. Data and Assumptions
The REMix model input includes hourly time series of demand and VRE power generation, RE technology potentials, existing power generation and transmission capacities, and techno-economic parameters of all technologies. The model configuration applied in this case study is introduced in the following paragraph as well as the data used and assumptions made.
In our analysis of least-cost configurations of future power supply systems for Brazil, we consider a broad range of technologies (Table 1). The optimization focuses on the potential future role of wind and solar power as well as the need for transmission lines, storage and flexible sector coupling. It assesses how solar photovoltaic (PV), concentrated solar power (CSP), wind onshore and wind offshore compete with each other and the expansion of hydropower. Alternating current (AC) and direct current (DC) transmission are treated separately in the model. Our partial greenfield approach considers existing hydropower plants and transmission lines, some biomass combined heat and power (CHP) stations, and small capacities of wave power as well as stationary fuel cells as exogenous model input (Table 1). Furthermore, we consider flexible electric heating, hydrogen electrolysis and industrial DR as part of an enhanced sector coupling.
To reflect restrictions in power transmission and evaluate the demand for new power lines, we subdivide Brazil into seven model regions (Figure 3), based on [39,40]. Given their remoteness and large capacity, the major hydro dams at Belo Monte, Teles Pires and Itaipu are considered as additional grid nodes without power demand. Furthermore, we include three network junction points with neither generation nor demand in the model. Existing transmission capacities are considered according to Table A2 and rely on [39].
The total electricity demand considered in the case study is based on a comprehensive scenario of the future development of the Brazilian energy system [41]. This scenario represents a pathway to a fully RE supply across all sectors by 2050. According to [41], we assume that heat production and transport will increasingly rely on electricity and synthetic hydrogen, causing almost a doubling in power demand by 2050. Final energy demand in electricity increases to 325 TWh/year in industry, and to 412 TWh/year in the residential and service sector. This includes power for direct heating and heat pumps. For transport 126 TWh/year in electricity are projected in the scenario, with a comparatively low share of 26% battery electric vehicles (BEV) in passenger cars and 12% in heavy duty vehicles. Additional power demand arises from the electrolytic production of 8 PJ and 77 PJ of hydrogen for transport and industry, respectively. Regional power demand values are summarized in Table A3. They reflect the concentration of population and industry to the Sudeste region [42,43]. In the case study presented here, we consider the energy demand and technology data for 2050, which is used as target year for a fully renewable supply in [41].
Hourly load profiles are obtained using metered data of dispatchable power generation. The national operator of the power system provides hourly values of electricity generation supplied by centralized power plants [44]. By the time of the modelling phase, the most recent data available were that of 2013. These data allow capturing the hourly demand behaviour by region. The resulting hourly load has an annual peak of 100 GW. The new loads—electric vehicle charging, heating and hydrogen demand—are disaggregated to hourly values according to the methodology presented in [45]. It considers representative profiles of uncontrolled electric vehicle charging, hydrogen car fuelling and industrial process heat demand. The inflexible share of the new loads accounts for an additional hourly demand of at least 15 GW, resulting in a total peak load of about 115 GW, which occurs in the beginning of December. As most of the new loads are assumed to be flexible in their operation, the endogenously determined peak load can be up to 55 GW higher.
Today’s existing hydropower plants are expected to be available in the future, just like the existing facilities already under construction [46,47]. They account for 65 GW and 43 GW of run-of-river and reservoir hydro capacities, respectively (Table A4 and Table A5 in Appendix B). Those hydro stations listed as mid-term (MT) and long-term (LT) investment options in [39] are considered as upper limit for the model endogenous installation of additional run-of-river and reservoir hydro capacity (Table A6). They amount to additional 25 GW and 30 GW, respectively. We allow for an endogenous installation of pumps in all reservoir hydro stations as an additional source of flexibility and storage. To consider different availabilities and costs, we subdivide existing hydropower stations and future installations into three size classes each for reservoir hydro and run-of-the-river hydro stations. Electric capacities below 30 MW are classified as small, between 30 MW and 300 MW as medium and above 300 MW as large. Maps of all existing major hydro dams are available in [39,48,49]. Based on the comprehensive scenario development presented in [41], we furthermore assume the existence of wave power plants, biomass CHP plants, and stationary fuel cells with overall electric capacities of 4.6 GW, 19.4 GW, and 0.8 GW, respectively. Both biomass CHP and fuel cell systems contribute to the supply of renewable heat to residential, commercial and industrial consumers. They dispose of a thermal storage dimensioned to store up to four hours of peak heat demand. The resulting regional capacities are displayed in Figure 4 and detailed in Table A4 and Table A5 in Appendix B.
We quantify the maximum installable capacities for PV, Wind and CSP power plants applying the global resource assessment tool REMix-EnDAT [50]. We find that the considered average minimum wind speed has significant impact on the regional capacity limits and annual capacity factors. In order to find a reasonable balance between both, we use regionally different values (see Table A7 and Table A8 in Appendix C). The overall wind power potentials considered in the case study amount to 138 GW and 470 GW of onshore and offshore capacity, respectively (Table 2). CSP can be used almost exclusively in the regions Nordeste, Centro-Oeste and Sudeste, with installable capacities exceeding practical limits. The same applies to the maximum PV capacity across all regions. Based on historic weather data of 2002, we calculate hourly profiles of wind and PV power generation as well as CSP heat input using the REMix-EnDAT tool. The daily water inflow to hydropower plants is considered according to long-term averages over 1931–2013 [51]. As no measured data are available for wave power, we approximate monthly average output values based on [52], using an annual capacity factor of 0.3.
In addition to retrofitting reservoir hydro stations by pumps, the model endogenous installation of storage can also include batteries and hydrogen storage. These are represented by Vanadium redox flow batteries and a combination of proton exchange membrane (PEM) electrolyser, tank storage and single or combined cycle gas turbine. The model accounts for DR in energy-intensive production processes and large scale cooling. Load shedding can be realized in the electrolytic production of aluminium, steel and copper, load shifting in the production of cement, pulp and chlorine as well as cooling in the food industry, gastronomy and retail. Potentials are based on Brazilian industry statistics [53,54,55], Brazilian electricity demand statistics [56], and previous studies for Europe [57]. We assume that these potentials are available also in the future, implicitly assuming that increases in production capacity and efficiency cancel each other out. Overall potentials are summarized in Table A9 in Appendix D. Additional load shifting is assumed to be available from a delayed charging of 60% of the BEV fleet by up to eight hours. We also assume a partially flexible operation of electric heating enabled by thermal energy storage designed to store four hours of peak heat demand. The hydrogen for the transport sector and industry is produced in electrolysers dimensioned to produce the annual demand in 3000 full load hours and equipped with tank storage for 12 h of full load production.
The techno-economic parameters of the considered generation and storage technologies are presented in Table 3. Considerable cost reductions until 2050 are assumed for most technologies, including those that are so far deployed only with small capacities but might become important at higher VRE supply shares, such as CSP, wave power or hydrogen storage. For hydropower, no significant cost reductions are assumed, as the best potentials are already exploited and increasing sustainability concerns lead to additional costs. Cost assumptions for DR and transmission technologies are summarized in Table A9 and Table A10 in Appendix D. All investments are subject to an interest rate of 10%. Biomass is considered with an average fuel cost of 10 €/MWh.
2.3. Scenarios
The case study includes four scenarios focused on regional RE deployment and hydropower availability. In the Base scenario, generation capacities of solar and wind power are optimized without any minimum target. In contrast, the scenarios PV-Plan and CSP-Plan assess the impact of pre-defined PV and CSP capacities, respectively. They consider the installation of PV currently planned by the Brazilian government [64] on the one hand, and the proposal of deploying CSP in northeast Brazil on the other [65]. In scenario PV-Plan, we predefine PV capacities of 50 GW in region Sudeste, 25 GW in Nordeste, 12 GW in Centro-Oeste, 10 GW in Sul and 3 GW in Norte 1. In scenario CSP-Plan, we consider an electric CSP capacity of 10 GW in Nordeste. Finally, scenario Red-Inflow evaluates how a reduced water inflow to hydropower plants, for example caused by climate change, influences the system set-up and supply costs. We assume an inflow reduction of 25% at any hydro station and during every hour of the year compared to the historic averages applied in all other scenarios.
3. Results
The overall installed power generation capacity identified by REMix reaches about 310 GW in the scenarios Base and CSP-Plan, and about 335 GW in PV-Plan and Red-Inflow (see Tables S1–S14 in the Supplementary Material for detailed results). In all scenarios, it includes 109 GW of exogenously defined hydropower stations and 25 GW of other RE technologies (see Section 2.2). The model endogenous installation of additional hydropower plants is very limited, reaching 3.3 GW in all scenarios. It includes 2.3 GW of large and 0.2 GW of medium run-of-the-river power stations in the region Sul as well as 0.6 GW and 0.3 GW of medium reservoir hydro stations in Itaipu and Sul, respectively. A model endogenous installation of hydrogen reconversion power plants is not realized in any of the scenarios. Instead, all other capacity expansion concentrates on wind and solar power technologies. Reaching almost 32 GW, the overall CSP capacity is found to be highest in scenario Red-Inflow (Figure 5). This reflects the need for additional dispatchable capacity in the case of a reduced water inflow to hydropower stations. Model endogenous installation of CSP is strongly concentrated to the region Sudeste, with only small amounts placed in Norte 1. Despite the high quality potentials located there, no endogenous installation in Nordeste is realized. The exogenously defined 10 GW of CSP considered in scenario CSP-Plan lead to a substitution of 1.7 GW of wind power by 1.3 of CSP and 1 GW of PV capacity as well as some shift in the regional distribution. The endogenous installation of PV remains significantly below the amount defined in scenario PV-Plan. Its capacity is distributed over five model regions, with regional shares notably influenced by the scenario assumptions. The highest amounts of endogenously added capacities are found for onshore wind power. The available potential of 71 GW in region Nordeste is exploited across all scenarios, and complemented by further 6 to 18 GW in Sul. This regional concentration arises from the big differences in annual capacity factors (Table 2). Offshore wind power is not used in any scenario, which implies that the slightly higher capacity factors compared to onshore wind cannot compensate for the higher costs of this technology.
The power generation structure in the different scenarios in 2050 reflects the corresponding composition of the power plant park (Figure 6). Generally, a broad mix of different technologies is used. Most important power source is still hydropower: its supply share reaches 37% in Red-Inflow and 47% in all other scenarios. Wind power contributes between 24% and 27%, solar power between 18% and 26%, biomass between 7% and 8%, and wave and hydrogen CHP the remaining 1%. The lower hydropower generation in scenario Red-Inflow is mostly compensated by additional CSP generation (60%), but also by PV (15%), wind (10%) as well as biomass (5%) power, and a reduction of curtailments and losses (10%). Despite the high supply share of VRE technologies, curtailments occur only to a very limited extent. They range between 21 TWh in scenario Red-Inflow and 34 TWh in scenario PV-Plan, equivalent to 2.0% and 3.2% of the overall annual power generation, respectively.
The high VRE share in power supply as well as the location of wind and PV generation far from the demand centres cause a significant increase in power transmission capacities (Figure 7 and Table S10). The model endogenously installs additional interconnectors between 54 GW in scenario Red-Inflow and 59 GW in CSP-Plan, equivalent to around half of today’s existing capacity. About 80% of the endogenously added transmission lines are built using DC technology. Almost half of the added transmission capacity connects the regions Nordeste and Sudeste, another 20% the regions Centro-Oeste and Sudeste. This concentration is clearly related to the regional distribution of VRE generation and demand.
Accordingly, more than 35% of the annual power generation is transmitted over at least one region border (Figure 8 and Table S11). Almost all net imports are directed to the Sudeste region, where more than half of the national power demand occurs. Across all scenarios, the region imports at least 295 TWh/year, equivalent to about 55% of the regional demand. Most important net exporting regions are Nordeste, Centro-Oeste, exceeding the still significant large hydro stations at Itaipu and Belo Monte.
The water reservoirs available in the existing hydropower stations theoretically allow for storing almost 200 TWh/year of electricity, or 20% of the annual demand. This large storage capacity strongly limits the demand for and potential of alternative balancing options. According to the REMix results, no model endogenous installation of electricity storage takes place in any of the scenarios. This includes pump retrofitting of existing reservoir hydropower plants, battery as well as hydrogen storage. Not even in the Red-Inflow scenario, pump retrofitting proves to be necessary to enhance storage capacity of water dams.
In contrast, the exogenously defined flexibility is adequate for load balancing. The predefined hydrogen storage capacity is used to store between 1.6% and 1.9% of the annual hydrogen production (Table S12). This corresponds to around 12 TWh/year of electric energy. Annual full load hours of hydrogen storage range between 42 and 74 h. They are highest in scenario PV-Plan and lowest in CSP-Plan. Particularly high values are found in the regions Nordeste and Norte 1, lowest values in Norte 2 and Sul. A higher utilization is observed for the predefined thermal energy storage capacities in CHP and electric heating systems. Depending on the region and scenario, annual full load hours reach between 56 and 161 h. They are highest for fuel cell CHP and lowest for biomass CHP. On a national level, the annual storage energy input varies only by 15% between the scenarios, with lowest value in PV-Plan and highest in Red-Inflow. It reaches between 7% and 9% of the corresponding annual heat demand (Table S13). The stored energy is equivalent to a power demand of around 6 TWh/year in case of electric heating, and a power generation of 8 TWh/year in case of CHP. Controlled charging of BEV is also used to balance VRE fluctuations. Between 7% and 9% of the annual charging demand are shifted to a later time, equivalent to between 8 and 10 TWh/year (Table S14). The highest value occurs in scenario CSP-Plan, the lowest in Red-Inflow. Generally, longer shifting times of six to eight hours are preferred to shorter ones. The REMix results show that the annual shares of shifted BEV charging are the highest in the regions Sudeste and Sul. Regional values can be as low as 3% and as high as 11% of the annual charging demand. Other, more expensive DR is used to a much lower extent. The annual amount of the considered industrial and commercial load shifting and shedding does not exceed 0.4 TWh or 0.04% of the total annual power demand. Despite this low amount of energy, DR provides peak load reductions by more than 3.3 GW, according to the available potential. The maximum load increase reaches 0.9 GW. The amount of shifted and shedded energy differs by up to 6% between the scenarios, whereas peak reduction and increase are identical. This implies that the implementation of DR is only to a very limited extent influenced by the scenario assumptions. In terms of electric energy, the overall load shifting of electric heating, CHP, hydrogen electrolysis, BEV, and other DR reaches around 33 TWh/year, which is about 3% of the annual power demand, and less than 20% of the available hydro reservoir capacity. Table S14 sums up regional power transport.
Under the assumptions for investment and operational cost applied, the scenarios Base, PV-Plan and CSP-Plan show only slight differences of less than 1% in specific electricity costs (Figure 9). A clearer difference can be found in scenario Red-Inflow, where additional generation capacity is required. Here costs of power production are about 6 €/MWh (8%) higher than in the other scenarios. These costs account for fixed as well as variable operation and maintenance costs on the one hand, and the annual depreciation of capital expenditure on the other. Both are here considered for all assets included in the model, thus exogenously defined and endogenously added power stations, power transmission and all considered storage and balancing technologies. This can be considered a conservative approach, as it implies that annuities still have to be paid for hydro and grid capacities available today. The resulting specific generation costs are dominated by hydro and biomass power, whereas grid, storage and DR do not have a significant share in any of the scenarios. If no annuities are considered for existing hydro stations, grid capacities and the predefined biomass CHP plants, specific electricity costs are lower by 20 €/MWh, 1 €/MWh and 7 €/MWh, respectively. Note that all costs are calculated in €2015.
4. Discussion and Conclusions
This paper analyses the least-cost composition and operation of a fully renewable power supply system as part of a 100% RE system in Brazil. It relies on the application of the high-resolution energy system model REMix, which considers the power sector as well as all linkages to the heat and transport sectors. The methodology applied is easily transferrable to other countries. The modelling results show that the Brazilian power system is able to equally address the challenges of providing sufficient electricity and eliminating direct GHG emissions. With regard to affordability, our results indicate that a completely renewable power system in Brazil will not lead to significantly increased costs, despite the additional transmission and generation capacity [41].
Our analysis reveals that the expansion of wind, PV and CSP is cheaper than the construction of additional hydroelectric power stations. This is favoured because the existing hydroelectric power plants already offer large capacity of dispatchable power to compensate for fluctuations, and thus no additional storage is necessary. Furthermore, the existing hydropower capacity limits the contribution of wind and solar to around half of the generation. This makes a fundamental difference to other countries and world regions, where a fully renewable power supply relying on domestic sources can only be realized relying on much higher wind and solar shares. Nonetheless, our analysis shows that wind, PV and CSP are major pillars of a cost-efficient fully renewable power supply in Brazil. Previous analyses for Europe have shown that higher VRE shares require the installation of significant amounts of storage and grid capacity [32,66,67,68,69,70,71,72]. In contrast to that, there is no demand for additional short-term or long-term electricity storage in our scenarios for Brazil, as the available hydropower reservoirs and biomass stations can balance the intermittent generation. However, storage is used as thermal energy storage in CSP, CHP as well as electric heating (with hot water storage), and as decentralized hydrogen storage. According to our scenarios, the Brazilian high-voltage power grid would have to be expanded by around half of its current capacity. Its main driver is the installation of wind power and CSP in regions far from the demand centres. Even though the need for additional power lines is significant, it is comparatively much lower than in systems with higher solar and especially wind shares. However, the implementation of a wind and solar share of close to 50% represents a significant transformation of the Brazilian power system.
The REMix analysis also shows that varying shares of new supply technologies (wind, PV, CSP) as well as the spatial distribution of power plants have only a small influence on the supply costs. This implies that the transformation strategy in Brazil can be primarily based on other criteria such as regional development, public acceptance, environmental impact or industrial policy without major impacts on system costs. Furthermore, the model results indicate an enhanced coupling of power, heat and transport sectors through flexible electric heating, electric mobility and hydrogen electrolysis can significantly contribute to the balancing of intermittent power generation. By concentrating these loads to the hours of high solar, wind and hydropower availability, the demand for dispatchable generation can be reduced. The same applies to industrial load shifting and shedding, which helps to cut load peaks that occur only in few hours. Even though the flexibility of enhanced sector coupling and DR is used for a temporal shift of only around 3% of the annual power demand, the utilization of the considered thermal and hydrogen storage as well as controlled BEV charging is comparable to that identified for other countries in previous REMix analyses [37,45]. Nonetheless, their balancing potential might become even more important, if biomass resources are increasingly exploited or exported, thus requiring the use of other energy carriers also in Brazil. The abundance of good quality solar and wind energy potentials is a chance for a further electrification of transport and heating, as well as for the production of synthetic fuels without significant increase in specific power generation costs. Both could potentially substitute the usage of biomass in the heat and transport sectors, which was considered in the underlying energy system transformation pathway considered in this work [41]. The limits and system impact of this option must analysed by future studies.
Our modelling approach potentially overestimates the flexibility of reservoir hydro stations, as it does not account for other uses of water for environmental, social and economic purposes [21]. For this reason, the potential impact of a lower flexibility of hydro stations was studied in a REMix sensitivity run with the storage capacity of all water reservoirs cut by half. Despite this strong reduction of water storage availability, the results only show a slight shift in generation capacity from PV (−4.5 GW, 7%) to CSP (2.5 GW, 10%) compared to the Base scenario. This small change can be explained by the dispatchable operation of CSP, as was also highlighted by [65]. The corresponding change in the power generation structure reaches only 7 TWh, and is rather insignificant. There is no change in the investment in hydro capacity, and the differences in hydropower generation, grid expansion, annual power transmission and overall system costs are below 1%. The increase in the flexible operation of sector coupling technologies reaches around 3%, and is most notable for the electrolyser operation. This first assessment must be supplemented by a comprehensive analysis of the real flexibility of hydropower plants in Brazil considering a detailed modelling of hydro stations operating in cascade.
Scenario Red-Inflow gives some indication on the possible response to a reduction in water inflow to hydropower plants—due to either droughts or other water demands. Due to the abundance of high quality potentials, such a reduction could be relatively easily compensated by additional solar and wind power generation. Particularly the CSP supply share increases notably in this scenario, as it can provide firm generation capacity through its thermal storage. Future studies must assess the role of a reduced water inflow on the Brazilian power supply system in more detail, considering also regionally different values and especially seasonal effects. Concerning the impact of a lower water inflow to hydropower stations, e.g., as a consequence of climate change, our results show that a reduction of 25% in hydropower generation can be easily balanced by wind and solar power, increasing the specific power generation costs by about 8%.
The results of the case study are to a high degree influenced by the REMix modelling approach and the data used. The spatial and temporal resolution of REMix limits the validity of the results to the hourly balancing of demand and generation and the power exchange between the considered model regions. Possibly, additional grid or generation capacity might be required to supply all demand also on shorter timescales and within these regions. Furthermore, the model relies on numerous approximations concerning the technical characteristics and restrictions of all modelled technologies. These aspects have been discussed in detail in [32].
The hourly availability of VRE power generation is mainly driven by weather conditions and is typically different between the years. The results presented here rely on measured data of 2002. The consideration of different weather years might have significant impact on the results [32]. Adding up the minimum availability of the power generation capacities during the afternoon load peak, the firm capacity in the system can be estimated. Depending on the scenario it reaches around 75% to 80% of the annual peak load. Sensitivity analyses with REMix show that around 33 GW of hydrogen-fired gas turbines are needed to enhance the relative firm capacity to 115%. However, these units would have average annual full load hours of less than 10 h/year. The required investment increases the overall power system costs by about 3%.
The case study relies on assumptions concerning technology and cost developments, which can have substantial impact on the results. This is particularly the case for the future costs of wind, solar and hydropower, but also energy storage. Our results show that predefined PV and CSP capacities have only a very small impact on the specific generation costs. From this follows that minor changes in investment costs of solar and wind technologies would not lead to significant changes in the supply costs, even though the least-cost supply structure is likely to be different. The sensitivity of the results to a 50% increase in investment costs of CSP and onshore wind technology, respectively, was tested in two additional REMix runs. The consideration of higher CSP costs leads to a reduction of CSP capacity by around 16.5 GW compared to the Base scenario, equivalent to around one third. It is compensated by additional 25 GW of PV, 10 GW of onshore wind, 2 GW of hydropower, and 0.8 GW of hydrogen gas turbines capacity. CSP generation is reduced even by half, and substituted to 60% by PV and 40% by wind. The additional wind and solar capacity is located in the regions Sul and Centro-Oeste, most or the additional PV capacity in Nordeste and Centro-Oeste. The different generation structure causes an increase in grid capacity expansion by 30% and in supply costs by 4%. With less dispatchable capacity available, other balancing technologies are used to a much higher extent: power transmission increases by 20%, hydrogen storage charging by 30%, thermal energy storage and shifted BEV charging by about 40% each, and other DR by 250%. The consideration of higher onshore wind investment costs reduces the wind power capacity in Nordeste by 33 GW, which is more than half of the value determined in the Base scenario. Wind power generation decreases even more, by almost 60%. On the contrary, CSP generation doubles, even though the increase in capacity amounts to only 13 GW or 50%. PV capacity and generation are by 25 GW (40%) and 35 TWh (35%) higher than in the Base scenario, respectively. As most of the additional solar power generation capacity is located in Sudeste, the need to expand the power grid is reduced almost by half. The annual power transmission is by more than 30% lower, whereas the overall usage of other balancing technologies remains unchanged. System costs are by about 8% higher than in the Base scenario, and close to those in Red-Inflow. Concerning energy storage, a sensitivity run with REMix reveals that battery storage is not used, even if investment costs are reduced by half.
Across all scenarios, CSP is found to be an important element of a 100% renewable power supply in Brazil. This is in line with previous works particularly dedicated to the future role of CSP in the northeast of the country [65,73]. For the region here labelled Nordeste, they find that CSP plants hybridized with local biomass would play an important role in the Brazilian power system from 2040 on. Such systems would contribute to the power system by regularizing the energy imbalance that result from the large-scale wind and PV expansion along with conventional inflexible power plants. Furthermore, they would be able to increase frequency response and operational reserve services and can provide the required additional flexibility that will be required in the future.
In our case study, we assume a favourable development of VRE technology costs. To some degree, these costs reductions depend on the future global market development. We implicitly assume a significant increase in globally installed capacity, which enables cost reductions through technology learning in a global market. This is particularly relevant for the technologies with currently low installed capacities, including wave power, hydrogen fuel cells, battery storage and CSP. In this, we rely on the cited data sources for technology costs.
By integrating our detailed power optimization approach with the detailed transformation pathways in [41] we provide an easily adaptable methodology for the assessment of energy transformation. Our scenarios help to identify, which technologies might be essential for a fully decarbonized energy system as well as critical investment decisions for the future capacity structure. Applying this methodology before, we have identified such decisive investments for an island system with regard to costs [37]. With this paper, we provide evidence of an easy transferability of our approach. For Brazil, we identified that all considered scenarios with varying generation systems lead to similar costs. We therefore highlight the necessity to further assess other sustainability dimensions for an optimal transformation of the power system.
Supplementary Materials
The following are available online at www.mdpi.com/1996-1073/10/11/1859/s1, Table S1: Model-endogenous capacity installation of wind onshore, PV and CSP capacity, Table S2: Annual hydropower generation in scenario Base, Table S3: Annual other power generation in scenario Base, Table S4: Annual hydropower generation in scenario PV-Plan, Table S5: Annual other power generation in scenario PV-Plan, Table S6: Annual hydropower generation in scenario CSP-Plan, Table S7: Annual other power generation in scenario CSP-Plan, Table S8: Annual hydropower generation in scenario Red-Inflow, Table S9: Annual other power generation in scenario Red-Inflow, Table S10: Model-endogenous installation of grid connections, Table S11: Annual power export and import by model region, Table S12: Annual energy input to decentralized hydrogen storage for industry and transport, Table S13: Annual energy input to thermal energy storage in electric heating and CHP, Table S14: Annual amount of BEV charging power shifted to a later time.
Acknowledgments
The development of the demand response model was part of the INTEEVER project financed by the German Federal Ministry for Economic Affairs and Energy under grant number FKZ 03ET4020A. The preparation of the case study was partially funded by Greenpeace Brazil. The authors acknowledge the contribution of Tobias Fichter from DLR to the preparation of the model input data and assumptions. We also thank Mariana Imperio, Cindy Viviescas, Fernanda Guedes, Bruno Scola, Rodrigo Milani, Roberto Schaeffer, and Alexandre Szklo from the Federal University of Rio de Janeiro (UFRJ) to the preparation of the model input data and assumptions. Furthermore, the authors thank Thomas Pregger from DLR for his helpful comments on a previous draft of this paper. Finally, we thank the Brazilian Federal Agency CAPES for its support to the scientific research performed at UFRJ.
Author Contributions
Hans Christian Gils and Sonja Simon conceived and designed the case study; Hans Christian Gils implemented the DR model; Hans Christian Gils performed the model runs; Hans Christian Gils and Sonja Simon analysed the data; Rafael Soria contributed specific data to model the Brazilian power system; and Hans Christian Gils and Sonja Simon jointly wrote the paper.
Conflicts of Interest
The authors declare no conflict of interest.
Appendix A. Demand Response Model
This work makes use of a simplified model representation of demand response (DR), compared to that used in previous publications of REMix results [37,38]. Here, load shifting is modelled as fictitious energy storage for preponing and postponing demand. If load is shifted to an earlier time, it operates equivalent to a physical energy storage, which is charged when the load is increased, and subsequently discharged when it is decreased. Load shifting to a later time represents the inverse process, where the storage is charged at load reduction and later discharge at load increase. Equations (A1) and (A2) show the storage balance for load shifting to an earlier or later time, respectively. It includes two efficiency values η1 and η2, representing additional demand caused by DR. In this work, model equations and inequalities are presented in simplified denotation. For a better readability, sets that parameters and variables are dependent on are not included here. These are generally model nodes and technologies. Parameters and variables are displayed differently: variables are always written in bold font, and parameters appear in normal font. All model variables used here can have only positive values. All variables and parameters used in the equations are defined in Table A1.
In the case that loads cannot be moved to both an earlier and later time for a certain technology, the corresponding variables are set to zero. For load shedding, Equation (A1) is modified such that PbalRed is set to zero for all time steps.
The overall load reduction must be smaller or equal than the available flexible capacity given by the overall capacity of DR loads and the time-dependent availability factor sflex (Equation (A3)). Equivalently, the overall load increase must be smaller or equal than the available unused capacity given dependent on the availability factor sfree (Equation (A4)). The overall capacity of DR loads can be composed of an exogenously defined contribution PexistCap and an endogenously optimized contribution PaddedCap. Its sum cannot exceed the overall available potential PmaxCap (Equation (A5)).
The annual depreciation of capital expenditure is calculated as the product of added DR capacity PaddedCap, specific investment costs cspecInv and the annuity factor. The latter is obtained according to Equation (A3) in [32]. The operation and maintenance costs Coperation are composed of three elements: the fixed costs calculated as a constant share cOMFix of the investment costs, and two variable elements scaling with the shifted or shedded load on the one hand, and the levels of the fictitious storage (Equation (A6)) on the other with specific costs values cOMVar1 and cOMVar2.

Table A1.
Variables and parameters used in the model description.
| Symbol | Unit | Variable/Parameter |
|---|---|---|
| Coperation | k€/year | Operation and maintenance costs |
| PaddedCap (t) | GW | Installed electric capacity of additionally DR consumers |
| PbalInc (t) | GW | Balancing of earlier load increase |
| PbalRed (t) | GW | Balancing of earlier load reduction |
| Pinc (t) | GW | Demand response load increase |
| Pred (t) | GW | Demand response load reduction |
| WlevelInc (t) | GWh | Amount of increased and not yet balanced energy |
| WlevelRed (t) | GWh | Amount of reduced and not yet balanced energy |
| Δt | h | Calculation time interval |
| η1 | % | Efficiency describing additional demand caused by DR, independent of shifting time |
| η2 | %/h | Efficiency describing additional demand caused by DR, dependent of shifting time |
| cOMFix | %/year | Operation and maintenance fix costs |
| cOMVar1 | k€/MW | Operation and maintenance variable costs, independent of shifting time |
| cOMVar2 | k€/MWh | Operation and maintenance variable costs, dependent of shifting time |
| cspecInv | k€/MW | Specific investment cost |
| sflex (t) | % | Share of load reduction potential available in time step t |
| sfree (t) | % | Share of load increase potential available in time step t |
| PexistCap | GW | Already accessed capacity of DR loads |
| PmaxCap | GW | Maximum accessible capacity of DR loads |
Appendix B. Power Demand, Hydro Power, Biomass Power, and Grid Capacities
Table A2 includes the existing grid connections considered in REMix according to [39]. Regionalized power demand values from [41] are summarized in Table A3. Table A4 and Table A5 provide the considered run-of-river, reservoir hydro, wave power, and biomass CHP capacities as well as hydropower full load hours considered in all scenarios. The model endogenous installation of additional hydropower plants is limited by the potentials summarized in Table A6. The hydropower capacities are taken from [46,47], while the biomass and wave power capacities were part of the scenario development in [41].
Table A2.
Considered existing grid connections and transfer capacities in MW based on [39].
Table A2.
Considered existing grid connections and transfer capacities in MW based on [39].
| Start (S) | End (E) | Techn. | S → E in MW | E → S in MW |
|---|---|---|---|---|
| XIN | IMP | AC | 4115 | 4115 |
| XIN | Norte 1 | AC | 2700 | 2700 |
| XIN | Norte 2 | AC | 2700 | 2700 |
| XIN | Belo Monte | AC | 11,000 | 11,000 |
| XIN | Sudeste | DC | 8000 | 8000 |
| IMP | Nordeste | AC | 8200 | 4849 |
| IMP | Norte 1 | AC | 8518 | 8518 |
| IMP | Centro-Oeste | AC | 5380 | 5598 |
| IV | Sudeste | AC | 6800 | 6800 |
| IV | Itaipu | AC | 6300 | 6300 |
| IV | Sul | AC | 2426 | 2317 |
| Sudeste | Nordeste | AC | 6500 | 6936 |
| Centro-Oeste | Norte 3 | DC | 7092 | 7092 |
| Centro-Oeste | Teles Pires | AC | 10,500 | 10,500 |
| Sudeste | Itaipu | DC | 5500 | 5500 |
| Sudeste | Sul | AC | 9420 | 9108 |
| Itaipu | Sul | AC | 2112 | 192 |
| Sudeste | Centro-Oeste | AC | 15,000 | 15,000 |
Table A3.
Considered regional annual power demand based on [41].
Table A3.
Considered regional annual power demand based on [41].
| Technology Region | Transport | Electric Heating | Hydrogen Electrolysis | Other |
|---|---|---|---|---|
| TWh/year | TWh/year | TWh/year | TWh/year | |
| Nordeste | 17.6 | 33.0 | 4.0 | 98.9 |
| Norte 1 | 1.9 | 10.2 | 1.2 | 35.3 |
| Norte 2 | 0.8 | 4.2 | 0.7 | 9.0 |
| Norte 3 | 0.5 | 3.1 | 0.7 | 4.5 |
| Centro-Oeste | 10.1 | 12.4 | 1.3 | 49.2 |
| Sudeste | 72.3 | 89.0 | 15.5 | 360.6 |
| Sul | 23.4 | 28.7 | 4.8 | 117.8 |
Table A4.
Considered run-of-river hydro and wave power capacities and annual full load hours based on [46,47].
| Technology Region | Run-of-River Hydro S | Run-of-River Hydro M | Run-of-River Hydro L | Wave Power | ||||
|---|---|---|---|---|---|---|---|---|
| MW (el) | h/Year | MW (el) | h/Year | MW (el) | h/Year | MW (el) | h/Year | |
| Nordeste | 165 | 3256 | 0 | 6139 | 7895 | 4270 | 888 | 2628 |
| Norte 1 | 235 | 4799 | 243 | 5548 | 2440 | 5156 | 1089 | 2628 |
| Norte 2 | 0 | 4799 | 810 | 4880 | 1070 | 4596 | 0 | 0 |
| Belo Monte | 0 | 0 | 233 | 5790 | 11,000 | 4446 | 0 | 0 |
| Norte 3 | 165 | 4799 | 74 | 5264 | 4308 | 6061 | 0 | 0 |
| Teles Pires | 0 | 0 | 0 | 0 | 1820 | 4410 | 0 | 0 |
| Centro-Oeste | 1752 | 4611 | 1729 | 5320 | 8710 | 4620 | 0 | 0 |
| Sudeste | 1869 | 4611 | 2340 | 5033 | 1044 | 6146 | 1211 | 2628 |
| Itaipu | 0 | 0 | 0 | 0 | 8800 | 6148 | 0 | 0 |
| Sul | 1663 | 4779 | 1584 | 5214 | 5473 | 4977 | 1412 | 2628 |
Table A5.
Considered reservoir hydro and biomass power capacities and annual full load hours based on [41,46,47].
| Technology Region | Reservoir Hydro S | Reservoir Hydro M | Reservoir Hydro L | Biomass CHP | Fuel Cells | |||
|---|---|---|---|---|---|---|---|---|
| MW (el) | h/Year | MW (el) | h/Year | MW (el) | h/Year | MW (el) | MW (el) | |
| Nordeste | 0 | 0 | 397 | 4292 | 2550 | 4292 | 2743 | 113 |
| Norte 1 | 0 | 0 | 0 | 0 | 1727 | 5519 | 809 | 33 |
| Norte 2 | 30 | 6745 | 250 | 4030 | 8370 | 4993 | 503 | 21 |
| Norte 3 | 0 | 0 | 217 | 3854 | 0 | 6044 | 503 | 21 |
| Centro-Oeste | 28 | 2803 | 1550 | 4292 | 18,368 | 4468 | 902 | 37 |
| Sudeste | 0 | 0 | 1526 | 4292 | 399 | 6132 | 10,627 | 438 |
| Sul | 0 | 0 | 795 | 4468 | 7437 | 4993 | 3260 | 134 |
| Technology Region | Run-of-River S | Run-of-River M | Run-of-River L | Reservoir S | Reservoir M | Reservoir L |
|---|---|---|---|---|---|---|
| MW (el) | MW (el) | MW (el) | MW (el) | MW (el) | MW (el) | |
| Nordeste | 45 | 593 | 0 | 0 | 483 | 0 |
| Norte 1 | 0 | 0 | 14,953 | 0 | 95 | 16,418 |
| Norte 2 | 9 | 0 | 708 | 0 | 0 | 0 |
| Norte 3 | 84 | 350 | 0 | 0 | 0 | 0 |
| Centro-Oeste | 481 | 764 | 1260 | 0 | 280 | 330 |
| Sudeste | 862 | 1499 | 0 | 0 | 3367 | 8063 |
| Itaipu | 0 | 0 | 0 | 0 | 608 | 0 |
| Sul | 997 | 158 | 2275 | 0 | 292 | 0 |
Appendix C. Evaluation of Wind and Solar Power Potentials in Brazil
The global renewable energy assessment tool REMix-EnDAT provides maximum installable capacities and hourly power generation profiles for wind offshore, wind onshore, and solar PV as well as the thermal output of solar fields in CSP plants [50]. Installable capacities and annual capacity factors are highly dependent on the considered lower bound for the average annual wind speed (). To assess this effect on the regional wind power potentials in Brazil, different values between 4 km/h and 7.5 km/h are considered in this work. The resulting capacities and full load hours are summarized in Table A7 and Table A8 for onshore and offshore wind power, respectively. It appears that both extent and quality of wind power potentials differ vastly among different regions. To find a reasonable balance between installable capacity and annual full load hours, the regional potentials used in the optimization consider different average annual wind speeds (Table 2). In contrast to wind power, annual full load hours for solar power generation are similar in most regions. However, CSP potentials are only available in four out of seven regions (Table 2). Using the methodology and site selection criteria introduced in [50], installable capacities for both PV and CSP exceed 1000 GW in most regions and are thus practically unlimited.
Table A7.
Available onshore wind potentials at different average annual wind speeds, evaluated using REMix-EnDAT. Note that installable capacities are displayed in GW and annual full load hours in h/year.
Table A7.
Available onshore wind potentials at different average annual wind speeds, evaluated using REMix-EnDAT. Note that installable capacities are displayed in GW and annual full load hours in h/year.
| Region | Nordeste | Norte 1 | Norte 2 | Centro-Oeste | Sudeste | Sul | ||||||
|---|---|---|---|---|---|---|---|---|---|---|---|---|
| Parameter | Cap. | FLH | Cap. | FLH | Cap. | FLH | Cap. | FLH | Cap. | FLH | Cap. | FLH |
| Min. Wind Speed | GW (el) | h/Year | GW (el) | h/Year | GW (el) | h/Year | GW (el) | h/Year | GW (el) | h/Year | GW (el) | h/Year |
| = 4 km/h | 3246 | 1892 | 253 | 914 | 26 | 892 | 1410 | 953 | 1599 | 1009 | 396 | 1437 |
| = 5 km/h | 2122 | 2221 | 0 | 0 | 0 | 0 | 92 | 2086 | 420 | 1262 | 174 | 1888 |
| = 5.5 km/h | 1552 | 2357 | 0 | 0 | 0 | 0 | 44 | 2371 | 48 | 1639 | 79 | 2256 |
| = 6 km/h | 823 | 2568 | 0 | 0 | 0 | 0 | 0 | 0 | 1 | 2738 | 28 | 2852 |
| = 6.5 km/h | 225 | 2935 | 0 | 0 | 0 | 0 | 0 | 0 | 1 | 2776 | 27 | 2879 |
| = 7 km/h | 71 | 3384 | 0 | 0 | 0 | 0 | 0 | 0 | 0 | 0 | 8 | 3206 |
Table A8.
Available offshore wind potentials at different average annual wind speeds, evaluated using REMix-EnDAT. Note that installable capacities are displayed in GW and annual full load hours in h/year.
Table A8.
Available offshore wind potentials at different average annual wind speeds, evaluated using REMix-EnDAT. Note that installable capacities are displayed in GW and annual full load hours in h/year.
| Region | Nordeste | Norte 1 | Norte 2 | Sudeste | Sul | |||||
|---|---|---|---|---|---|---|---|---|---|---|
| Parameter | Cap. | FLH | Cap. | FLH | Cap. | FLH | Cap. | FLH | Cap. | FLH |
| Min. Wind Speed | GW (el) | h/Year | GW (el) | h/Year | GW (el) | h/Year | GW (el) | h/Year | GW (el) | h/Year |
| = 4 km/h | 417 | 2636 | 237 | 1942 | 56 | 1526 | 183 | 1446 | 200 | 2694 |
| = 5 km/h | 378 | 2810 | 160 | 2213 | 33 | 1929 | 89 | 1837 | 181 | 2866 |
| = 5.5 km/h | 330 | 2975 | 137 | 2282 | 32 | 1936 | 45 | 2289 | 172 | 2938 |
| = 6 km/h | 293 | 3107 | 133 | 2290 | 13 | 2155 | 16 | 2639 | 160 | 3003 |
| = 6.5 km/h | 222 | 3305 | 16 | 2757 | 0 | 0 | 13 | 2770 | 143 | 3083 |
| = 7 km/h | 128 | 3626 | 1 | 3367 | 0 | 0 | 0 | 0 | 82 | 3305 |
| = 7.5 km/h | 79 | 3922 | 1 | 3527 | 0 | 0 | 0 | 0 | 14 | 3468 |
Appendix D. Technology Parameter
The following tables contain techno-economic parameters considered in the REMix application for DR technologies in Table A9, and for grid technologies in Table A10.
Table A9.
Techno-economic parameters of demand response technologies.
| Technology | Installed Capacity | Average Reduction | Average Increase | Efficiency | Variable O & M Costs | Ref. |
|---|---|---|---|---|---|---|
| MW | MW | MW | % | €/MWh | ||
| Process industry shifting | 1601 | 603 | 286 | 99% | 50 | [53,54,55,57] |
| Process industry shedding | 3849 | 2210 | n.a. | 100% | 1000 | [53,54,55,57] |
| Cooling | 1666 | 500 | 600 | 95% | 10 | [56,57] |
References
- Ministério de Minas e Energia (MME). Balanço Energético Nacional 2015: Ano Base 2014; Ministério de Minas e Energia, Empresa de Pesquisa Energética (EPE): Brasilia, Brazil, 2015.
- International Energy Agency (IEA). World Energy Balances (2016 edition). In IEA Energy Statistics (Beyond 20/20); International Energy Agency: Paris, France, 2016. [Google Scholar]
- Schaeffer, R.; Szklo, A.; De Lucena, A.F.P.; Soria, R.; Chavez-Rodriguez, M. The vulnerable Amazon: The impact of climate change on the untapped potential of hydropower systems. IEEE Power Energy Mag. 2013, 11, 22–31. [Google Scholar] [CrossRef]
- De Lucena, A.F.P.; Szklo, A.S.; Schaeffer, R.; de Souza, R.R.; Borba, B.S.M.C.; da Costa, I.V.L.; Júnior, A.O.P.; da Cunha, S.H.F. The vulnerability of renewable energy to climate change in Brazil. Energy Policy 2009, 37, 879–889. [Google Scholar] [CrossRef]
- Corrêa da Silva, R.; de Marchi Neto, I.; Silva Seifert, S. Electricity supply security and the future role of renewable energy sources in Brazil. Renew. Sustain. Energy Rev. 2016, 59, 328–341. [Google Scholar] [CrossRef]
- Nass, L.L.; Pereira, P.A.A.; Ellis, D. Biofuels in Brazil: An Overview. Crop Sci. 2007, 47, 2228–2237. [Google Scholar] [CrossRef]
- La Rovere, E.L.; Pereira, A.S.; Simões, A.F. Biofuels and Sustainable Energy Development in Brazil. World Dev. 2011, 39, 1026–1036. [Google Scholar] [CrossRef]
- Raele, R.; Gama-Boaventura, J.M.; Fischmann, A.A.; Sarturi, G. Scenarios for the second generation ethanol in Brazil. Technol. Forecast. Soc. Chang. 2014, 87, 205–223. [Google Scholar] [CrossRef]
- De Paula Dias, M.A.; de Souza Vianna, J.N.; Felby, C. Sustainability in the prospective scenarios methods: A case study of scenarios for biodiesel industry in Brazil, for 2030. Futures 2016, 82, 1–14. [Google Scholar] [CrossRef]
- Portugal-Pereira, J.; Soria, R.; Rathmann, R.; Schaeffer, R.; Szklo, A. Agricultural and agro-industrial residues-to-energy: Techno-economic and environmental assessment in Brazil. Biomass Bioenergy 2015, 81, 521–533. [Google Scholar] [CrossRef]
- Aquila, G.; Rocha, L.C.S.; Junior, P.R.; Pamplona, E.D.O.; Queiroz, A.R.D.; Paiva, A.P.D. Wind power generation: An impact analysis of incentive strategies for cleaner energy provision in Brazil. J. Clean. Prod. 2016, 137, 1100–1108. [Google Scholar] [CrossRef]
- Pinto, J.T.M.; Amaral, K.J.; Janissek, P.R. Deployment of photovoltaics in Brazil: Scenarios, perspectives and policies for low-income housing. Sol. Energy 2016, 133, 73–84. [Google Scholar] [CrossRef]
- Pereira, A.O.; Cunha da Costa, R.; Costa, C.D.V.; Marreco, J.d.M.; La Rovere, E.L. Perspectives for the expansion of new renewable energy sources in Brazil. Renew. Sustain. Energy Rev. 2013, 23, 49–59. [Google Scholar] [CrossRef]
- Pereira, E.B.; Martins, F.R.; Abreu, S.D.; Rüther, R. Atlas Brasileiro de Energia Solar; Instituto Nacional de Pesquisas Espaciais (INPE): São José dos Campos, Brazil, 2006; Volume 1.
- De Souza Noel Simas Barbosa, L.; Orozco, J.F.; Bogdanov, D.; Vainikka, P.; Breyer, C. Hydropower and Power-to-gas Storage Options: The Brazilian Energy System Case. Energy Procedia 2016, 99, 89–107. [Google Scholar] [CrossRef]
- Viana, T.S.; Rüther, R.; Martins, F.R.; Pereira, E.B. Assessing the potential of concentrating solar photovoltaic generation in Brazil with satellite-derived direct normal irradiation. Sol. Energy 2011, 85, 486–495. [Google Scholar] [CrossRef]
- Centro de Pesquisas de Energia Elétrica (CEPEL). Atlas do Potencial Eólico Brasileiro; Centro de Pesquisas de Energia Elétrica: Rio de Janerio, Brazil, 2001. [Google Scholar]
- Chade Ricosti, J.F.; Sauer, I.L. An assessment of wind power prospects in the Brazilian hydrothermal system. Renew. Sustain. Energy Rev. 2013, 19, 742–753. [Google Scholar] [CrossRef]
- Schmidt, J.; Cancella, R.; Pereira, A.O. An optimal mix of solar PV, wind and hydro power for a low-carbon electricity supply in Brazil. Renew. Energy 2016, 85, 137–147. [Google Scholar] [CrossRef]
- Silva, A.R.; Pimenta, F.M.; Assireu, A.T.; Spyrides, M.H.C. Complementarity of Brazil׳s hydro and offshore wind power. Renew. Sustain. Energy Rev. 2016, 56, 413–427. [Google Scholar] [CrossRef]
- Saporta, L.A.D.C. O Papel Dos Reservatórios de Hidroelétricas na Integração da Geração Eólica no Sistema Interligado Nacional; Universidade Federal do Rio de Janeiro: Rio de Janeiro, Brazil, 2017. [Google Scholar]
- Lampreia, J.; de Araújo, M.S.M.; de Campos, C.P.; Freitas, M.A.V.; Rosa, L.P.; Solari, R.; Gesteira, C.; Ribas, R.; Silva, N.F. Analyses and perspectives for Brazilian low carbon technological development in the energy sector. Renew. Sustain. Energy Rev. 2011, 15, 3432–3444. [Google Scholar] [CrossRef]
- Andrade Guerra, J.B.S.O.D.; Dutra, L.; Schwinden, N.B.C.; Andrade, S.F.D. Future scenarios and trends in energy generation in brazil: supply and demand and mitigation forecasts. J. Clean. Prod. 2015, 103, 197–210. [Google Scholar] [CrossRef]
- Herreras Martínez, S.; Koberle, A.; Rochedo, P.; Schaeffer, R.; Lucena, A.; Szklo, A.; Ashina, S.; van Vuuren, D.P. Possible energy futures for Brazil and Latin America in conservative and stringent mitigation pathways up to 2050. Technol. Forecast. Soc. Chang. 2015, 98, 186–210. [Google Scholar] [CrossRef]
- Lucena, A.F.P.; Clarke, L.; Schaeffer, R.; Szklo, A.; Rochedo, P.R.R.; Nogueira, L.P.P.; Daenzer, K.; Gurgel, A.; Kitous, A.; Kober, T. Climate policy scenarios in Brazil: A multi-model comparison for energy. Energy Econ. 2016, 56, 564–574. [Google Scholar] [CrossRef]
- Nogueira de Oliveira, L.P.; Rodriguez Rochedo, P.R.; Portugal-Pereira, J.; Hoffmann, B.S.; Aragão, R.; Milani, R.; de Lucena, A.F.P.; Szklo, A.; Schaeffer, R. Critical technologies for sustainable energy development in Brazil: Technological foresight based on scenario modelling. J. Clean. Prod. 2016, 130, 12–24. [Google Scholar] [CrossRef]
- Miranda, R.; Soria, R.; Schaeffer, R.; Szklo, A.; Saporta, L. Contributions to the analysis of “Integrating large scale wind power into the electricity grid in the Northeast of Brazil”. Energy 2017, 118, 1198–1209. [Google Scholar] [CrossRef]
- De Faria, F.A.M.; Jaramillo, P. The future of power generation in Brazil: An analysis of alternatives to Amazonian hydropower development. Energy Sustain. Dev. 2017, 41, 24–35. [Google Scholar] [CrossRef]
- Lucena, A.; Szklo, A.; Schaeffer, R. Toward a Sustainable Energy Future in Brazil and IIASA’s MESSAGE MODEL; Instituto Alberto Luiz Coimbra de Pós-Graduação e Pesquisa em Engenharia/Universidade Federal do Rio de Janeiro (COPPE/UFRJ): Vienna, Austria, 2017; p. 20. [Google Scholar]
- Schaeffer, R.; Lucena, A.; Herniques, M.; Borba, B.; Freitas, M.; Haddad, E. Integrated Greenhouse Gas Emission Mitigation Scenarios for Brazil to 2050; GEF: Brasília, Brazil, 2017; p. 48. [Google Scholar]
- Portugal-Pereira, J.; Köberle, A.C.; Soria, R.; Lucena, A.F.; Szklo, A.; Schaeffer, R. Overlooked impacts of electricity expansion optimisation modelling: The life cycle side of the story. Energy 2016, 115, 1424–1435. [Google Scholar] [CrossRef]
- Gils, H.C.; Scholz, Y.; Pregger, T.; Luca de Tena, D.; Heide, D. Integrated modelling of variable renewable energy-based power supply in Europe. Energy 2017, 123, 173–188. [Google Scholar] [CrossRef]
- Lindfeldt, E.G.; Saxe, M.; Magnusson, M.; Mohseni, F. Strategies for a road transport system based on renewable resources—The case of an import-independent Sweden in 2025. Appl. Energy 2010, 87, 1836–1845. [Google Scholar] [CrossRef]
- Taibi, E.; Gielen, D.; Bazilian, M. The potential for renewable energy in industrial applications. Renew. Sustain. Energy Rev. 2012, 16, 735–744. [Google Scholar] [CrossRef]
- Connolly, D.; Lund, H.; Mathiesen, B.V.; Leahy, M. The first step towards a 100% renewable energy-system for Ireland. Appl. Energy 2011, 88, 502–507. [Google Scholar] [CrossRef]
- Mathiesen, B.V.; Lund, H.; Connolly, D.; Wenzel, H.; Østergaard, P.A.; Möller, B.; Nielsen, S.; Ridjan, I.; Karnøe, P.; Sperling, K.; et al. Smart Energy Systems for coherent 100% renewable energy and transport solutions. Appl. Energy 2015, 145, 139–154. [Google Scholar] [CrossRef]
- Gils, H.C.; Simon, S. Carbon neutral archipelago–100% renewable energy supply for the Canary Islands. Appl. Energy 2017, 188, 342–355. [Google Scholar] [CrossRef]
- Gils, H.C. Economic potential for future demand response in Germany—Modeling approach and case study. Appl. Energy 2016, 162, 401–415. [Google Scholar] [CrossRef] [Green Version]
- Empresa de Pesquisa Energéticas (EPE). Plano Decenal de Expansão 2024; Empresa de Pesquisa Energéticas: Rio de Janeiro, Brazil, 2015.
- Operador Nacional do Sistema Elétrico (ONS). Plano de Operação Energética 2014/2018; Operador Nacional do Sistema Elétrico: Brasília, Brazil, 2014. [Google Scholar]
- Simon, S.; Naegler, T.; Gils, H.C. Transformation towards a renewable energy system in Brazil and Mexico. Renew. Sustain. Energy Rev. 2017. submitted. [Google Scholar]
- Instituto Brasileiro de Geografia e Estatística (IBGE). Densidade Demográfica 2010. Instituto Brasileiro de Geografia e Estatística, Diretoria De Geociências. Available online: ftp://geoftp.ibge.gov.br/cartas_e_mapas/mapas_do_brasil/sociedade_e_economia/mapas_murais/densidade_populacional_2010.pdf (accessed on 23 October 2017).
- Instituto Brasileiro de Geografia e Estatística (IBGE). Contas Regionais do Brasil: 2010–2014. Instituto Brasileiro de Geografia e Estatística, Diretoria De Pesquisas. Available online: https://biblioteca.ibge.gov.br/visualizacao/livros/liv98881.pdf (accessed on 23 October 2017).
- Operador Nacional do Sistema Elétrico (ONS). Reporte da Modalidade de Operação de Usinas-Arquivo Excel “Modalidade Para o Site—Usinas Individualizadas” Operador Nacional do Sistema Elétrico. Available online: http://www.ons.org.br/integracao_sin/definicao_modalidade_de_operacao_de_usinas.aspx (accessed on 1 October 2014).
- Christian, H. Balancing of Intermittent Renewable Power Generation by Demand Response and Thermal Energy Storage; Universität Stuttgart: Stuttgart, Germany, 2015. [Google Scholar]
- Agência Nacional de Energia Elétrica (ANEEL). Banco de Informações de Geração. Agência Nacional de Energia Elétrica. Available online: http://www2.aneel.gov.br/aplicacoes/capacidadebrasil/capacidadebrasil.cfm (accessed on 1 July 2016).
- ONS. Definição da Modalidade de Operação de Usinas. Operador Nacional do Sistema Elétrico. Available online: http://www.ons.org.br/integracao_sin/definicao_modalidade_de_operacao_de_usinas.aspx (accessed on 1 January 2016).
- Fundación Proteger. International Rivers; ECOA Dams in Amazonia. Available online: http://dams-info.org/en (accessed on 1 November 2017).
- SIGEL ANEEL. Setor Elétrico Brasileiro 2017. Agência Nacional de Energia Elétrica. Available online: http://sigel.aneel.gov.br/sigel.html (accessed on 23 October 2017).
- Stetter, D. Enhancement of the REMix Energy System Model: Global Renewable Energy Potentials, Optimized Power Plant Siting and Scenario Validation. Ph.D. Thesis, University of Stuttgart, Stuttgart, Germany, 2014. [Google Scholar]
- ONS. Histórico de Vazões—Série de Vazões Naturais Médias Diárias 1931–2012. Operador Nacional do Sistema Elétrico. Available online: http://www.ons.org.br/operacao/vazoes_naturais.aspx (accessed on 31 October 2014).
- Assis, L.E.; Beluco, A.; de Almeida, L.E.B. On the wave energy potential along the southern coast of Brazil. Int. J. Energy Environ. 2014, 5, 59–66. [Google Scholar] [CrossRef]
- United States Geological Survey (USGS). 2013 Minerals Yearbook, Brazil [Advance Release]; United States Geological Survey: Reston, VA, USA, 2016.
- Associação Brasileira de Celulose e Papel (BRACELPA). Conjuntura Bracelpa, NO. 64, March 2014. Associação Brasileira de Celulose e Papel. Available online: http://www.paperage.com/2014news/Brazil_pulp_paper_sector_report_March2014.pdf (accessed on 1 November 2017).
- Abiclor. Relatório Anual 2012. Indústria Brasileira de Álcalis, Cloro e Derivados. Available online: http://clorosur.org/wp-content/uploads/Abiclor-Relatorio-Estatistico-2012.pdf (accessed on 8 September 2017).
- Empresa de Pesquisa Energéticas (EPE). Anuário Estatístico de Energia Elétrica 2014—Ano base 2013; Empresa de Pesquisa Energéticas: Rio de Janeiro, Brazil, 2014.
- Gils, H.C. Assessment of the theoretical demand response potential in Europe. Energy 2014, 67, 1–18. [Google Scholar] [CrossRef]
- ISE. Current and Future Cost of Photovoltaics; Long-Term Scenarios for Market Development, System Prices and LCOE of Utilityscale Pv-Systems; Fraunhofer-Institut für Solare Energiesysteme (Fhg-ISE): Freiburg, Germany; Agora Energiewende: Berlin, Germany, 2015. [Google Scholar]
- International Renewable Energy Agency (IRENA). Renewable Power Generation Costs in 2014; International Renewable Energy Agency: Abu Dhabi, UAE, 2015. [Google Scholar]
- Danish Energy Agency (DEA). Technology Data for Energy Plants; Danish Energy Agency: Copenhagen, Denmark; Energinet.dk: Erritsø, Denmark, 2012.
- Nitsch, J.; Pregger, T.; Naegler, T.; Heide, D.; Tena, D.L.D.; Trieb, F.; Scholz, Y.; Nienhaus, K.; Gerhardt, N.; Sterner, M.; et al. Langfristszenarien und Strategien für den Ausbau der erneuerbaren Energien in Deutschland bei Berücksichtigung der Entwicklung in Europa und Global; Deutsches Zentrum für Luft- und Raumfahrt: Stuttgart, Germany; Fraunhofer Institut für Windenergie und Energiesystemtechnik (IWES): Kassel, Germany; Ingenieurbüro für neue Energien (IFNE): Teltow, Germany, 2012.
- Fuchs, G.; Lunz, B.; Leuthold, M.; Sauer, D.U. Technology Overview on Electricity Storage; Technical Report; ISEA: Aachen, Germany, 2012. [Google Scholar]
- Noack, C.; Burggraf, F.; Hosseiny, S.S.; Lettenmeier, P.; Kolb, S.; Belz, S.; Kallo, J.; Friedrich, K.A.; Pregger, T.; Cao, K.-K. Studie Über Die Planung Einer Demonstrationsanlage Zur Wasserstoff-Kraftstoffgewinnung Durch Elektrolyse mit Zwischenspeicherung in Salzkavernen unter Druck; German Aerospace Center: Stuttgart, Germany, 2015. [Google Scholar]
- Ministério das Minas e Energia (MME); Empresa de Pesquisa Energéticas (EPE). Estudos de Demanda de Energia 2050: Nota Técnica DEA 13/14; Ministério das Minas e Energia, Empresa de Pesquisa Energéticas Brasil: Rio de Janeiro, Brazil, 2014.
- Fichter, T.; Soria, R.; Szklo, A.; Schaeffer, R.; Lucena, A.F.P. Assessing the potential role of concentrated solar power (CSP) for the northeast power system of Brazil using a detailed power system model. Energy 2017, 121, 695–715. [Google Scholar] [CrossRef]
- Becker, S.; Rodriguez, R.A.; Andresen, G.B.; Schramm, S.; Greiner, M. Transmission grid extensions during the build-up of a fully renewable pan-European electricity supply. Energy 2014, 64, 404–418. [Google Scholar] [CrossRef]
- Rasmussen, M.G.; Andresen, G.B.; Greiner, M. Storage and balancing synergies in a fully or highly renewable pan-European power system. Energy Policy 2012, 51, 642–651. [Google Scholar] [CrossRef]
- Rodríguez, R.A.; Becker, S.; Andresen, G.B.; Heide, D.; Greiner, M. Transmission needs across a fully renewable European power system. Renew. Energy 2014, 63, 467–476. [Google Scholar] [CrossRef]
- Rodriguez, R.A.; Becker, S.; Greiner, M. Cost-optimal design of a simplified, highly renewable pan-European electricity system. Energy 2015, 83, 658–668. [Google Scholar] [CrossRef]
- Schaber, K.; Steinke, F.; Hamacher, T. Transmission grid extensions for the integration of variable renewable energies in Europe: Who benefits where? Energy Policy 2012, 43, 123–135. [Google Scholar] [CrossRef]
- Schaber, K.; Steinke, F.; Mühlich, P.; Hamacher, T. Parametric study of variable renewable energy integration in Europe: Advantages and costs of transmission grid extensions. Energy Policy 2012, 42, 498–508. [Google Scholar] [CrossRef]
- Scholz, Y.; Gils, H.C.; Pietzcker, R.C. Application of a high-detail energy system model to derive power sector characteristics at high wind and solar shares. Energy Econ. 2017, 64, 568–582. [Google Scholar] [CrossRef]
- Soria, R.; Portugal-Pereira, J.; Szklo, A.; Milani, R.; Schaeffer, R. Hybrid concentrated solar power (CSP)–biomass plants in a semiarid region: A strategy for CSP deployment in Brazil. Energy Policy 2015, 86, 57–72. [Google Scholar] [CrossRef]
- Agência Nacional de Energia Elétrica (ANEEL). Banco de Preços, Módulos de linhas de Transmissão. Agência Nacional de Energia Elétrica. Available online: http://www.aneel.gov.br/cedoc/areh2009758.rar (accessed on 1 April 2015).
- Trieb, F.; Schillings, C.; Pregger, T.; O’Sullivan, M. Solar electricity imports from the Middle East and North Africa to Europe. Energy Policy 2012, 42, 341–353. [Google Scholar] [CrossRef]
- Oswald, B.R. Elektrische Kraftwerke und Netze; Springer: Berlin/Heidelberg, Germany, 2011. [Google Scholar]
Figure 1.
Shares of renewable and fossil energy in primary energy and power production in Brazil in 2014 based on statistics from [1,2].
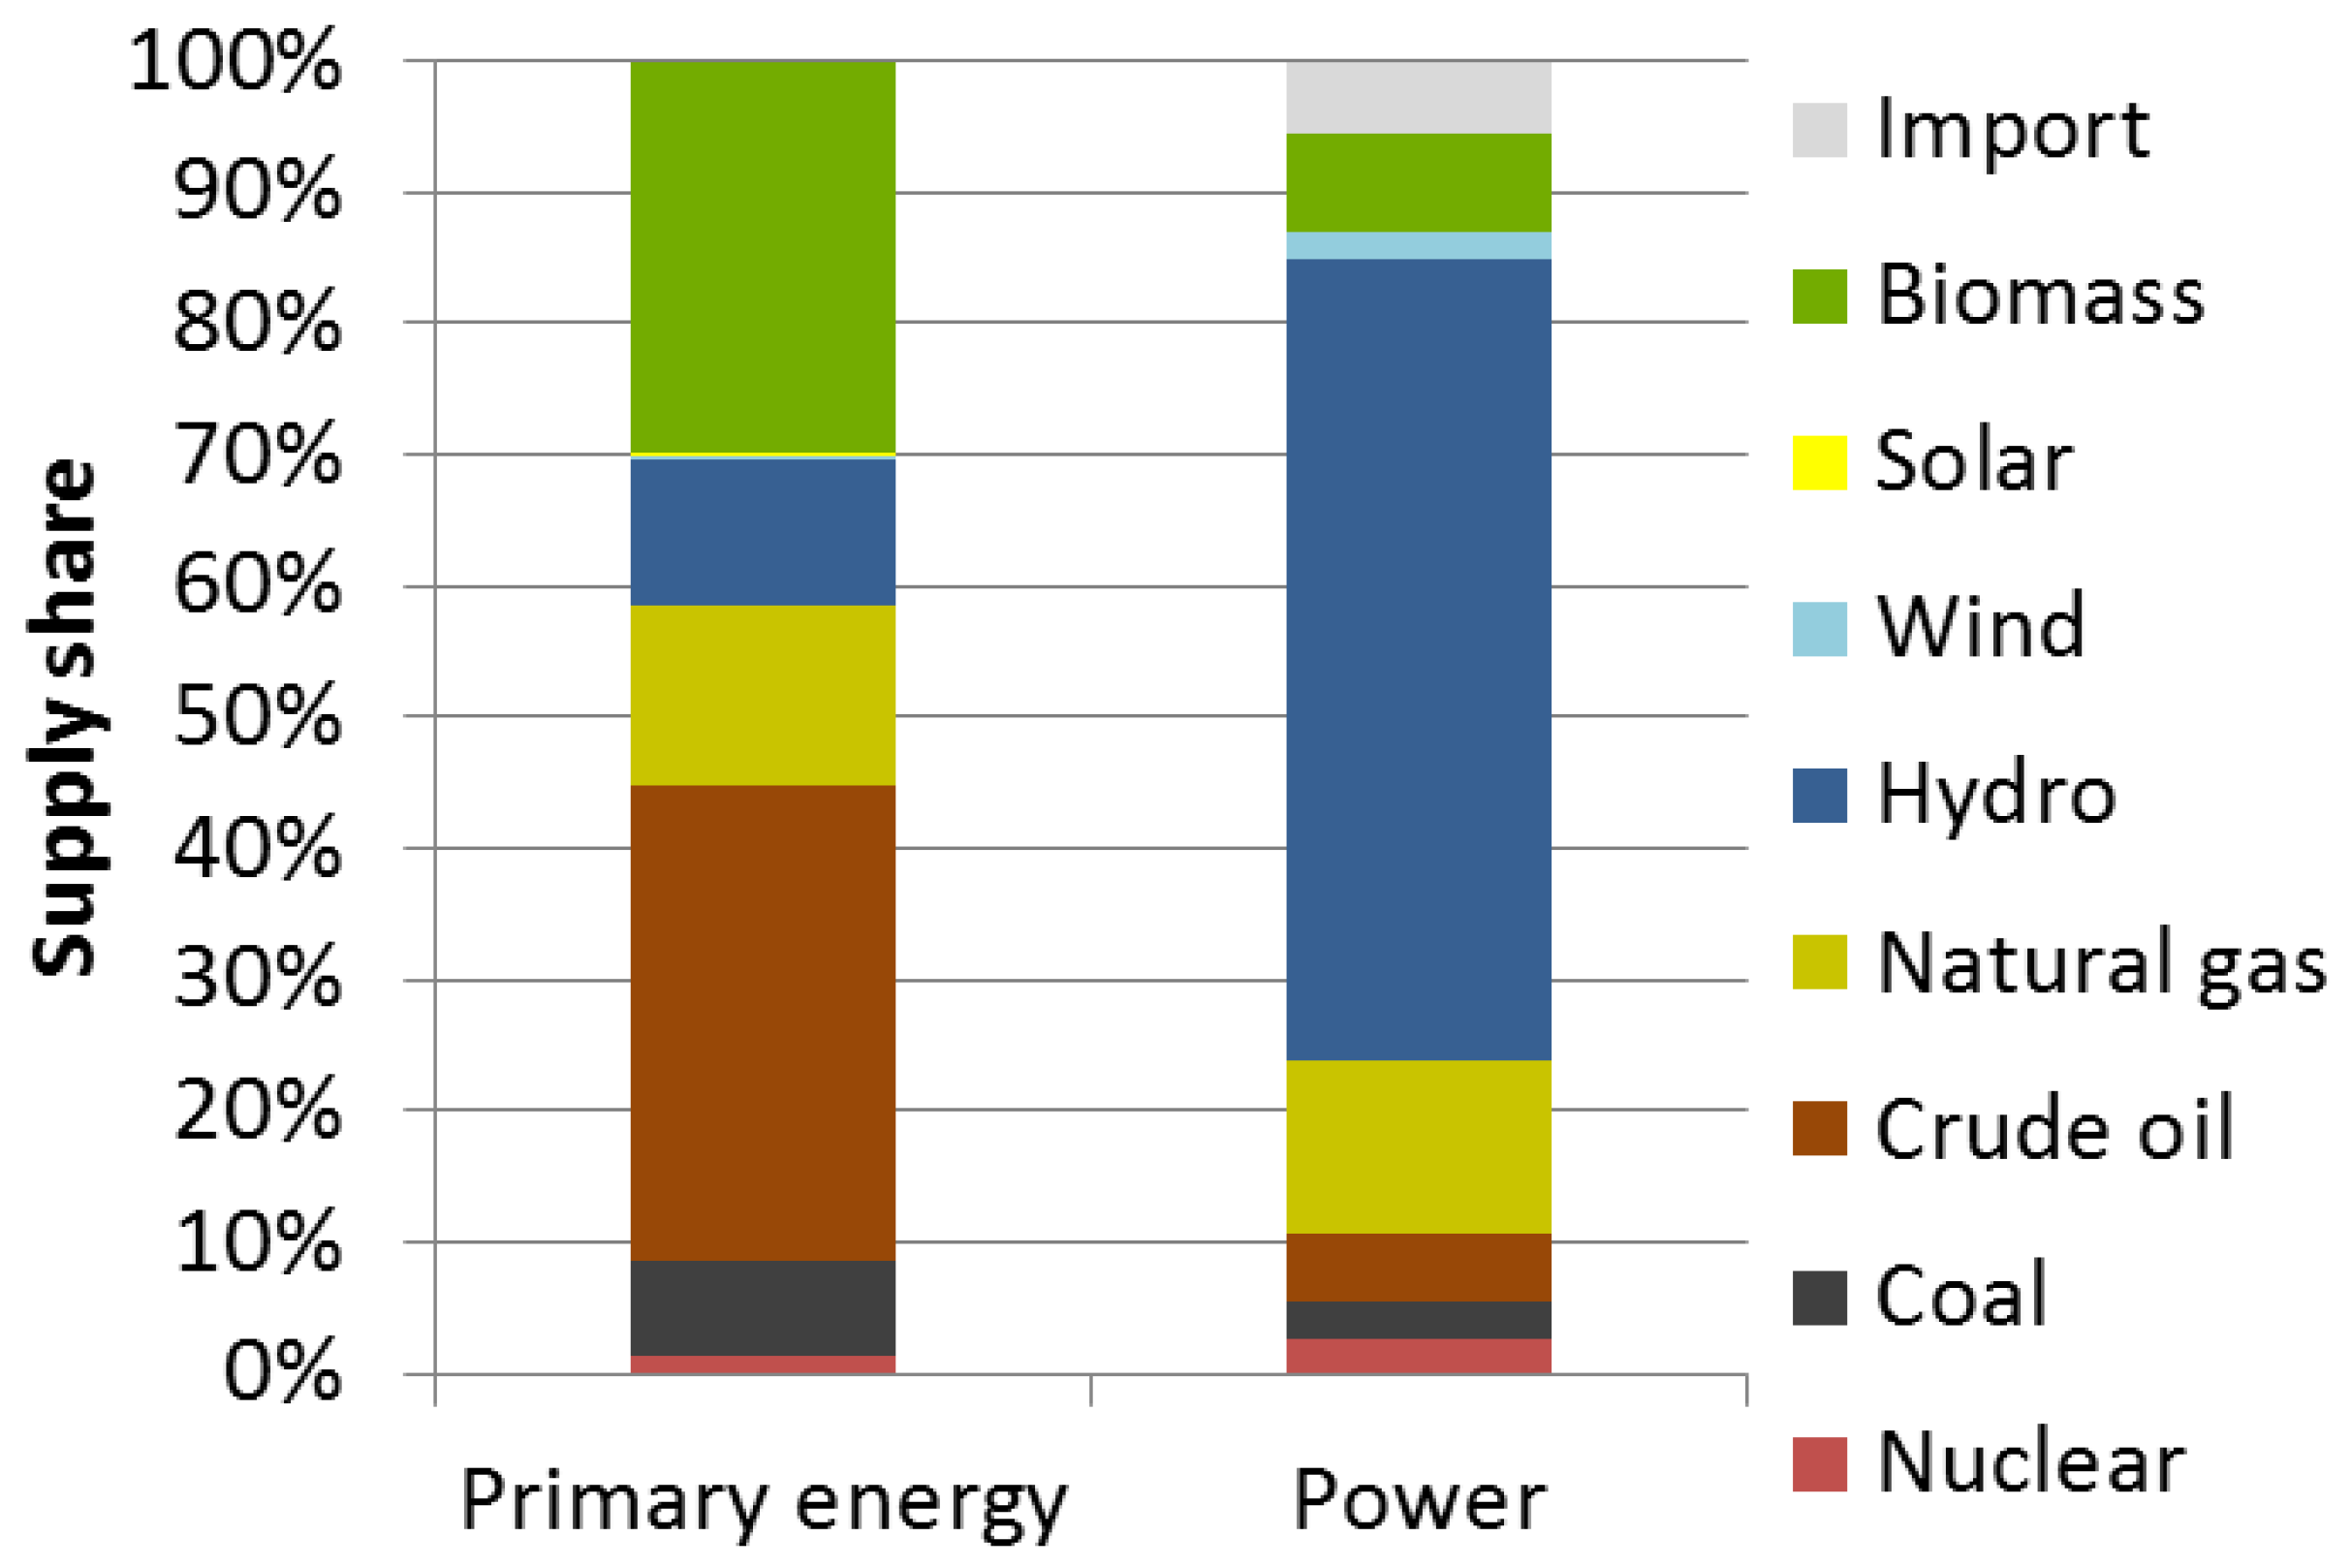
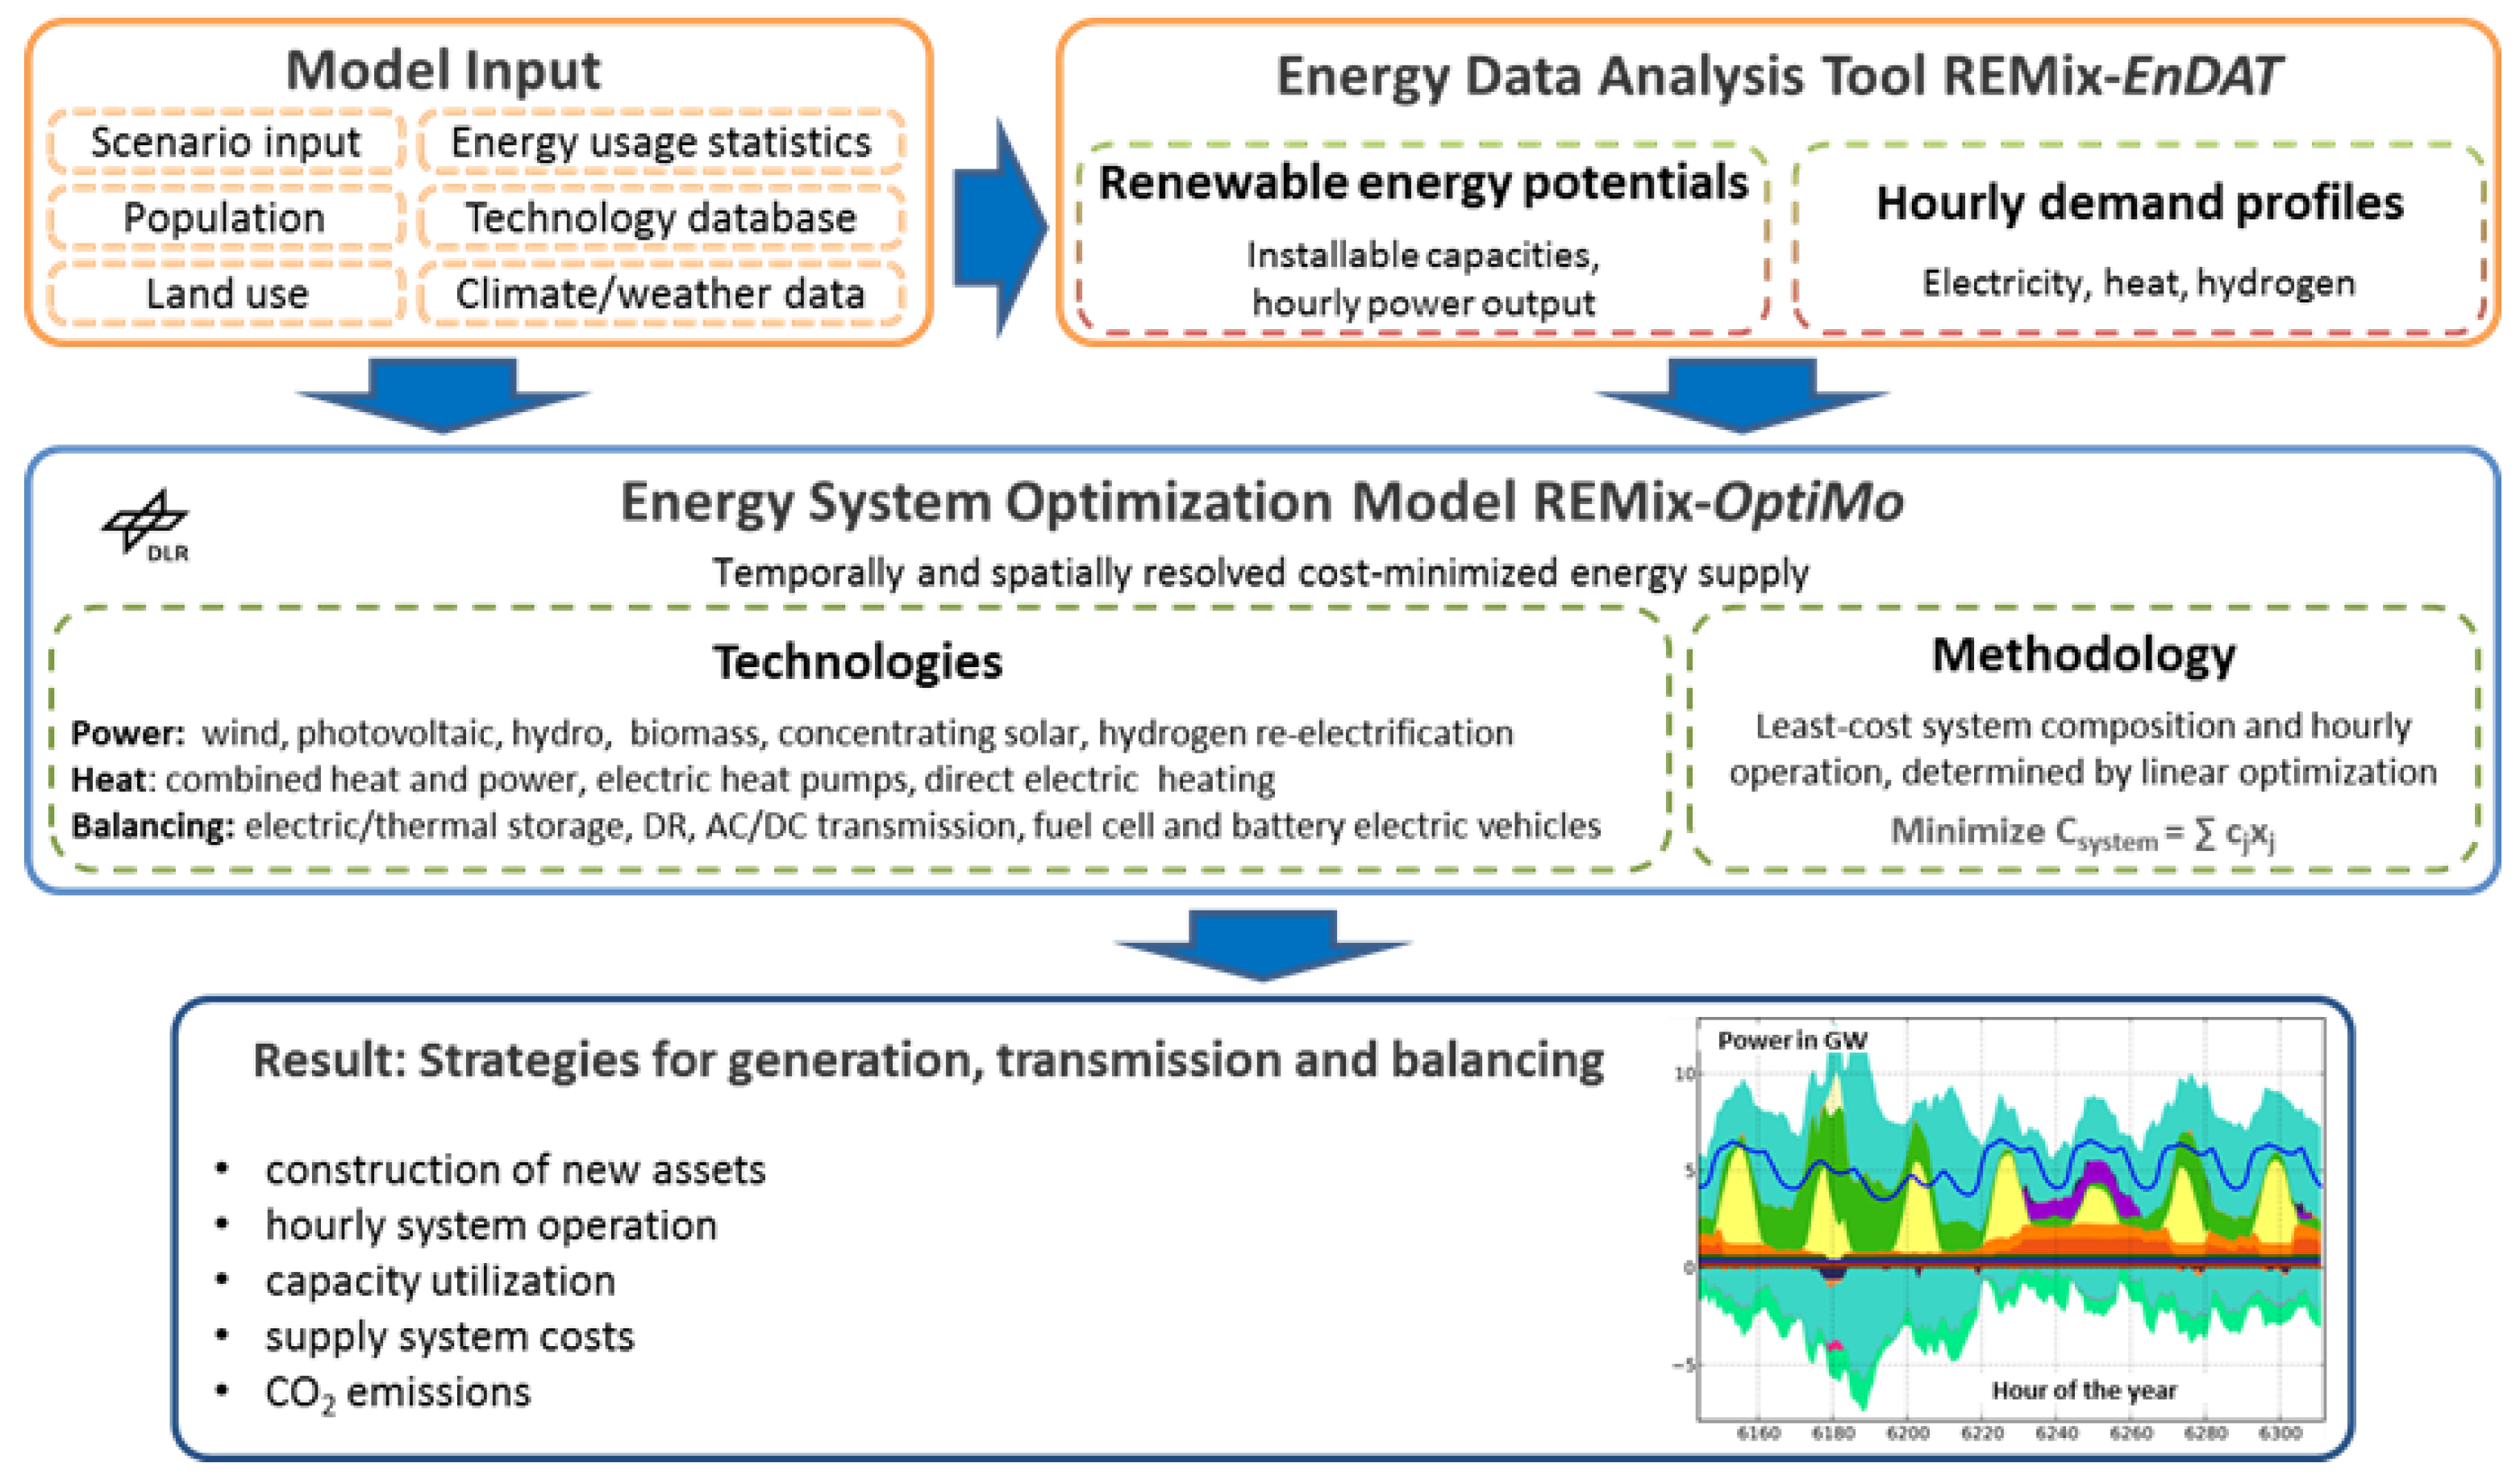
Figure 2.
Overview of the REMix model structure.

Figure 3.
Map showing model regions, net transfer capacities of existing grid connections in GW, and major hydroelectric plants Belo Monte, Teles Pires and Itaipu. Connections marked with an asterisk (*) have different transfer capacities depending on the direction of power flows (Table A2).
Figure 3.
Map showing model regions, net transfer capacities of existing grid connections in GW, and major hydroelectric plants Belo Monte, Teles Pires and Itaipu. Connections marked with an asterisk (*) have different transfer capacities depending on the direction of power flows (Table A2).
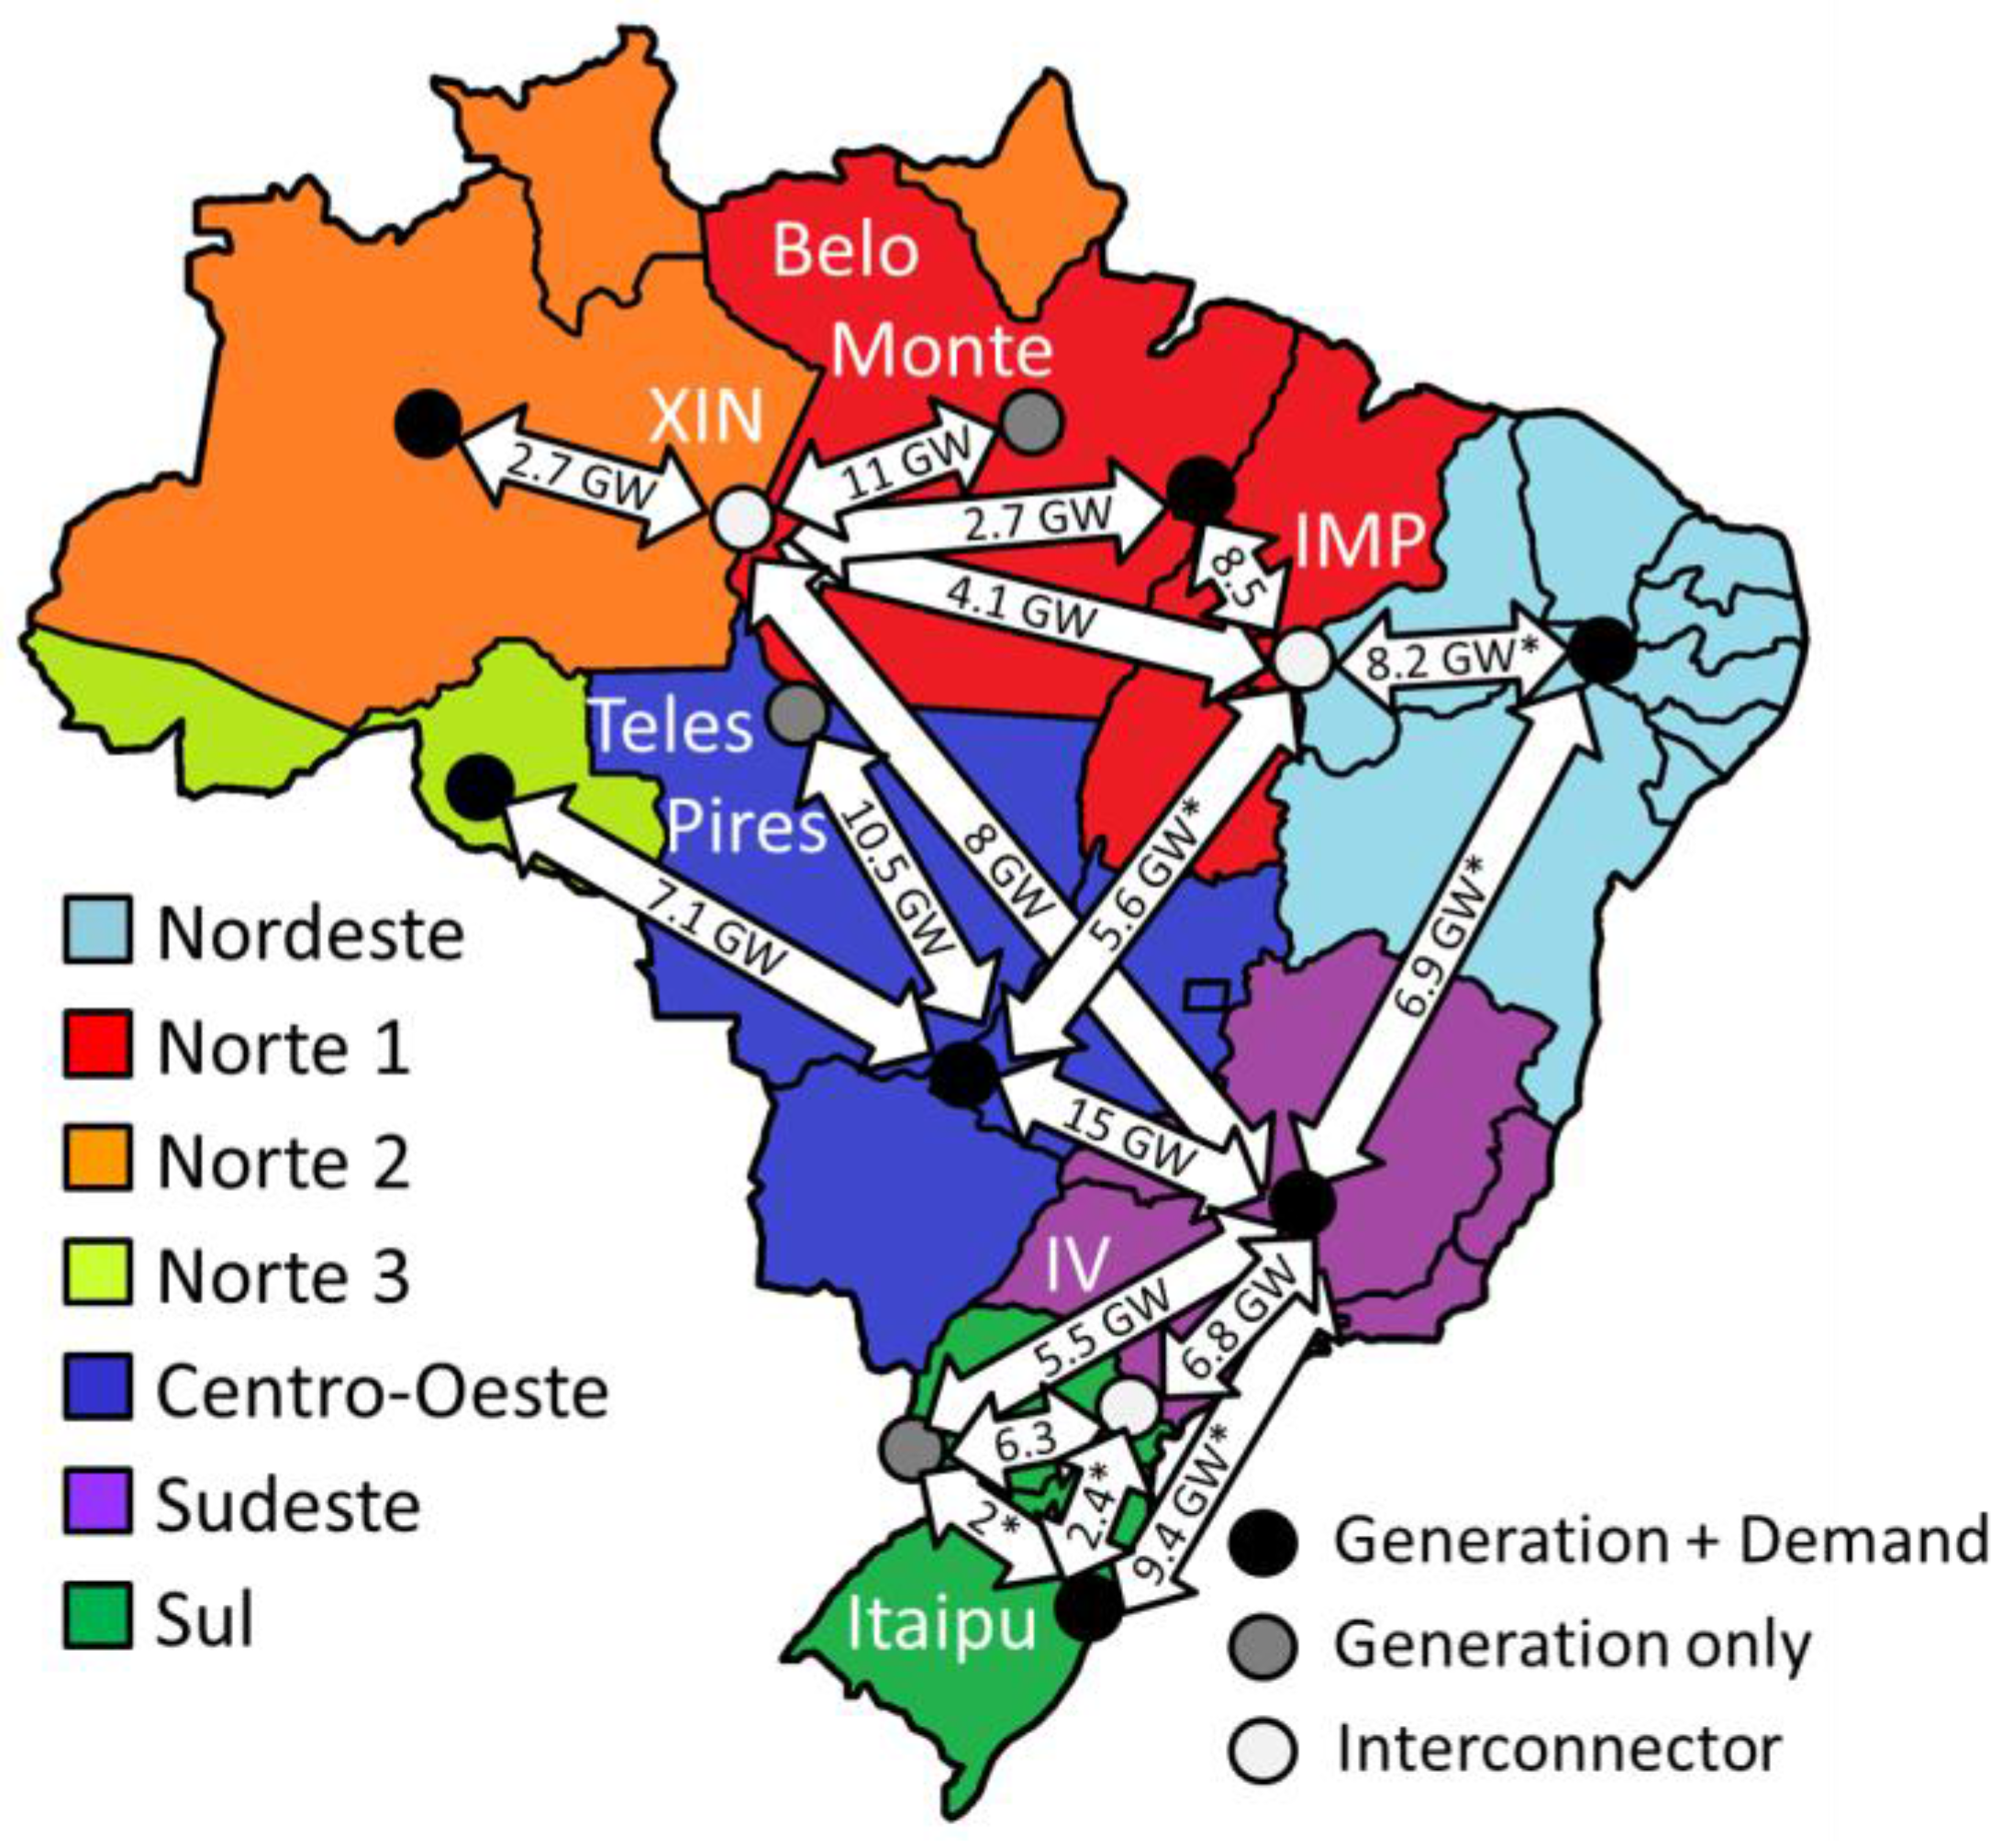
Figure 4.
Exogenously defined power generation capacities for 100% renewable power supply in 2050. S, M, and L abbreviate the considered size classes of hydropower stations (see main text).
Figure 4.
Exogenously defined power generation capacities for 100% renewable power supply in 2050. S, M, and L abbreviate the considered size classes of hydropower stations (see main text).
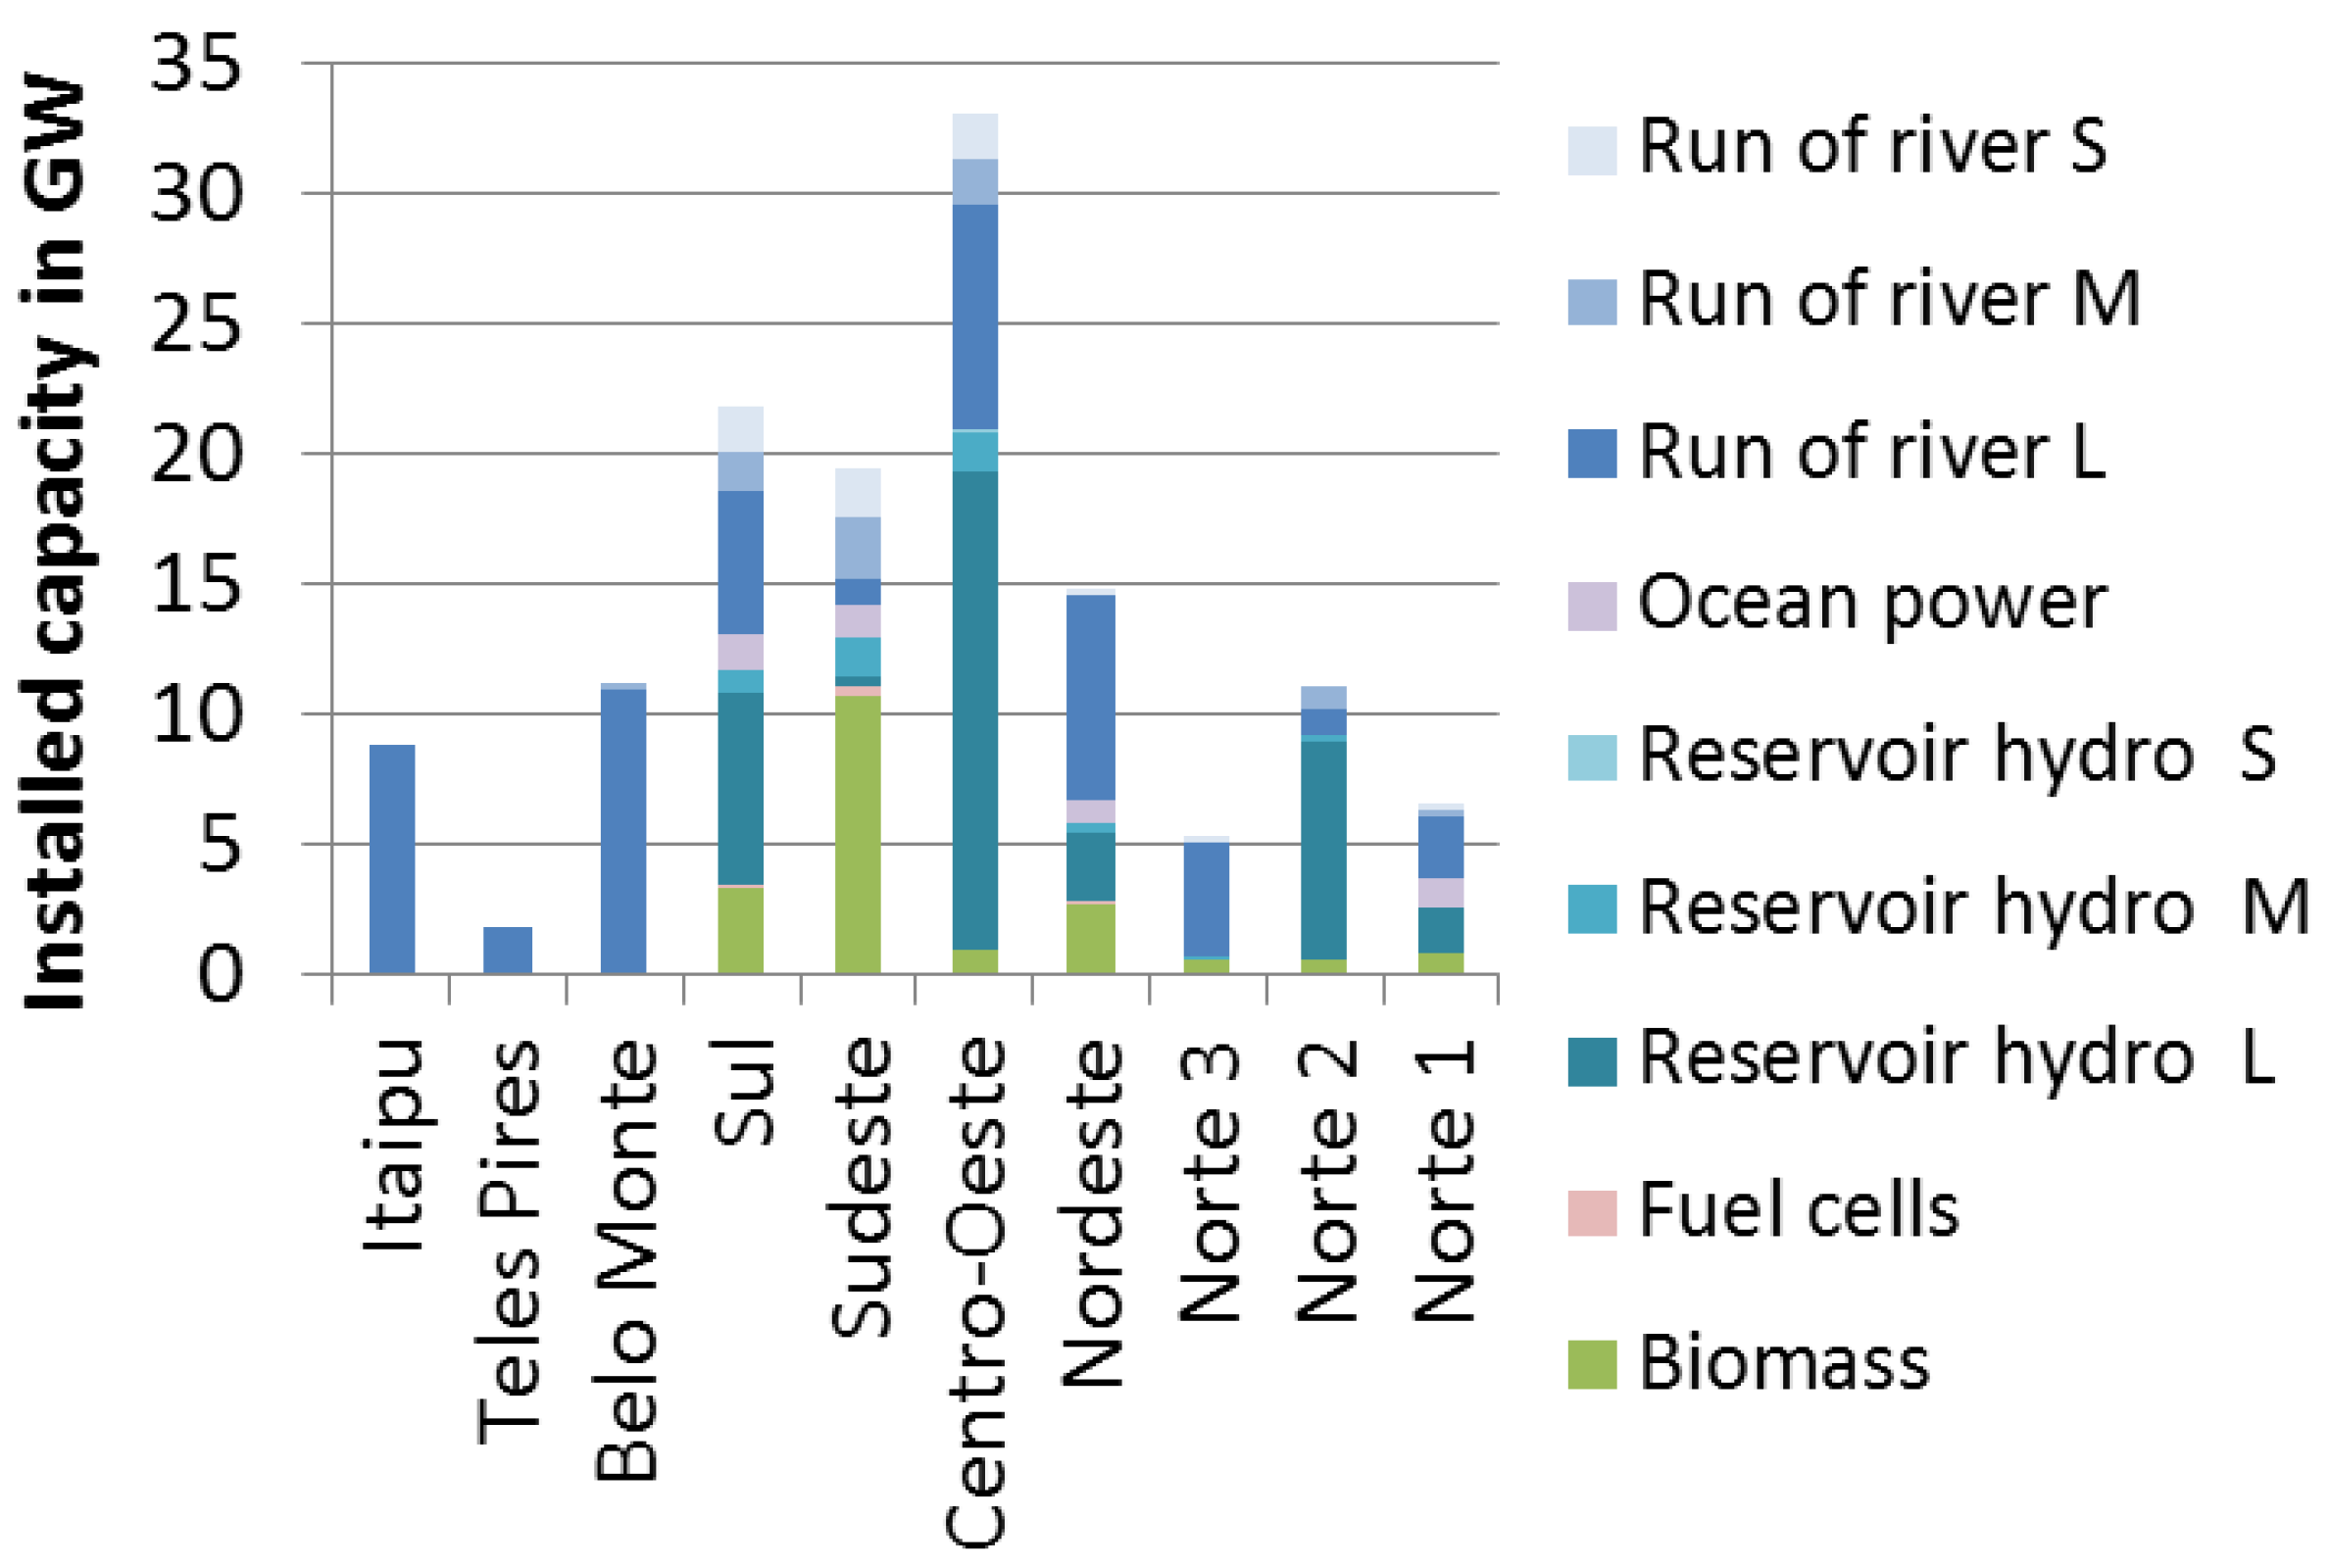
Figure 5.
Scenario comparison of calculated regional solar and wind power generation capacities in 2050.
Figure 5.
Scenario comparison of calculated regional solar and wind power generation capacities in 2050.

Figure 6.
Scenario comparison of the resulting power generation structure in 2050.
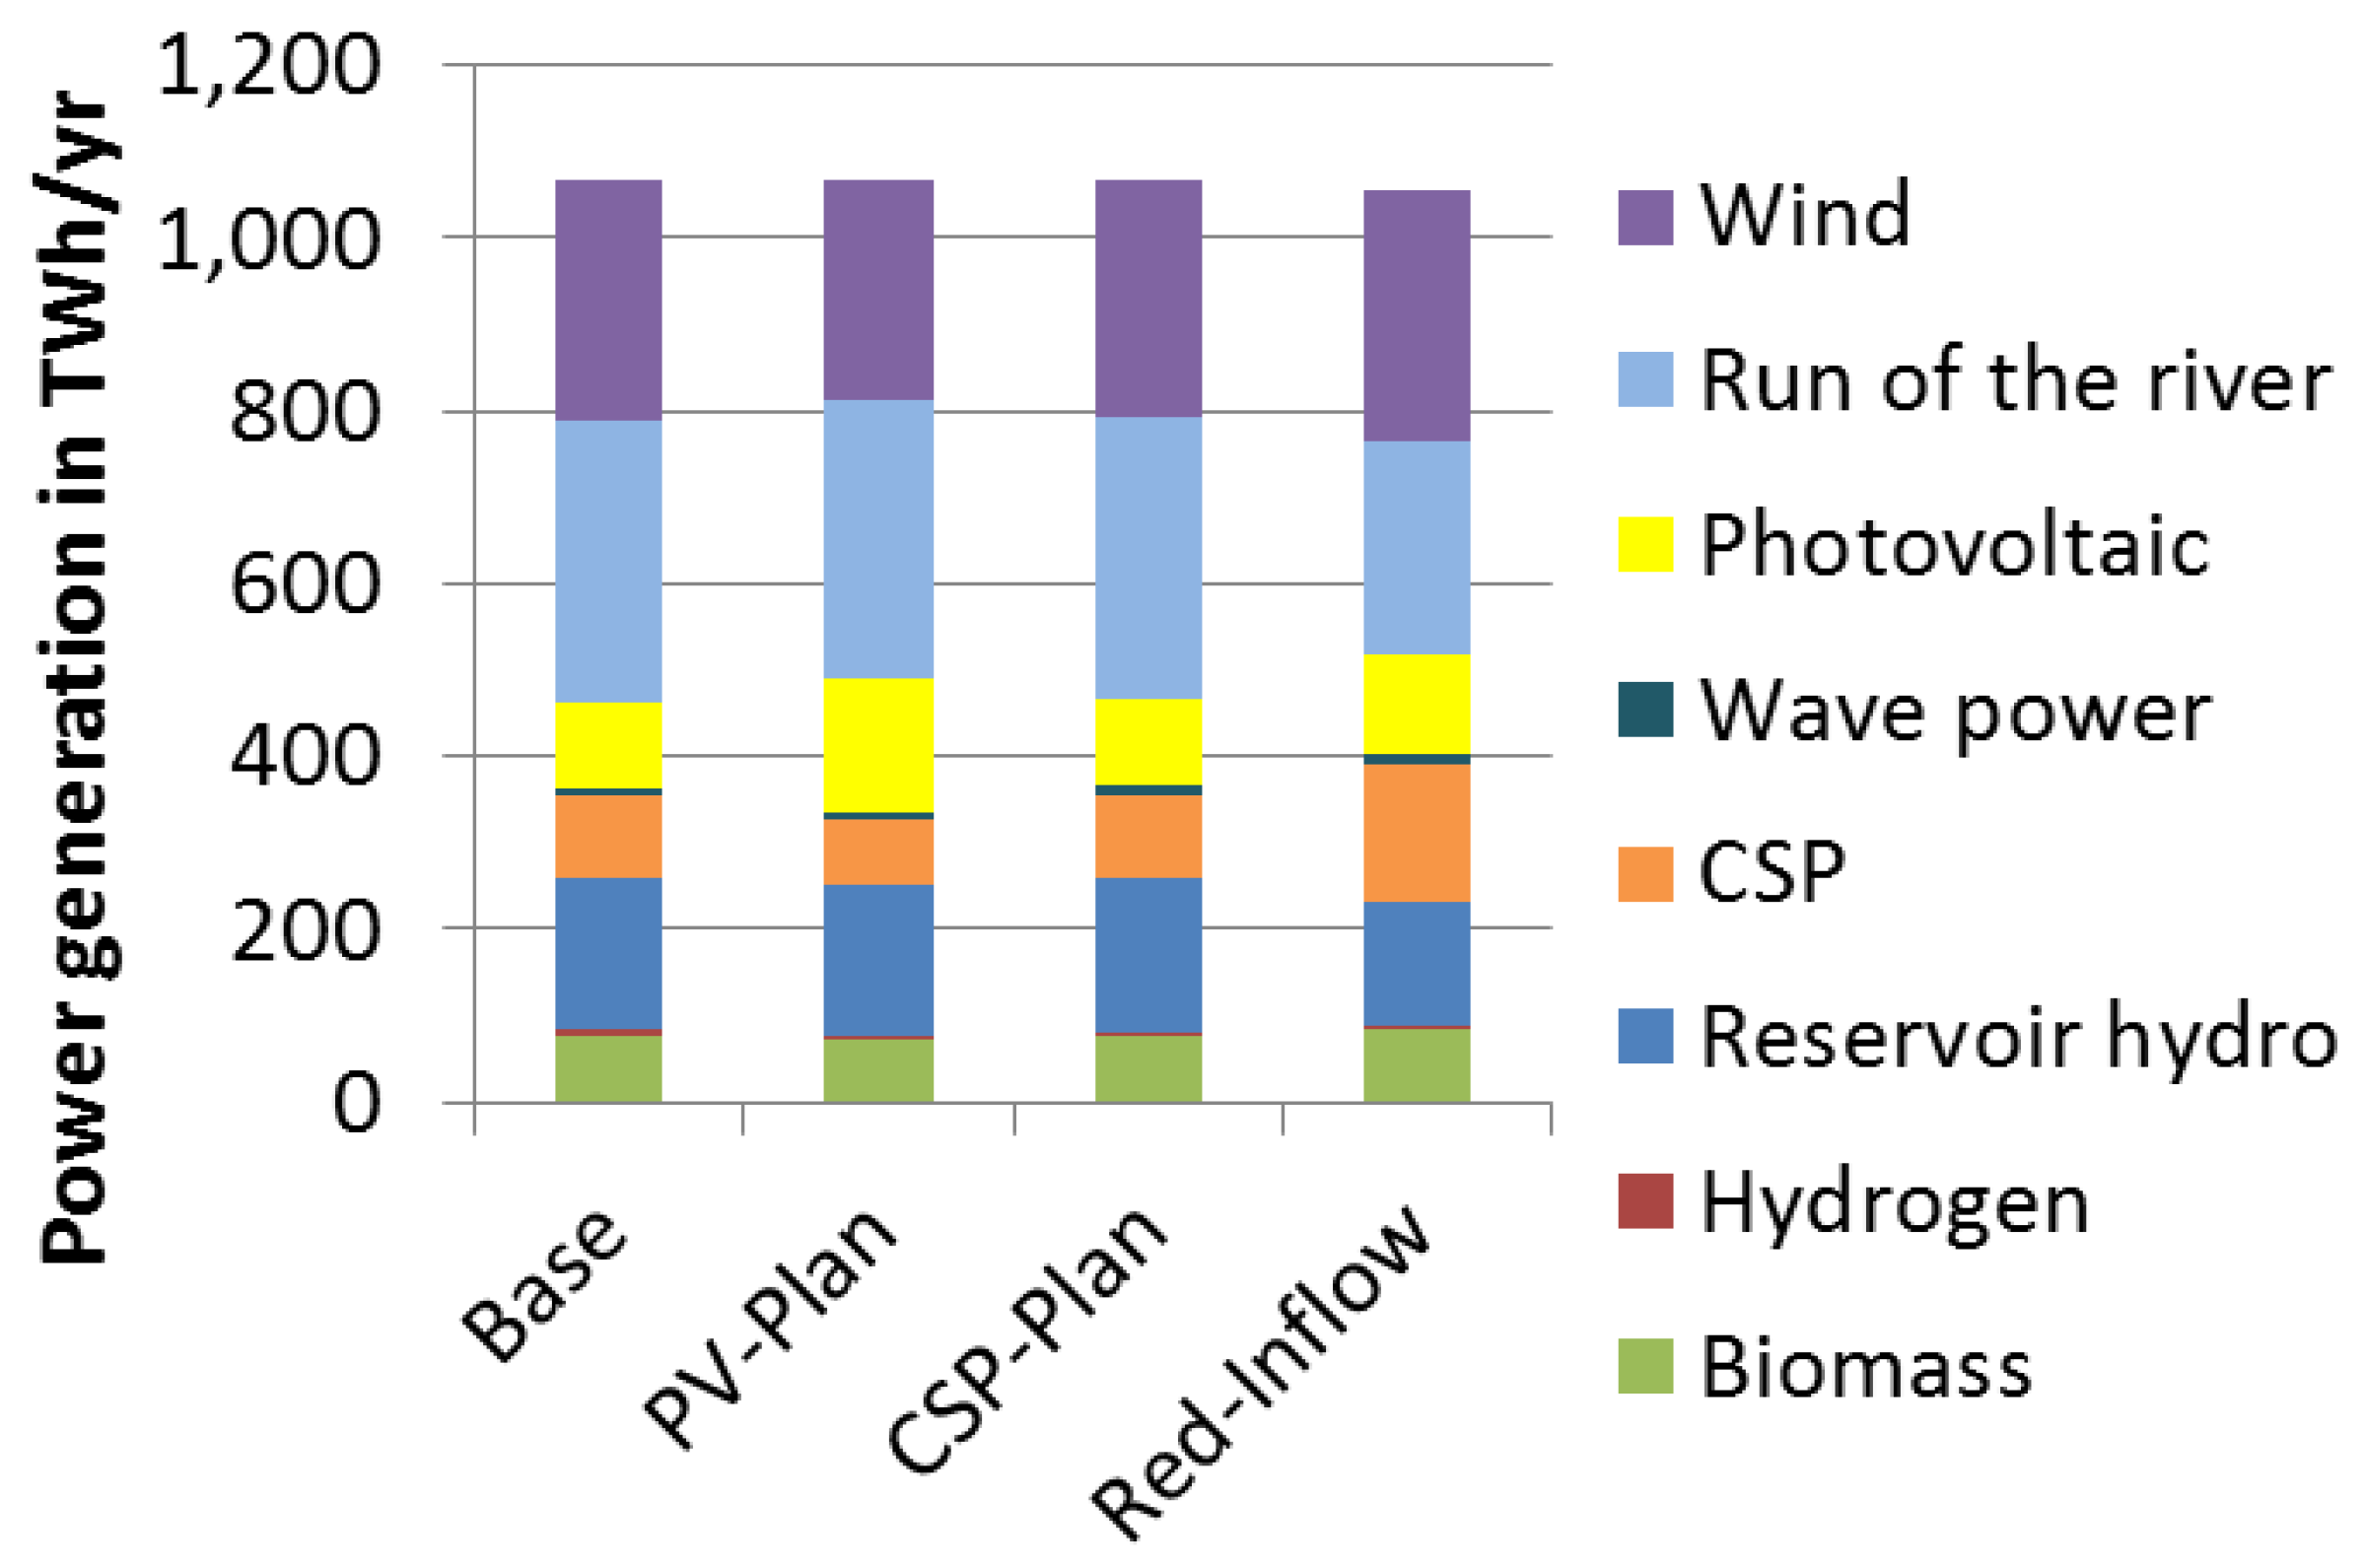
Figure 7.
Model endogenous grid capacity expansion in scenario Base in GW. Values for the other scenarios are similar and summarized in Table S10.
Figure 7.
Model endogenous grid capacity expansion in scenario Base in GW. Values for the other scenarios are similar and summarized in Table S10.
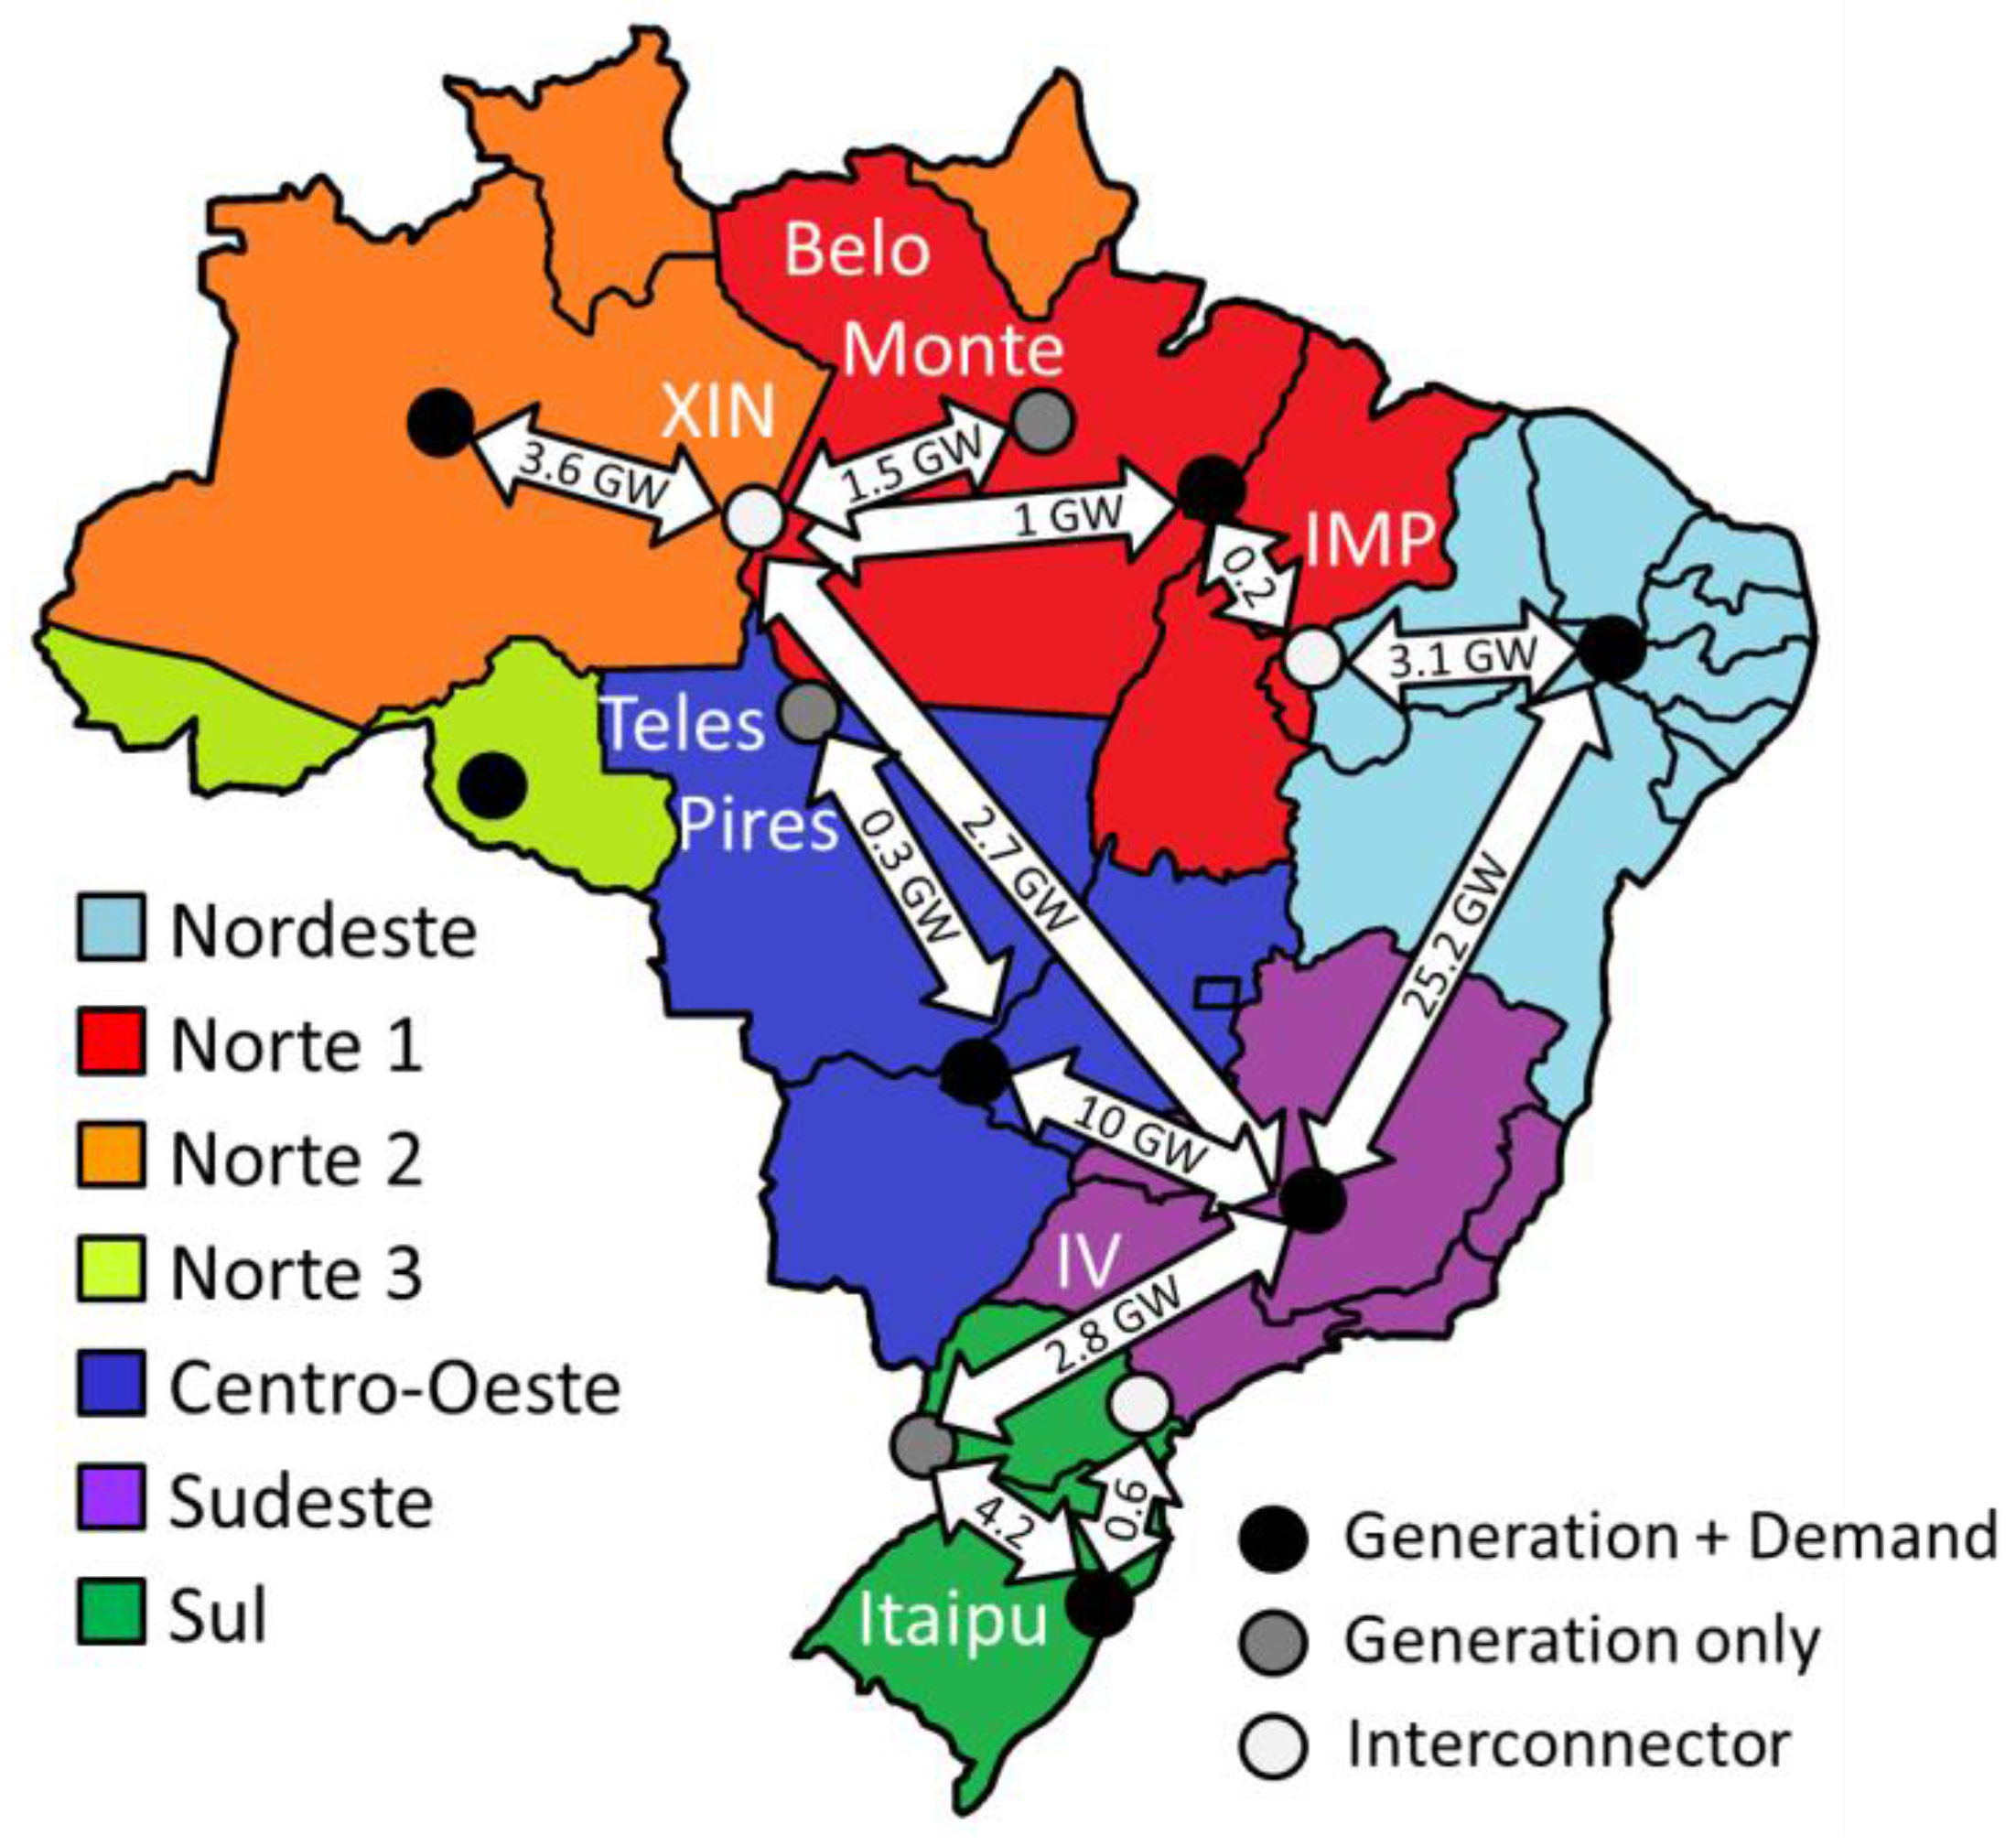
Figure 8.
Calculated annual power transmission between the regions; positive values indicate net imports, while negative values net exports in 2050.
Figure 8.
Calculated annual power transmission between the regions; positive values indicate net imports, while negative values net exports in 2050.
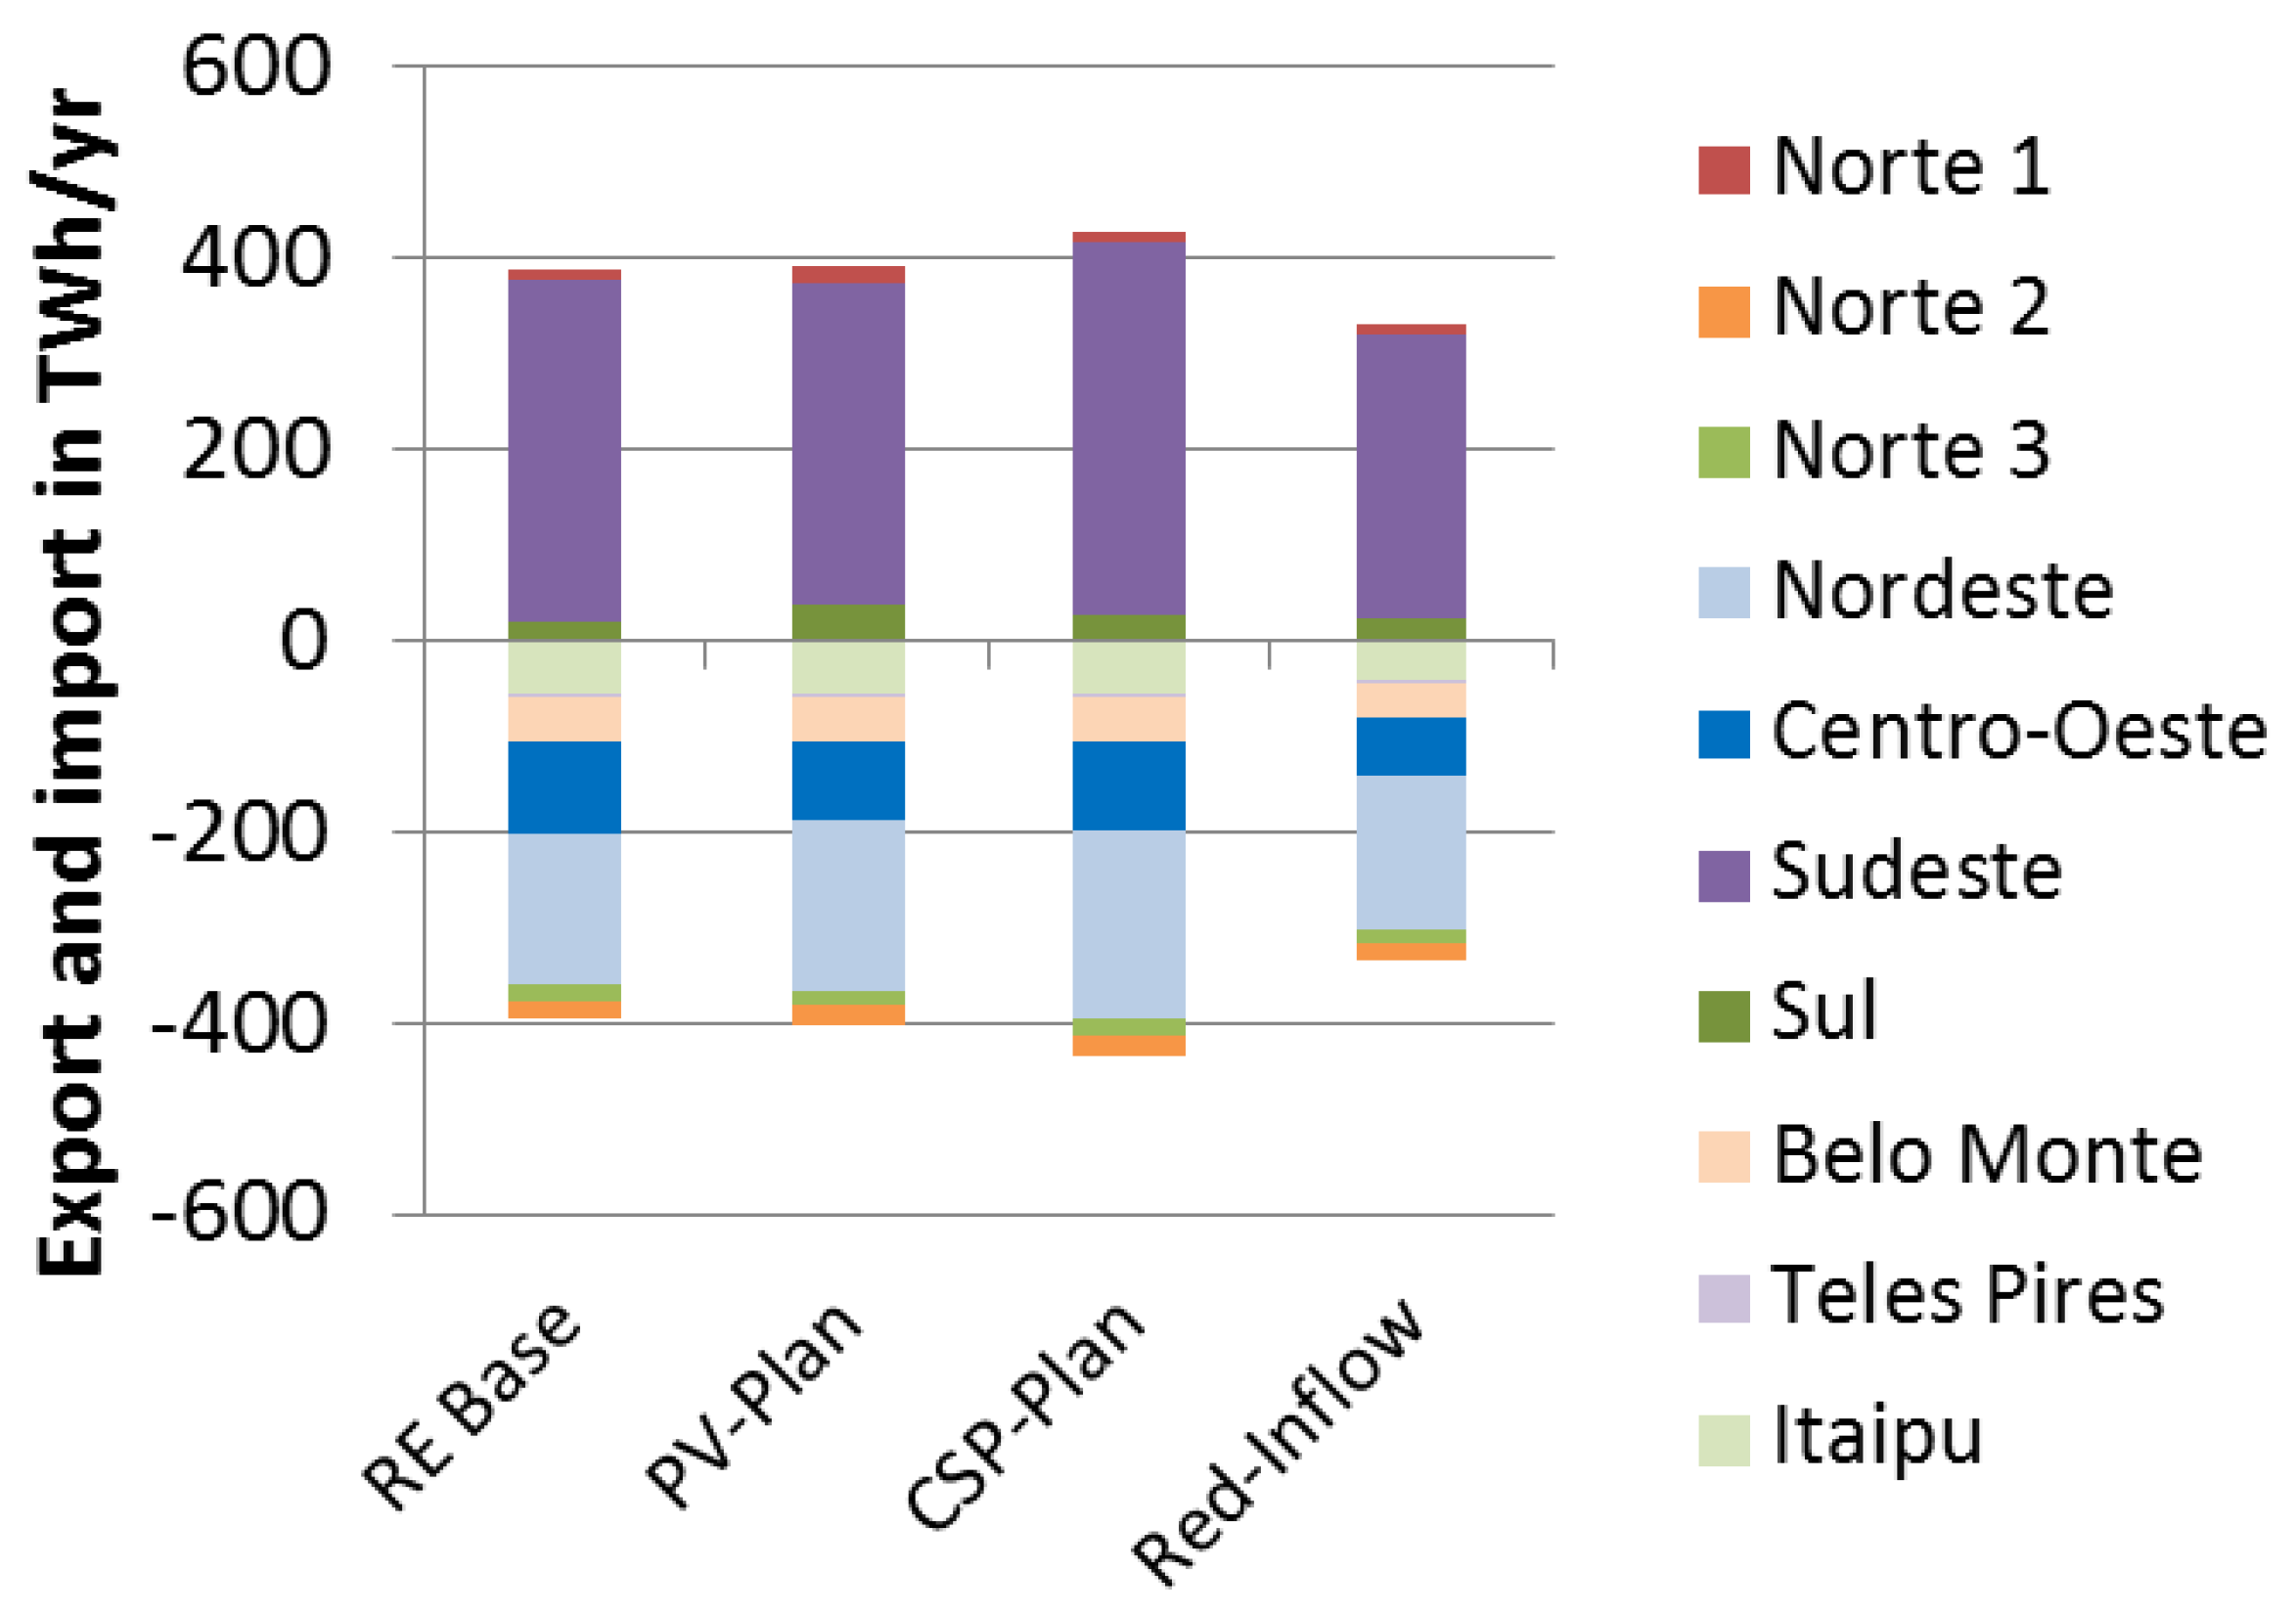
Figure 9.
Calculated power supply costs per unit of demand, subdivided by technology in 2050.
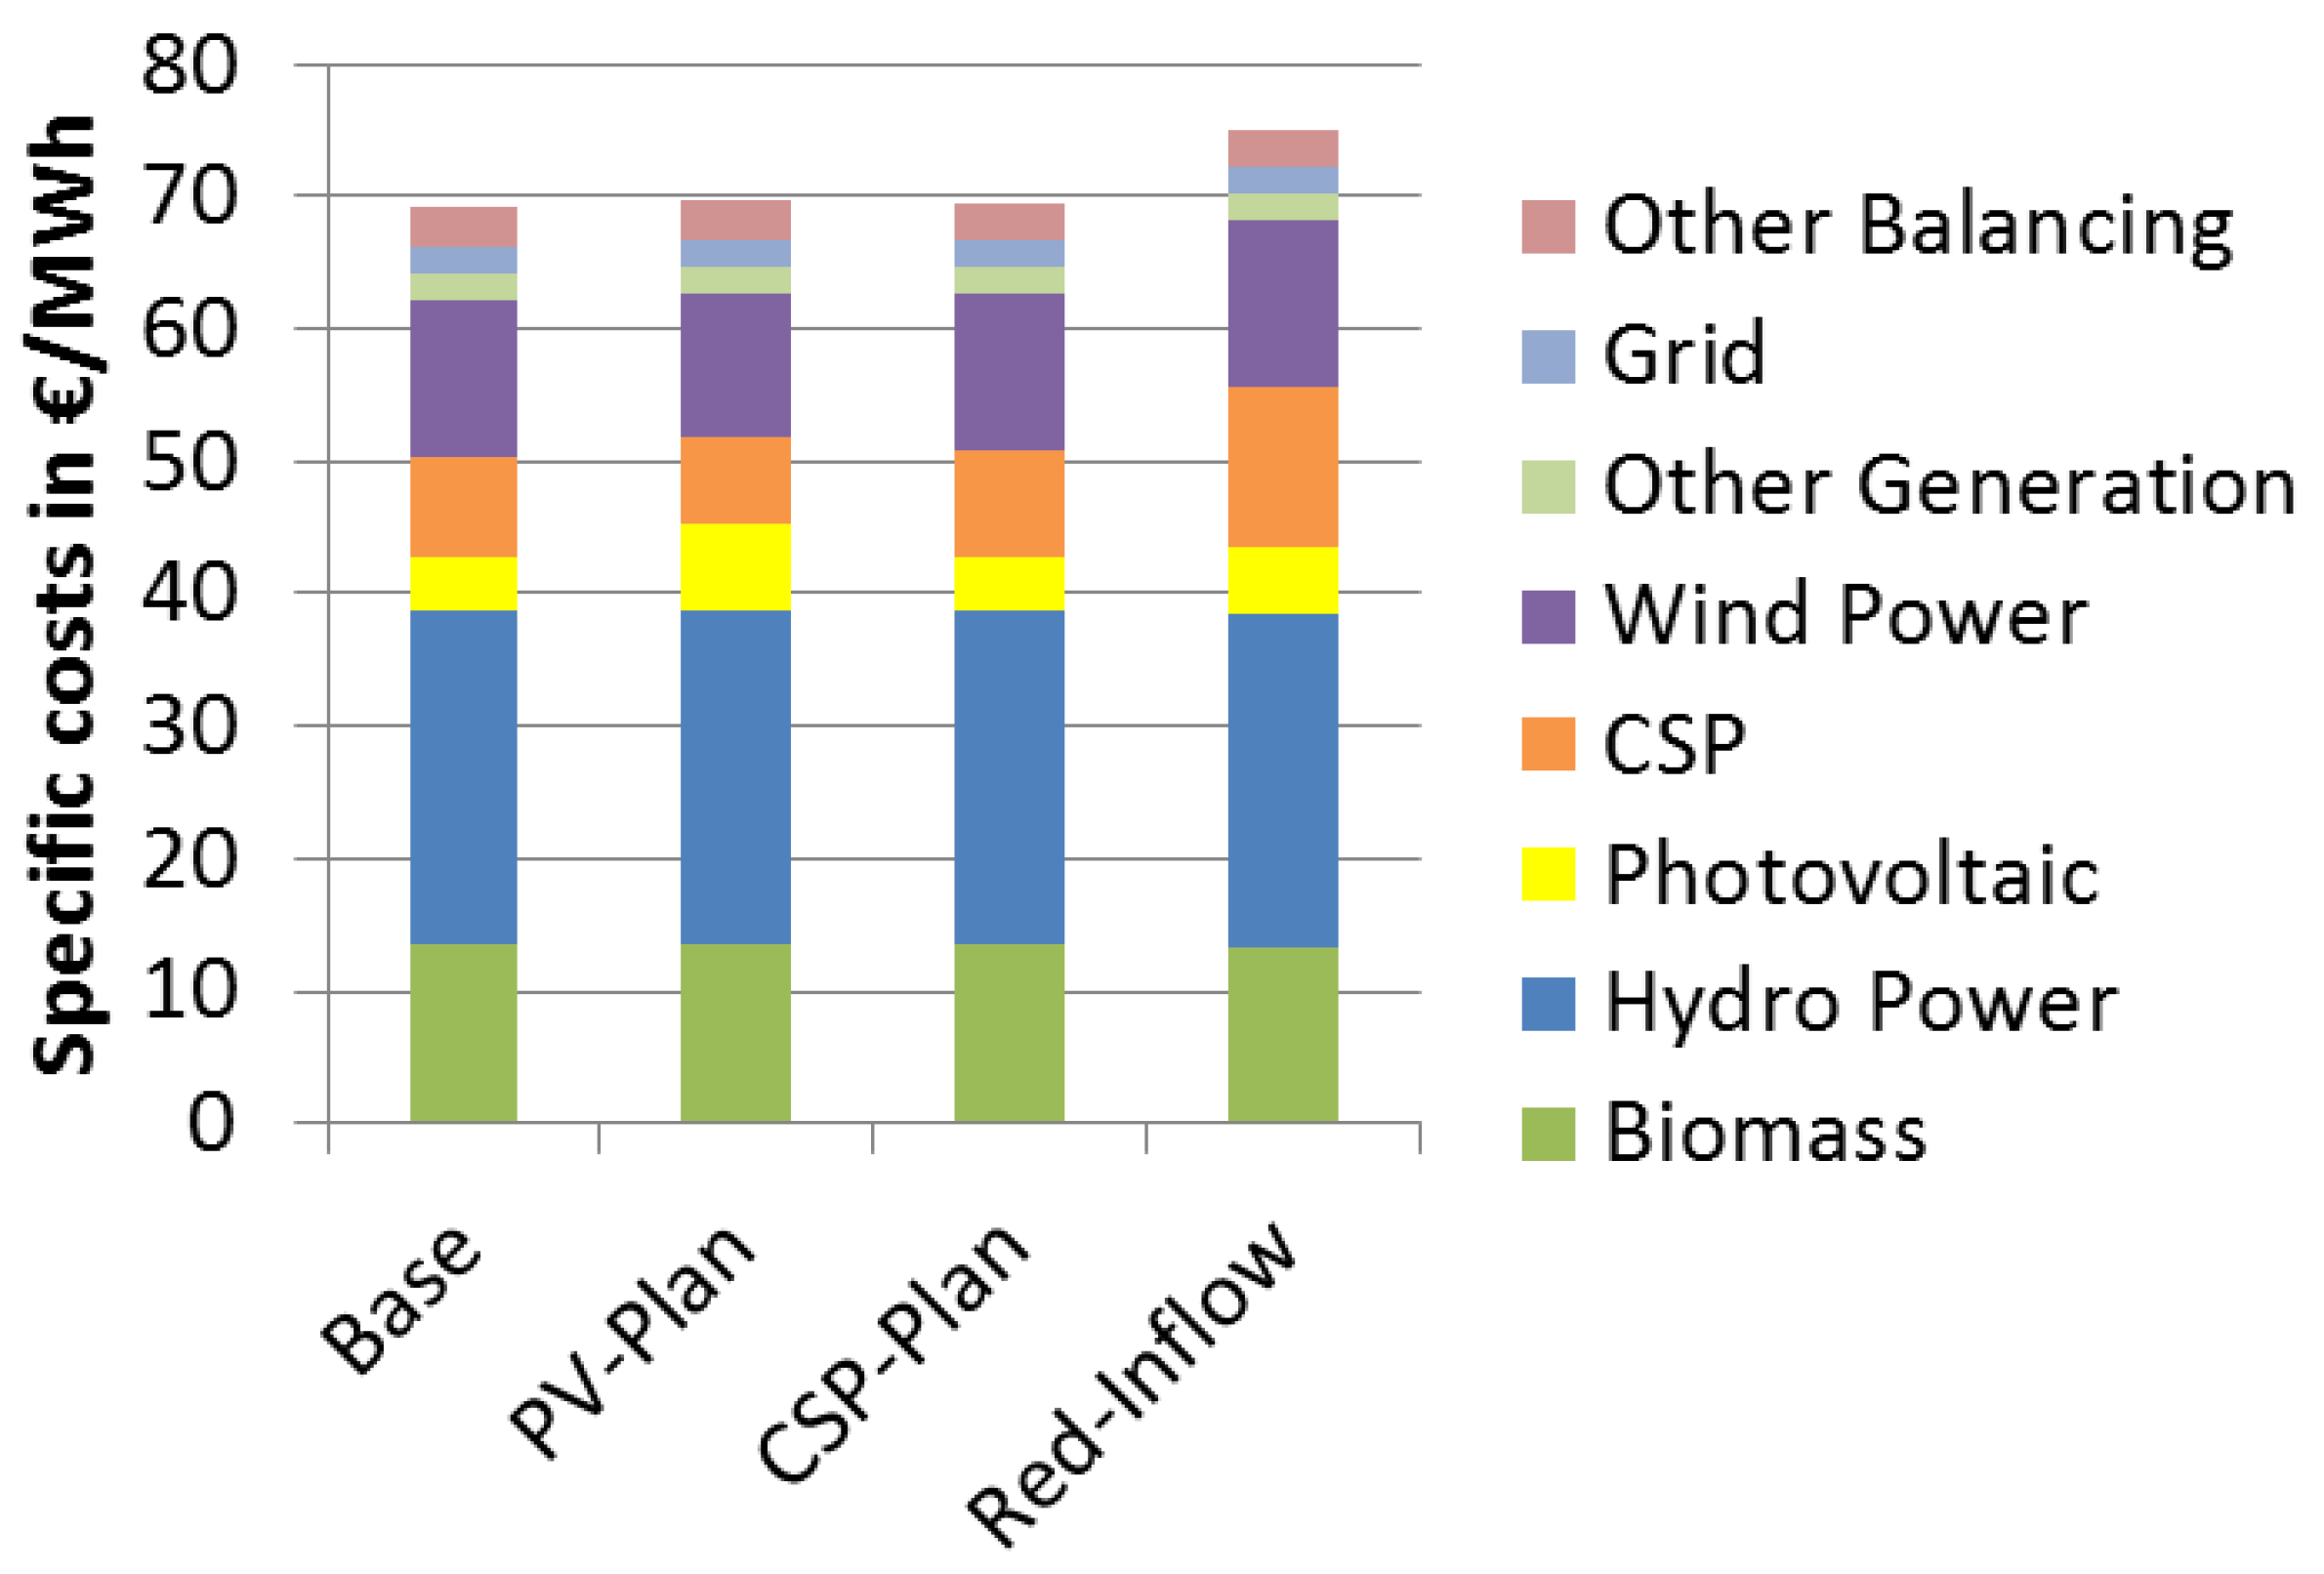
Table 1.
Overview of considered technologies.
| Use of Technology | Exogenously Defined Capacities | Endogenously Calculated Capacities |
|---|---|---|
| Generation | Run-of-river hydro (existent/under construction) Reservoir hydro (existent/under construction) Biomass CHP Fuel cell CHP Wave power | Run-of-river hydro (investment options) Reservoir hydro (investment options) Photovoltaic Wind onshore Wind offshore CSP Hydrogen gas turbine Hydrogen combined cycle gas turbine |
| Grid | Existing AC and DC lines | Additional AC and DC lines |
| Storage and demand flexibility | Demand response | Battery storage |
| Flexible electric heating | Hydrogen storage | |
| Flexible hydrogen electrolysis | Pumps in reservoir hydro stations |
Table 2.
Potentials for solar and wind power generation based on REMix-EnDAT [50] considered in the optimization. Note that installable capacities are displayed in GW and annual full load hours in h/year.
Table 2.
Potentials for solar and wind power generation based on REMix-EnDAT [50] considered in the optimization. Note that installable capacities are displayed in GW and annual full load hours in h/year.
| Region Name | Wind Offshore | Wind Onshore | Photovoltaic | CSP | ||||
|---|---|---|---|---|---|---|---|---|
| GW (el) | h/Year | GW (el) | h/Year | GW (el) | h/Year | GW (th) | h/Year | |
| Nordeste | 79 | 3922 | 71 | 3384 | >1000 | 1659 | >1000 | 2007 |
| Norte 1 | 16 | 2757 | 253 | 914 | >1000 | 1580 | 5 | 2027 |
| Norte 2 | 13 | 2155 | 26 | 892 | >1000 | 1481 | 0 | 0 |
| Norte 3 | 0 | 0 | 0 | 0 | 313 | 1411 | 0 | 0 |
| Centro-Oeste | 0 | 0 | 44 | 2371 | >1000 | 1546 | 576 | 1997 |
| Sudeste | 16 | 2639 | 48 | 1639 | >1000 | 1568 | >1000 | 1959 |
| Sul | 14 | 3468 | 28 | 2852 | >1000 | 1286 | 0 | 0 |
Table 3.
Techno-economical parameters of considered RE technologies.
| Technology | Efficiency | Availability | Specific Investment | Specific Invest. Storage | Amortization Time | Fixed O & M Costs | References | |
|---|---|---|---|---|---|---|---|---|
| % | % of Time | k€/MW | k€/MWh | Years | % of Invest/ | |||
| VRE | Photovoltaic | -- | 95% | 520 | -- | 20 | 1% | [58,59,60] |
| Wind onshore | -- | 92% | 900 | -- | 20 | 4% | [59,60,61] | |
| Wind offshore | -- | 92% | 1800 | -- | 20 | 6% | [59,60,61] | |
| Wave power | -- | 92% | 2000 | -- | 20 | 6% | [60,61] | |
| Dispatchable RE | Hydro S < 30 MW | -- | 91% | 2450 | -- | 40 | 2% | [39,59] |
| Hydro M 30-300 MW | -- | 92% | 2090 | -- | 40 | 3% | [39,59] | |
| Hydro L > 300 MW | -- | 89% | 1730 | -- | 40 | 2% | [39,59] | |
| Single cycle gas turbine | 47% | 95% | 400 | -- | 25 | 4% | [60,61] | |
| Combined cycle gas turbine | 67% | 96% | 700 | -- | 25 | 4% | [60,61] | |
| CSP | 37%/95% 1 | 95% | 970/250/25 2 | -- | 25 | 3% | [61] | |
| Fuel cell | 27%/53% 3 | 98% | 2000 | -- | 20 | 2% | [60,61] | |
| Biomass CHP | 34%/53% 3 | 98% | 1950 | -- | 20 | 2% | [60,61] | |
| Storage | Vanadium redox battery | 81% | 98% | 300 | 100 | 20 | 3% | [62] |
| Hydrogen storage tanks | 96% | 100% | n.a. | 24 | 30 | 2% | [63] | |
| Pumped reservoir hydro | 80% | 90% | 640 | n.a. | 20 | 3% | [61] | |
| PEM Electrolyser | 71% | 100% | 321 | n.a. | 20 | 2% | [63] | |
1 power block/thermal energy storage; 2 power block/solar field/thermal energy storage; 3 electric/thermal.
© 2017 by the authors. Licensee MDPI, Basel, Switzerland. This article is an open access article distributed under the terms and conditions of the Creative Commons Attribution (CC BY) license (http://creativecommons.org/licenses/by/4.0/).
Share and Cite
MDPI and ACS Style
Gils, H.C.; Simon, S.; Soria, R. 100% Renewable Energy Supply for Brazil—The Role of Sector Coupling and Regional Development. Energies 2017, 10, 1859. https://doi.org/10.3390/en10111859
AMA Style
Gils HC, Simon S, Soria R. 100% Renewable Energy Supply for Brazil—The Role of Sector Coupling and Regional Development. Energies. 2017; 10(11):1859. https://doi.org/10.3390/en10111859
Chicago/Turabian StyleGils, Hans Christian, Sonja Simon, and Rafael Soria. 2017. "100% Renewable Energy Supply for Brazil—The Role of Sector Coupling and Regional Development" Energies 10, no. 11: 1859. https://doi.org/10.3390/en10111859
Note that from the first issue of 2016, this journal uses article numbers instead of page numbers. See further details here.