Article

Study on the Effects of Thermal Aging on Insulating Paper for High Voltage Transformer Composite with Natural Ester from Palm Oil Using Fourier Transform Infrared Spectroscopy (FTIR) and Energy Dispersive X-ray Spectroscopy (EDS)

School of Electrical Engineering and Informatics, Institut Teknologi Bandung, 40132 Bandung, Indonesia
*
Author to whom correspondence should be addressed.
Energies 2017, 10(11), 1857; https://doi.org/10.3390/en10111857
Submission received: 16 October 2017 / Revised: 3 November 2017 / Accepted: 8 November 2017 / Published: 13 November 2017

Abstract

:
Mineral oil is widely used as liquid insulation in high voltage equipment. Due to environmental considerations, recently natural esters have been considered as naturally friendly liquid insulation candidates for high voltage transformers. In this experiment, transformer insulation paper was subjected to get accelerated aging test with copper strip in natural ester in a hermeneutical heat-resistant glass bottle at temperatures of 120 °C and 150 °C for 336 h, 672 h and 1008 h. The experimental results of Fourier transform infrared spectroscopy (FTIR) showed that the intensity of the absorbance peak of the O–H functional group decreased with aging, while the intensity of the C–H and C=O functional group absorbance peaks have increased with aging and the intensity of the C–O functional group absorbance peak has a tendency to increase with aging. The energy dispersive X-ray spectroscopy (EDS) experimental results showed that the weight percent of the element C increased with aging and the weight percent of the element O has decreased with aging. The experimental results show a good correlation between the degree of polymerization (DP) and the weight percent of O element. This indicates that EDS may be used as a new method for estimating the DP of transformer insulation paper.

1. Introduction

An electric power system consists of generating stations, transmission, and distribution systems. One of the most important pieces of equipment in electric power systems are power transformers. The performance of transformers depends substantially on the condition of its liquid and solid insulation. Insulating liquids provide two purposes in the transformer operation, as an insulation material and the cooling medium [1]. The lifetime of a transformer is mainly determined from the degradation of the insulation paper due to thermal-depolymerization and mechanical stress [2]. Heat, moisture and oxygen accelerate the degradation/aging process of transformer insulation paper which is subjected to irreversible degradation [3]. Liquid insulating and solid insulating materials of transformers interact during operation so that their performance can affect each other.
For a long time, mineral oil has been extensively used as the transformer oil. Petroleum products are eventually going to run out, and that could be a serious problem even by the mid-twenty-first century [4]. In the future, natural esters will take over the role of mineral oils as transformer insulation liquids due to escalating price of conventional oils and increasing environmental constraints imposed by the authorities [3]. The advantage of using natural esters as transformer insulating liquids is the non-toxic characteristics of the material which will not produce any toxic products during fires [1] and higher fire point of about 300 °C [5]. Natural esters are more environmentally compatible because they are biodegradable [1]. Natural esters have a significantly higher breakdown voltage level than mineral oil [6]. Some authors have suggested that the good performance of transformer insulation paper as solid insulation of transformers immersed in natural esters is due to the fact that these oils are more hydrophilic than mineral oil [7,8]. In natural ester/pressboard insulation, moisture tends to remain in the natural ester, while in the mineral oil/pressboard insulation system moisture tends to remain in the pressboard [9]. Thus water is absorbed by the natural esters, making the transformer insulation paper drier [10,11]. The lifetime of paper aged in natural esters is higher than that of the paper aged in mineral oil [12]. Many researchers agree that the insulating paper performance in natural esters is better than in mineral oil [3,7,13,14]. In other hand, the acidity level of natural esters rapidly increases with aging in a moisture rich environment due to hydrolytic processes [14]. The acidity levels of natural esters are not detrimental to paper insulation performance, but it is necessary to investigate the effect of high acidity level on paper and steel materials, especially its corrosion effects [14].
One of the alternative insulating liquids are natural esters from palm oil [1]. Investigation of electrical, physical and chemical properties of palm oil shows that the liquid possesses good properties to be used as substitutes for mineral oil in high voltage experiments [1,15,16]. This study focuses to present the results of a laboratory study of the chemical structure of the transformer insulation paper under accelerated thermal aging test in natural ester from palm oil. In this paper, accelerated thermal aging test at 120 °C and 150 °C was conducted for 336 h, 672 h and 1008 h. The degree of polymerization (DP) and tensile strength (TS) were measured and analyzed. The chemical structure of transformer insulation paper was identified using Fourier transform infrared spectroscopy (FTIR) and energy dispersive X-ray spectroscopy (EDS). Spectroscopy is a powerful non-destructive technique that utilizes electromagnetic radiation interaction effect to determine the energy level and structure atomic or molecular substance [17]. Spectroscopy has been successfully used to quantify 2-FAL compound in transformer oil, identify the interfacial tension number of transformer oil, quantify and identify the dissolved decay product in oil [17,18,19,20]. In this research paper, the correlation between DP and chemical structure will also be presented to estimate the DP value of paper insulation using a spectroscopy technique.

2. Materials and Methods

2.1. Samples

The insulating liquid used in this experiment was a commercially available natural ester from palm oil. The type of transformer insulation paper used for these studies was Kraft paper for transformer windings. The thickness of the paper is 0.01 mm and the basis weight is 0.011 g/cm2. The initial water content for new transformer insulation paper is about 5% at the room humidity and temperature levels. Each aging test bottle contained transformer insulation paper (10 g), natural ester (200 g) and a copper metal strip (8.75 g) [21]. The transformer insulation paper was wrapped around the copper metal strip. Firstly, the natural ester samples in the glass bottles were heated without sealing at a temperature of 100 °C for 24 h in order to ensure the same initial conditions [1,15,16]. Then the transformer insulation paper and copper metal strip were put into heat-resistant and sealed glass bottles. Thermal aging in sealed systems was chosen based on the recommendation of the IEEE loading guide for modern sealed transformers [22]. All the sealed glass bottles were put in a different aging oven and heated to 120 °C, while the other oven was heated to 150 °C for 336, 672 and 1008 h. The 150 °C temperature level selected from the reference published in IEEE by McShane, et al. [13], while the 120 °C temperature level is a hot spot temperature according to the IEEE [23]. Samples and their treatments are shown in Table 1.

2.2. Tensile Strength (TS) and Degree of Polymerization (DP)

A Mark-10 Force Gauge was used in this experiment to conduct TS test. It has ±0.1% accuracy, a sampling rate of 14,000 Hz and is suitable for tension and compression measurement applications up to 500 lbF (2500 N). The transformer insulation paper was inserted to the Mark-10 Force Gauge and pulled until it tore. The speed of the tensile test was 10 mm/min. The measurement of the DP was conducted by using the intrinsic viscometer method, including the capillary viscometer and cupryetilene solvent diamine. The DP test was conducted by referring to the ES ISO 5351 standard.

2.3. Fourier Transform Infrared Spectroscopy (FTIR) and Energy Dispersive X-ray Spectroscopy (EDS)

An ALPHA FTIR Spectrometer (Bruker Corporation, Billerica, Massachusetts, USA) was used in this experiment to get infrared spectra of functional groups of transformer insulation paper. The attenuated total reflection (ATR) technique was used to get the infrared spectra. The penetration depth of the light beam into the sample using this mode is about 0.5–3 μm, depending on the ATR material used [3]. Small samples of transformer insulation paper were prepared to conduct this measurement. The measurement of each sample was conducted twice to ensure the value of intensity of peak absorbance. Figure 1a shows the ALPHA FTIR spectrometer.
The analysis of the chemical structure of the paper was conducted by using EDS measurement. In this research, a Hitachi SU 3500 (Hitachi High-Technologies Corporation, Minato-ku, Tokyo, Japan) and EDAX (Ametek, Inc., Mahwah, NJ, USA) instrument was used to conduct the EDS measurements. Before the EDS measurements were conducted, small samples of transformer insulation paper were put on the specimen holder to perform the coating process using an MC1000 Ion Sputter. EDS measurements have the purpose to identify the chemical elements of the transformer insulation paper. Figure 1b shows the Hitachi SU 3500 and EDAX system used for the EDS measurements.

3. Results and Discussion

3.1. Degree of Polymerization (DP) and Tensile Strength (TS)

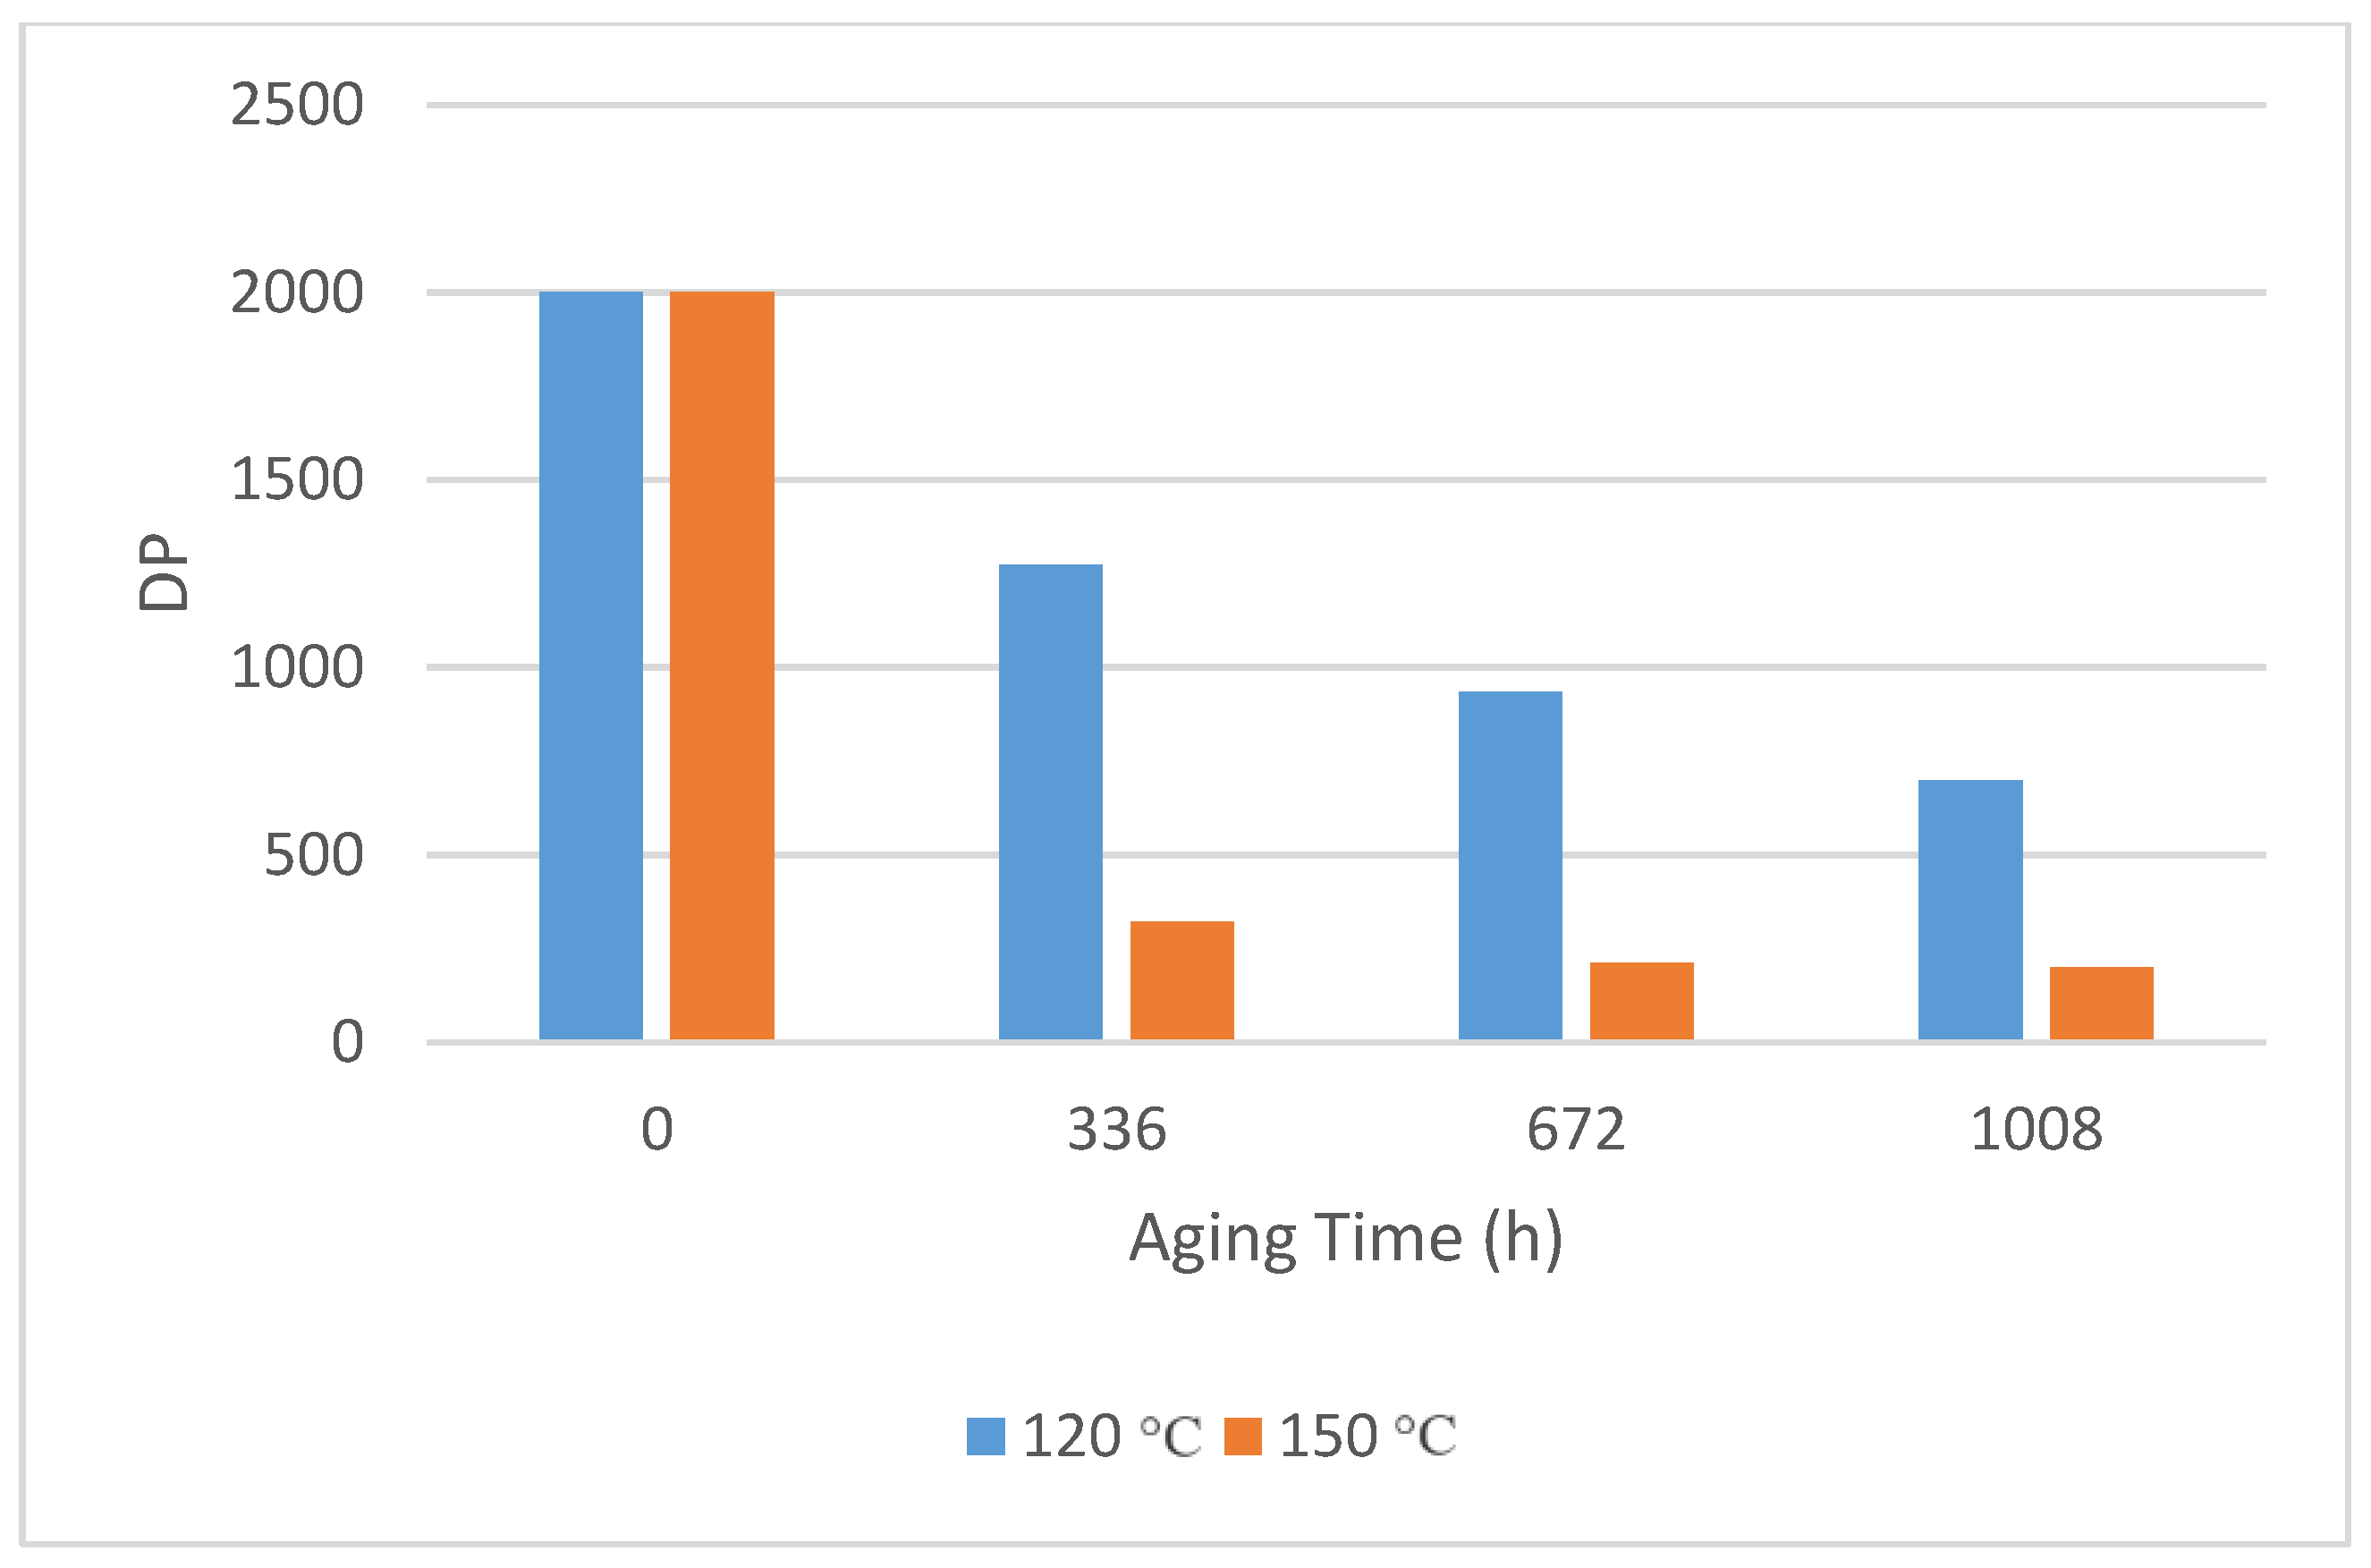
Figure 2 shows the reduction of the DP of transformer insulation paper with aging at the temperatures of 120 °C and 150 °C. The DP indicates the number of C6H10O5 glucose rings that compose the cellulosic macromolecule and it is the valuable indicator that provides information about the degradation state of cellulose and mechanical strength [24]. It is seen that the DP has decreased faster at 150 °C than at 120 °C. At about 140 °C, the rate of the degradation process increases significantly, implying either a change in the activation energy or in the pre-exponential factor [25]. The DP of paper samples aged at 150 °C was significantly decreased due to thermal stress at high temperature, in which the weak links existing in polymer chains are easily chopped [3,9,26,27].
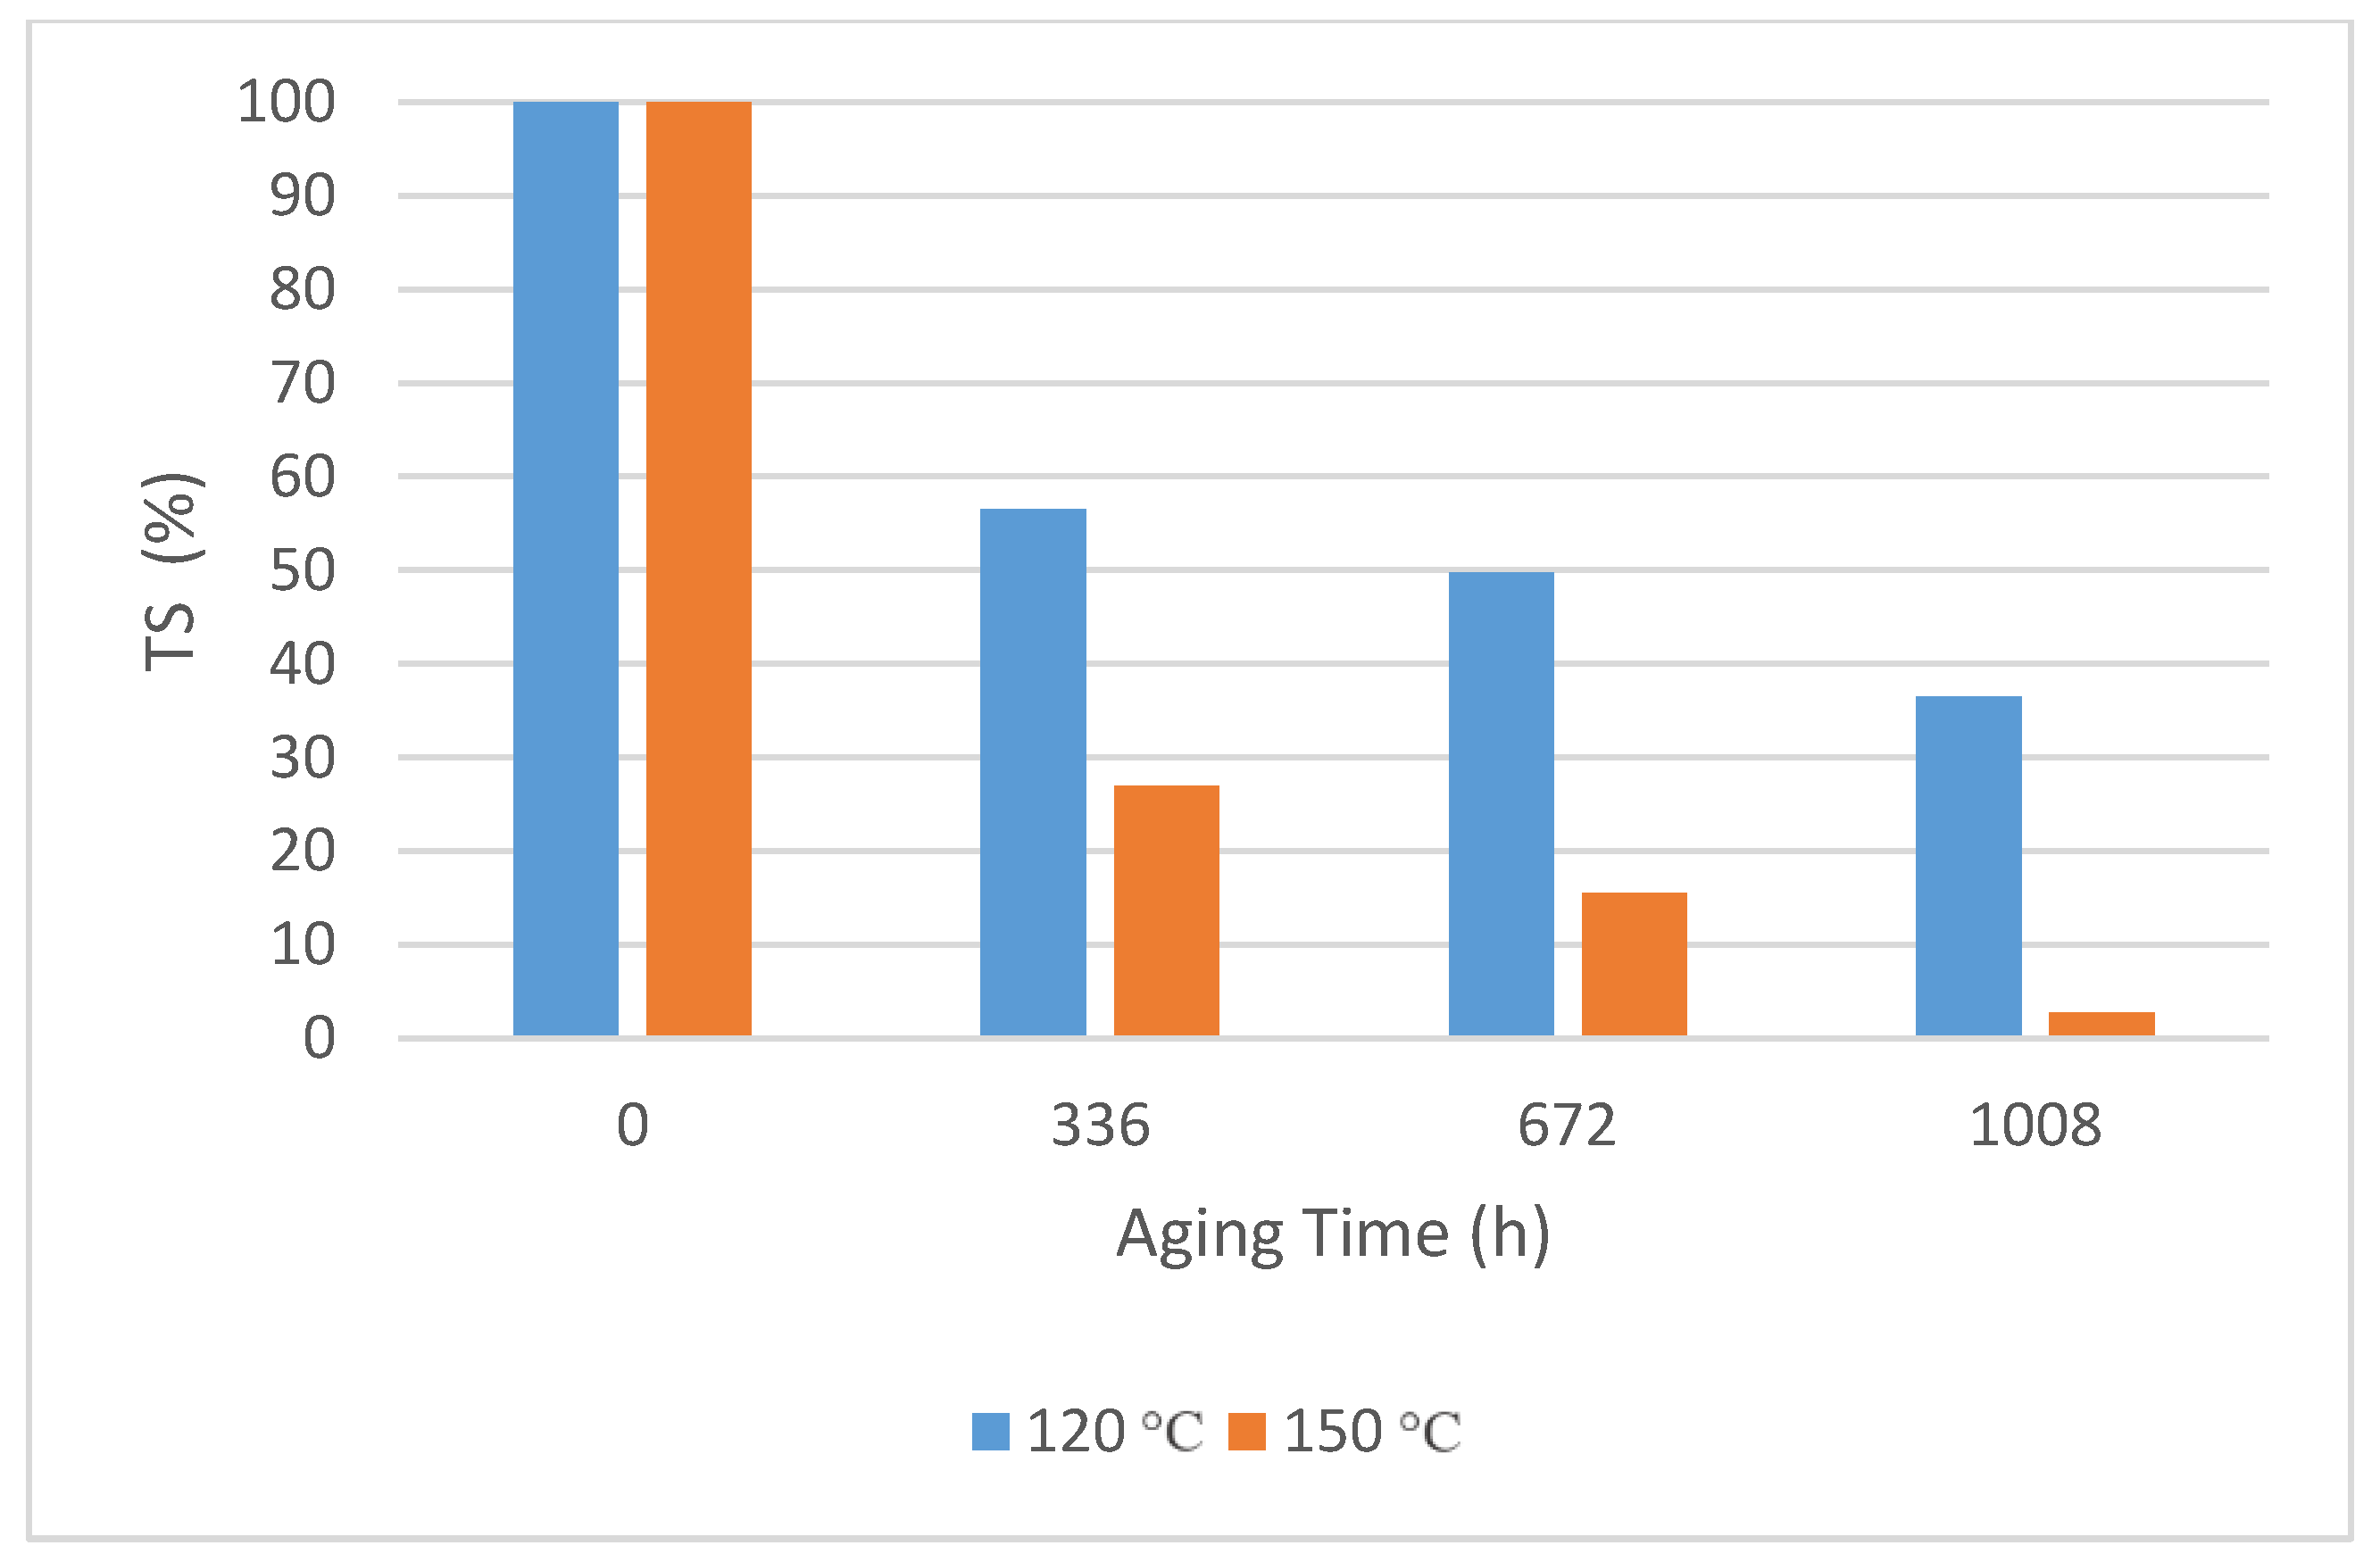
Figure 3 shows the time dependence of TS under accelerated thermal aging at the temperatures of 120 °C and 150 °C. The figure indicates that the TS has reduced faster under higher temperature [28]. From these figures it seems that the reduction behavior of the DP is similar to the TS.
Figure 3 shows TS values of insulation paper in natural ester at 120 °C and 150 °C within 0–1008 h. The transformer insulation paper under accelerated thermal aging at a temperature of 120 °C in natural ester reached the IEEE end-of-life criterion of TS 50% at 672 h. The transformer insulation paper under accelerated thermal aging at a temperature of 150 °C in natural ester reached the IEEE end-of-life criteria of TS 50% at 336 h, and TS 25% 672 h. The value of DP and TS have decreased due to thermal stress under accelerated thermal aging. The degradation process of transformer insulation paper due to thermal aging can be explained by the structural changes of the natural ester and the transformer insulation paper using FTIR and EDS. The interactions between the natural ester and transformer insulation paper during thermal aging involve hydrolysis and transesterification processes.
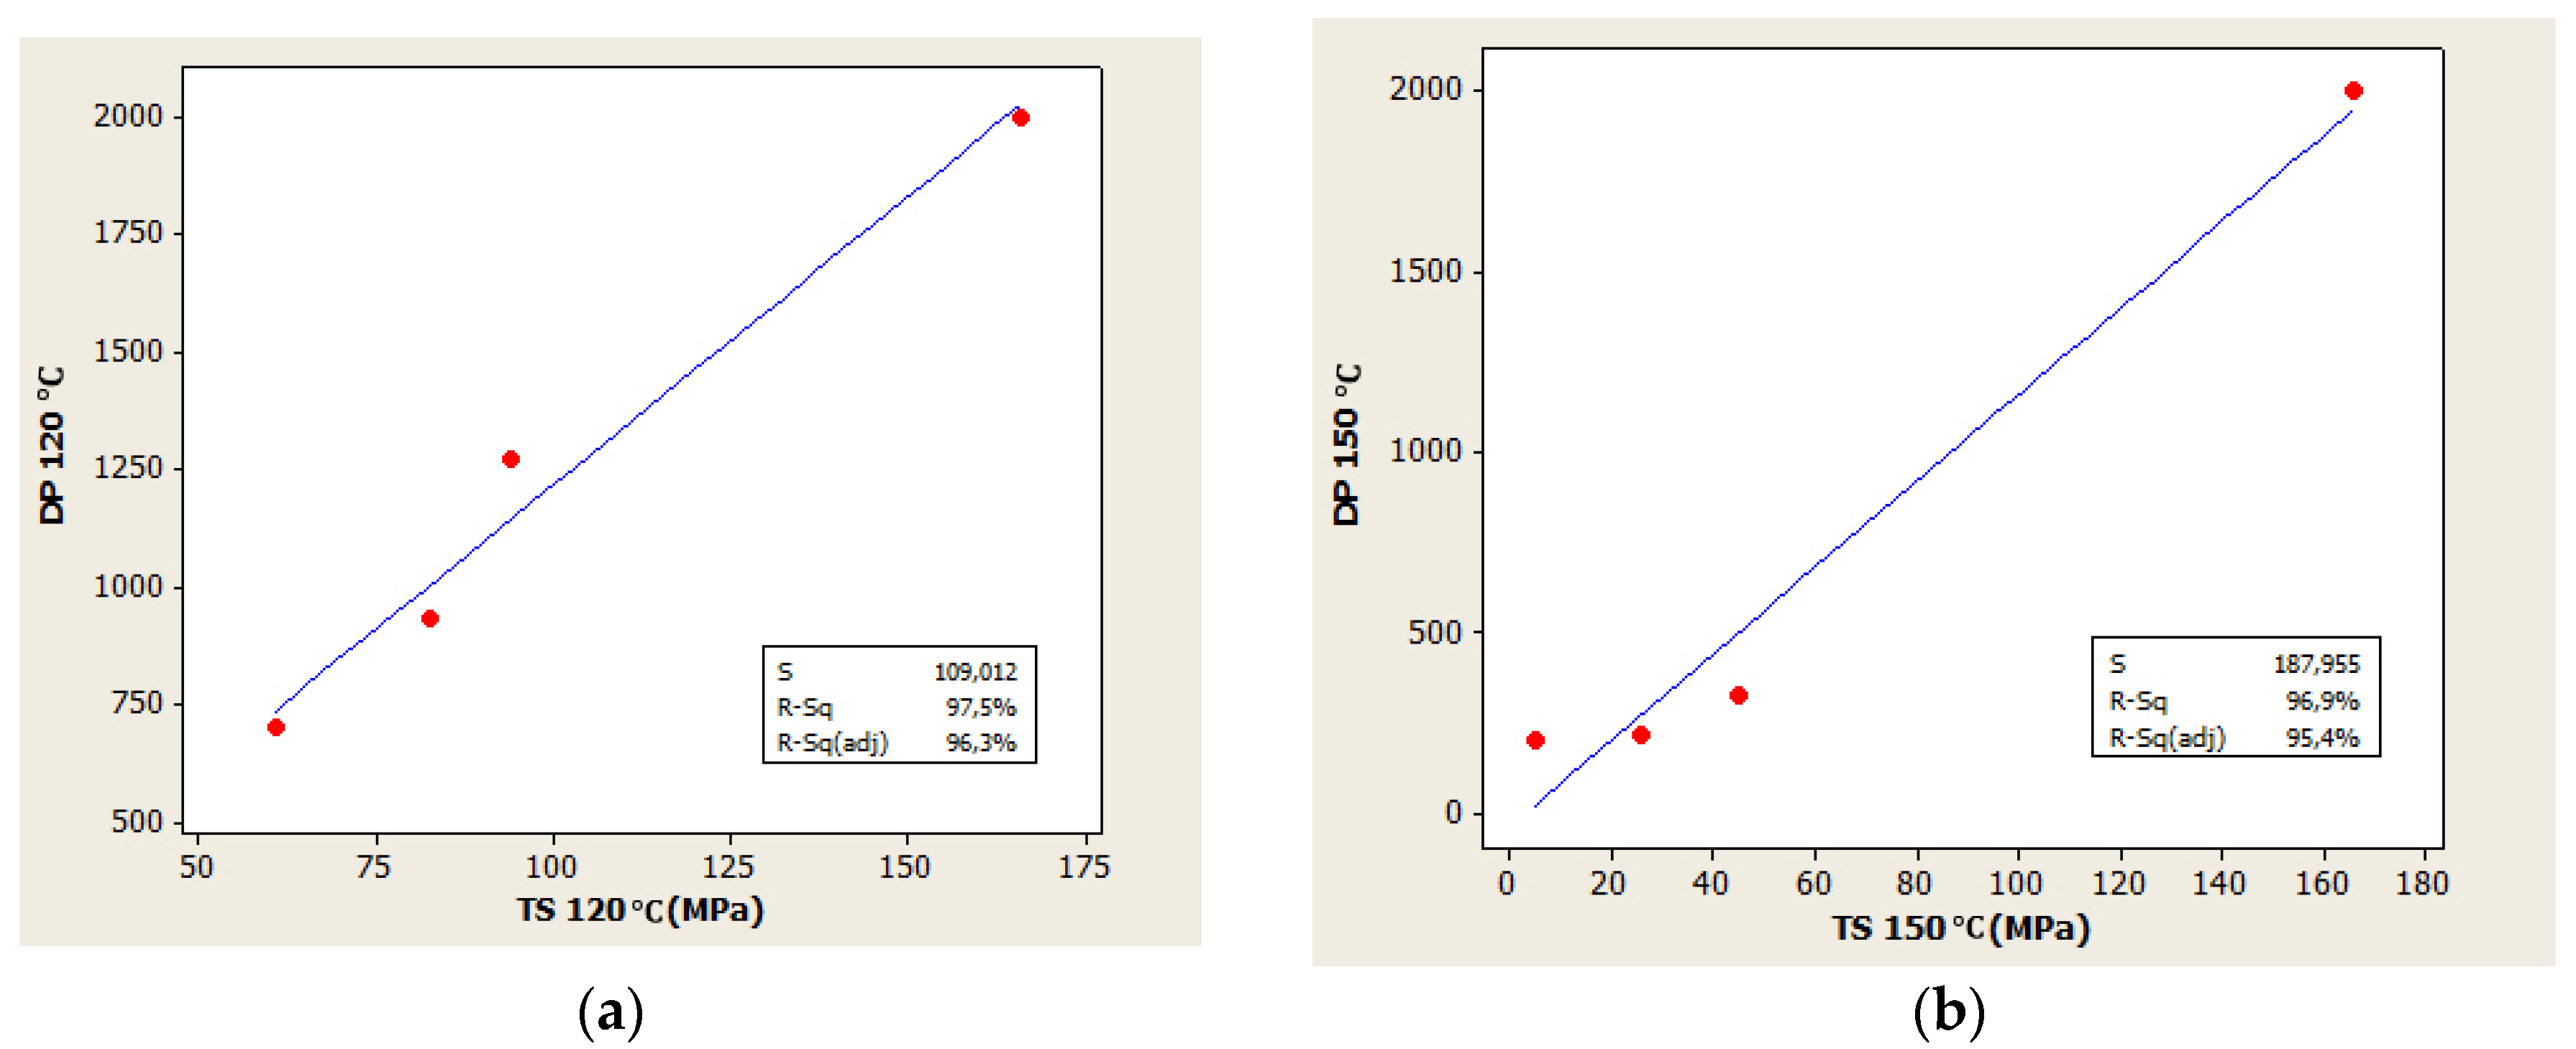
Figure 4a,b show the correlation between DP and TS of paper samples at the aging temperatures of 120 °C and 150 °C. In these studies, linear regression is used to get the correlation between DP and TS. R2 is the correlation coefficient which has the value range of 0–1 or 0–100%. R2 measures how close the data is to the regression line. The closer the value of R2 is at 1 or 100%, the more positive a linear relationship the correlation has. The value of R2 = 97.5% was for the correlation between DP and TS of paper samples at the aging temperature of 120 °C and the value of R2 = 96.9% for the correlation between DP and TS of paper samples at the aging temperature of 150 °C, so there is a correlation between physical and chemical characteristics of paper samples which is shown by the correlation between DP and TS. Table 2 shows the visual appearances of transformer insulation paper under accelerated thermal aging at different aging time and temperature. The color of transformer insulation paper become darker with aging [29].

3.2. The Structural Changes of Transformer Insulation Paper

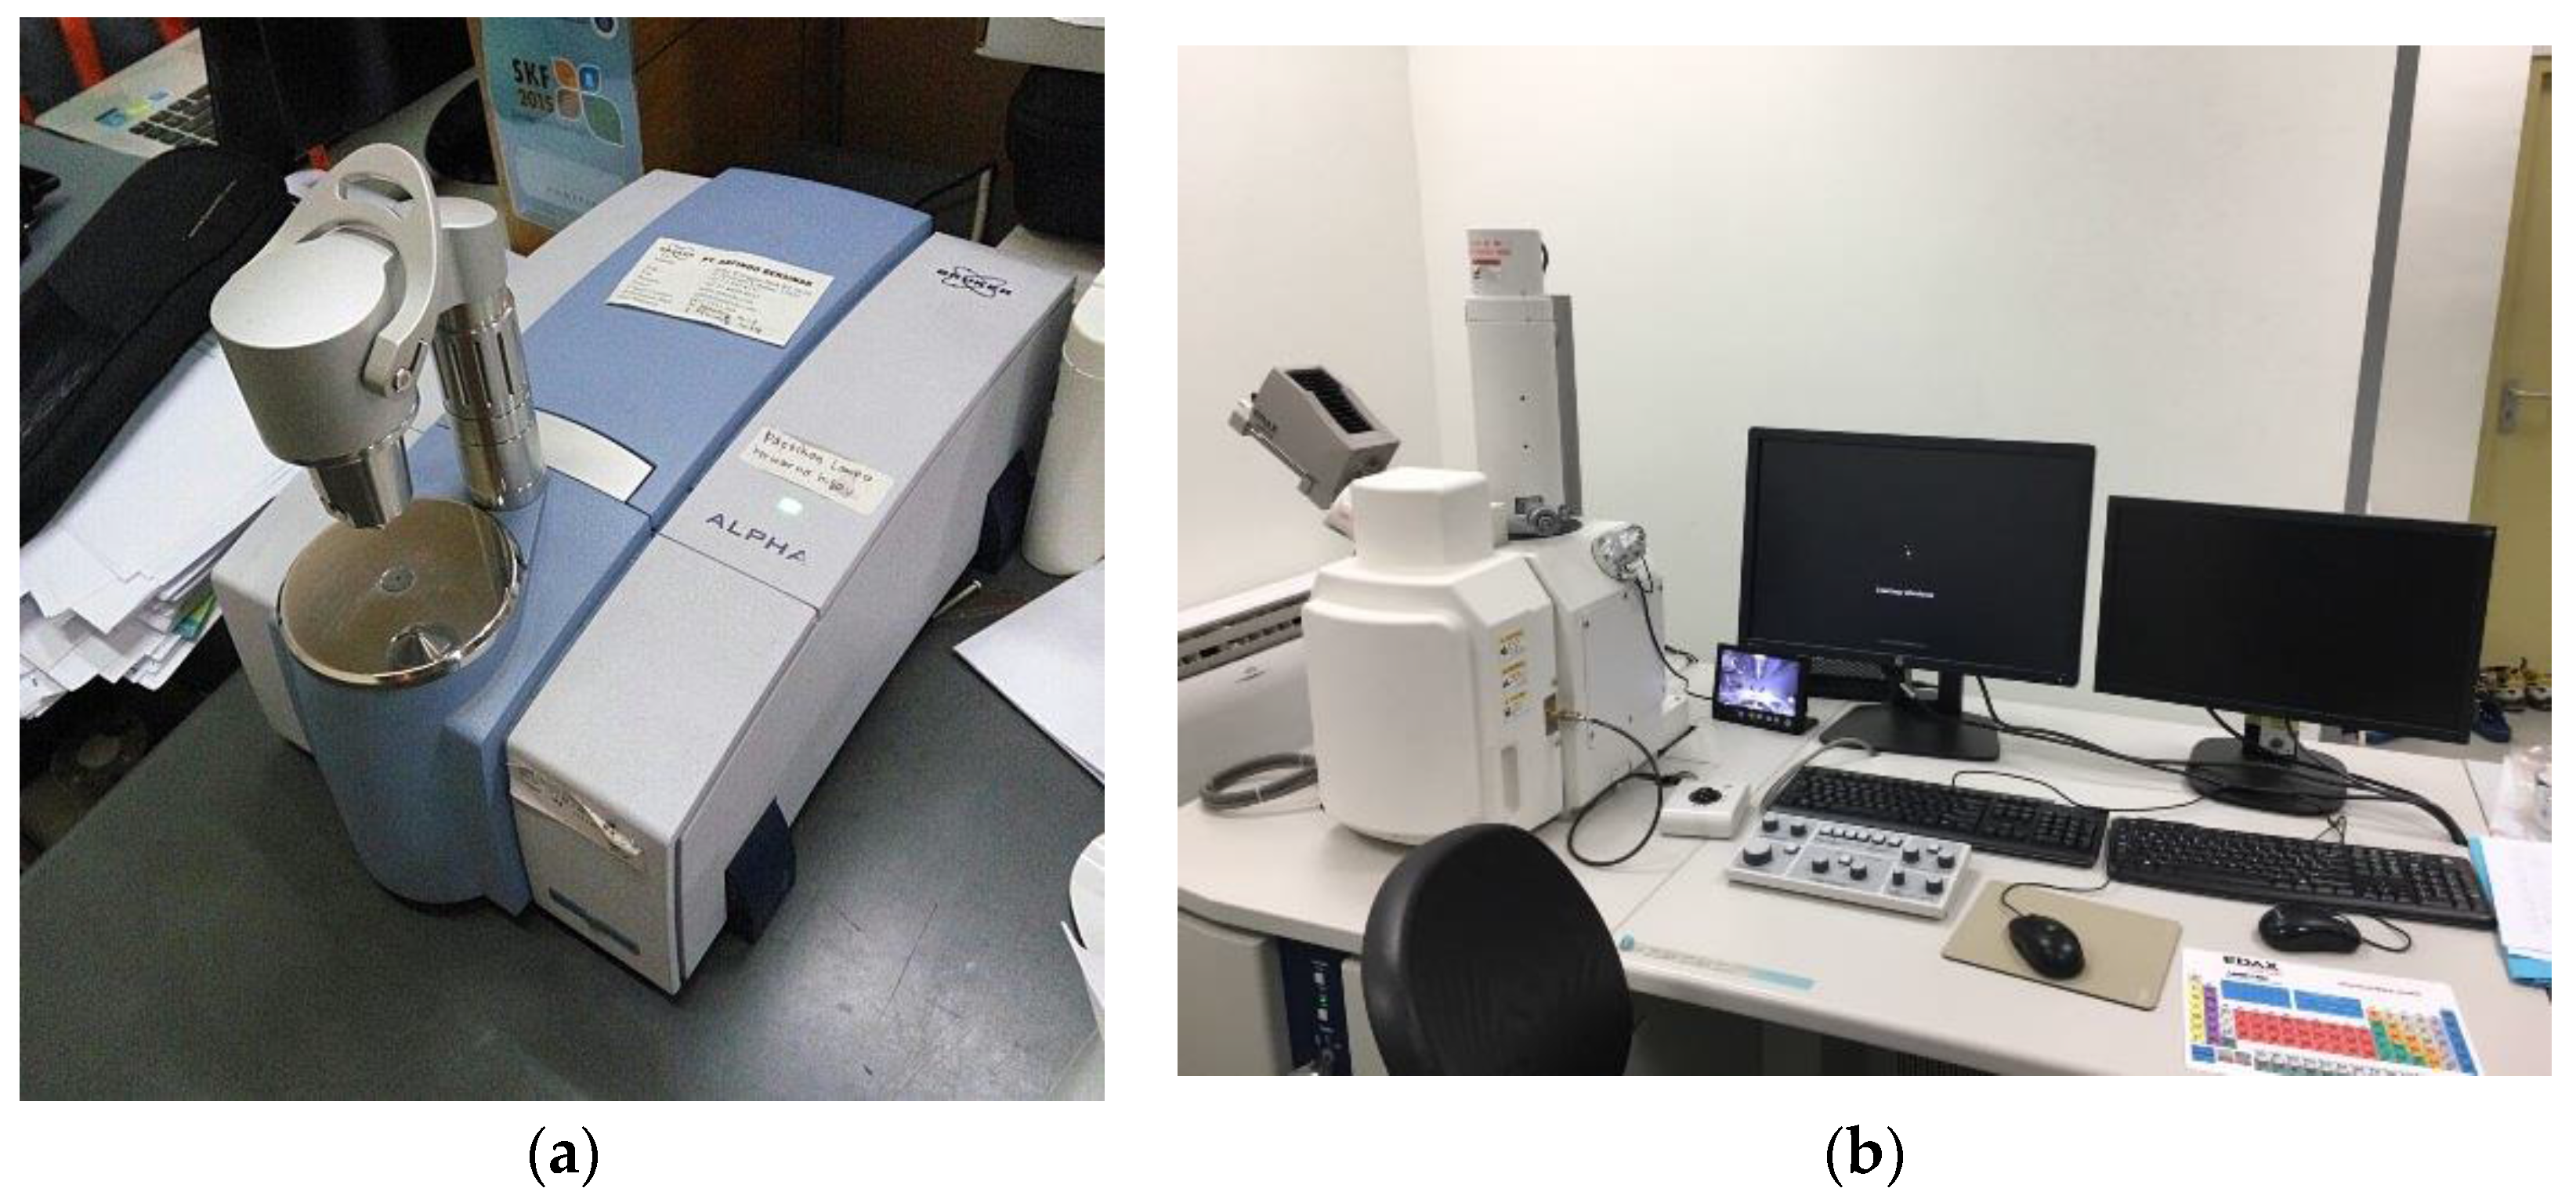
FTIR spectroscopy was used to analyze the structural changes which are shown by the intensity of peak absorbance of functional group of material. 
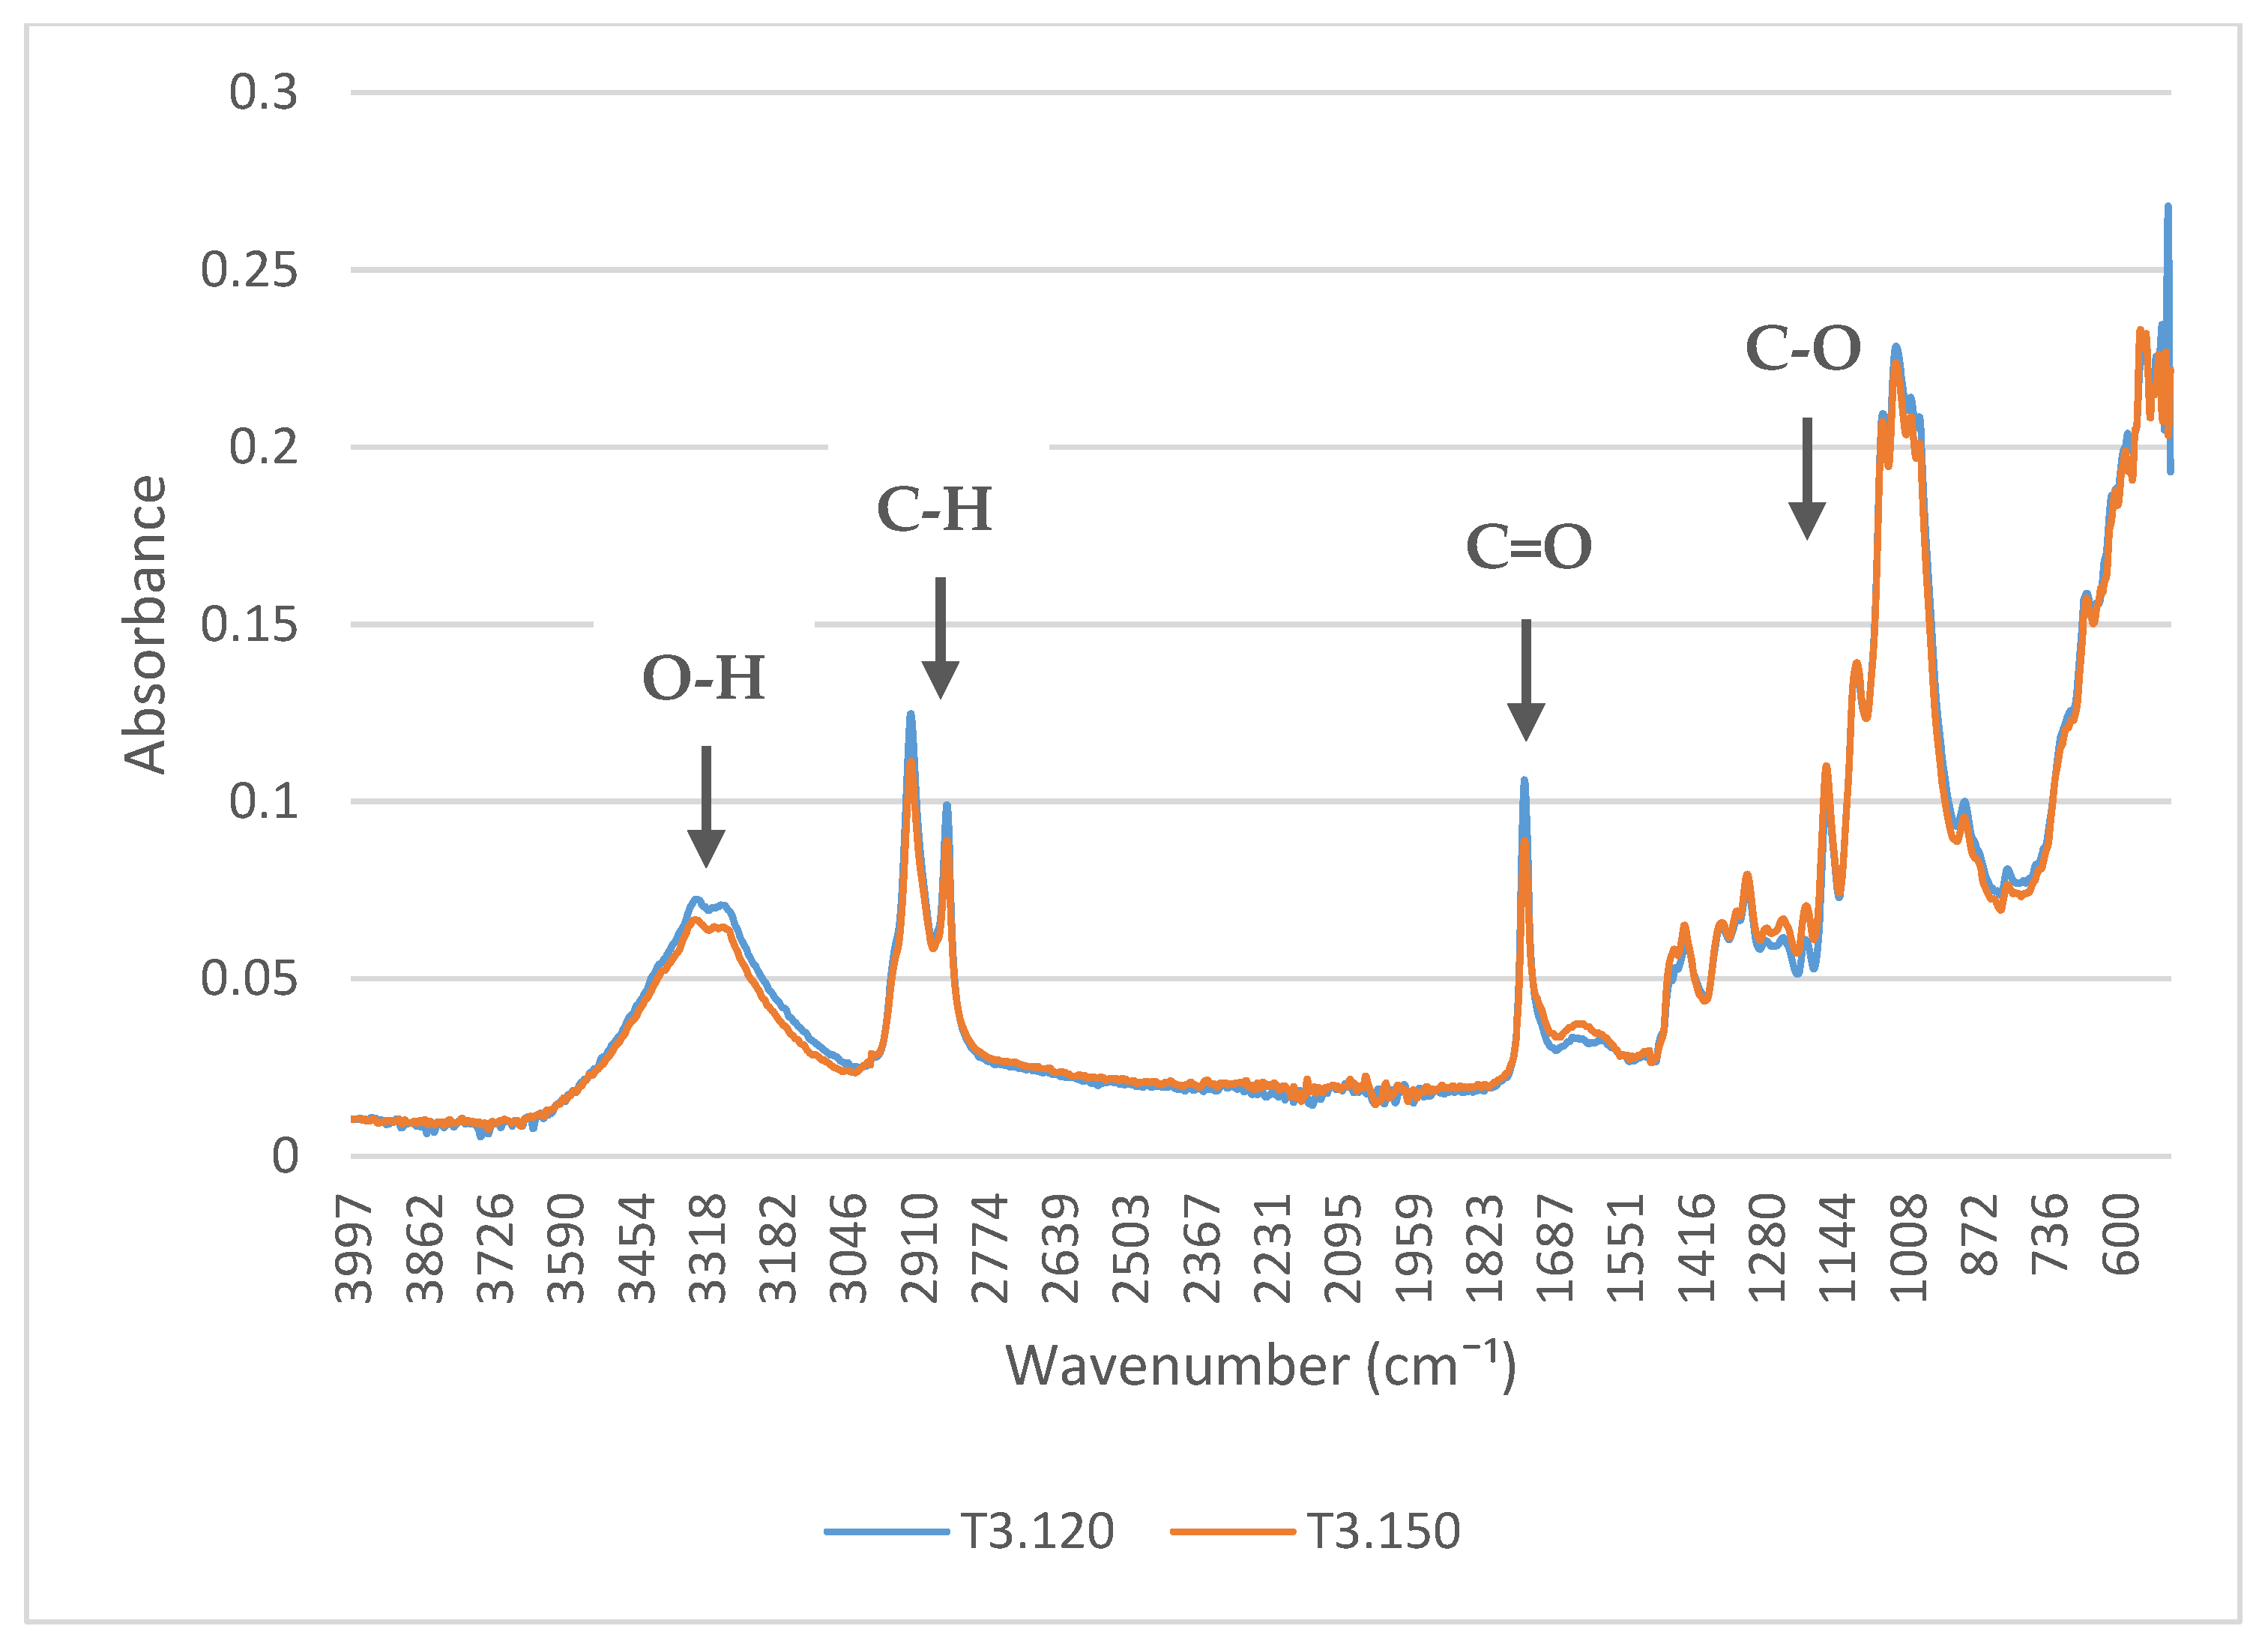
Figure 5 shows the spectra of transformer insulation paper in natural ester under accelerated thermal aging for 1008 h at aging temperatures of 120 °C and 150 °C. The intensity of the peak absorbances of paper samples has a tendency to decrease with aging temperature due to the rate of degradation process which increases with aging temperature. Table 3 and Table 4 show the intensity of peak absorbance of the functional groups of the paper samples at the temperatures of 120 °C and 150 °C which will be analyzed in this research paper.
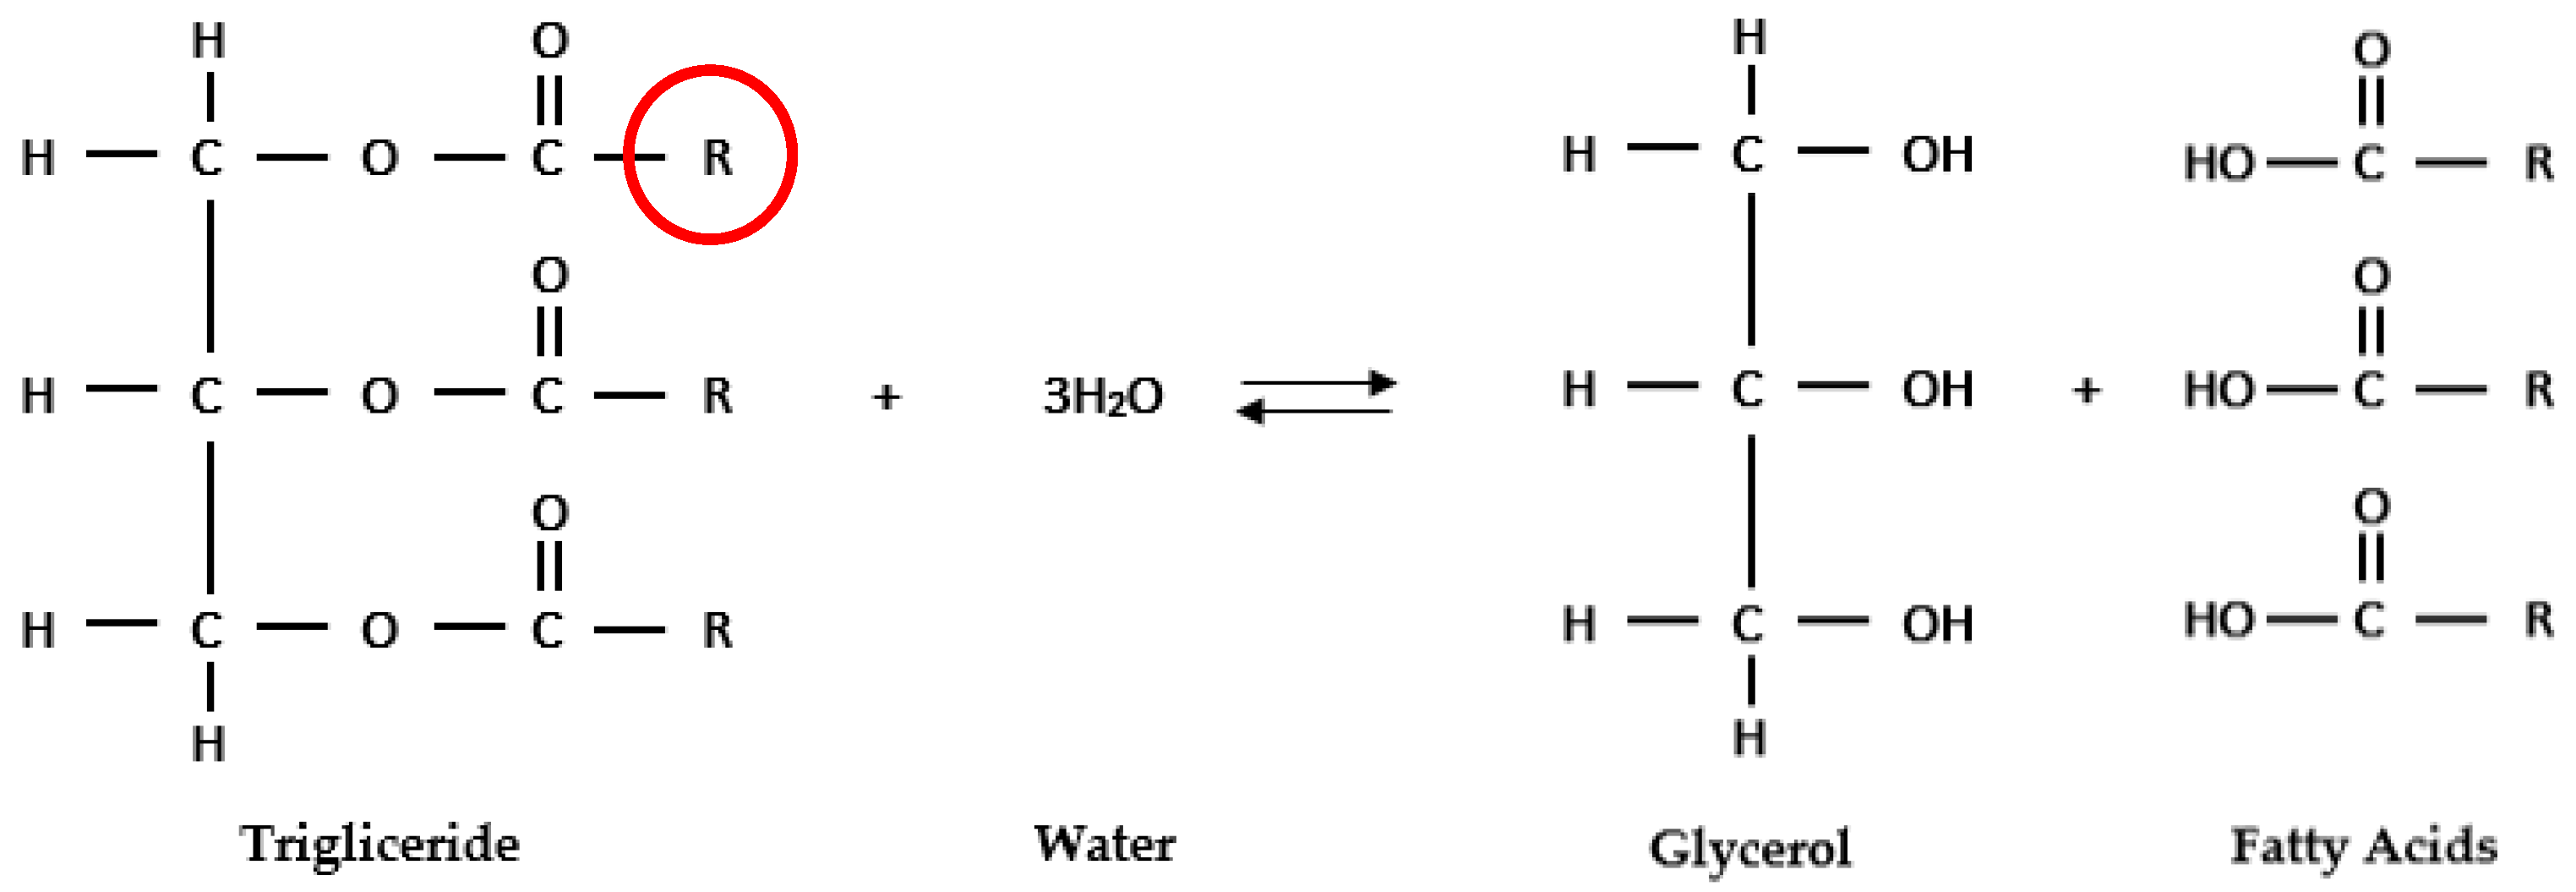
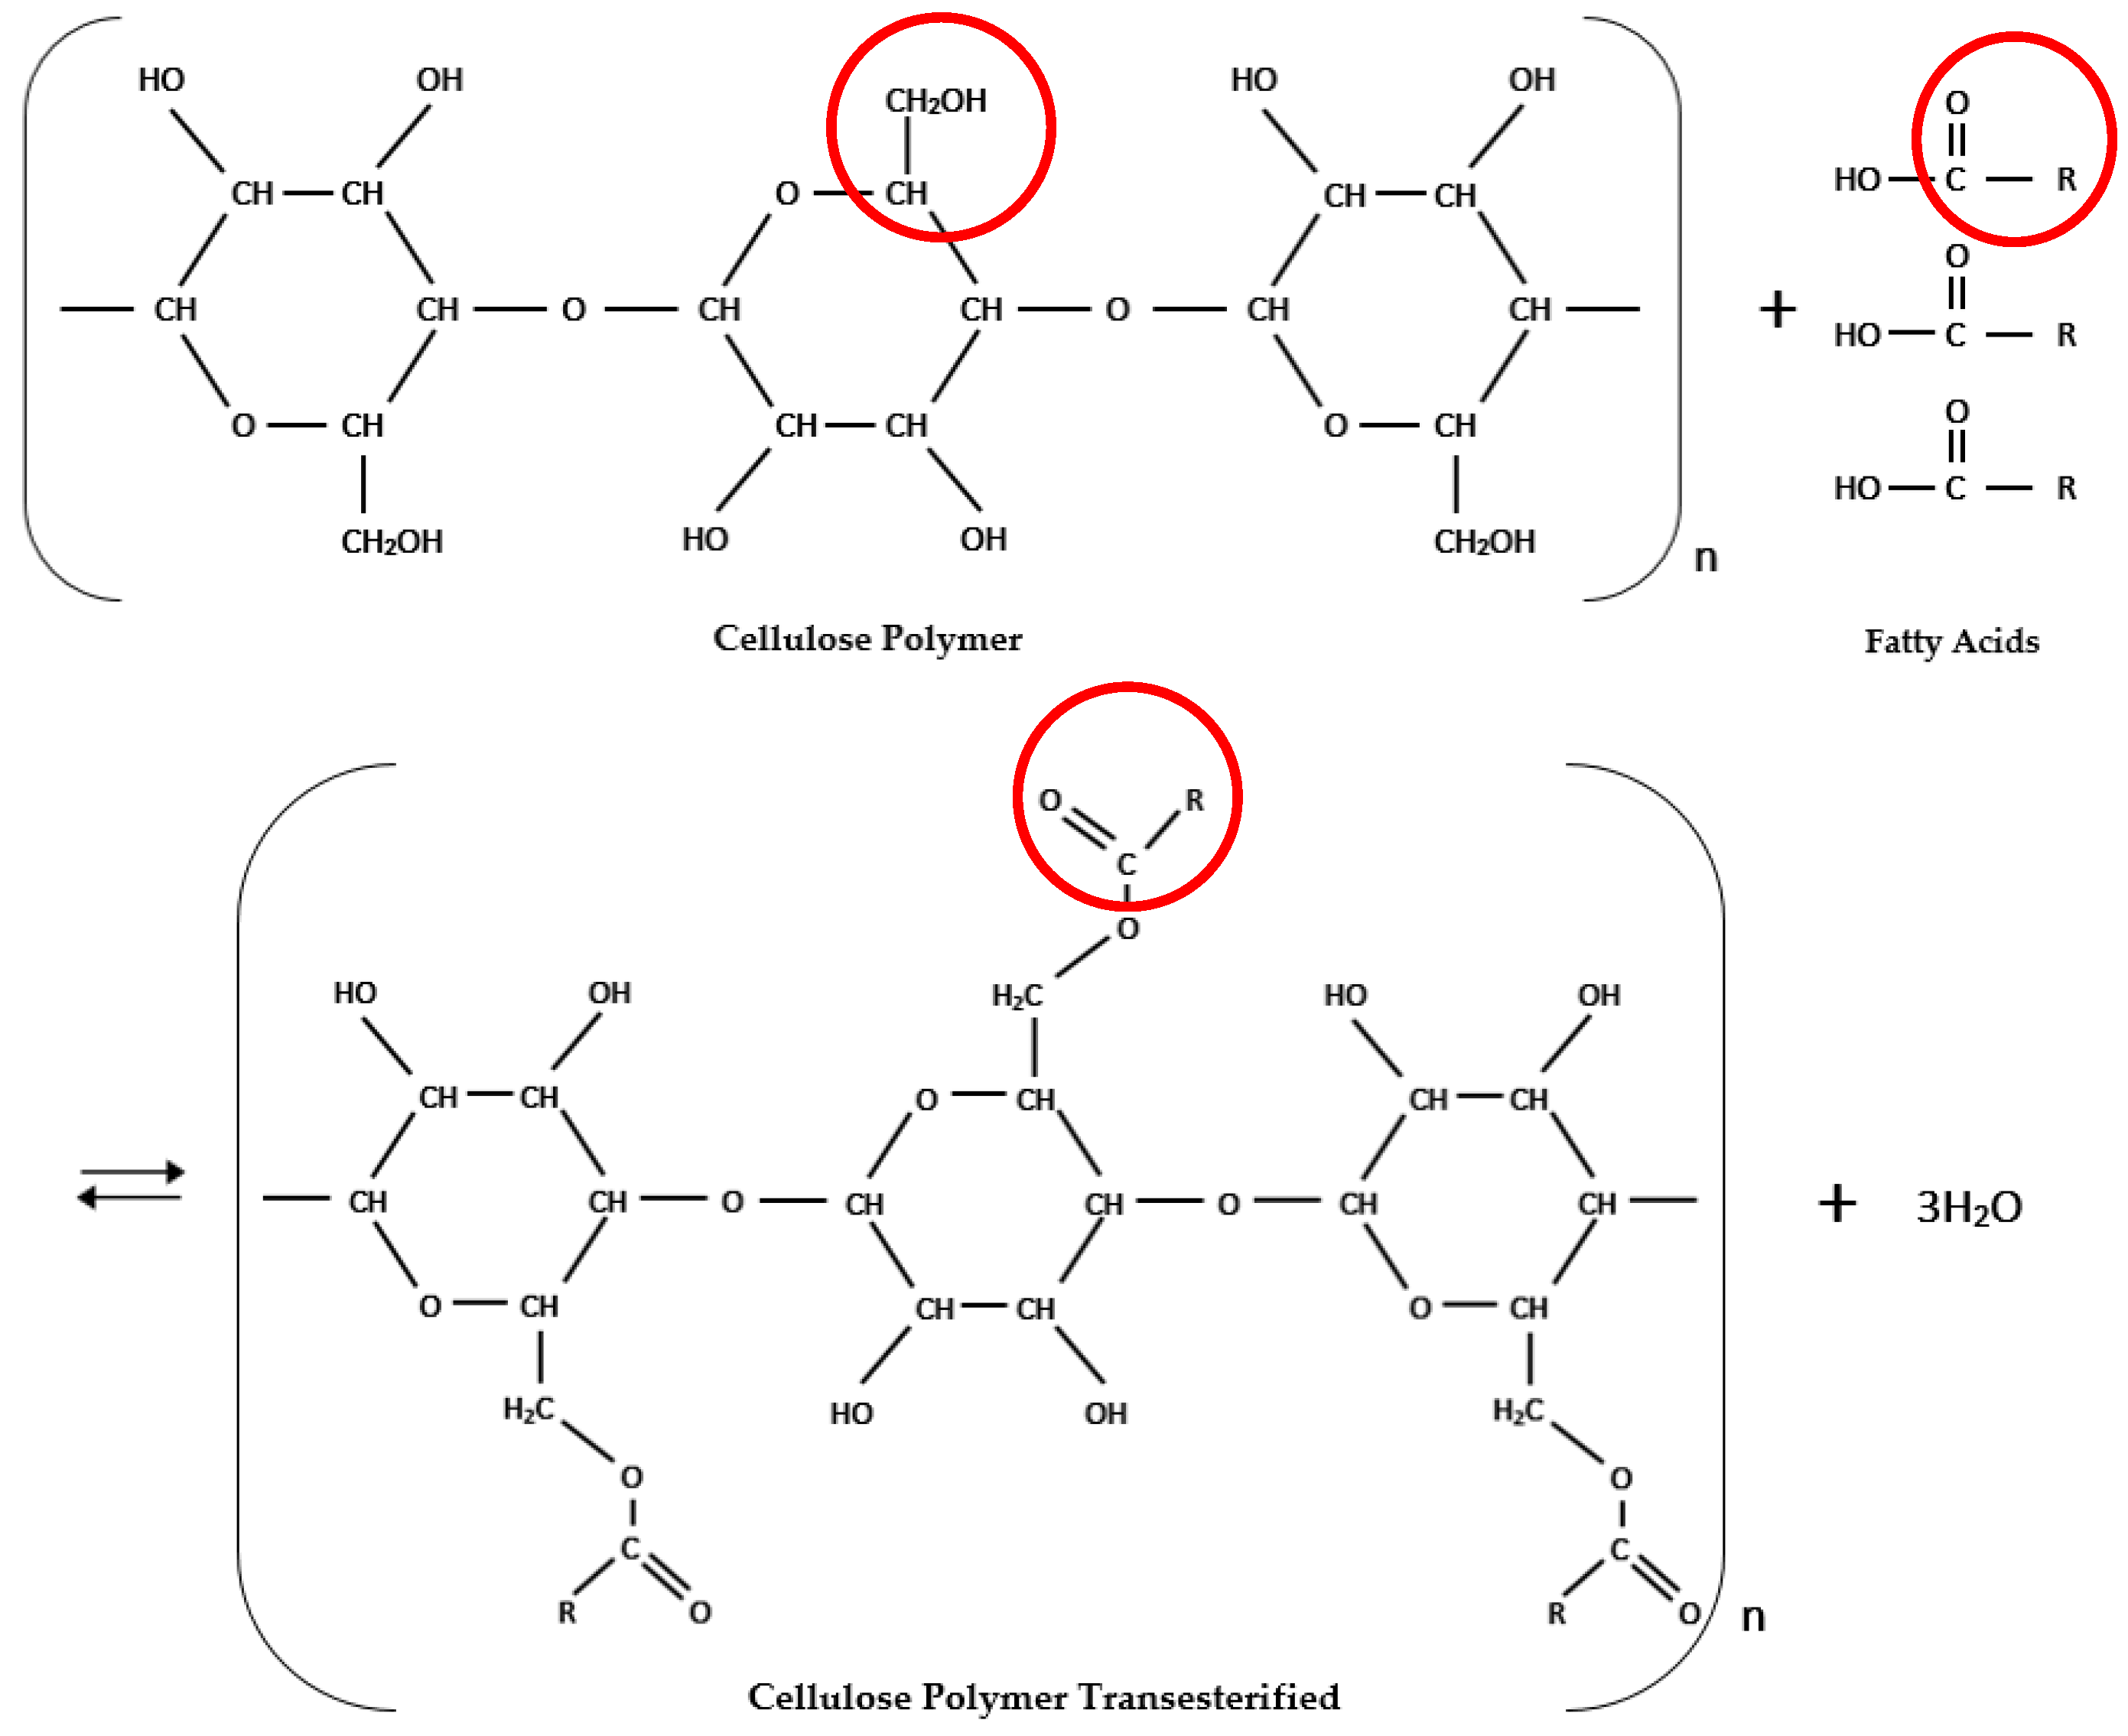
The predominant chemical reaction in natural esters subjected to high temperature is hydrolysis [30]. Hydrolysis and transesterification process can change the chemical structure of transformer insulation paper which can be shown by FTIR analysis. Natural ester molecules are triglycerides, which consist of three fatty acids and one glycerol molecule [9]. Triglyceride and three water molecules are involved in hydrolysis reaction [10,31]. Figure 6 shows the hydrolysis reaction of natural ester [10]. This process generates glycerol and long chain of fatty acids and then the long chain fatty acids which have long-alkyl-chains (-R) consisting of a lot of C–H functional groups bind to the cellulose through transesterification generating transesterified cellulose and three molecules of water as shown in Figure 7. The transesterification process involves cellulose and the long chain of fatty acids, which bind to cellulose.
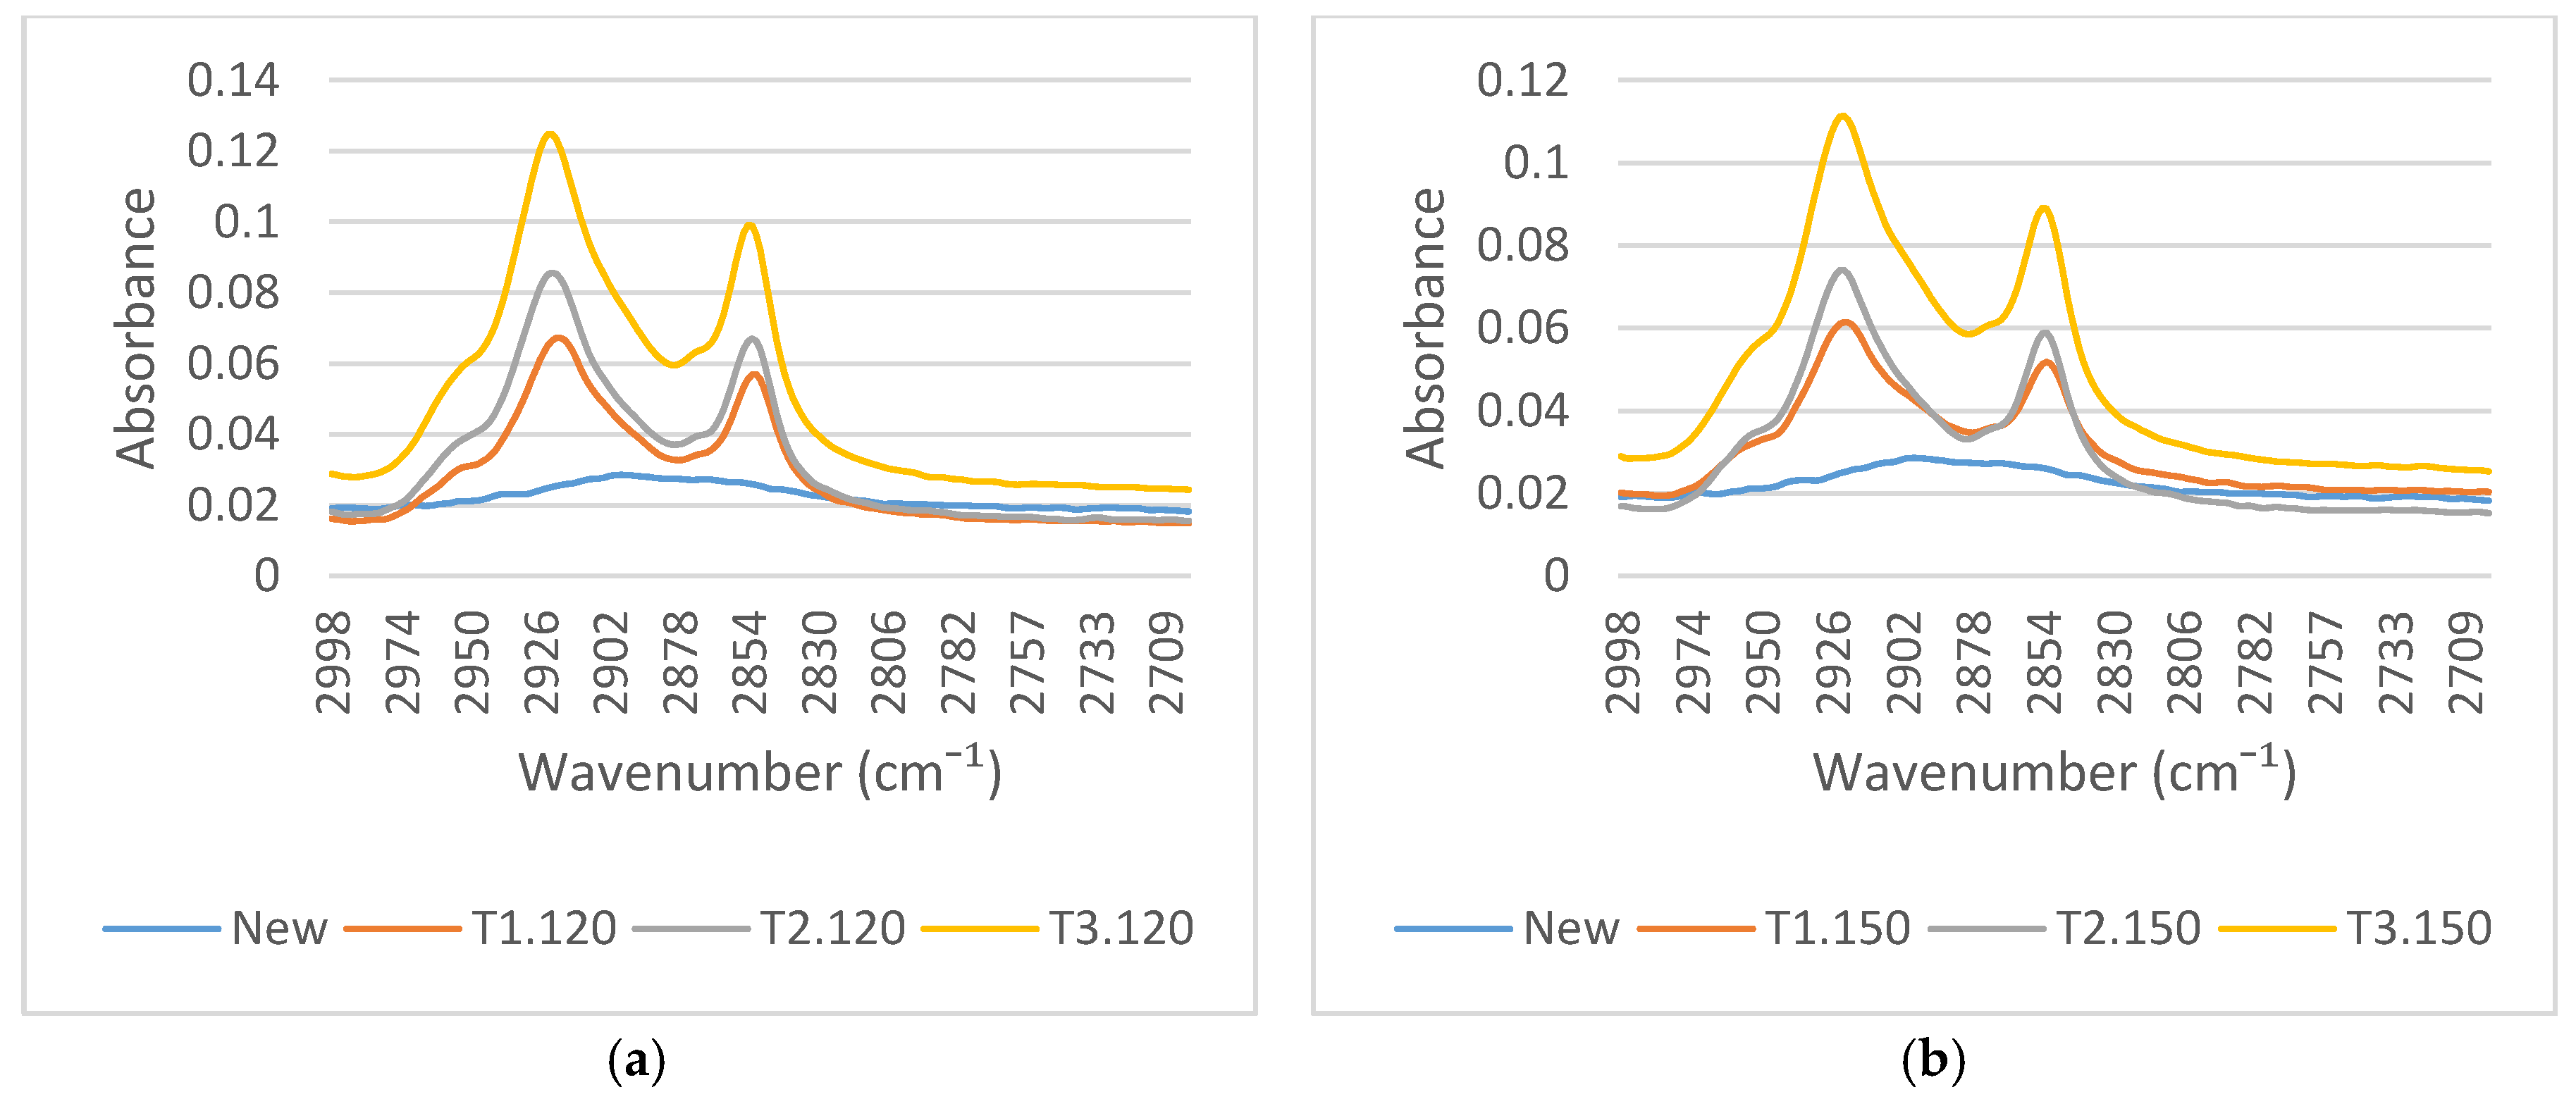
Figure 8a,b illustrate the variations of FTIR spectra around 2900 cm−1 of the transformer insulation paper at the aging temperatures of 120 °C and 150 °C. As shown in these figures, there are two absorbance spectra peaks at 2854 cm−1 and 2922 cm−1 which represent C–H functional groups. Figure 8a,b show that the intensity of the peak absorbances of the C–H functional groups of transformer insulation paper have increased with aging due to hydrolysis of the natural ester and transesterification of the transformer insulation paper. as shown in Figure 8 [10]. So, the long alkyl chain which is initially part of fatty acids in natural ester binds to cellulose. Further, transesterification process in the insulating paper can be confirmed by C=O functional group at 1743 cm−1 [3].
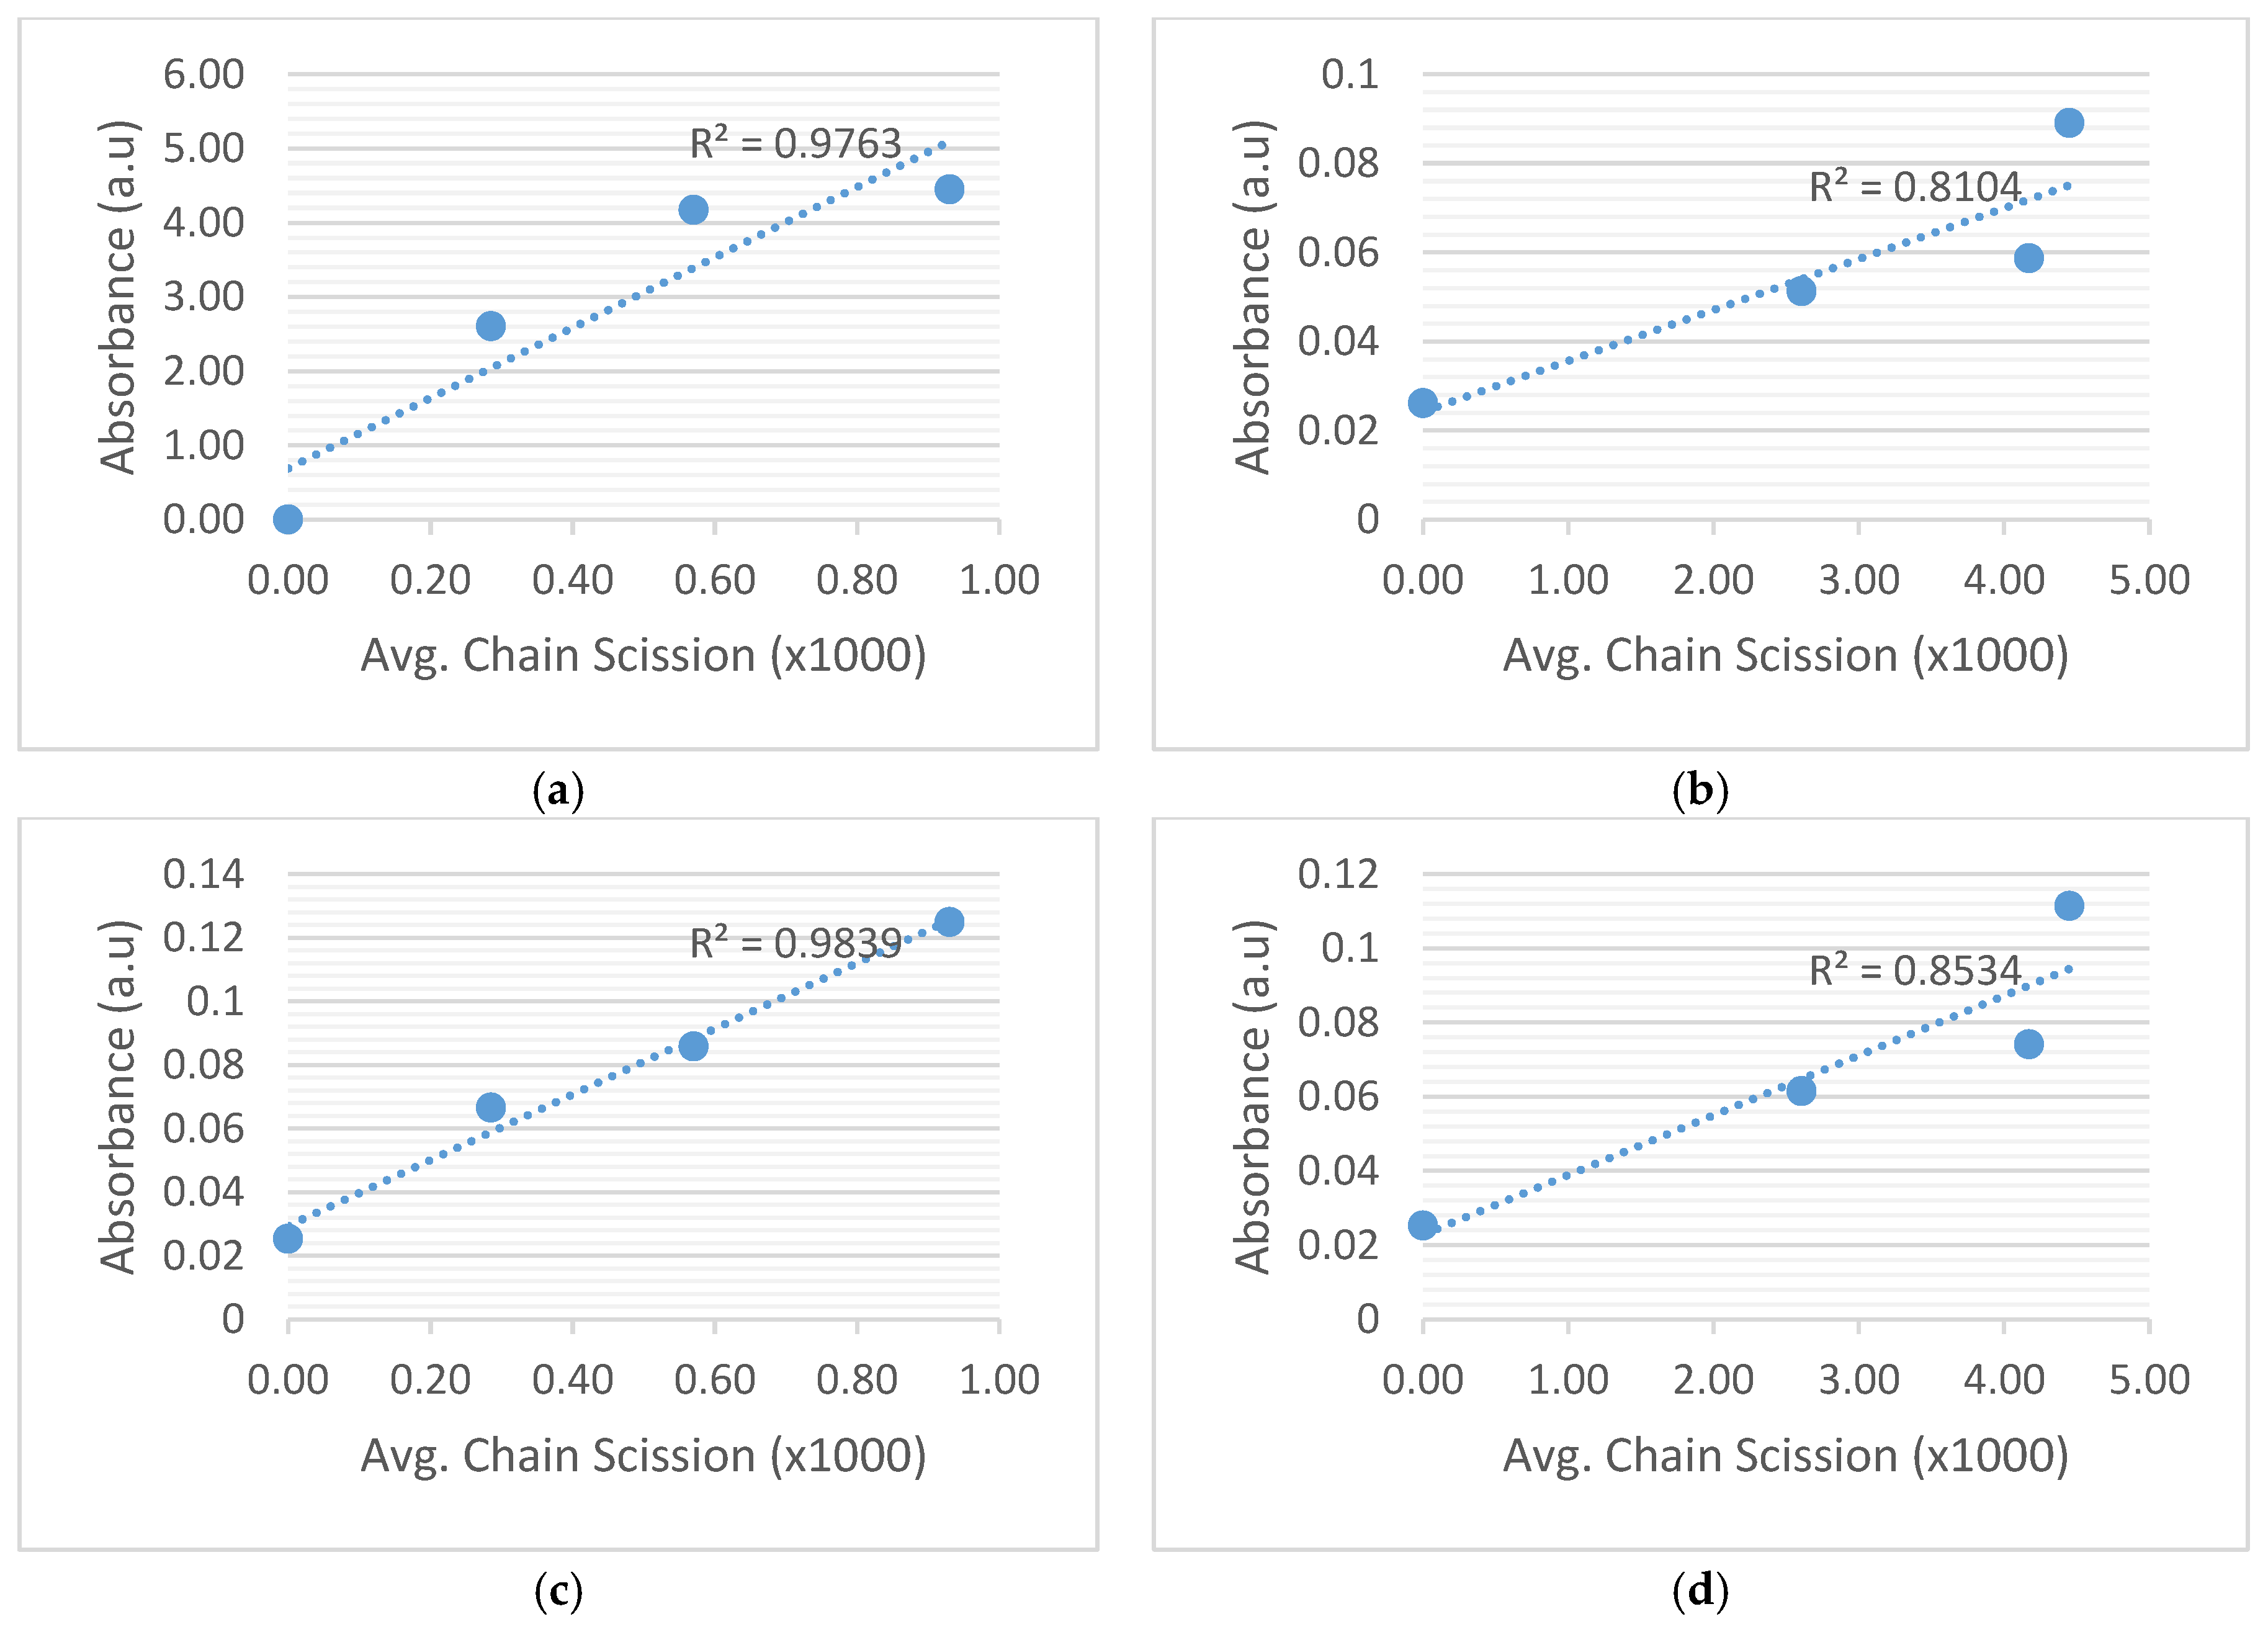
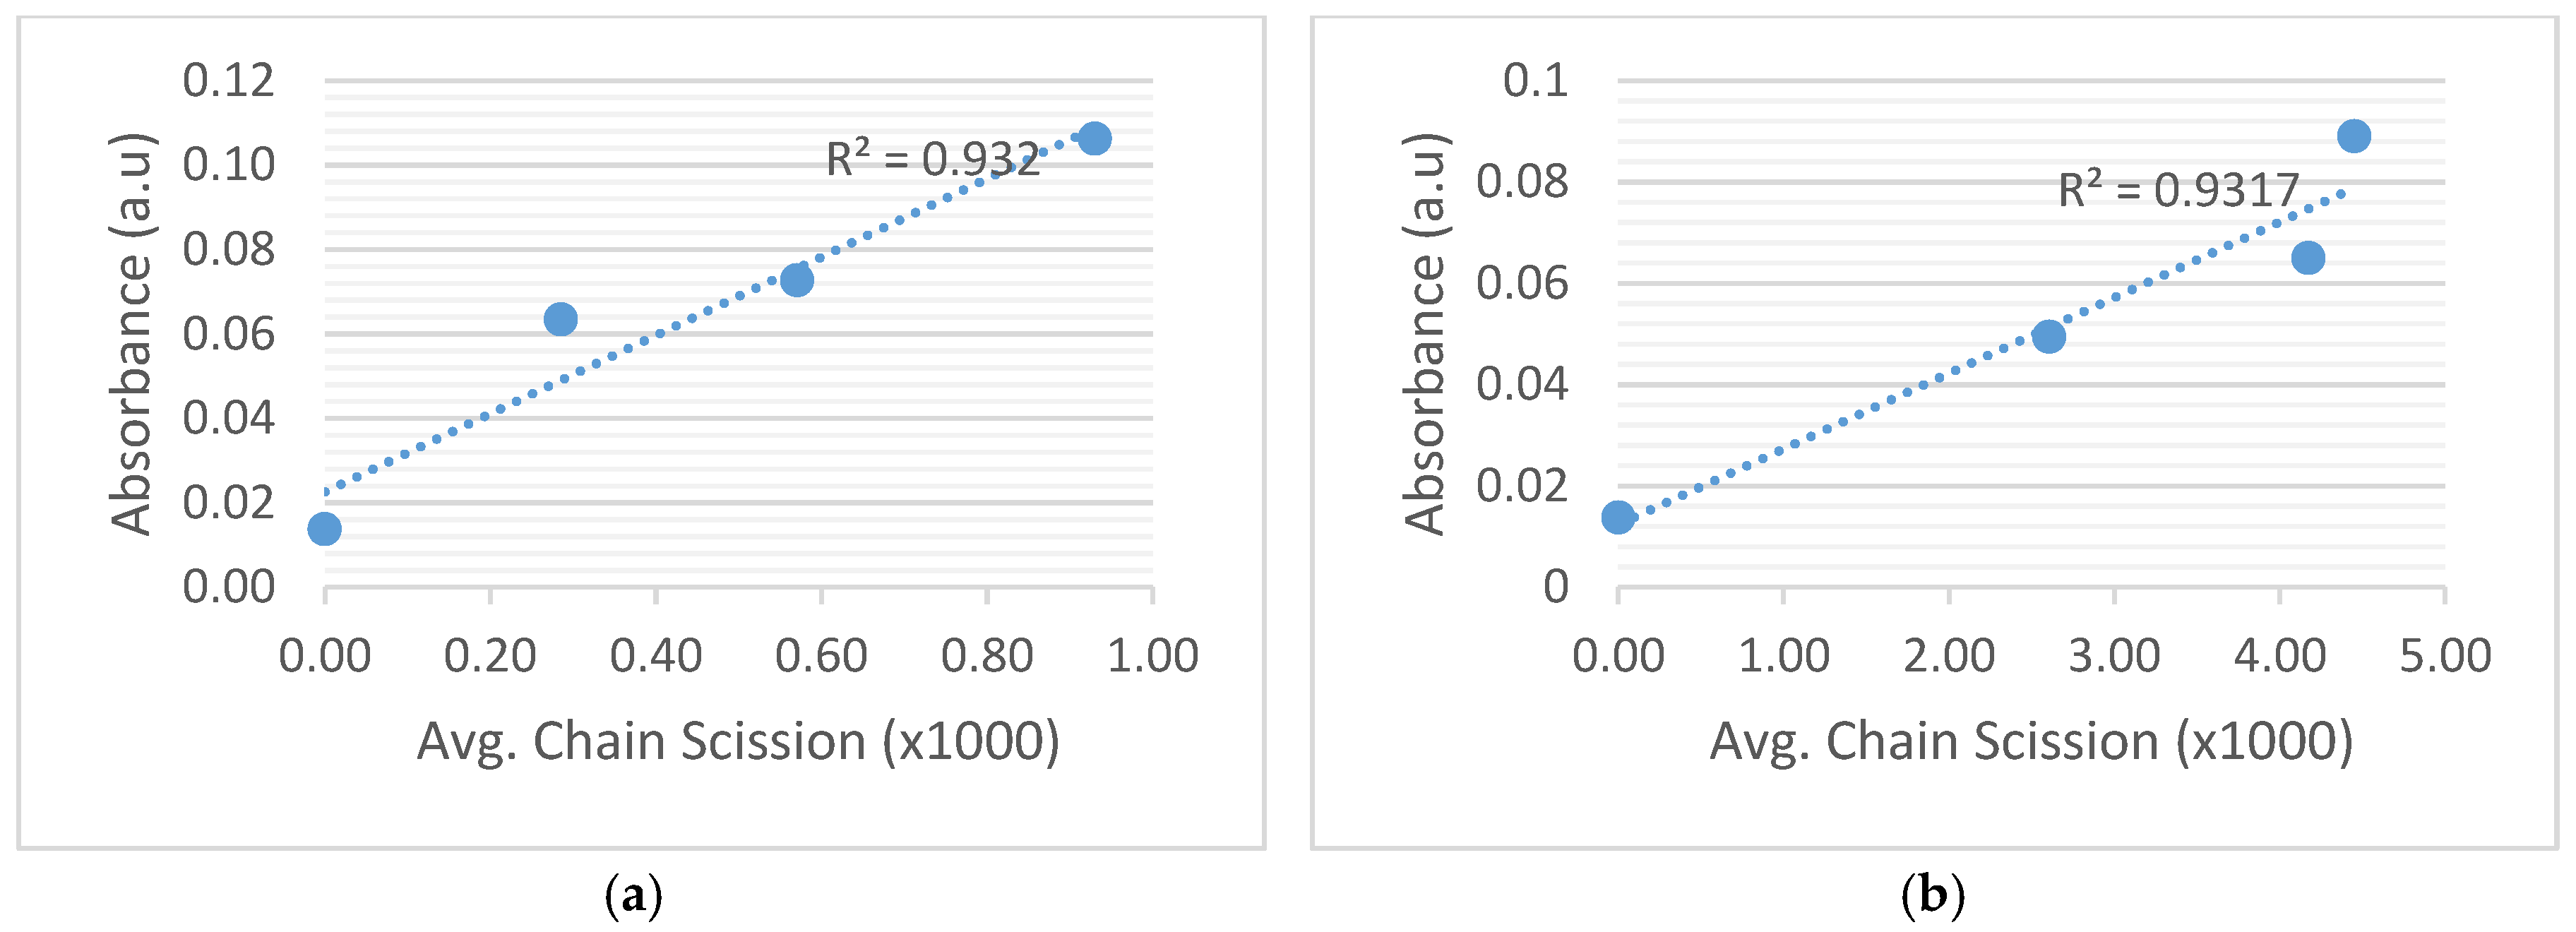
Figure 9 shows the correlation between intensity of peak absorbance of C–H functional group absorbance (at wavenumber 2922 cm−1 and 2854 cm−1) and the average number of chain scissions of transformer insulation paper. In these studies, linear regression is used to get the correlation between the chemical structure and the aging performance characteristic of transformer insulation paper. Average number of chain scissions is used to describe the degradation of cellulose due to thermal aging, which is given in Equation (1) [32]:
Avg .   Chain   Scission =   1 DP t 1 DP 0  
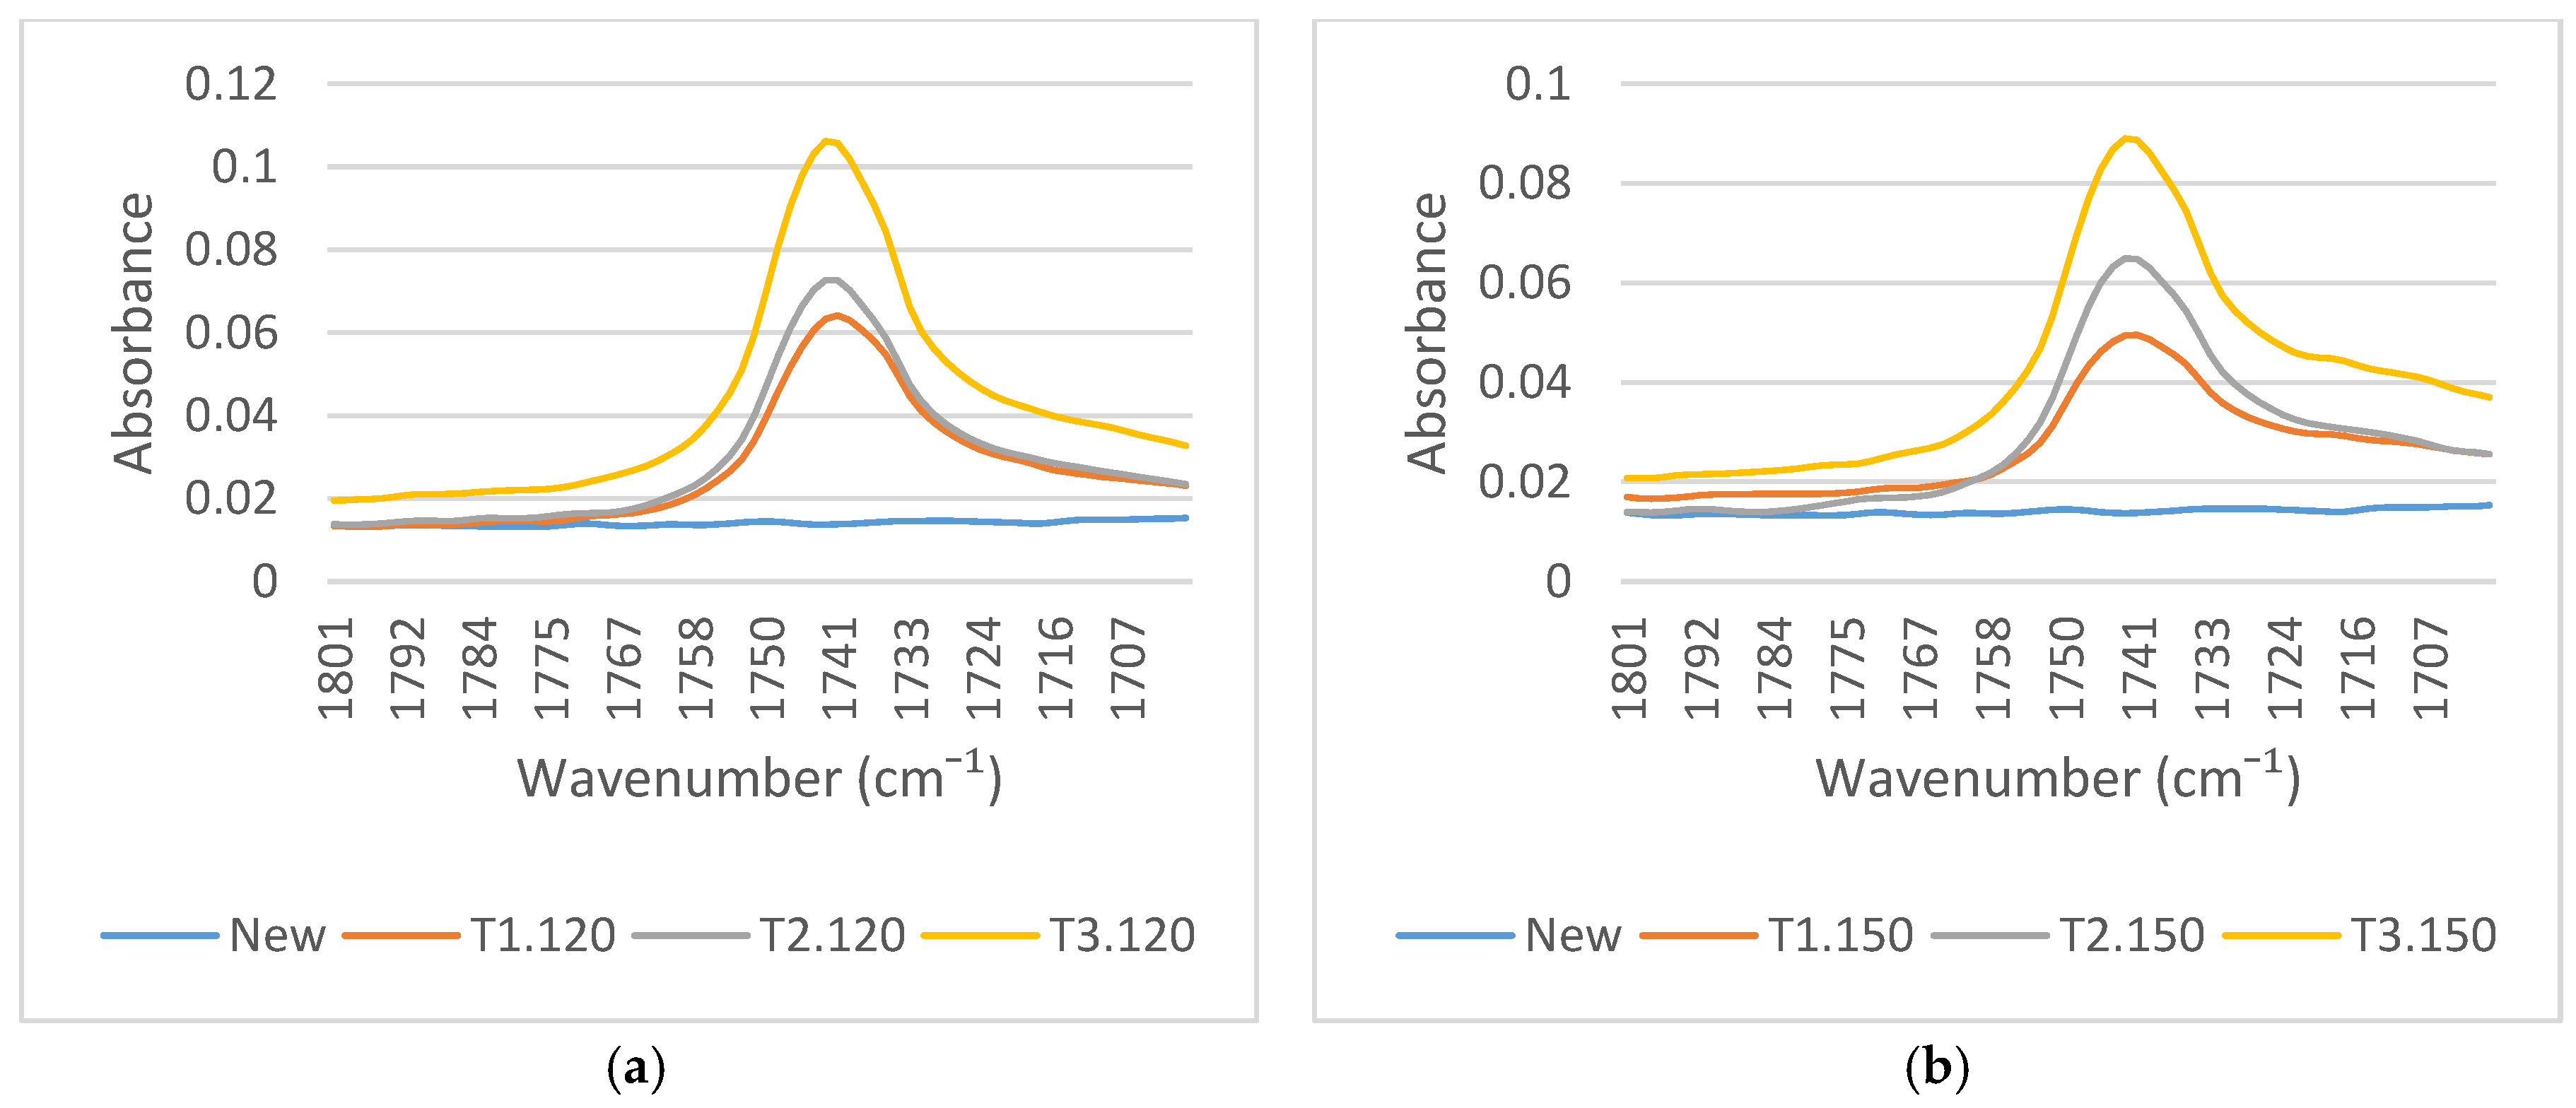
Figure 10a,b illustrate the variations of FTIR spectra around 1700 cm−1. The C=O functional group didn’t appear in new transformer insulation paper, but there is a peak absorbance in its spectrum after thermal aging. This carbonyl band indicates the presence of an ester bonded to the cellulose, providing evidence that the transesterification has taken place [30]. Figure 10a,b show the intensity of the absorbance peak of the C=O functional group has increased with aging, showing that the chemical structure of transformer insulation paper has changed after thermal aging. The C=O functional group which is initially part of fatty acids in natural ester binds to cellulose. The produced ester group firmly bonded water molecules to the ester group and the long chain fatty acids esterified on cellulose were arranged in parallel with the cellulose chain to form a “water barrier” that can reduce the potential damage of water on the transformer insulation paper [8].
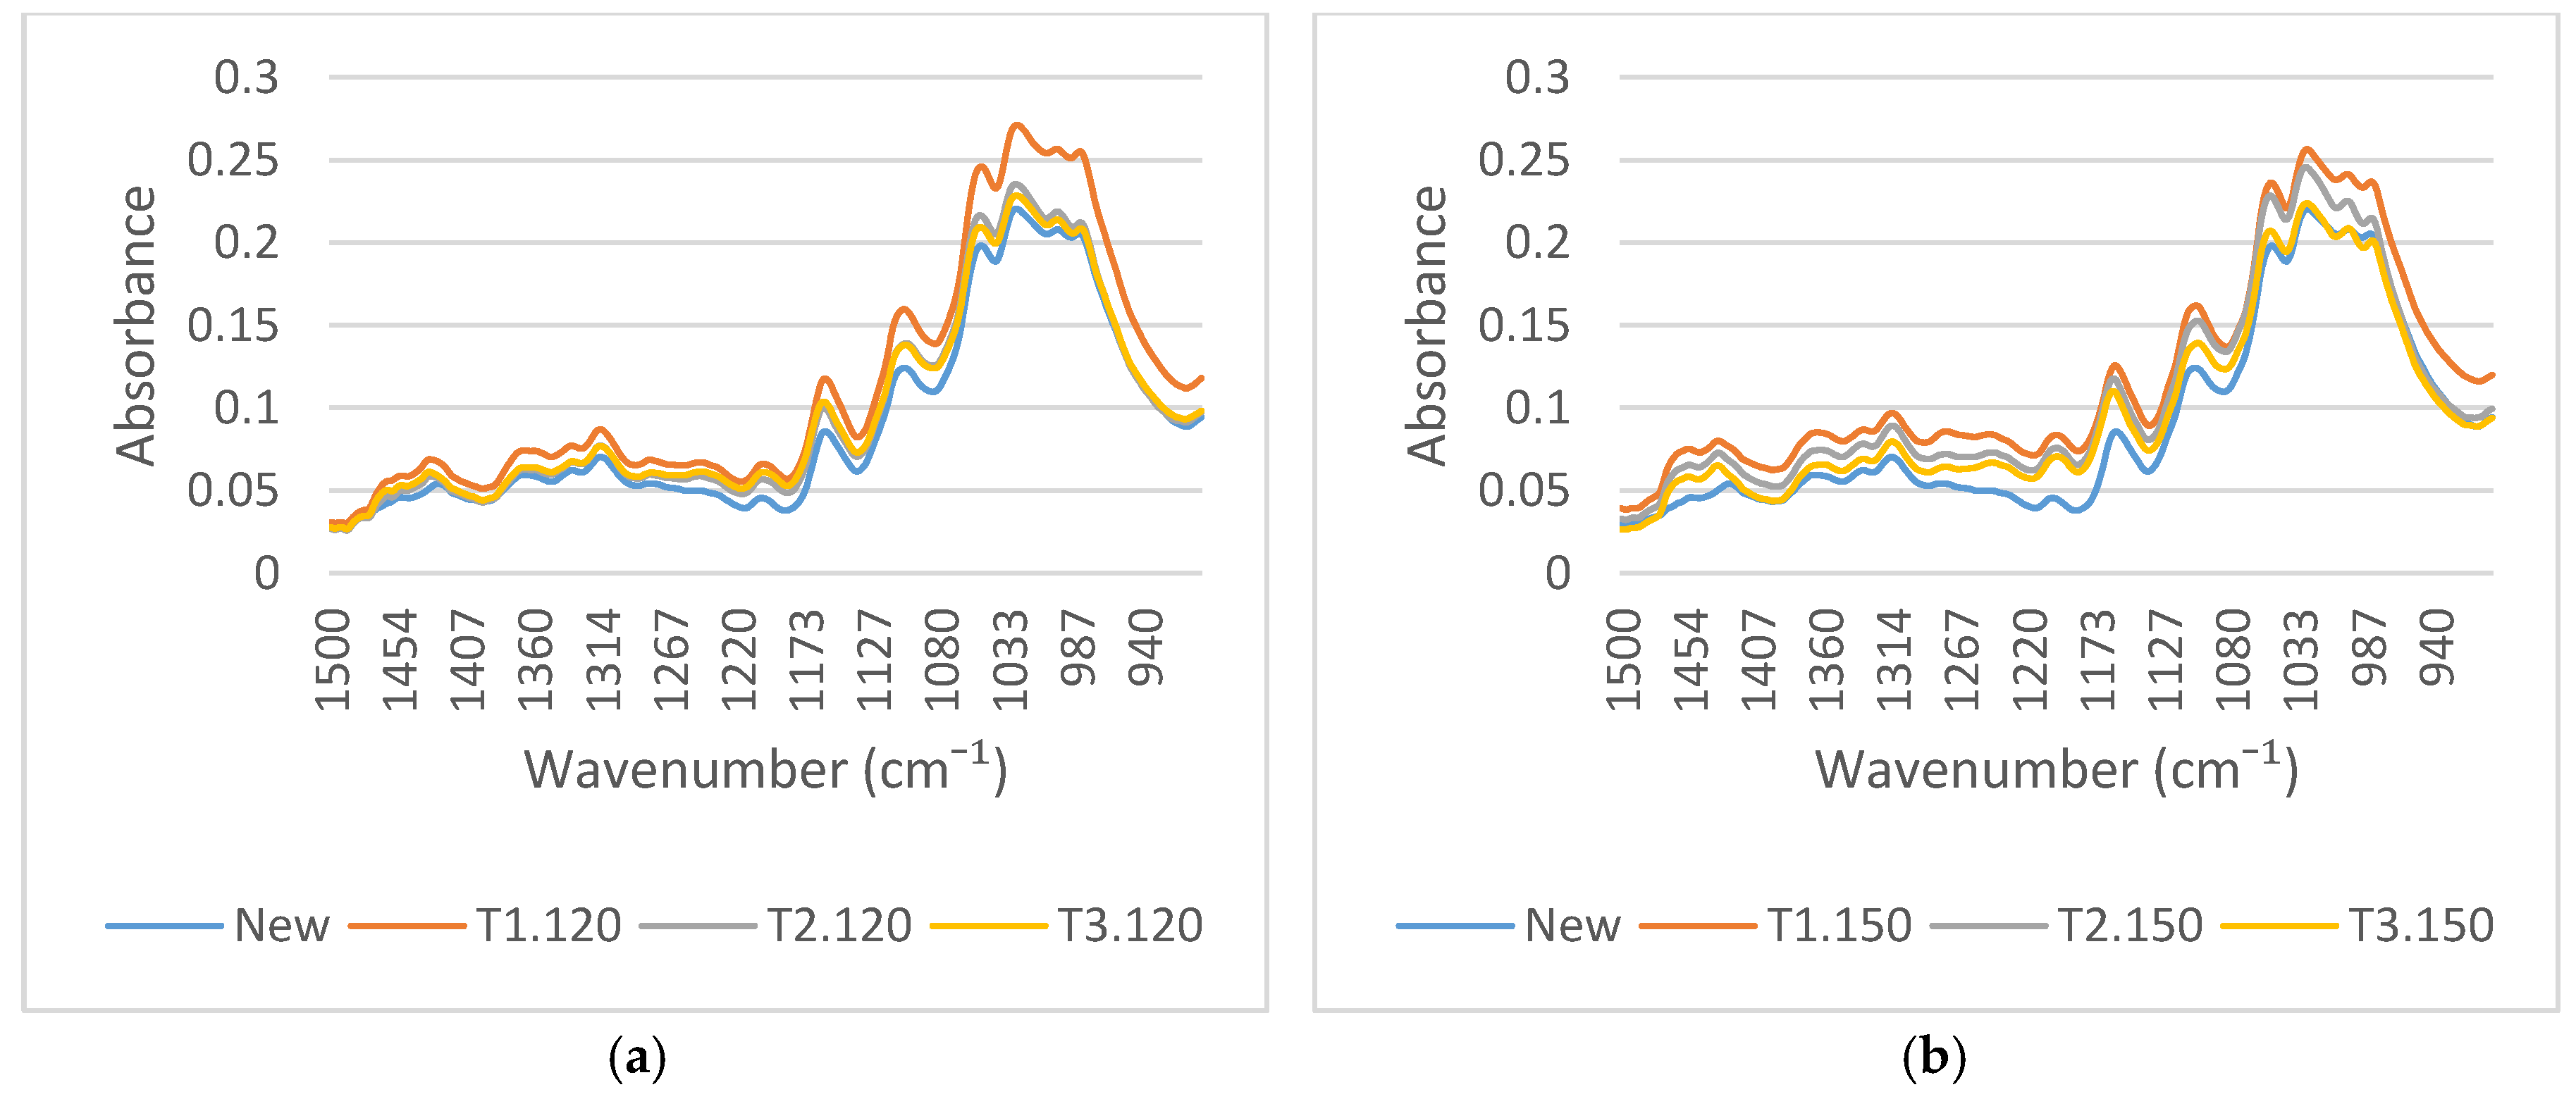
Transesterification of the long chain fatty acids may protect of cellulose insulation in two ways: by strengthening C–O and C–C bonds in cellulose and forming a barrier preventing water ingress to the cellulose [8]. The intensity of peak absorbance of the C–O functional group at wavenumber 1159 cm−1 of the aged transformer insulation paper is greater than in new transformer insulation paper as shown in Figure 11. This peak confirms that transesterification process may allow the estimated lifetime of transformers that use natural ester as insulating liquid longer than when using mineral oil. Figure 12 shows the correlation between the intensity of peak absorbance of C=O functional group at wavenumber 1743 cm−1 and the average number of chain scission of transformer insulation paper.
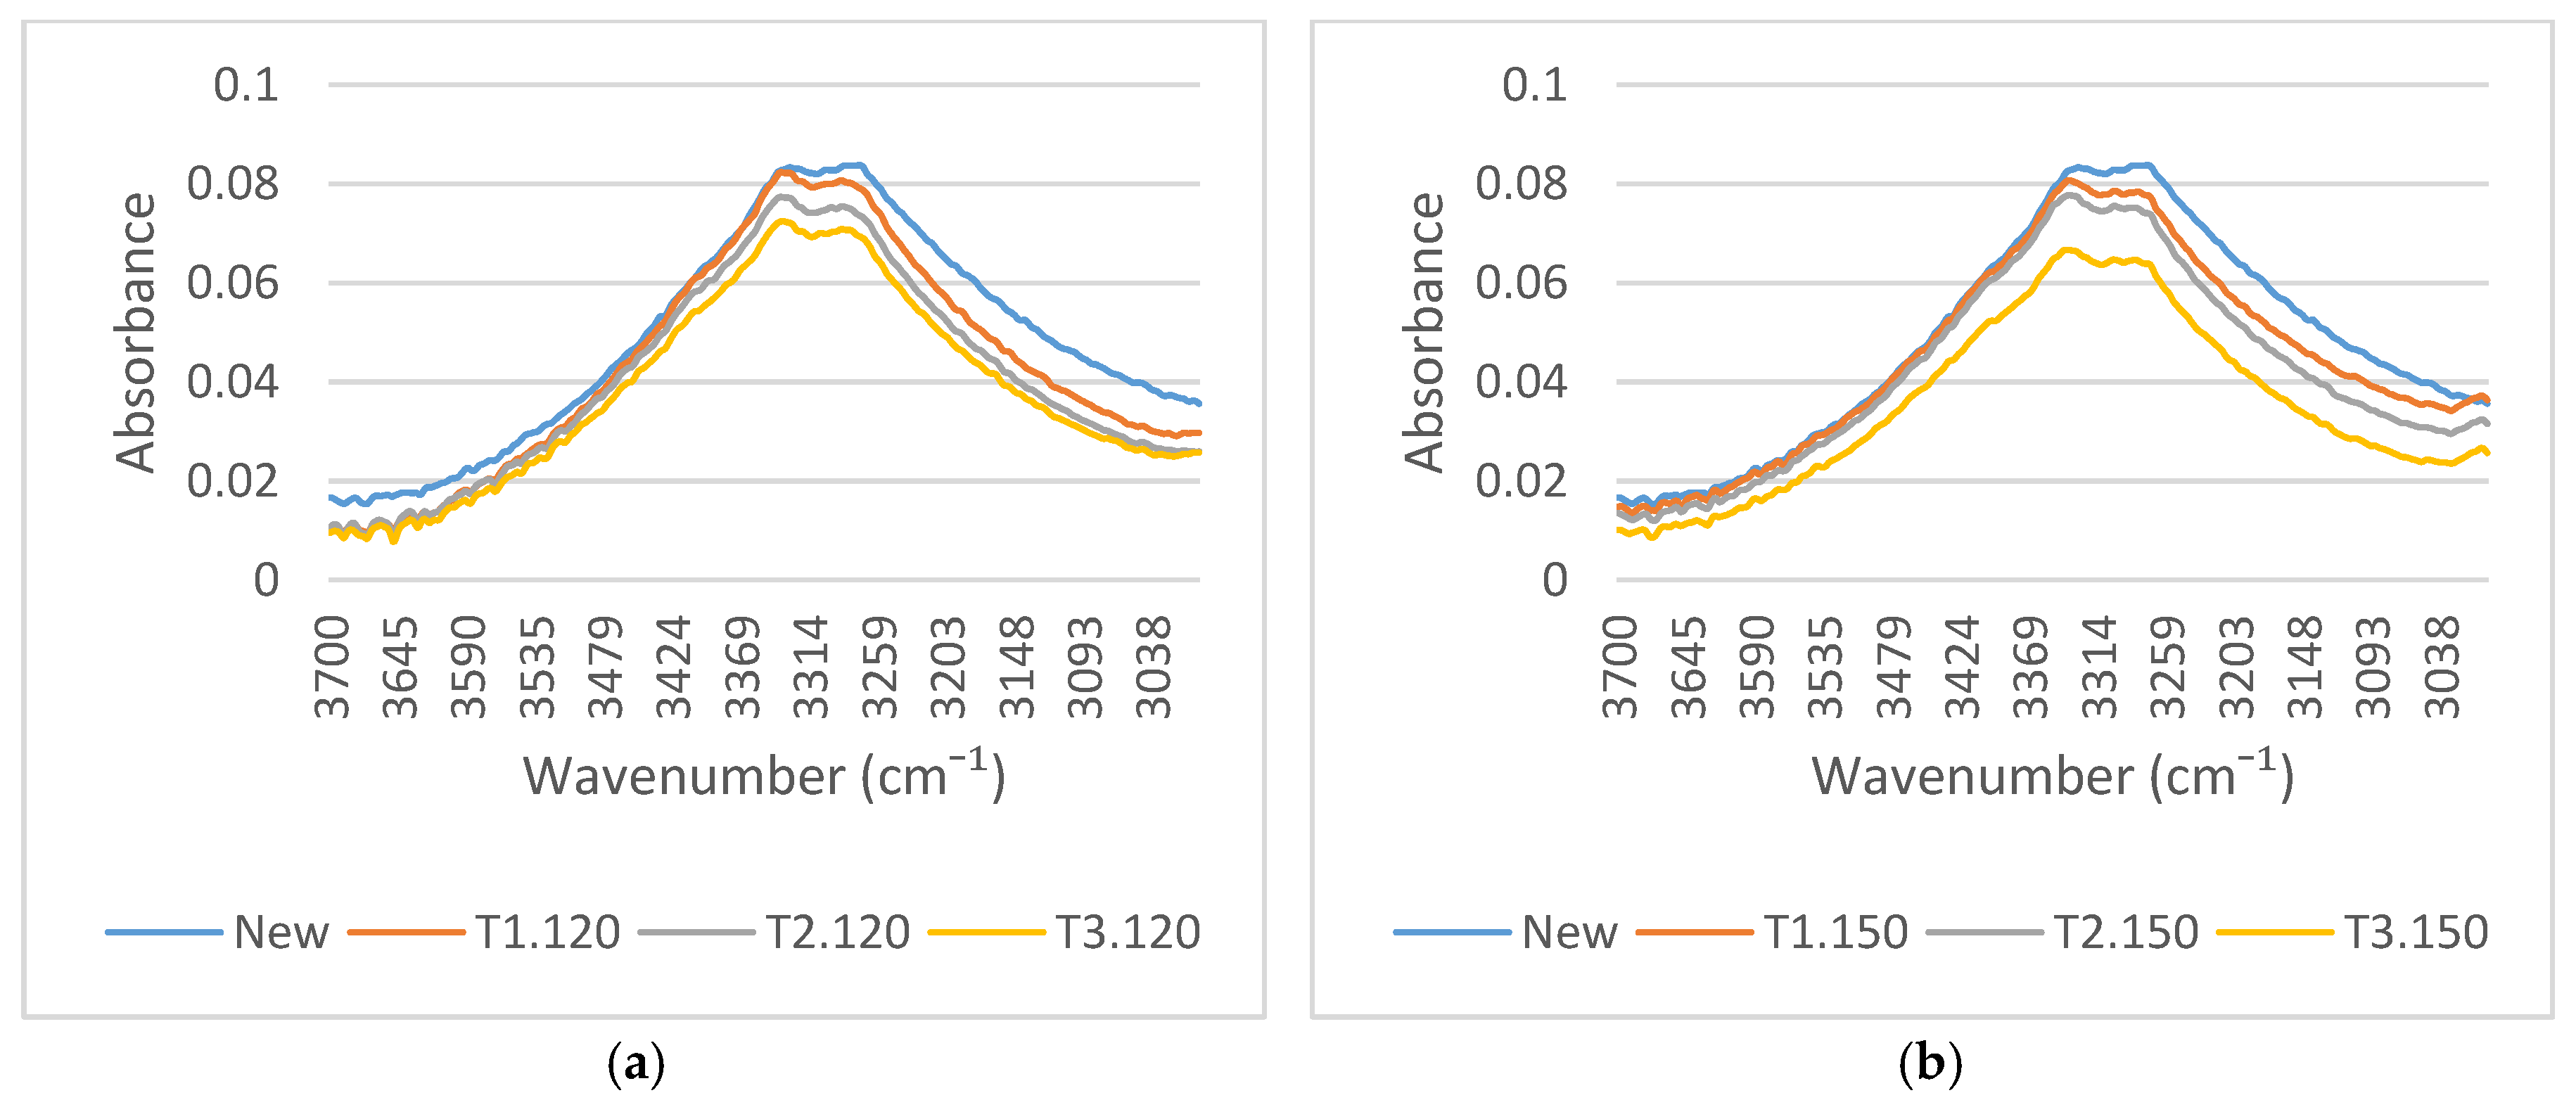
Figure 13a,b illustrate the FTIR spectra variations around 3200 cm−1. There are two absorbance peaks at 3273 cm−1 and 3325 cm−1 which represent the O–H functional groups. The intensity of the absorbance located close to 3340 cm−1 can be attributed of hydroxyl groups which are a typical characteristic of cellulose [33]. Figure 13a,b show that the intensity of the absorbance peaks of the O–H functional group decreased during aging. This O–H functional group decrease can be attributed to the reduction of molecular weight [3]. The reduction of O–H functional groups is due to the hydrolysis reaction of cellulose, which generates glucose and oxidation reactions during aging which generate CO2 and H2O [34]. 
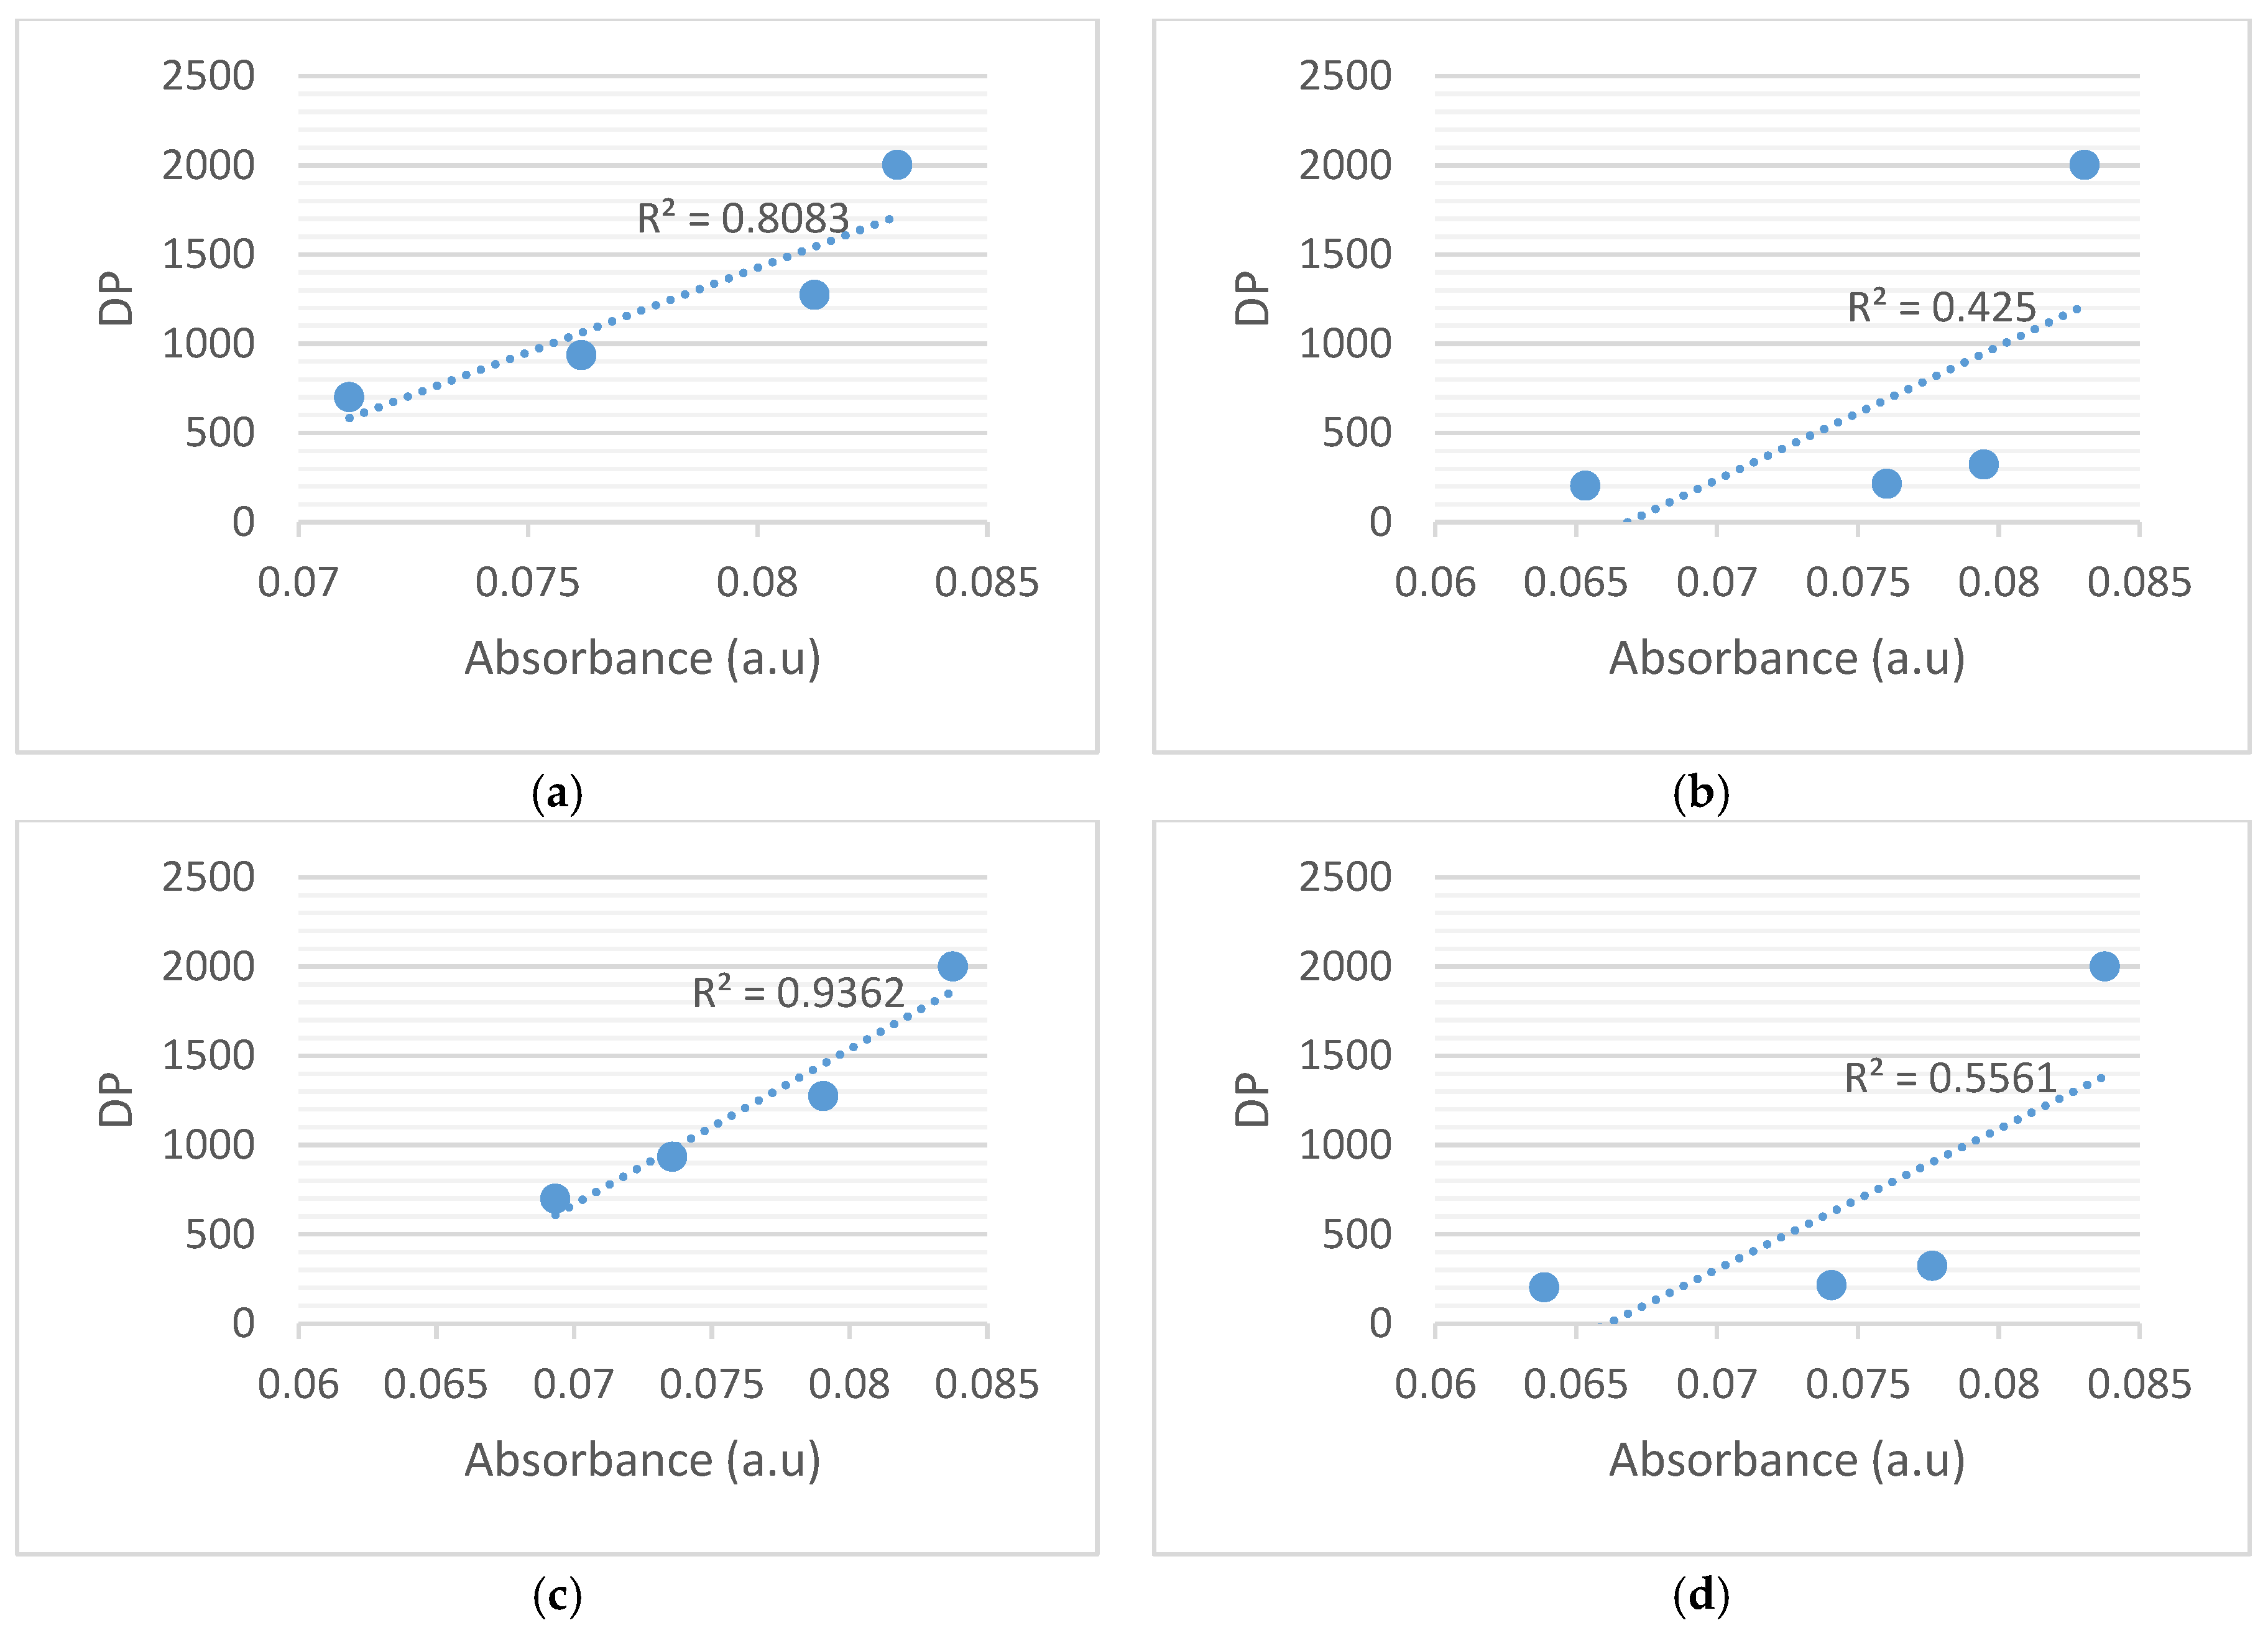
Figure 14 shows the correlation between DP and the intensity of peak absorbance of the O–H functional group at wavenumber 3325 cm−1 and 3273 cm−1 of insulating paper.
The EDS results show that the main elements of transformer insulation paper are the elements C and O. The result is in accord with the fact that paper is composed of cellulose which has chemical formula C6H10O5 [35]. Hydrogen was not detected because the H 1s electrons are valence electrons and don’t participate in chemical bonding [35]. Hydrogen are not useful in elemental identification using the EDS method [
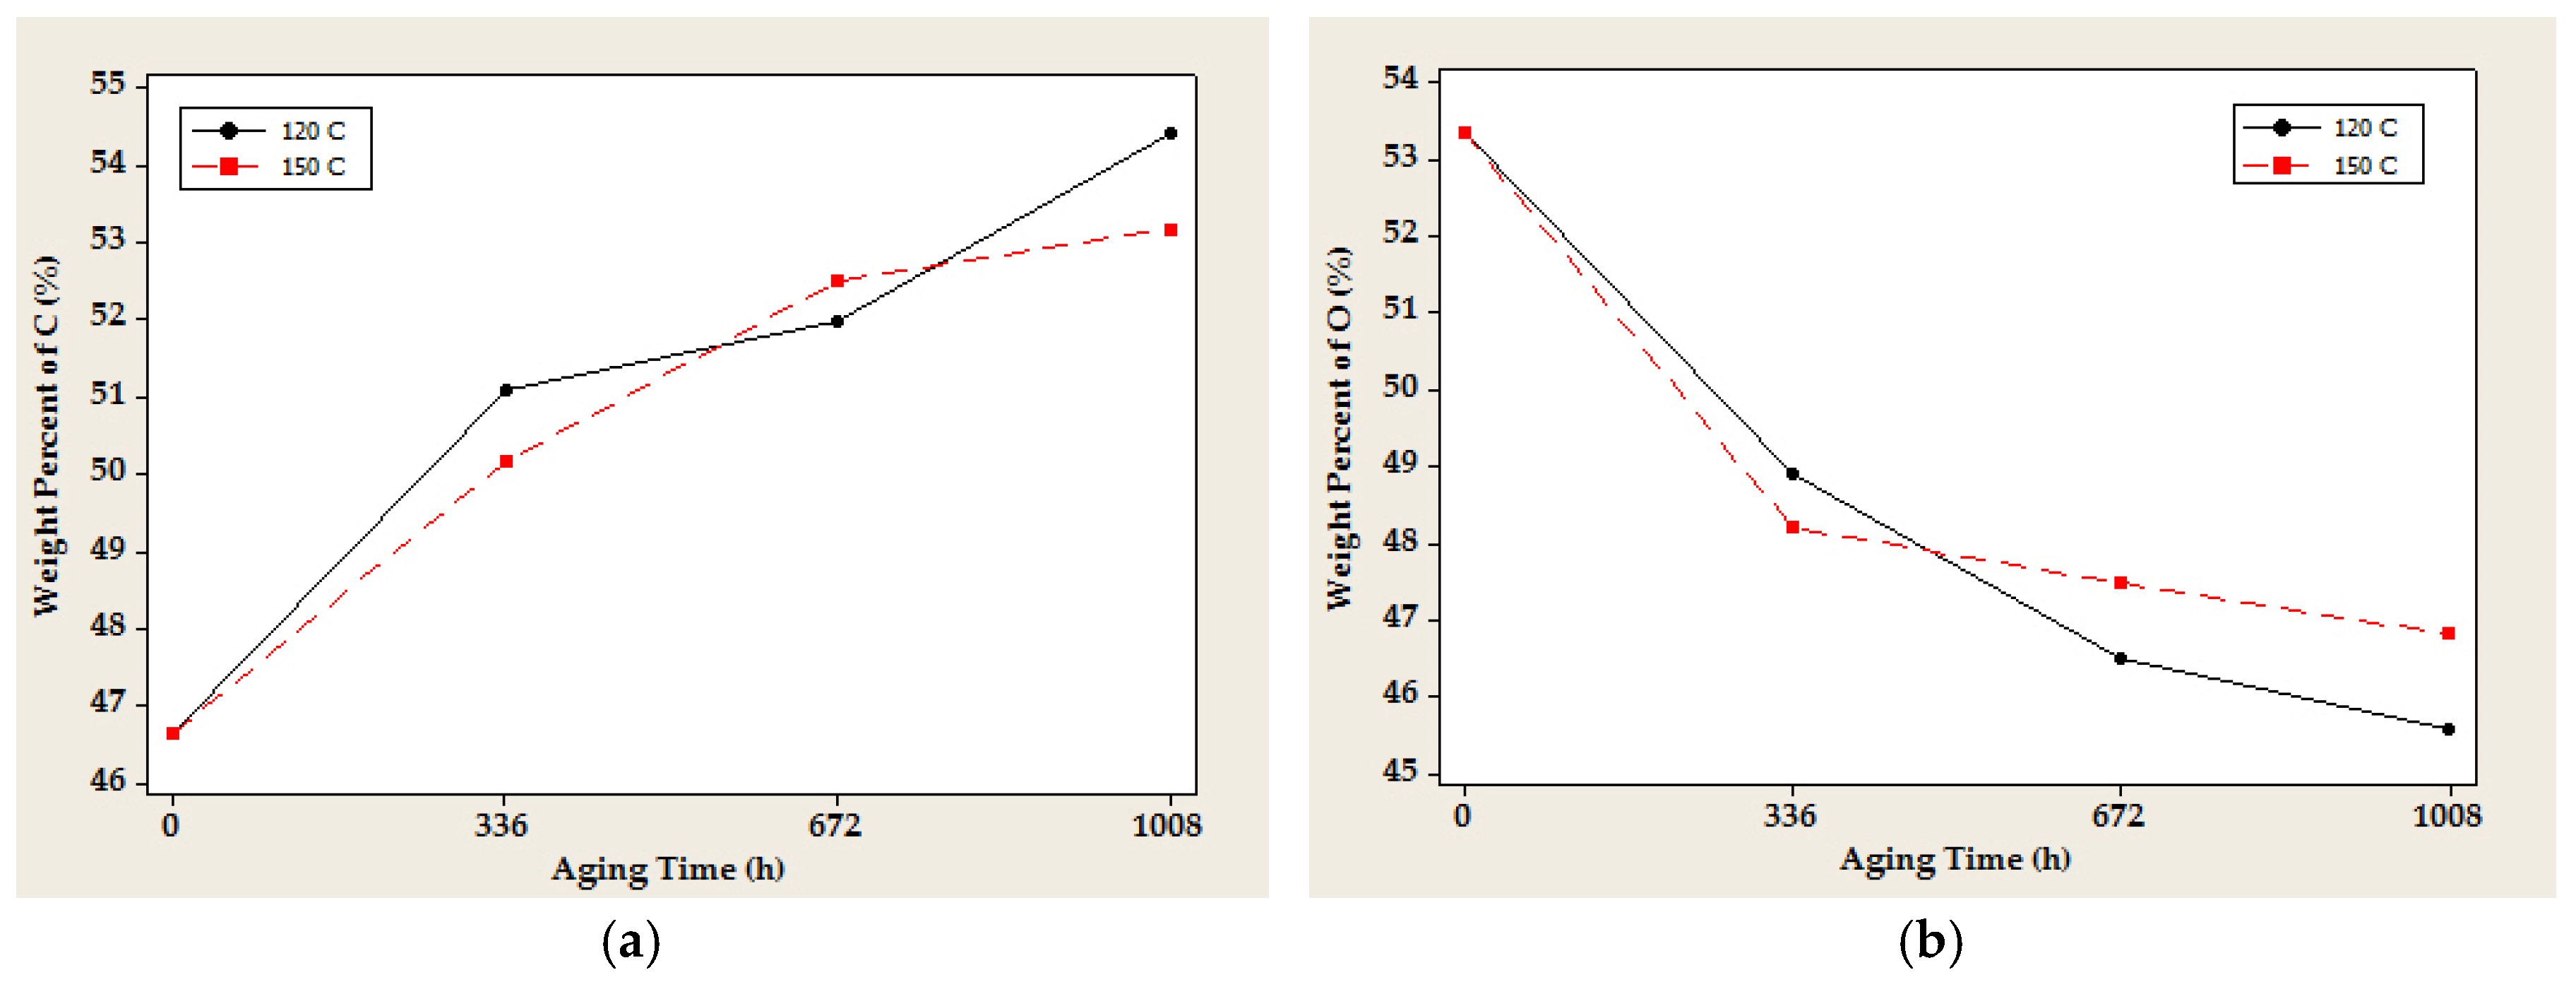
36]. The result shows that the weight percent of the C element in transformer insulation paper has increased with aging as shown in Figure 15. 
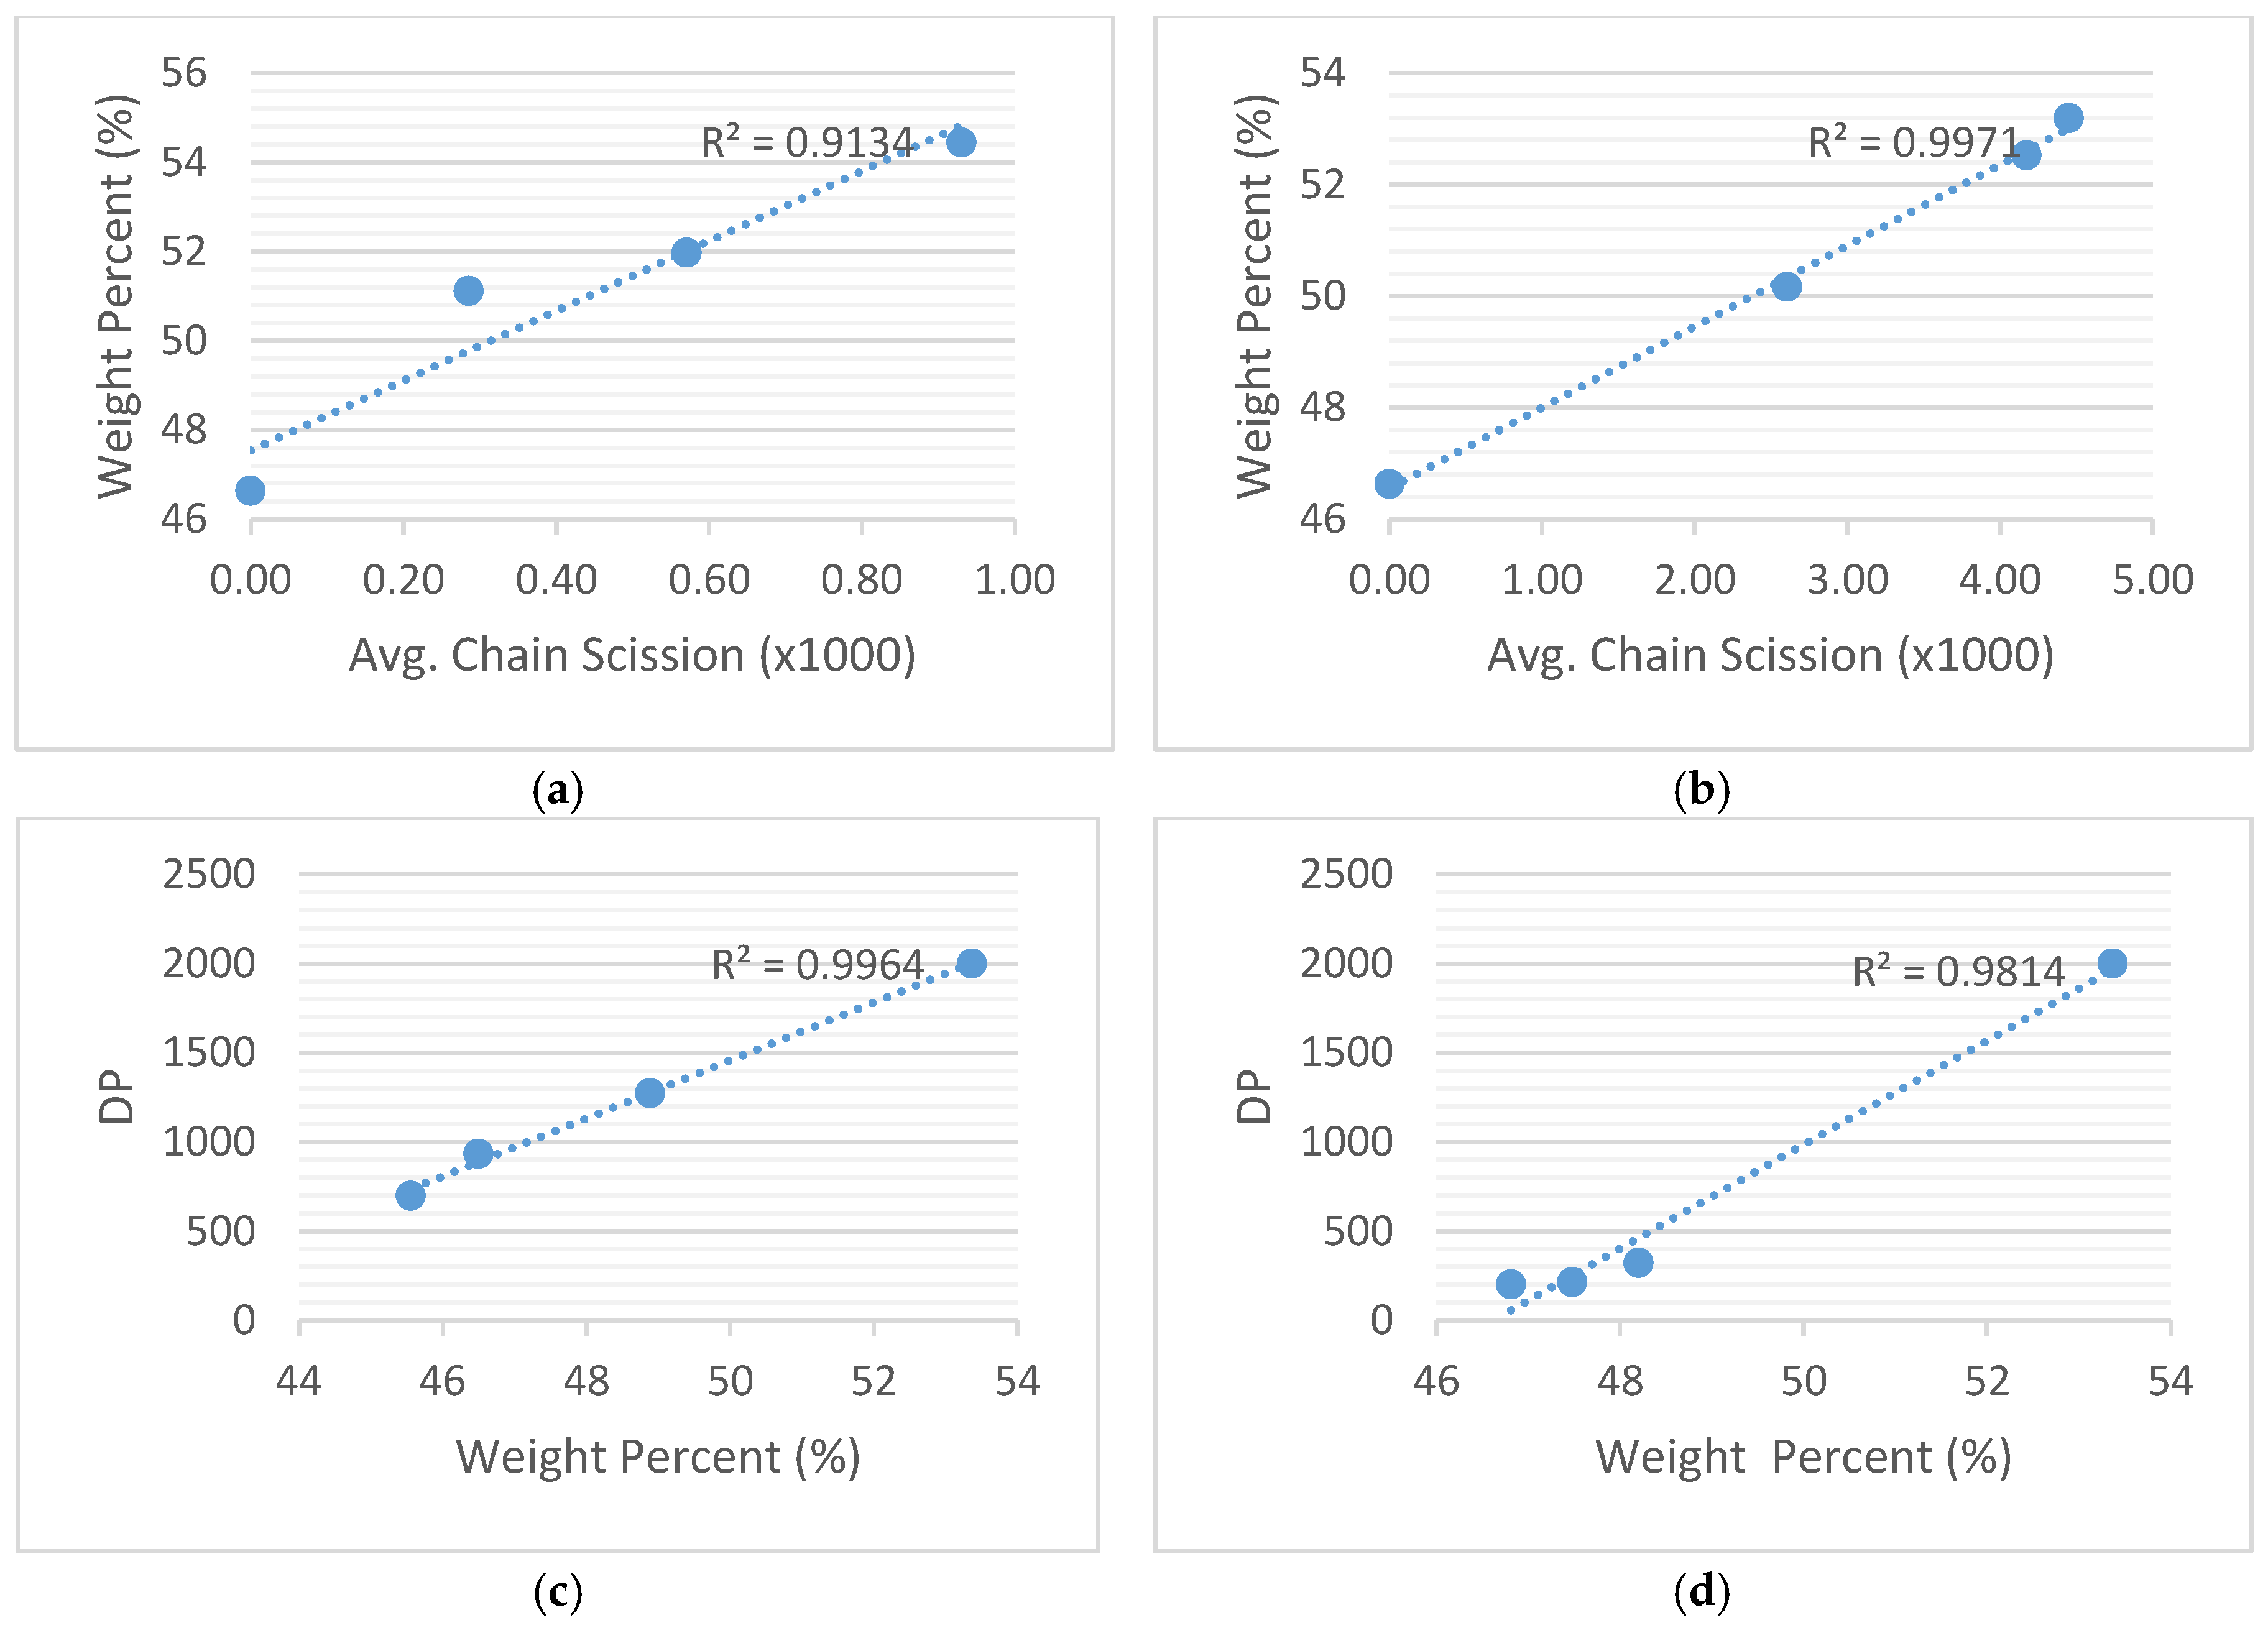
Figure 16a,b show the correlation between the weight percent of C element and the average number of chain scissions of transformer insulation paper.
The result of EDS shows that the weight percent of O element has decreased with aging due to oxidation reaction of transformer insulation paper during aging which CO2 and H2O are generated from glucose. Figure 16c,d show the correlation between DP and the weight percent of O element. From the Table 5, the value of R2 = 9134 and R2 = 9971 indicate the correlations between average chain scission and the weight percent of the C element which are greater than the other correlation.
From Table 6, the values of R2 = 0.9964 and R2 = 0.9814 are the correlations between DP and the weight percent of the O element which are greater than the other correlation. The value of R2 of the correlation between DP and intensity of peak absorbance of the O–H functional group is very small because the degradation of transformer insulation paper increases significantly during thermal aging. This research shows that EDS can be used as a testing method to predict DP through the percentage of decreasing of O element.

4. Conclusions

This study confirmed that the DP and TS decreased with aging. There is a correlation between physical and chemical characteristics of paper samples which is shown by the correlation between DP and TS. The interactions between natural esters and transformer insulation paper can be explained by the hydrolysis reaction of natural esters and a transesterification process of transformer insulation paper. FTIR results showed that the intensity of the absorbances representing C–H and C=O functional groups have increased with aging due to hydrolysis of the natural ester and the transesterification process which involved the long alkyl chains of fatty acids. The peak absorbance at 1743 cm−1 in the FTIR spectra of transformer insulation paper aged in natural ester confirms the transesterification process of cellulose in the natural ester. The good performance of transformer insulation paper in natural ester can be explained by the chemical structure analysis using FTIR and EDS. The strengthening of the intensity of peak absorbance of the C–O functional group at wavenumber 1159 cm−1 of the aged transformer insulation paper give evidence that the moisture within the transformer insulation paper tends to remain in the natural ester and this causes the paper to become drier. This peak confirms that transesterification process of transformer insulation paper in natural ester as insulating liquid may make the estimated lifetime of transformers longer than using mineral oil as insulating liquid. There is a correlation between the intensity of the absorbance of the peaks of C–H and C=O functional group and the weight percent of the C element with the average number of chain scission of transformer insulation paper. There is also a correlation between DP with the intensity of the absorbance of O–H functional group peaks at wavenumbers of 3325 cm−1 and 3273 cm−1 and the weight percent of the O element of transformer insulation paper. The experimental results using FTIR and EDS show a good correlation between the chemical structure and DP. These results give initial information about the feasibility of using spectroscopy techniques to identify and quantify the DP value. Further, EDS can be more suitable to be used as a testing method to predict DP through the weight percent of the element O.

Acknowledgments

This research was carried out with financial support of the Ministry of Research, Technology and Higher Education of Indonesia (KEMENRISTEKDIKTI).

Author Contributions

The authors contributed collectively to the experimental setup, testing and measurement, data analysis and manuscript preparation.

Conflicts of Interest

The authors declare no conflict of interest.

References

  1. Rajab, A.; Sulaeman, A.; Sudirham, S.; Suwarno. A Comparison of Dielectric Properties of Palm Oil with Mineral and Synthetic Type Insulating Liquid under Temperature Variation. ITB J. Eng. Sci. 2011, 43, 191–208. [Google Scholar] [CrossRef]
  2. Jeong, J.-I.; An, J.-S.; Huh, C.-S. Accelerated aging effects of mineral and vegetable transformer oils on medium voltage power transformers. IEEE Trans. Dielectr. Electr. Insul. 2012, 19, 156–161. [Google Scholar] [CrossRef]
  3. Bandara, K.; Ekanayake, C.; Saha, T.K.; Annamalai, P.K. Understanding the aging aspects of natural ester based insulation liquid in power transformer. IEEE Trans. Dielectr. Electr. Insul. 2016, 23, 246–257. [Google Scholar] [CrossRef]
  4. Oommen, T.V. Vegetable oils for liquid-filled transformers. IEEE Electr. Insul. Mag. 2002, 18, 6–11. [Google Scholar] [CrossRef]
  5. Oommen, T.V.; Claiborne, C.C.; Mullen, J.T. Biodegradable electrical insulation fluids. In Proceedings of the IEEE Electrical Insulation Conference and Electrical Manufacturing and Coil Winding Conference, Rosemont, IL, USA, 25–25 September 1997. [Google Scholar]
  6. Beroual, A.; Khaled, U.; Noah, P.S.M.; Sitorus, M. Comparative Study of Breakdown Voltage of Mineral, Synthetic and Natural Oils and Based Mineral Oil Mixtures under AC and DC Voltages. Energies 2017, 10, 511. [Google Scholar] [CrossRef]
  7. Frimpong, G.K.; Oommen, T.V.; Asano, R. A survey of ageing characteristics of cellulose insulation in natural ester and mineral oil. IEEE Electr. Insul. Mag. 2011, 27, 36–48. [Google Scholar] [CrossRef]
  8. Yang, L.; Liao, R.; Caixin, S.; Zhu, M. Influence of vegetable oil on the thermal aging of transformer paper and its mechanism. IEEE Trans. Dielectr. Electr. Insul. 2011, 18, 692–700. [Google Scholar] [CrossRef]
  9. Liao, R.; Hao, J.; Chen, G.; Ma, Z.; Yang, L. A Comparative Study of physicochemical, dielectric and thermal properties of pressboard insulation impregnated with natural ester and mineral oil. IEEE Trans. Dielectr. Electr. Insul. 2011, 18, 1626–1637. [Google Scholar] [CrossRef]
  10. Garcia, B.; Garcia, T.; Primo, V.; Burgos, J.C.; Urquiza, D. Studying the loss of life of natural-ester-filled transformer insulation: Impact of moisture on the aging rate of paper. IEEE Electr. Insul. Mag. 2017, 33, 15–23. [Google Scholar] [CrossRef]
  11. Abdelmalik, A.A. Analysis of thermally aged insulation paper in a natural ester-based dielectric fluid. IEEE Trans. Dielectr. Electr. Insul. 2015, 22, 2408–2414. [Google Scholar] [CrossRef]
  12. Ciuriuc, A.; Dumitran, L.M.; Notingher, P.V.; Badicu, L.V.; Setnescu, R.; Setnescu, R. Lifetime estimation of vegetable and mineral oil impregnated paper for power transformers’. In Proceedings of the 2016 IEEE International Conference on Dielectrics (ICD), Montpellier, France, 3–7 July 2016. [Google Scholar]
  13. McShane, C.; Rapp, K.; Corkran, J.; Gauger, G.; Luksich, J. Aging of Kraft Paper in natural ester dielectric fluid. In Proceedings of the 2002 IEEE 14th International Conference on Dielectric Liquids (ICDL), Graz, Austria, 7 November 2002. [Google Scholar]
  14. Bandara, K.; Ekanayake, C.; Saha, T.; Ma, H. Performance of Natural Ester as a Transformer Oil in Moisture-Rich Environments. Energies 2016, 9, 258. [Google Scholar] [CrossRef]
  15. Suwarno; Widyanugraha, T.; Didit, P.; Suharto. Dielectric properties of silicone oil, natural Ester, and mineral oil under accelerated thermal aging. In Proceedings of the 2012 IEEE International Conference on Condition Monitoring and Diagnosis, Bali, Indonesia, 23–27 September 2012. [Google Scholar]
  16. Widyanugraha, T.; Rachmad, R.; Wendhy; Suwarno. DGA and tensile strength test on accelerated thermal aging of ester oil and kraft paper. In Proceedings of the 2015 International Conference on Electrical Engineering and Informatics (ICEEI), Bali, Indonesia, 10–11 August 2015. [Google Scholar]
  17. Cui, H.; Abu-Siada, A.; Li, S.; Islam, S. Correlation between dissolved gases and oil spectral response. In Proceedings of the 1st International Conference on Electrical Materials and Power Equipment (ICEMPE), Xi’an, China, 14–17 May 2017. [Google Scholar]
  18. Baka, N.; Abu-Siada, A.; Islam, S.; El-Naggar, M. A new technique to measure interfacial tension of transformer oil using UV-Vis spectroscopy. IEEE Trans. Dielectr. Electr. Insul. 2015, 22, 1275–1282. [Google Scholar] [CrossRef]
  19. Das, N.; Abu-Siada, A.; Islam, S. New approach to estimate furan contents in transformer oil using spectroscopic analysis. In Proceedings of the 2012 22nd Australasian Universities Power Engineering Conference (AUPEC), Bali, Indonesia, 26–29 September 2012. [Google Scholar]
  20. N’cho, J.S.; Fofana, I.; Hadjadj, Y.; Beroual, A. Review of Physicochemical-Based Diagnostic Techniques for Assessing Insulation Condition in Aged Transformers. Energies 2016, 9, 367. [Google Scholar] [CrossRef]
  21. Sun, P.; Sima, W.; Yang, M.; Wu, J. Influence of Thermal Aging on the Breakdown Characteristic of Transformer Oil Impregnated Paper. IEEE Trans. Dielectr. Electr. Insul. 2016, 23, 3373–3381. [Google Scholar] [CrossRef]
  22. IEEE Std. C57.91-2011 IEEE Guide for Loading Mineral-Oil-Immersed Transformers and Step-Voltage Regulators; IEEE: New York, NY, USA, 2012. [Google Scholar]
  23. IEEE Std. C57.12.00-2015. IEEE Standard for General Requirements for Liquid-Immersed Distribution, Power, and Regulating Transformers; IEEE: New York, NY, USA, 2015. [Google Scholar]
  24. Gorgan, B.; Notingher, P.V.; Wetzer, J.M.; Verhaart, H.F.A.; Wouters, P.A.A.F.; Schijndel, A.V.; Tanasescu, G. Calculation of the remaining life of power transformers paper insulation. In Proceedings of the 2012 13th International Conference on Optimization of Electrical and Electronic Equipment (OPTIM), Brasov, Romania, 5 July 2012. [Google Scholar]
  25. Emsley, A.M.; Stevens, G.C. Review of chemical indicators of degradation of cellulosic electrical paper insulation in oil-filled transformers. IEE Proc.-Sci. Meas. Technol. 1994, 141, 324–334. [Google Scholar] [CrossRef]
  26. Liao, R.; Liang, S.; Sun, C.; Yang, L.; Sun, H. A comparative study of thermal aging of transformer insulation paper impregnated in natural ester and in mineral oil. Eur. Trans. Electr. Power 2010, 20, 518–533. [Google Scholar] [CrossRef]
  27. Emsley, A.M.; Stevens, G.C. Kinetics and mechanisms of the low temperature degradation of cellulose. J. Cell. 1994, 1, 26–56. [Google Scholar] [CrossRef]
  28. Verma, P.; Chauhan, D.; Singh, P. Effects on tensile strength of transformer insulation paper under accelerated thermal and electrical stress. In Proceedings of the 2007 Annual Report Conference on Electrical Insulation and Dielectric Phenomena (CEIDP), Vancouver, BC, Canada, 14–17 October 2007. [Google Scholar]
  29. Han, S.; Li, Q.; Li, C.; Yan, J. Electrical and mechanical properties of the oil-paper insulation under stress of the hot spot temperature. IEEE Trans. Dielectr. Electr. Insul. 2014, 21, 179–185. [Google Scholar] [CrossRef]
  30. Rapp, K.J.; McShane, C.P.; Luksich, J. Interaction mechanisms of natural ester dielectric fluid and Kraft paper. In Proceedings of the 2005 IEEE International Conference on Dielectric Liquids (ICDL), Coimbra, Portugal, 26 June–1 July 2005. [Google Scholar]
  31. Wilhelm, H.M.; Tulio, L.; Jalsinski, R.; Almeida, G. Aging Markers for In-service Natural Ester-Based Insulating Fluids. IEEE Trans. Dielectr. Electr. Insul. 2011, 18, 714–719. [Google Scholar] [CrossRef]
  32. Lundgaard, L.E.; Hansen, W.; Ingebrigsten, S. Aging of Mineral Oil Impregnated Cellulose by Acid Catalysis. IEEE Trans. Dielectr. Electr. Insul. 2008, 15, 540–546. [Google Scholar] [CrossRef]
  33. Hinterstoisser, B.; Åkerholm, M.; Salmén, L. Effect of fiber orientation in dynamic FTIR study on native cellulose. Elsevier J. Carbohydr. Res. 2001, 334, 27–37. [Google Scholar] [CrossRef]
  34. Serban, M.; Helerea, E.; Munteanu, A. The Water Impact on the Aging of Power Transformer Oil. In Proceedings of the 2014 International Conference on Applied and Theoretical Electricity (ICATE), Craiova, Romania, 23–25 October 2014. [Google Scholar]
  35. Suwarno; Pasaribu, R.A. Thermal Aging of Mineral-Oil Paper Composite Insulation for High Voltage Transformer. Int. J. Electr. Eng. Inform. ITB 2016, 8, 820–835. [Google Scholar] [CrossRef]
  36. Stojilovic, N. Why Can’t We See Hydrogen in X-ray Photoelectron Spectroscopy? J. Chem. Educ. 2012, 89, 1331–1332. [Google Scholar] [CrossRef]
Figure 1. (a) ALPHA FTIR Spectrometer; (b) Hitachi SU 3500 and EDAX.
Energies 10 01857 g001
Figure 2. Measured DP of paper samples.
Energies 10 01857 g002
Figure 3. Measured TS of paper samples.
Energies 10 01857 g003
Figure 4. Correlation between DP and TS of paper samples at aging temperature (a) 120 °C and (b) 150 °C.
Energies 10 01857 g004
Figure 5. FTIR Spectra of transformer insulation paper for at aging temperature 120 °C and 150 °C for 1008 h.
Energies 10 01857 g005
Figure 6. Hydrolysis reaction of natural ester.
Energies 10 01857 g006
Figure 7. Transesterification process of transformer insulation paper.
Energies 10 01857 g007
Figure 8. FTIR spectra at wavenumber 3000–2700 cm−1 of transformer insulation paper at aging temperature (a) 120 °C and (b) 150 °C.
Energies 10 01857 g008
Figure 9. Correlation between average number of chain scission of transformer insulation paper and intensity of peaks absorbance of C–H functional group at aging temperature (a) 120 °C (2922 cm−1); (b) 150 °C (2922 cm−1); (c) 120 °C (2854 cm−1); (d) 150 °C (2854 cm−1).
Energies 10 01857 g009
Figure 10. FTIR spectra at wavenumber 1800–1700 cm−1 of transformer insulation paper at aging temperature (a) 120 °C and (b) 150 °C.
Energies 10 01857 g010
Figure 11. FTIR spectra at wavenumber 1500–900 cm−1 of transformer insulation paper at aging temperature (a) 120 °C and (b) 150 °C.
Energies 10 01857 g011
Figure 12. Correlation between average number of chain scission of transformer insulation paper and intensity of peaks absorbance of C=O functional group (1743 cm−1) at aging temperature (a) 120 °C; (b) 150 °C.
Energies 10 01857 g012
Figure 13. FTIR spectra at wavenumber 3700–3000 cm−1 of transformer insulation paper at aging temperature (a) 120 °C and (b) 150 °C.
Energies 10 01857 g013
Figure 14. Correlation between average number of chain scission of transformer insulation paper and intensity of peaks absorbance of O–H functional group at aging temperature (a) 120 °C (3325 cm−1); (b) 150 °C (3325 cm−1); (c) 120 °C (3273 cm−1); (d) 150 °C (3273 cm−1).
Energies 10 01857 g014
Figure 15. Weight percent of C and O elements of transformer insulation paper at aging temperature (a) 120 °C and (b) 150 °C.
Energies 10 01857 g015
Figure 16. Correlation between average number of chain scission of transformer insulation paper and weight percent of C element (a) 120 °C; (b) 150 °C and Correlation between DP of transformer insulation paper and weight percent of O element; (c) 120 °C; (d) 150 °C.
Energies 10 01857 g016
Table 1. Samples and treatment.
SampleAging
T0New
T1.120120 °C for 336 h
T2.120120 °C for 672 h
T3.120120 °C for 1008 h
T1.150150 °C for 336 h
T2.150150 °C for 672 h
T3.150150 °C for 1008 h
Table 2. Visual appearances of paper surface.
TemperatureAging Time (h)
03366721008
120 °C Energies 10 01857 i001 Energies 10 01857 i002 Energies 10 01857 i003 Energies 10 01857 i004
150 °C Energies 10 01857 i005 Energies 10 01857 i006 Energies 10 01857 i007 Energies 10 01857 i008
Table 3. Intensity of peak absorbance of functional groups of paper samples at temperature 120 °C.
Wavenumber (cm−1)Functional GroupNewT1.120T2.120T3.120
1159C–O0.085850.117750.099830.10341
1743C=O0.013720.063360.072680.10618
2854C–H0.026160.055630.06620.09905
2922C–H0.025160.066460.085670.1248
3273O–H0.083770.079060.073580.06933
3325O–H0.083050.081250.076170.07111
Table 4. Intensity of peak absorbance of functional groups of paper samples at temperature 150 °C.
Wavenumber (cm−1)Functional GroupNewT1.150T2.150T3.150
1159C–O0.085850.125550.116690.10868
1743C=O0.013720.049430.064930.08902
2854C–H0.026160.051310.058690.08909
2922C–H0.025160.061430.074050.11136
3273O–H0.083770.077640.074070.06387
3325O–H0.083050.079470.076030.06532
Table 5. Correlation between average number of chain scission and functional group/chemical element of transformer insulation paper.
SampleFunctional Group/Chemical ElementTesting MethodR2
120C–H (2922 cm−1)FTIR0.9763
1500.8104
120C–H (2854 cm−1)FTIR0.9839
1500.8534
120C=O (1743 cm−1)FTIR0.932
1500.9317
120Weight Percent CEDS0.9134
1500.9971
Table 6. Correlation between DP and functional group/chemical element of transformer insulation paper.
SampleFunctional Group/Chemical ElementTesting MethodR2
120O–H (3325 cm−1)FTIR0.9362
1500.5561
120O–H (3273 cm−1)FTIR0.8083
1500.425
120Weight Percent OEDS0.9964
1500.9814

