The Behaviour of Small Investors in the Hong Kong Derivatives Markets: A Factor Analysis

Department of Economics and Finance, Hong Kong Shue Yan University
J. Risk Financial Manag. 2012, 5(1), 59-77; https://doi.org/10.3390/jrfm5010059
Published: 31 December 2012
Abstract
:This paper investigates the behaviour of small investors in Hong Kong’s derivatives markets. The study period covers the global economic crisis of 2011- 2012, and we focus on small investors’ behaviour during and after the crisis. We attempt to identify and analyse the key factors that capture their behaviour in derivatives markets in Hong Kong. The data were collected from 524 respondents via a questionnaire survey. Exploratory factor analysis was employed to analyse the data, and some interesting findings were obtained. Our study enhances our understanding of behavioural finance in the setting of an Asian financial centre, namely Hong Kong.
Introduction
The global economic crisis has generated tremendous impacts on financial markets and affected many small investors throughout the world. In particular, these investors feared that some European countries, including the PIIGS countries (i.e., Portugal, Ireland, Italy, Greece, and Spain), would encounter great difficulty in meeting their financial obligations and repaying their sovereign debts, and some even believed that these countries would default on their debts either partially or completely. In response to the crisis, they are likely to change their investment behaviour.
Hong Kong is a small open economy. Such grand-scale macro-economic uncertainty and grave financial risk negatively influenced most if not all small investors’ confidence in the financial markets. It is common to find that some small investors have done less rational things in the financial markets, especially when investing in financial derivatives. In the present study, we attempt to identify and analyse the important factors that capture the behaviour of small investors in derivatives markets in Hong Kong in the face of the recent financial crisis. It is important to find out whether their investment behaviour can be explained by some underlying factors grounded in the behavioural approach to the study of financial markets. We collected our data from 524 respondents via a survey questionnaire. Exploratory factor analysis was employed to analyse the data. In doing this, we hope to contribute to the study of behavioural finance in the context of an Asian financial centre, namely Hong Kong.
Study Background
A survey conducted by the Hong Kong Exchanges and Clearing Limited (HKEx) in 2011 indicated that in the year of 2010/11, market turnover increased by 27% from the previous year, to 127 million contracts [1]. In 2006, HKEx reported that the typical Hong Kong retail derivatives investor was a 42-year-old white-collar worker, with tertiary education or above, a monthly personal income of $22,500, and a monthly household income of about $45,000. Compared with stock investors, derivatives investors comprise a larger proportion of males and individuals with a higher education level, higher work status, higher personal income, and higher household income [2]. Tsoi (2004) suggested that stock investors who also invest in derivatives (i.e., stock-and-derivatives investors) tend to be more active stock traders, in both bullish and bearish times [3]. According to Tsoi (2002), derivatives investors tend to be younger and have a higher income than stock investors [4]. Park and Park (2003) pointed out that the activity of small investors keeps on growing because (1) the leverage from purchasing financial derivatives leads to a low requirement on capital base, and (2) the extremely high relative to the return from some other kind of investment.
These derivatives allow investors and institutions to hedge risks, including interest rate risk and exchange rate risk. At the same time, investors and institutions can make use of derivatives to make speculations based on the price movement of the underlying assets. In addition, the low entrance fees of some derivatives allow some small investors who may not have enough money to invest in the stock market to invest in the derivatives market. As a result, an increasing number of small investors in Hong Kong have invested in derivatives [5].
Literature Review
Although many personal and situational factors may influence the behaviour of small investors in the derivatives markets, research on this topic is sparse. Previous studies found that interpersonal influence (Hoffmann and Broekhuizen, 2009) [6], knowledge (Wang, 2009) [7], and some other personal factors such as gender and personality traits (Durand et al., 2008) are crucial in explaining investment behaviour [8]. However, it is important to explore the psychological processes (such as perception, attitudes, learning, and motivation) that affect an individual’s decisions regarding investment. For example, an investor’s gender and educational level (i.e., individual factors) may affect his or her knowledge and orientation in investment, which then influences the risk perception, and finally his or her investment behaviour. Graham et al. (2009) noted that male investors, and investors with larger portfolios or more education, are more likely to perceive themselves as competent than are female investors and investors with smaller portfolios or less education [9]. Hoffmann and Post (2012) found that past returns positively impact investors’ return expectations and risk tolerance, and negatively impact their risk perception [10]. Moreover, Korniotis and Kumar (2011) suggested that older people make better investment choices as they gain more investment knowledge and experience, and questioned whether deterioration of their investment skill with age was largely due to the adverse effects of cognitive ageing. [11].
Obviously, the notion of risk tolerance is highly important for investors’ asset allocations. The determinants of risk tolerance are central to the study of behavioural finance. Portfolio theory postulates that risk tolerance is a salient factor in portfolio construction and asset allocation. Risk tolerance, reflecting a person’s attitude towards taking on risk, is a complex psychological concept. Jackson et al. (1972) contended that risk tolerance has four dimensions: financial, physical, social, and ethical [12]. Hoffmann et al. (2011) showed how an investor’s perceptions changed, drove trading and risk-taking behaviour, and impacted investment performance during the financial crisis of 2007-2009. They noted that revisions in return expectations and risk tolerance are positively related to overall market developments, and revisions in risk perceptions are negatively related to overall market developments. Successful investors had higher return expectations and lower risk tolerance, which led them to trade less, take fewer risks, and have lower buy-sell ratios [13]. Vlaev et al. (2009) suggested that salary or job uncertainty can be sufficient to influence the risk tolerance and risk-taking propensity of Hong Kong small derivatives investors [14]. Hallahan et al. (2004) found that people’s self-assessed risk tolerance and ProQuest risk tolerance score (RTS) generally accord, and there is considerable variation, with a tendency for respondents to underestimate their risk tolerance [15]. Wang and Hanna (1997) showed that risk tolerance increases with age when other variables have been controlled [16].
Behavioural finance can help practitioners to recognize and avoid bias and error in their decisions, as well as to modify and improve their overall investment strategies (Shefrin, 2000) [17]. Tversky and Kahneman (1974) defined availability as the situation in which people assess the frequency or probability of an event by the ease with which instances can be brought to mind [18]. Generally speaking, availability is the degree to which information is readily available. Availability bias exists when the investors wrongly weight the importance of information or rely upon available information for decision making without examining the alternatives (Sewell, 2010) [19]. Singh (2012) pointed out that individual investors can benefit from increasing awareness of the various human biases and the high costs they impose on their portfolio [20]. Law (2010) argued that traditional risk disclosure requirements, known as financial risk disclosure, cannot sufficiently protect retail investors from cognitive and psychological biases [21]. Wang et al. (2011) examined whether Hong Kong small derivatives investors have familiarity bias or not [22]. Kannadhasan (2006) reported that an optimum investment plays an active role and is a significant consideration. There is suggestive evidence that the experience of the investor has an explanatory role in this regard, with less experienced investors being prone to extrapolation (i.e., representativeness), while more experienced investors are susceptible to the gambler’s fallacy, which is the misconception of chance [23]. Tversky and Kahneman (1971) defined the gambler’s fallacy as a misconception of the fairness of the law of chance. Under the gambler’s fallacy, people apply the outcomes of small samples to large samples. [24].
Methodology
Factor analysis is employed to identify the key factors that affect the behaviour of small investors in derivatives markets in Hong Kong. In the factor analysis, a standard score on a data item can be expressed as a weighted sum of the common factor scores, the specific factor scores, and the error factor scores. That is,
where
is a standard score for small investor k on data item i,
is a factor loading for data item i on common factor 1,
is a factor loading for data item i on common factor 2,
is a factor loading for data item i on the last common factor,
is a factor loading for data item i on specific factor i,
is a factor loading for data item i on error factor i,
is a standard score for small investor k on common factor 1,
is a standard score for small investor k on common factor 2,
is a standard score for small investor k on common factor m, the last common factor,
is a standard score for small investor k on specific factor i,
is a standard score for small investor k on error factor i.
Equation (1) may be represented in schematic matrix form for all values of i and k simultaneously, that is, for all data items and all small investors or other data-producing objects. The schematic matrix equation could be represented by the following matrix equation:
Equation (2) states that the matrix of data-item scores Z may be obtained by multiplying the matrix of factor loading
by the matrix of factor scores
The common factor portion of
will be called matrix A (without the subscript u), and the common factor portion of
will be called matrix F. This makes the factor structure more interpretable. The initial extracted factor matrix must be rotated before the final factor solution is achieved. A factor matrix may be transformed to a rotated factor matrix by the matrix operation V = AΛ, where V is the rotated matrix, A is the unrotated matrix, and Λ is an orthogonal transformation matrix in which rows and columns have sums of squares equal to 1.0 and inner products of non-identical rows or columns equal to zero. Such a transformation does not affect the capacity of the factor matrix to reproduce the original correlation matrix because
VV’ = (AΛ) (AΛ)’ = AΛΛ’A’ = AIA’ = A A’ = R
In other words, the transformed or rotated matrix V when multiplied by its transpose V’ will reproduce the R matrix just as well as A multiplied by its transpose A’ does. These rotations are carried out using “positive manifold” and “simple structure,” rotational criteria that have been traditional guides in carrying out the rotation process in factor analysis. Trying to rotate to obtain non-negative loadings is known as rotating to “positive manifold”. The idea behind positive manifold is that if the entire set of data items in a matrix have inter-correlations that are either zero or positive, it is unreasonable to anticipate an underlying factor with substantial negative loadings for any of the data items. Thurstone (1947) developed the criterion of “simple structure” to guide the investigator in carrying out rotations of factor axes to positions of greater “psychological meaningfulness” [25]. Bartlett’s test of sphericity and Kaiser-Meyer-Olkin’s measure of sampling adequacy are both tests that can be used to determine the factorability of the matrix as a whole. If Bartlett’s test of sphericity is large and significant and the Kaiser-Meyer-Olkin measure is greater than 0.6, then factorability is assumed. If the sums of squares of the loadings on the extracted factors are no longer dropping but are remaining at a low and rather uniform level, factor extraction may be reasonably terminated. Cattell’s (1966) Scree test is based on this principle. SPSS use a default option of extracting all principal factors with eigenvalues of 1.0 or more (i.e., the Kaiser-Guttman rule). The main thing to consider in deciding when to stop factoring is that it is better to err on the side of extracting too many factors rather than too few [26]. One of the most commonly used is Cronbach’s coefficient α, which is based on the average correlation of items within a reliability test if the items are standardised. Cronbach’s coefficient α can be interpreted as a correlation coefficient; it ranges in value from 0 to 1.
Data
The data for the present study were collected from small investors in Hong Kong via a questionnaire survey. Its main purpose was to collect data on the opinions, investment behaviour, and financial decision making of the respondents in the local derivatives market. The survey was conducted during January and March 2012. Since the majority of Hong Kong’s population is Chinese, the questionnaire was written in Chinese. After a pilot test on nineteen respondents, some amendments (such as the rewording of some questions to eliminate ambiguities) were made before we finalized the questionnaire. Since some respondents did not reply to all the questions in the questionnaire, we only used the number of replies (i.e., the questions that respondents did not answer were excluded) to calculate the total number of and the percentage of the total for the individual entries.
We selected the respondents using non-probability sampling. A group of undergraduate students helped to distribute the questionnaires to the respondents. The target population was the small investors in derivatives markets in Hong Kong. In the end, there were 524 selected respondents who completed and returned the survey. The respondents were requested to provide an estimated percentage breakdown of their average return on investment in derivative products during the study period. Our data set fulfilled the following conditions: (1) A minimum of five subjects per item is required for factor analysis. (2) A sample of 100 subjects is acceptable, but sample sizes of over 200 are preferable.
Results
The basic information about the respondents is depicted in Table 1. The majority of the respondents were in the age group of 18-34. More than half of these respondents had less than three years of experience of investing in a financial market. About one-third of them had an average return of less than 10% and another one-third of them had an average return of 10-30%. Most of these respondents reported that they had a medium or high level of tolerance for investment risk. A high percentage of them expressed the opinion that the risk level in investing in financial derivation is high or very high. The respondents also reported that they obtained the information and opinions that affect their investment decisions from various sources.

| Items and responses | No. | % of Total |
|---|---|---|
| 1. Age group: | ||
| 18 – 24 years old | 172 | 33.0 |
| 25 – 34 years old | 156 | 29.8 |
| 35 – 44 years old | 76 | 14.5 |
| 45 – 54 years old | 79 | 15.3 |
| 55 – 64 years old | 34 | 6.5 |
| over 65 years old | 5 | 1.0 |
| 2. Average monthly income: | ||
| Below HK$5,000 | 110 | 21.1 |
| HK$5,000 -HK$9,999 | 71 | 13.6 |
| HK$10,000 - HK$14,999 | 88 | 16.9 |
| HK$15,000 - HK$19,999 | 94 | 18.0 |
| HK$20,000 - HK$24,999 | 77 | 14.8 |
| HK$25,000 - HK$29,999 | 32 | 6.1 |
| HK$30,000 - HK$49,999 | 38 | 7.3 |
| HK$50,000 or above | 12 | 2.3 |
| 3. How long have you invested in the financial market? | ||
| Never invested | 43 | 8.2 |
| Less than 1 year | 95 | 18.1 |
| 1 year to under 3 years | 178 | 34.0 |
| 3 years to under 5 years | 92 | 17.6 |
| 5 years to under 10 years | 71 | 13.5 |
| 10 years or above | 45 | 8.6 |
| 4. What is your average return on investment in derivative products? | ||
| Loss | 76 | 18.2 |
| Average Return less than 10% | 143 | 34.2 |
| Average Return 10% to under 30% | 137 | 32.8 |
| Average Return 30% to under 50% | 48 | 11.5 |
| Average Return 50% to under 100% | 12 | 2.9 |
| Average Return 100% or above | 2 | 0.5 |
| 5. During January 2011 to January 2012, were you satisfied with the average returns of your financial derivatives investment? | ||
| Very satisfied | 9 | 2.2 |
| Satisfied | 127 | 30.4 |
| Neutral | 157 | 37.6 |
| Dissatisfied | 89 | 21.3 |
| Very dissatisfied | 36 | 8.6 |
| 6. What is your personal level of tolerance for investment risk? | ||
| Very Low | 9 | 2.2 |
| Low | 62 | 14.8 |
| Medium | 171 | 40.9 |
| High | 152 | 36.4 |
| Very High | 24 | 5.7 |
| 7. As a percentage of the total amount in your investment portfolio, how much do you invest in derivative products: | ||
| Less than 10% | 92 | 22.0 |
| 10% to under 30% | 192 | 45.9 |
| 30% to under 50% | 91 | 21.8 |
| 50% to under 100% | 31 | 7.4 |
| 100% | 12 | 2.9 |
| 8. What do you think is the risk level in investing in financial derivatives? | ||
| Very Low Risk | 2 | 0.4 |
| Low Risk | 18 | 3.4 |
| Medium Risk | 125 | 23.9 |
| High Risk | 281 | 53.7 |
| Very High Risk | 97 | 18.5 |
| 9. When did you mostly sell or close out your position when you invested in financial derivatives between January 2011 and January 2012? | ||
| Within one day | 14 | 3.4 |
| Within one week | 120 | 28.6 |
| Within one month | 170 | 40.8 |
| Within three months | 82 | 19.7 |
| Within one year | 28 | 6.7 |
| After more than one year | 3 | 0.7 |
| 10. Do you think the small investor education provided by the related government department is adequate? | ||
| Very Inadequate | 72 | 13.8 |
| Inadequate | 233 | 44.6 |
| No Opinion | 165 | 31.5 |
| Adequate | 48 | 9.2 |
| Very Adequate | 5 | 1.0 |
| 11. Which type of information and opinion will most affect your decisions in investing in financial derivatives? | ||
| None | 12 | 2.9 |
| Newspapers, TV, magazines, etc. | 108 | 25.8 |
| Relatives and friends | 43 | 10.3 |
| Internet | 158 | 37.8 |
| Investment Consultants | 72 | 17.2 |
| Companies’ Annual Reports | 20 | 4.8 |
| Others | 5 | 1.2 |
Note: percentages do not always add up to 100 due to rounding-up.
| Item | Item name | Mean | Std. Deviation | T | Df | Sig. (two-tailed) |
|---|---|---|---|---|---|---|
| 1 | Age | 2.35 | 1.303 | 41.236 | 521 | 0.000 |
| 2 | Personal Income | 3.51 | 1.947 | 41.167 | 521 | 0.000 |
| 3 | Investment Experience | 3.36 | 1.369 | 56.152 | 523 | 0.000 |
| 4 | Average return | 2.48 | 1.037 | 48.916 | 417 | 0.000 |
| 5 | Satisfaction | 3.04 | 0.974 | 63.793 | 417 | 0.000 |
| 6 | Risk Tolerance | 3.29 | 0.864 | 77.750 | 417 | 0.000 |
| 7 | Investment Portfolio | 2.23 | 0.970 | 47.038 | 417 | 0.000 |
| 8 | Risk Level | 3.87 | 0.761 | 116.120 | 522 | 0.000 |
| 9 | Sell/Close Out Position | 3.00 | 0.977 | 62.661 | 416 | 0.000 |
| 10 | Investor Education | 2.39 | 0.869 | 62.880 | 522 | 0.000 |
| 11 | Information/Opinion | 3.60 | 1.307 | 56.278 | 417 | 0.000 |
| Item | 1 | 2 | 3 | 4 | 5 | 6 | 7 | 8 | 9 | 10 | 11 |
|---|---|---|---|---|---|---|---|---|---|---|---|
| 1 | 1.000 | ||||||||||
| 2 | 0.449** | 1.000 | |||||||||
| 3 | 0.595** | 0.408** | 1.000 | ||||||||
| 4 | 0.007 | 0.200** | 0.109* | 1.000 | |||||||
| 5 | -0.087* | -0.169** | -0.101* | -0.607** | 1.000 | ||||||
| 6 | -0.028 | 0.035 | 0.045 | 0.101* | 0.044 | 1.000 | |||||
| 7 | -0.215** | -0.084* | -0.092* | 0.265** | -0.022 | 0.305** | 1.000 | ||||
| 8 | -0.089* | -0.063 | -0.080 | -0.197** | 0.168** | 0.039 | -0.136** | 1.000 | |||
| 9 | 0.065 | 0.158** | 0.077 | 0.107* | -0.086* | -0.097* | -0.008 | -0.168** | 1.000 | ||
| 10 | 0.094* | 0.044 | 0.126** | 0.137** | -0.161** | 0.093* | 0.151** | 0.171** | 0.146** | 1.000 | |
| 11 | -0.058 | 0.154** | -0.007 | 0.129** | -0.120** | -0.006 | 0.094* | -0.055 | 0132** | 0.071 | 1.000 |
Notes: *Correlation is significant at the 0.05 level (one-tailed) and **Correlation is significant at the 0.01 level (one-tailed)Extraction method: principle component analysis, Rotation method: Varimax with Kaiser Normalization,Kaiser-Meyer-Olkin (KMO) index: 0.612, Bartlett’s test of Sphericity: ρ<0.000.Item name (see also Table 3): 1. Age, 2. Personal Income, 3. Investment Experience, 4. Average Return, 5. Satisfaction, 6. Risk Tolerance,7. Investment Portfolio, 8. Risk Level, 9. Sell/Close Out Position, 10. Investor Education, 11. Information/Opinion
| Item | Item name | Communality | Factor | Eigenvalue | Per cent of variance | Cumulative per cent |
|---|---|---|---|---|---|---|
| 1 | Age | 0.761 | 1 | 2.319 | 21.077 | 21.077 |
| 2 | Personal Income | 0.653 | 2 | 1.812 | 16.470 | 37.547 |
| 3 | Investment Experience | 0.702 | 3 | 1.267 | 11.520 | 49.067 |
| 4 | Average Return | 0.810 | 4 | 1.13 | 10.030 | 59.097 |
| 5 | Satisfaction | 0.811 | 5 | 1.017 | 9.244 | 68.342 |
| 6 | Risk Tolerance | 0.717 | ||||
| 7 | Investment Portfolio | 0.656 | ||||
| 8 | Risk Level | 0.542 | ||||
| 9 | Sell/Close Out Position | 0.583 | ||||
| 10 | Investor Education | 0.501 | ||||
| 11 | Information/Opinion | 0.782 |
The importance of the influence of various items on the behaviour of small investors when they invested in derivatives markets is presented in Table 2. All the items are statistically significant with high mean values.
To identify the underlying dimensions of the items which are perceived to be important by the respondents, the 11 items were then factor analysed. Initial visual assessment of the correlation matrix indicated a considerable degree of inter-factor correlation (see Table 3). In addition, from the correlation matrix, the Bartlett test of Sphericity (ρ < 0.000) and the Kaiser-Meyer-Olkin (KMO) measure of sampling adequacy index (with a value of 0.612) confirmed the appropriateness of the data for exploratory factor analysis.
Given that our aim was to identify the minimum number of factors that would account for the maximum portion of variance of the original items, principal component analysis was selected (Nunnally, 1978) to reduce the number of factors with an eigenvalue greater than 1. A cumulative percentage of variance explained being greater than 50% is the criterion used in determining the number of factors. On the basis of this criterion, five factors were extracted (see Table 4). The five factors, collectively, accounted for a satisfactory 68.342% of the variance. Communality values in between 1.0 and 0 indicate partial overlapping between the items and the factors in what they measure. Furthermore, the communality column provides further evidence of the overall significance, albeit moderate, of the solution.
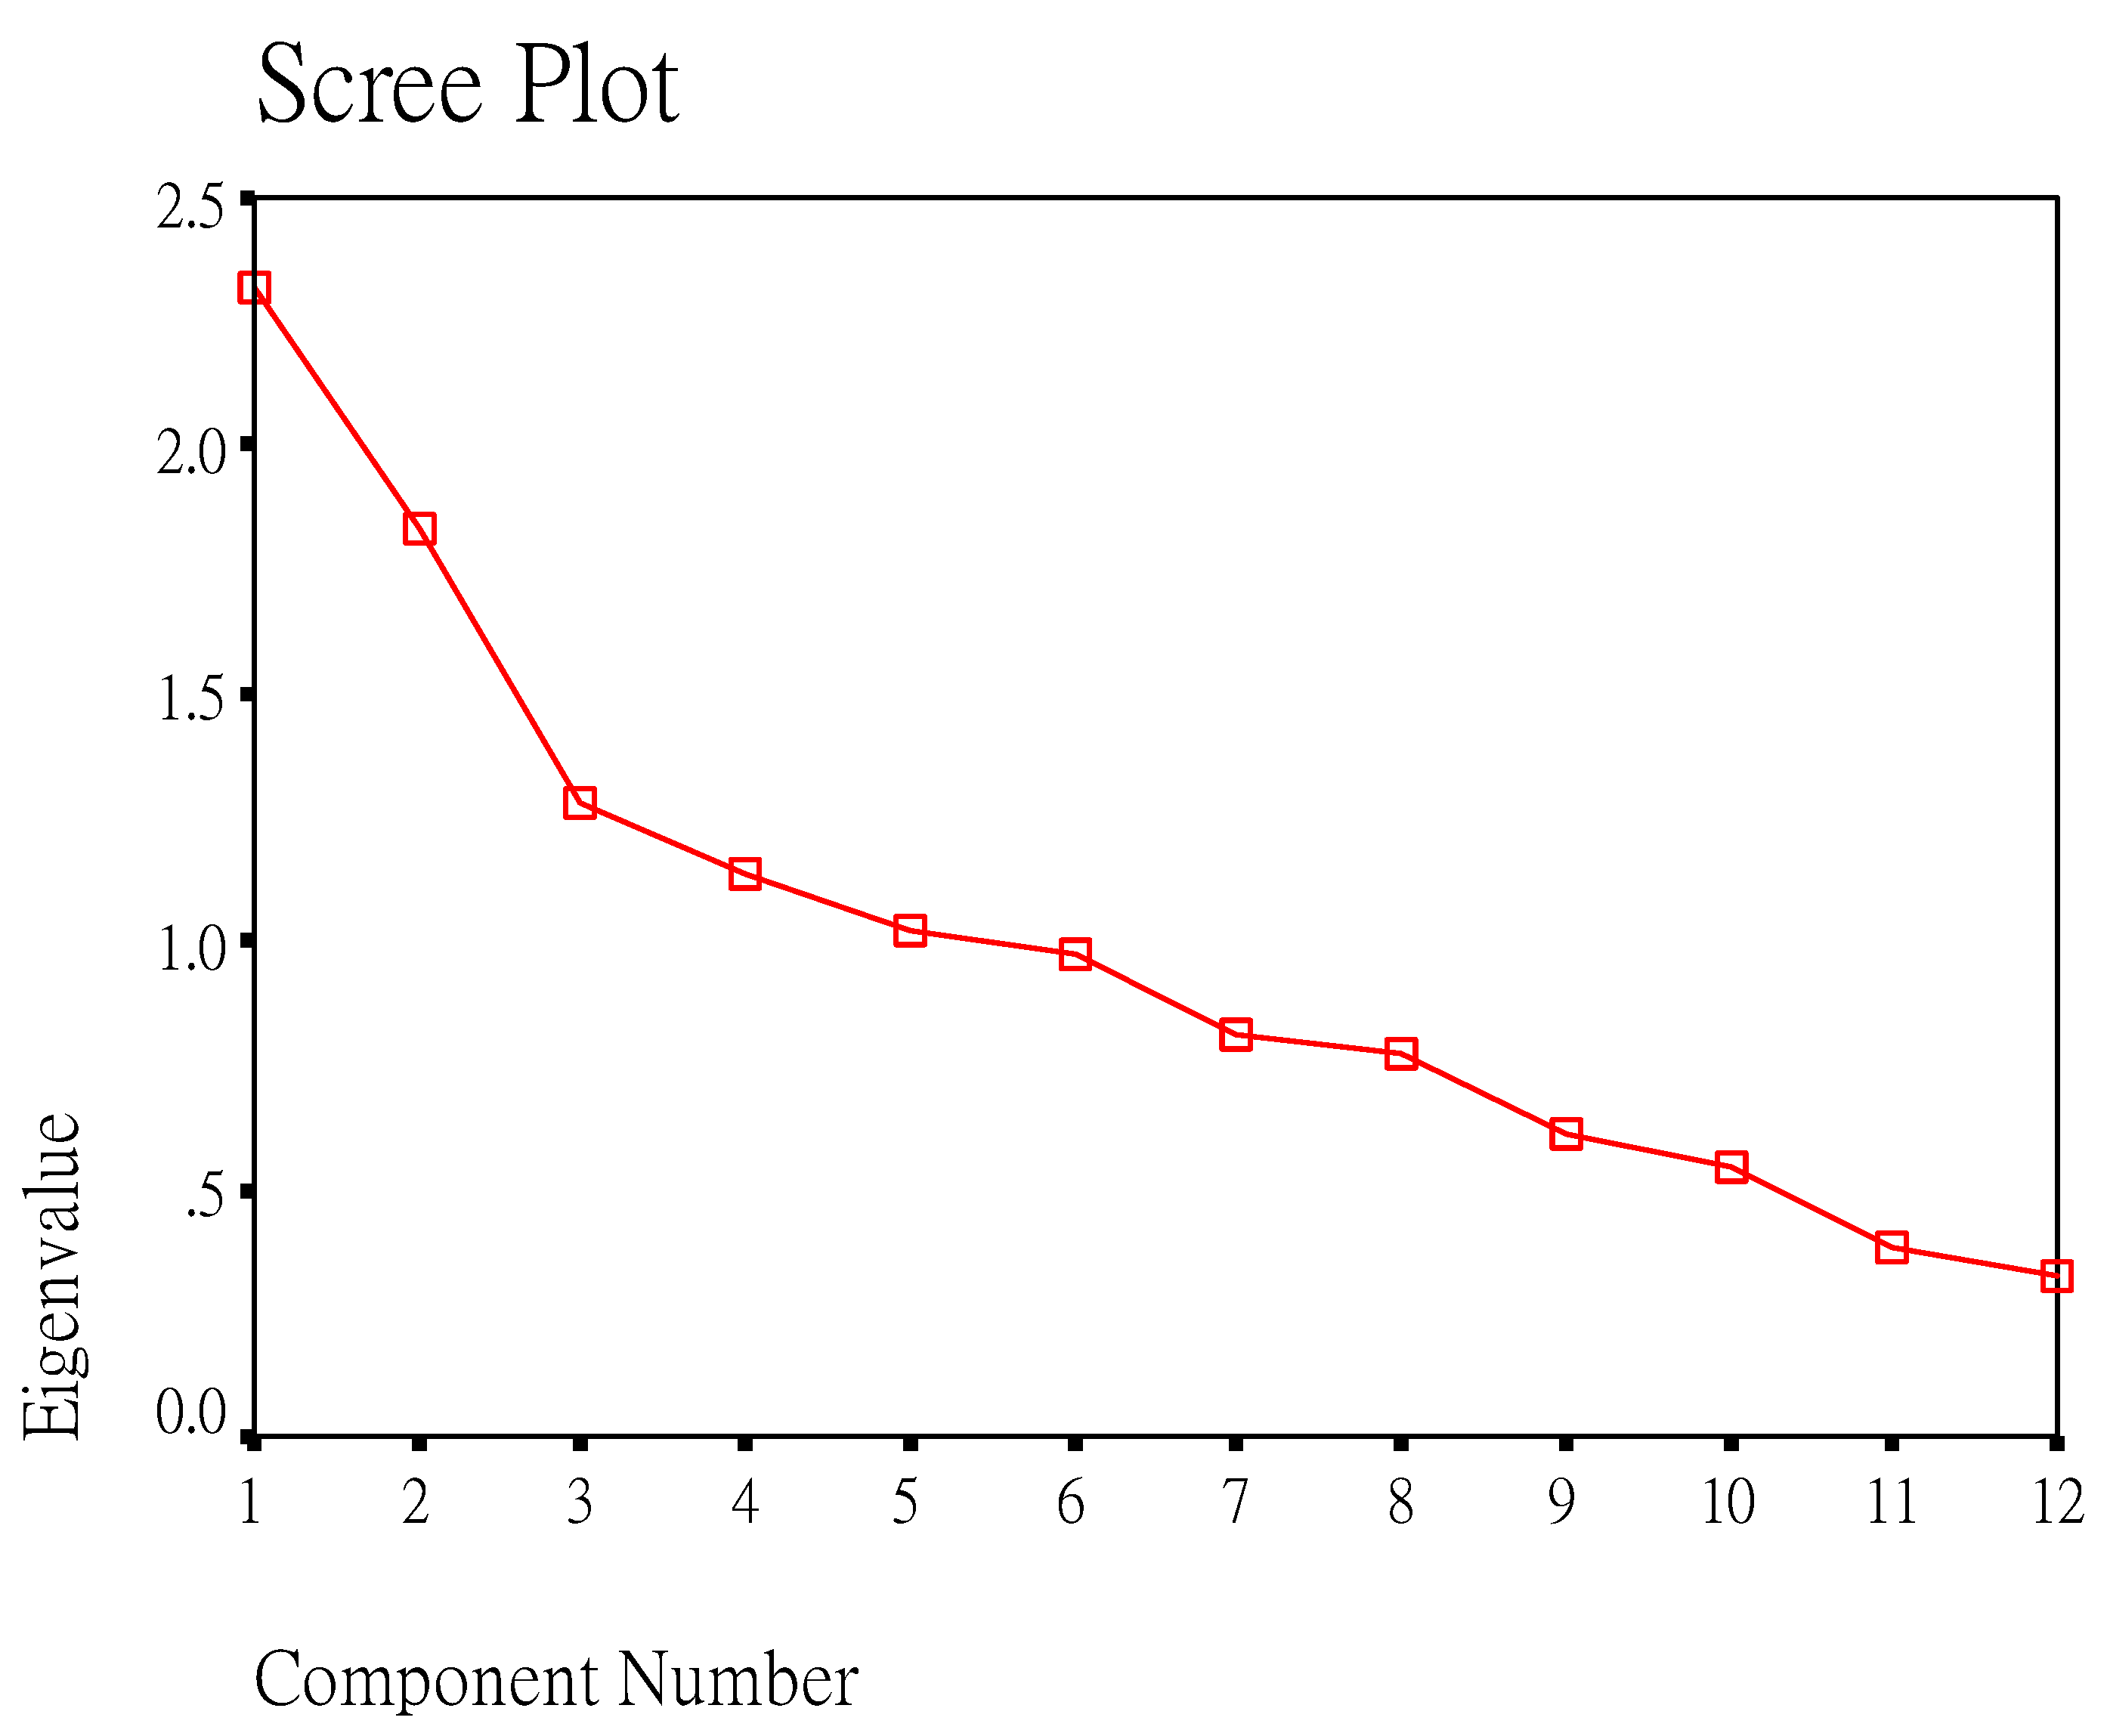
The underlying rationale for the Scree test is based on the fact that within a set of items, a limited number of factors are measured more precisely than the others. By graphing the eigenvalues, we found that the smaller factors form a straight line sloping downward. The dominant factors will fall above the line. Figure 1 demonstrates that a five-factor solution was obtained.
Figure 1.
A scree plot

Having established that the analysis had provided a stable solution, examination of the varimax-rotated factor loading was performed (see Table 5). The cumulative factors revealed that the first factor accounts for 21.07% of the variance. The second factor accounts for 37.547% of the variance. The third factor accounts for 49.067% of the variance. The fourth factor accounts for 59.097% of the variance. Finally, the fifth factor accounts for 68.342% of the variance.
| Factors | |||||||
|---|---|---|---|---|---|---|---|
| Item | I | II | III | IV | V | Item name | Factor |
| 1 | 0.851 | Age | A | ||||
| 2 | 0.713 | Personal Income | A | ||||
| 3 | 0.826 | Investment Experience | A | ||||
| 4 | 0.864 | Average Return | B | ||||
| 5 | -0.885 | Satisfaction | B | ||||
| 6 | 0.833 | Risk Tolerance | C | ||||
| 7 | 0.718 | Investment Portfolio | C | ||||
| 8 | -0.707 | Risk Level | D | ||||
| 9 | 0.540 | Sell/Close out Position | D | ||||
| 10 | 0.655 | Investor Education | D | ||||
| 11 | 0.873 | Information/Opinion | E | ||||
Factor names are A: Personal Background; B: Return Performance; C: Risk Tolerance; D: Cognitive Style; E: Reference Group.
After the rotation, there were no negative loadings of any consequence on either factor I, factor III, or factor V. The rotated factors that represent the meaningful constructs ordinarily should not exhibit these large negative loadings. Thus, we eliminated item 5 in factor II and item 8 in factor IV. Finally, we found five factors affecting the behaviour of small investors in derivatives markets in Hong Kong, as follows: factor A might be interpreted as personal background, which comprises age, personal income, and investment experience; factor B as return performance, which comprises the average income on investment in derivative products; factor C as risk tolerance, which comprises the personal level of tolerance for investment risk and the total amount in the small investor’s portfolio of derivative products; factor D as cognitive style, which comprises investors’ reasoning in regard to when they sell or close their position when they invest in derivatives products, and their perception of the investor education provided by the government; and factor E as reference group, which comprises commentators’ recommendations from newspapers/TV/magazines, relatives/friends, the Internet, investment consultants, and companies’ annual reports. The specific name given to each factor is designed to reflect an item or notion that conceptually relates to the rest of the items under a particular factor.
| Factors and items | Item-total correlation | α value | Decision |
|---|---|---|---|
| Factor A (Personal Background) | |||
| Age | 0.5060 | 0.6662 | Retained |
| Personal Income | 0.4744 | ||
| Investment Experience | 0.5123 | ||
| Factor C (Risk Tolerance) | |||
| Risk Tolerance | 0.3036 | 0.4634 | Eliminated |
| Investment Portfolio | 0.3036 | ||
| Factor D (Cognitive Style) | |||
| Sell/Close out Position | 0.1458 | 0.2527 | Eliminated |
| Investor Education | 0.1458 |
The reliability test is reported in Table 6. At this point only an initial test of the internal reliability of the expected factors was performed, in the form of Cronbach’s coefficient α. For the purposes of this study, the cut-off value adopted was 0.5 (Nunnally, 1978) and the acceptable benchmark level of item-to-total correlation was set above 0.3. Following the decision relating to the internal reliability, the factors were re-specified. This was undertaken to further reduce the number of factors. The internal reliability of the first structure was tested and the decision results provide evidence as to the weakness of the structure since one factor (factor A) exceeded the adopted criteria. It was found that factor A contains three items and relates to “personal background”. Factor C is made up of two items and refers to “risk tolerance”. Finally, factor D comprises two items and deals with “cognitive style”. The derived scales appear to possess moderate to weak internal consistency. So, we eliminated both factors C and D (see Table 7).
| Items | Number of items | Item-total correlation | α value |
|---|---|---|---|
| Factor A (Personal Background) | |||
| Age | 3 | 0.5060 | 0.6662 |
| Personal Income | 0.4744 | ||
| Investment Experience | 0.5123 | ||
| Factor B (Return Performance) | |||
| Average Return | 1 | ||
| Factor E (Reference Group) | |||
| Information/Opinion | 1 |
In examining possible differences in the perceived importance of the five factors, our analyses indicate that out of the four criteria (i.e., rotated principal component loadings, scree test, KMO and Bartlett’s test, and a reliability test) examined, only three factors (personal background, return performance, and reference group) are significant. Based on these results, we can derive the following ascending order of importance:
- Return performance
- Reference group
- Personal background
Conclusion
Using factor analysis, we identified five factors that capture the behaviour of small investors in derivatives markets in Hong Kong. The factors are personal background, reference group, return performance, risk tolerance, and cognitive style.
The factor of personal background comprises age, personal income, and investment experience; the factor of reference group comprises commentators’ recommendations from newspapers/TV/magazines, relatives/friends, the Internet, investment consultants, and companies’ annual reports; the factor of return performance comprises the average income on investment in derivative products; the factor of risk tolerance comprises the personal level of tolerance for investment risk and the total amount in the small investor’s portfolio of derivative products; and the factor of cognitive style comprises investors’ reasoning in regard to when they sell or close their position when they invest in derivatives products, and their perception of the investor education provided by the government.
Accordingly, it can be concluded that the behaviour of small investors in derivatives markets in Hong Kong consistently indicates the ascending order of importance of return performance, reference group, and personal background. Based on these findings, more research should be conducted in the future to examine the behaviour of small investors in other financial markets.
References
- Hong Kong Exchanges and Clearing Limited. “Derivatives Market Transaction Survey 2010/11.” Research & Corporate Development, 2011, pp. 1–26. [Google Scholar]
- Hong Kong Exchanges and Clearing Limited. “Online Trading Becomes More Popular – Findings of Retail Investor Survey 2005.” Research & Planning Department, 2006, pp. 37–42. [Google Scholar]
- E. Tsoi. “Understanding Investors in the Hong Kong Listed Securities and Derivatives Markets.” In SFC Quarterly Bulletin, Summer. 2004, pp. 32–44. [Google Scholar]
- E. Tsoi. “Increasing Investor Participation: Insights from HKEx Surveys.” In SFC Quarterly Bulletin, Summer. 2002, pp. 1–17. [Google Scholar]
- Y.C. Park, and D. Park. “Creating Regional Bond Markets in East Asia: Rationale and Strategy.” In The 2nd Annual Conference of PECC Finance Forum, Issues and Challenges for Regional Financial Cooperation in the Asia-Pacific; 2003, pp. 1–53. [Google Scholar]
- A. O. I. Hoffmann, and T. L. J. Broekhuizen. “Susceptibility to and Impact of Interpersonal Influence in An Investment Context.” Journal of the Academy of Marketing Science 37 (2009): 488–503. [Google Scholar]
- A. Wang. “Interplay of Investors' Financial Knowledge and Risk Taking.” The Journal of Behavioral Finance 10 (2009): 204–213. [Google Scholar]
- R.B. Durand, R. Newby, and J. Sanghani. “An Intimate Portrait of the Individual Investor.” The Journal of Behavioral Finance 9 (2008): 193–208. [Google Scholar]
- J. R. Graham, C. R. Harvey, and H. Huang. “Investor Competence, Trading Frequency and Home Bias.” Management Science 55, 7 (2009): 1094–1106. [Google Scholar]
- A. O. I. Hoffmann, and T. Post. “What Makes Investors Optimistic? What Makes Them Afraid? ” Working paper, The Netherlands: Maastricht University and Netspar, 2012, 1–40. [Google Scholar]
- G. M. Korniotis, and A. Kumar. “Do Older Investors Make Better Investment Decision? ” The Review of Economics and Statistics 93, 1 (2011): 244–265. [Google Scholar]
- D. N. Jackson, L. Hourany, and N. J. Vidmar. “A Four Dimensional Interpretation of Risk-taking.” Journal of Personality 40 (1972): 483–505. [Google Scholar]
- A. O. I. Hoffmann, T. Post, and J. M. E. Pennings. “Individual Investors and the Financial Crisis: How Perceptions Change, Drive Behavior, and Impact Performance.” Working paper, Maastricht University and Netspar, 2011, 1–50. [Google Scholar]
- I. Vlaev, N. Chater, and N. Stewart. “Dimensionality of Risk Perception: Factors Affecting Consumer Understanding and Evaluation of Financial Risk.” The Journal of Behavioral Finance 10 (2009): 158–181. [Google Scholar]
- T. A. Hallahan, R. W. Faff, and M.D. McKenzie. “An Empirical Investigation of Personal Financial Risk Tolerance.” Financial Services Review 13 (2004): 57–78. [Google Scholar]
- H. Wang, and S. Hanna. “Does Risk Tolerance Decrease With Age? ” Financial Counselling and Planning 8, 2 (1997): 27–30. [Google Scholar]
- H. Shefrin. “Beyond Greed and Fear- Understanding Behavioral Finance and the Psychology of Investing.” In Financial Management Association Survey and Synthesis Series; Harvard Business School Press, 2000, pp. 13–32. [Google Scholar]
- A. Tversky, and D. Kahneman. “Judgment under Uncertainty: Heuristics and Biases.” Science 185, 415 (1974): 1124–1131. [Google Scholar]
- M. Sewell. “Behavioural Finance.” Working paper, University of Cambridge, 2010, 1–13. [Google Scholar]
- S. Singh. “Investor Irrationality and Self-Defeating Behavior: Insights from Behavioral Finance.” The Journal of Global Business Management 8, 1 (2012): 116–122. [Google Scholar]
- M.K.H. Law. “Behavioural Risk Disclosure and Retail Investor Protection: Reflections on the Lehman Brothers Minibonds Crisis.” Working paper, The Institute of Law, Economics, and Politics, 2010, 15–42. [Google Scholar]
- M. Wang, C. Keller, and M. Siegrist. “The Less You Know, the More You Are Afraid of-A Survey on Risk Perceptions of Investment Products.” The Journal of Behavioral Finance 12 (2011): 9–19. [Google Scholar]
- M. Kannadhasan. “Role of Behavioural Finance in Investment Decisions.” Working paper, Bharathidasan Institute of Management, 2006. [Google Scholar]
- A. Tversky, and D. Kahneman. “Belief in the Law of Small Numbers.” Psychological Bulletin 2 (1971): 105–110. [Google Scholar]
- L.L. Thurstone. “Multiple Factor Analysis.” Chicago: University of Chicago Press, 1947. [Google Scholar]
- R. B. Cattell. “The Meaning and Strategic Use of Factor Analysis.” In Handbook of Multivariate Experimental Psychology. Rand-McNally: Chicago, 1966. [Google Scholar]
- J. C. Nunnally. “Psychometric Theory, ” 2nd ed.New York: McGraw-Hill, 1978. [Google Scholar]
Share and Cite
MDPI and ACS Style
Hon, T.-Y. The Behaviour of Small Investors in the Hong Kong Derivatives Markets: A Factor Analysis. J. Risk Financial Manag. 2012, 5, 59-77. https://doi.org/10.3390/jrfm5010059
AMA Style
Hon T-Y. The Behaviour of Small Investors in the Hong Kong Derivatives Markets: A Factor Analysis. Journal of Risk and Financial Management. 2012; 5(1):59-77. https://doi.org/10.3390/jrfm5010059
Chicago/Turabian StyleHon, Tai-Yuen. 2012. "The Behaviour of Small Investors in the Hong Kong Derivatives Markets: A Factor Analysis" Journal of Risk and Financial Management 5, no. 1: 59-77. https://doi.org/10.3390/jrfm5010059