1. INTRODUCTION
Recent studies examine the relation between various corporate governance mechanisms and the cost of debt financing. Bhojraj and Sengupta (2003) provide empirical evidence that firms with larger institutional ownership and stronger outside control of the board, hence better corporate governance, often benefit from a reduced yield spread as a result of lower default risk. Yet, the authors report that concentrated institutional ownership conveys the opposite impact on bond yields. Anderson, Mansi, and Reeb (2004) find that yield spreads are inversely related to audit committee size and board meeting frequency. The authors further discover that fully autonomous audit committees are correlated with lower bond yield spread. These findings suggest that larger, stronger, and more independent boards and audit committees provide superior monitoring of the firm and reduce the cost of debt.
Klock, Mansi, and Maxwell (2005), however, detect a statistically significant negative association between the governance index and the yield spread after controlling for firm and security related factors. These results imply that high values of the G-index, which indicate more restrictions on shareholders and thus more managerial power, hence weaker corporate governance, are associated with lower cost of debt financing. Boubakri and Ghouma (2007) document that while family control does not affect the cost of debt financing, corporate governance voting provisions and cash-flow rights have a positive impact on yield spread. The authors however report that bond ratings are negatively affected by the presence of controlling family. Cremers, Nair, and Wei (2007) report that corporate governance mechanisms can affect debt-holder risk. The authors discover that institutional block-holders pay lower (higher) bond yields when a firm is protected (unprotected) by takeover provisions.
In light of these inconsistent findings, we explore how corporate governance level affects yield spreads. Since yield spreads are commonly dictated by estimated default probabilities as well as by reported credit ratings, we investigate the comprehensive relations between the general governance index or the specific governance provision groups and different measures of default likelihoods as well as credit ratings. We are motivated to discover whether corporate governance level in general, and what specific corporate governance provision groups in particular, affect the creditworthiness of a firm as an underlying force affecting a bond’s yield.
We contribute to the literature in this area by exploring the impact of corporate governance on the likelihoods of default rather than on actual bankruptcy filings. Addressing more of the bankruptcy risk factors in advance may improve investment decisions among market participants. We further aim to detect differences between the effects of corporate governance levels on objective schemes versus on subjective estimations of bankruptcy risk quantities. This may reveal how subjective opinions deviate from risk-neutral derivations while we evaluate factors of credit risk. In addition, our investigation assists in validating several competing hypotheses concerning the advantages and disadvantages of corporate governance for debt-holders.
Often, improved corporate governance leads to better monitoring of management. This prevents opportunistic executives from taking value-destroying empire-building measures, and thus helps to moderate bankruptcy risk. Furthermore, according to the private benefits hypothesis, strong corporate governance benefits both shareholders and debt-holders, since it secures capital detrimental to both agents, and hence reduces the chances to default. These two hypotheses suggest a negative correlation between corporate governance and bankruptcy risk.
In contrast, a higher debt ratio is often used by shareholders as a corporate governance tool to mitigate agency conflicts with management. The transfer-of-control hypothesis claims that since debt increases the firm’s costs, it also restrains managers from extracting private benefits, and therefore it helps to protect shareholder rights. Debt ratio is positively associated with bankruptcy risk, and therefore strong corporate governance could be positively correlated with default probabilities.
Furthermore, strong corporate governance might encourage managers to accept more risky projects as a result of tighter supervision by the board of directors. This has potential hazard for the survivability of a firm. Another theory proposing a positive correlation between corporate governance and bankruptcy risk is the wealth-transfer hypothesis which suggests that improved corporate governance benefits shareholders at the expense of debt-holders. This may drive creditors to become stricter, to require higher yield, to avoid renegotiation over debt covenants, and perhaps to force chapter eleven sooner than for similar enterprises having weaker corporate governance levels.
1The purposes of this study are threefold: to explore an additional aspect of corporate governance, to examine another feature affecting bankruptcy risk, and to identify the missing link that connects corporate governance and bond’s yield. The paper attempts to shed light on the impact of corporate governance on default risk, and to detect the specific governance provision groups involved. For these reasons, we estimate for each firm its bankruptcy risk as derived by the accounting-based Altman Z-scores, by the alternative cash-flow-based-model (CFBM) scores, as well as by the Ohlson O-scores, by the risk-neutral default probabilities estimated from the Merton structural model, and by the credit ratings reported by S&P. We use the G-index of Gompers, Ishii, and Metrick (2003) for general corporate governance level, as well as the specific groups of corporate governance provisions.
Prior literature focused on the potential relationship between bankruptcy and some of the corporate governance aspects. Chaganti, Mahajan, and Sharma (1985) examine 21 retailing firms, and find no association between the structure of the board and defaults. Hambrick and D’Aveni (1992) study 57 large corporations and discover that, among bankrupt firms, dominant CEOs are more pronounced than weak CEOs. Daily and Dalton (1994) match 57 bankrupt firms with a group of recovered firms. The authors use logistic regressions to compare the groups with two governance provisions: board composition and CEO-board chairperson structure, and find several differences in proportions of affiliated directors, chief executives, board chairperson structure, as well as their interaction. Goktan, Kieschnick, and Moussawi (2006) examine whether corporate governance affects the likelihood of a firm to be acquired, to go private, or to default, by using a dataset of U.S. public firms from 1997 to 2004. The authors reveal that corporate governance affects the likelihood of a firm either to be acquired, or to go private. However, no link is found between corporate governance and defaults.
Former studies concentrate on default events and thus are limited in the number of observations examined. Actual default events are scarce compared to bankruptcy risk measurements, therefore prior study results somewhat lack economic confidence. Furthermore, results driven from the examination of only large corporations cannot be generalized to small firms, as discussed by Daily and Dalton (1994). Our study not only challenges previous findings with respect to the impact of corporate governance on bankruptcy risk, but also identifies the impact of governance provisions on a broader range of probabilities to default. In most cases, going bankrupt is merely the end result of long credit risk deterioration. Thus, if we link default probabilities, rather than actual bankruptcy events, to corporate governance measures, we can disclose the deeper roots of the relationship between corporate governance and yield spread. In essence, our paper is related to John, Litov, and Yeung (2008) who examine how better investor protection could lead firms to undertake riskier yet value-enhancing investments. The authors find that corporate risk-taking and growth opportunities are positively related to corporate governance.
While using the four objective approaches for estimating bankruptcy risk -- the Altman (1968) Z-scores, the Merton (1974) structural model default probabilities, the Ohlson (1980) O-scores, and the alternative CFBM-scores proposed by Aziz, Emanuel, and Lawson (1988), we discover that corporate governance level is negatively correlated to the chances of bankruptcy filing. Yet, we find that credit rating agencies do not necessarily follow this line when assigning credit ratings. We conclude that these conflicting results derive the contradicting relations found in prior studies between corporate governance and yield spread.
The remainder of the study is organized as follows.
Section 2 discusses the theoretical arguments underlying the relation between corporate governance and bankruptcy risk.
Section 3 presents the data sample and the methodologies.
Section 4 describes the empirical findings, and
Section 5 concludes.
2. THEORETICAL DISCUSSION
The conceptual debate underlying our investigation arises from several competing hypotheses. Some propose a negative correlation between corporate governance and bankruptcy risk, while others suggest a positive association.
Grossman and Hart (1982) and Jensen (1986) suggest that debt can be used as a disciplining mechanism to reduce management’s value-reducing inefficiencies. Other studies, including Kaplan (1989), Lehn and Poulsen (1989), Marais, Schipper, and Smith (1989), Lehn, Netter, and Poulsen (1990), Muscarella and Vetsuypens (1990), Smith (1990), and Denis and Denis (1993) support the notion that debt can be used as a corporate governance tool. Shleifer and Vishny (1997) survey various corporate governance issues, among them the rights of creditors, and the fact that debt often provides better protection to outside investors than equity. The authors present the transfer-of-control hypothesis that suggests that higher debt ratio, often used as a corporate governance tool, increases a firm’s costs, which then discourages managers from extracting private rent, and thus protects the interests of shareholders. Since the level of debt ratio is directly associated with bankruptcy risk, stronger corporate governance could be positively correlated to higher default likelihoods.
Bhojraj and Sengupta (2003) examine two alternative theories. The private-benefits hypothesis implies that improved corporate governance benefits both shareholders and debt-holders, since it reduces agency conflicts and secures capital detrimental to both agents. This premise infers that strong corporate governance may be profitable both to shareholders as well as to creditors, therefore reduces bankruptcy risk.
In contrast, the authors also argue for the wealth-transfer hypothesis claiming that corporate governance benefits shareholders at the expense of creditors, and thus damages the debt-holders’ position. Shareholders may use their corporate governance power to engage in ownership changes or to influence management to accept risky projects that could hurt debt-holders’ interests. In this case, bond-holders might be more rigorous, and perhaps force a firm to file for bankruptcy earlier than for comparable firms having weaker corporate governance. This theory suggests a positive association between corporate governance and the odds of default.
Ashbaugh-Skaife, Collins, and LaFond (2006) investigate the association between corporate governance and credit ratings. Their findings suggest that credit ratings are inversely related to the number of equity block holders and to CEO power, but positively correlated with anti-takeover provisions, a synonym for weaker shareholder rights, with accrual quality, with earnings timeliness, with board independence, with board stock ownership, and with board expertise. The authors conclude that corporate governance mechanisms that benefit shareholders may do so at the expense of debt-holders, with compliance to the wealth-transfer hypothesis.
Masulis, Wang, and Xie (2007) investigate whether a firm’s Anti-Takeover Provisions (ATP) affect the likelihood of its acquisitions. The authors realize that acquirers with more ATP exhibit much lower announcement-period abnormal stock returns than parallel firms having less ATP. These findings imply that managers protected by ATP are less likely to be disciplined by the market, and thus are more likely to take actions that benefit themselves rather than shareholders. Following these results, we may deduce that improved corporate governance prevents opportunistic management from conducting value-destroying empire-building acquisitions, and therefore according to the value-destruction hypothesis, better corporate governance may assist a firm in achieving a lower default risk.
2Many of the governance provisions we consider hereafter have a potential impact on agency conflicts and on corporate control issues. Following the private benefits theory and the value-destruction premise, our null hypothesis asserts a negative correlation between corporate governance and bankruptcy risk. Following the transfer-of-control conjecture and the wealth-transfer proposition, our alternative hypothesis suggests a positive correlation between corporate governance and default likelihoods. Our null and alternative hypotheses are:
H0: Strong (weak) corporate governance triggers lower (higher) default likelihoods.
H1: Strong (weak) corporate governance increases (decreases) bankruptcy risk.
3. DATA AND METHODOLOGY
3.1 The Sample
We obtain our data from the following sources: Compustat, Global Insight, RiskMetrics (formerly Investor Responsibility Research Center, or IRRC) Governance and Directors, and the Bureau of Economic Analysis (BEA), U.S. Department of Commerce web site.
RiskMetrics Governance provides detailed listings of numerous corporate governance provisions along with the G-index offered by Gompers, Ishii, and Metrick (2003). Since data is discretely available only within 1990, 1993, 1995, 1998, 2000, 2002, and 2004, and since the RiskMetrics sample has expanded by several hundred firms in recent publications to include also smaller firms apart from the S&P 500 list, as well as firms with higher levels of institutional ownership, we choose to focus our attention on more recent years, from 1998 to 2004. These better distributed observations should lead to unbiased results and robust conclusions.
There are 3,787 firms in the RiskMetrics database. Only 1,853 of them contain observations from 1998 to 2004. After we merge all data fields, and eliminate 455 firms having missing data and those within the financial service industries, the final dataset contains 1,398 public firms, from 1998 to 2004.
3The distribution of the firms over the examined period is as follows: 1998 (868), 2000 (858), 2002 (963), and 2004 (1,100). These public firms spread over 18 industry groups as follows: agriculture (6), metals and mining (62), oil and gas (95), machinery and construction (79), food and beverages (43), textile and clothing (31), wood products (45), books and publishing (32), chemical products (66), medical and pharmaceutical (125), vehicles, aircrafts, and ships (40), electronics (194), communication and telecommunication (62), transportation services (52), retail stores (203), marketing and advertising (12), computer services (97), and others (154). Our dataset is well diversified over the recent years where RiskMetrics publications are available, and among various industries.
4 3.2 The Variables
To compute the firms’ Z-scores, Compustat database supplies current assets, current liabilities, total assets, total liabilities, net sales, retained earnings, EBITDA, depreciation and amortization, equity closing prices, and common shares outstanding. To estimate the CFBM-scores, Compustat offers more data on operating cash flow, capital investment, taxes, cash and marketable securities, interest payments, and short, medium, and long term debt. To calculate the Ohlson O-scores, Compustat also provides information regarding net income. We further gather historical data on the GDP price level index from the BEA web site.
Compustat also provides the S&P long term domestic issuer credit ratings. Credit categories numbered as 2, 4, 5, 6, 7, 8, 9, 10, 11, 12, 13, 14, 15, 16, 17, 18, 19, 20, 21, 23, 24, or 27 are considered valid, where the lowest number 2 represents the highest possible credit rating ‘AAA’, the number 14 indicates on the ‘BB’ credit rating, the highest category classified as non-investment or speculative grade, and 27 denotes filing for bankruptcy. The higher the credit number, the lower the credit rating.
To compute the Merton model default probabilities we obtain more information from several sources. The Global Insight database publishes data on the term structure of various interest rates in the U.S. The risk-free interest rates during the examined period are figured from the average yield of U.S. government bonds. The Compustat database contains stock closing prices along with the number of shares outstanding. These are combined to assess the equity market and the log return volatility of market value of equity. This database also provides information regarding firms’ liabilities and their time to maturity.
To construct the debt structure and its time to maturity we follow Delianedis and Geske (2003), and divide total liabilities into current liabilities, debt due in one, two, three, four and five years, long-term debt, deferred taxes, minority interest and other long-term liabilities. Current liabilities are considered to mature in six months, while all other debt components, except those with explicitly stated time frame, are assumed to mature in ten years. To avoid overstating the short-term debt, we deduct account receivables, cash, short-term investment, and marketable securities from account payables. Since the Merton model considers only one debt time to maturity, the Macaulay duration is used to combine all debt components into a single maturity.
The corporate governance provisions within the RiskMetrics sample are batched into five groups: ‘delay,’ ‘protection,’ ‘voting,’ ‘state,’ and ‘other’ provisions.
5 The ‘delay’ provisions include blank check, classified board, limits to call special meeting, limits for written consent, and advance notice requirements. These provisions are essentially meant to slow down a hostile bidder. An advance notice requirements provision is not included in the original G-index. The ‘protection’ group includes compensation plans, indemnification contracts, golden parachutes, severance, director indemnification, and director liability. These provisions are designed to secure the jobs of executives and directors, and to compensate them upon contract-termination.
The ‘voting’ group includes limits to amend bylaws, limits to amend charters, cumulative voting, secret ballot, super majority to approve merger, unequal voting, and cumulative voting for substantial shareholders. These provisions are related to shareholder rights, where cumulative voting for substantial shareholders is not included in the original G-index, hence worsening the corporate governance. Cumulative voting and secret ballots are the only two provisions whose absence adds a point to the G-index, and therefore we adjust their reported values accordingly in the ‘voting’ group of provisions.
The ‘state’ group contains recapture of profits, business combination law, cash-out law, director’s duties law, fair price law, and control share acquisition law. These are the “second generation” state takeover laws that do not necessarily exist across all U.S. states. The ‘other’ provisions are antigreenmail, non-financial impact, fair price requirement, pension parachutes, poison pills, and silver parachutes. Advance notice requirements and cumulative voting for substantial shareholders are the only two provisions not included in the original G-index.
3.3 The Control Variables
We collect data regarding dual-class common stocks and Delaware incorporation as control variables. Firms with dual-class common shares may vary from single-class enterprises since their voting and ownership structure could be different. Commonly, the voting rights attached to each class of stock may diverge from the one-share-per-vote standard, and some firms may attach special rights to these shares, such as the ability to elect a certain percentage of the directors. Daines (2001) finds that firms incorporated in the state of Delaware generally have higher valuation, measured by Tobin’s-Q, than other U.S. firms. Since these two factors may cause heterogeneity among the records we include a dual-class and Delaware dummy variables in the analyses as well.
To test our hypotheses we conduct a series of regressions. Doing so, to isolate the information within corporate governance provisions, and to identify the subjective component of the credit ratings analysis, we control for a set of idiosyncratic elements that may affect bankruptcy risk. We select five intra-firm variables including size, liquidity, profitability, growth, and leverage ratio, to remain as close as possible to the consensus, and at the same time to prevent multicollinearity.
In fact, there is no comprehensive agreement regarding the determinants shaping the likelihood of a firm to default. Numerous scholars suggest different factors. Among others, Altman (1968) offers EBIT, net sales, total assets, equity, working capital, and retained earnings. Merton (1974) recommends market value of assets, and face value of debt, along with the corresponding characteristics: market value of equity, remaining time to maturity on the debt, risk-free interest rate, and assets volatility as the only relevant features. Ohlson (1980) proposes the size of a company, measures of the financial structure, performance measures, and current liquidity measurements. Izan (1984) suggests EBIT, interest payments, equity valuation, and total liabilities as the most significant components affecting bankruptcy risk. Aziz, Emanuel, and Lawson (1988) offer operating cash flow, capital investment, total assets, interest payments, and liquidity changes as the major determinants. Platt and Platt (1991) propose growth measured as the percentage change in sales, liquidity estimated as cash flow over sales, capital intensity captured as net fixed assets divided by total assets, and leverage ratio computed from total debt over total assets. We therefore select size, liquidity, profitability, growth, and leverage ratio as the idiosyncratic control variables.
We measure firm size by book value of total assets, and predict that it is negatively correlated to the likelihood of default. We proxy firm liquidity as the ratio of current assets over current liabilities, and expect it to be inversely related to bankruptcy risk. We capture firm profitability from operating income before depreciation and amortization, and forecast that profitability is negatively associated with the chances of going bankrupt. We estimate firm growth by market-to-book value, and guess that growth is negatively correlated to credit risk as well. We compute firm leverage ratio as total debt divided by total assets, and expect leverage ratio to be positively correlated with bankruptcy risk.
3.4 Methodologies
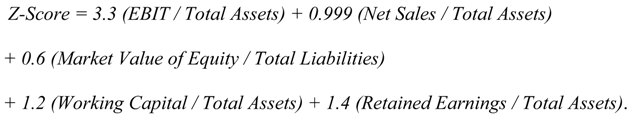
Our analysis starts by calculating for each firm the corresponding Altman Z-score. Altman (1968) uses a multiple discriminant analysis to combine a set of five financial ratios, to a single measure, called the Z-score hereafter. In general, the lower the Z-score, the higher the bankruptcy risk. The Altman Z-Score is computed as:
Cash flow bankruptcy models suggest that insufficient cash available to service existing debt may trigger deterioration in the creditworthiness of a firm. The CFBM-score for assessing bankruptcy risk is computed following the execution of Aziz, Emanuel, and Lawson (1988) as follows:
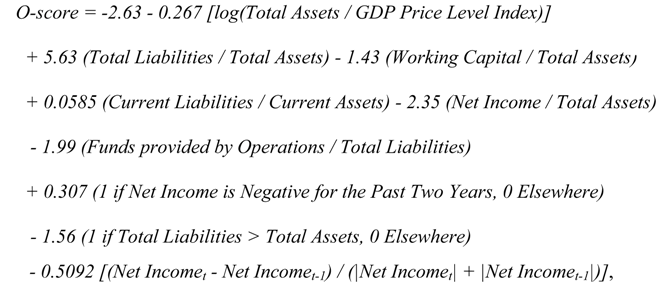
where ‘liquidity change’ denotes changes in cash and marketable securities over the previous quarter of a year. In general, a higher CFBM-score means a worsening in the creditworthiness of a firm, and vice versa. We further calculate for each observation the Ohlson (1980) O-score. The O-score as a measure of bankruptcy risk is computed as:
where an increase in O-score denotes deterioration in a firm’s credit-worthiness and a decrease in the O-score proposes improvement in a firm’s credit-risk.
For purpose of robustness we compute the risk-neutral default probability for each firm within every point in time using the Merton structural model. Merton (1974) introduces a pioneering insight for measuring default risk as a function of assets and debt values. This concept considers a firm’s equity as a European call option on the firm’s assets. The model is simplified by assuming that the firm has one zero-coupon bond outstanding which matures at time T.
The model defines the following:
V0: market value of the firm’s assets today,
VT: market value of the firm’s assets at time
T,
E0: value of the firm’s equity today,
ET: value of the firm’s equity at time
T,
D: total amount of debt (interest and principal) due to be repaid at time
T,
σV: volatility of the firm’s assets,
σE: volatility of the firm’s equity, and
rf: risk-free interest rate. Hence, if
VT <
D, the firm defaults at time
T and the value of the equity is zero. Yet, if
VT >
D, the firm pays out its debt at time
T, and its equity value becomes
VT –
D. Therefore, the value of the firm’s equity at time
T can be written as
The firm’s equity is a European call option on the value of the assets, with the total amount of debt due to be paid at time
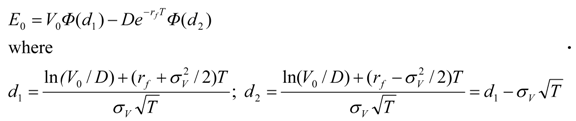
T as the strike price. The Black-Scholes (1973) model solves the current value of the firm’s equity as follows:
The Black-Scholes model considers
Φ(d2) as the probability that the option will be exercised, where
Φ is the cumulative Normal distribution function. In the Merton model context,
Φ(d2) is the risk-neutral probability that the firm will not default, so
1 - Φ(d2) =
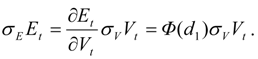
Φ(-d2) is the risk-neutral probability that the firm will default on the debt. In the Merton model market value of assets and assets volatility are not directly observable, but can be postulated. Jones, Mason, and Rosenfeld (1984) use the Itô’s lemma for equity movements, and offer a second equation to solve for these two unknowns:
Rather than solving the nonlinear equations (5) and (6) simultaneously, we follow the sequential-iterations methodology offered by Crosbie and Bohn (2003), and Bharath and Shumway (2004).
6 The iterative procedure starts by considering
Φ(
d1) = 1 in equation (6), and by assigning an initial guess of
σV =
σE[
E/(
E +
D)], where equity and face value of debt are observable. We use these values of
σV within equation (6) to infer the market value of each firm’s assets, throughout the whole period. From this point on, further iterations can compute from past observations the implied log return of market value of assets, generating each time a new series of
σV . Iterations continue until the model converges, when absolute difference between successive
σV s drops below one percent. Most observations require several such iterations.
Finally we record the S&P credit rating for each observation. The purpose of doing so is not because the first four techniques (Z-scores, O-scores, CFBM-scores, and Merton model default probabilities) do not provide enough information on bankruptcy risk, but rather because we would like to test whether a subjective analysis of credit risk captures more or less of the information provided by the corporate governance provisions.
We suspect that our way of measurement exhibits endogeneity.
7 In our regressions, both the dependent variable; either a bankruptcy risk quantity or a credit rating, and the independent variable -- the G-index, are affected by different managerial characteristics. While the level of corporate governance impacts default odds, it is probable that a firm with high (poor) creditworthiness can (cannot) attract quality management, leading to adjustments in corporate governance.
RiskMetrics Directors database provides several proxies for such managerial instruments that could affect bankruptcy risk and the way firms practice corporate governance. We use the age of executives as a proxy for general ‘experience’, the number of years in service as a proxy for the level of ‘involvement’ in the firm, the board affiliation as a proxy for ‘independency’, and the attendance in meetings as a proxy for the ‘effort’ each executive devotes.
We authenticate the existence of the endogeneity problem through Durbin-Wu-Hausman endogeneity tests for all models.
8 We further conduct a Rivers-Vuong endogeneity test for the S&P credit ratings analysis.
9 We then address endogeneity in two ways. First, we identify instrumental variables for G-index and estimate the model using two stage least square (2SLS).
10 The instruments are executives’ experience, involvement, independency, and effort within the corresponding firms.
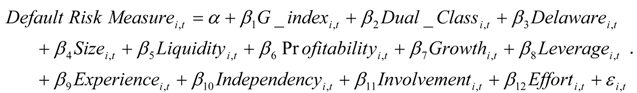
Second, we attempt to mitigate this endogeneity problem by controlling for the above instruments in our pooled cross-sections-over-time regressions. We test the relations between the Altman Z-score, the O-score, the CFBM-score, the risk-neutral default probability derived from the Merton model, and the S&P credit rating as dependent variables, and the G-index as an independent variable while controlling for the relevant variables and instruments, as follows:
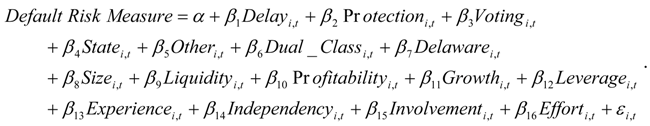
11After we establish a strong association between the general level of corporate governance and default risk, we identify the specific groups of governance provisions responsible, while controlling for the necessary variables and instruments, as follows:
In these pooled cross-sections-over-time specifications we compute t-statistics as unbiased and consistent estimates of the standard errors according to Wooldridge (2002, Chapter 6), while controlling for heteroskedasticity and error clustering. In addition, we refute multicollinearity among the predictors, by computing the variance inflation factor, yet none of these values exceed 10, and therefore the standard errors are not inflated.
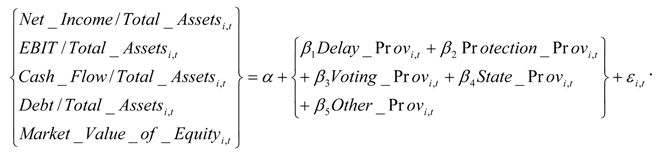
To further understand the deeper mechanisms associating some of the corporate governance provisions with bankruptcy risk measures we execute an array of cross-sectional regressions, where we regress some accounting ratios related to bankruptcy risk as dependent variables against the five groups of governance provisions as independent variables. More formally, we explore the following relations:
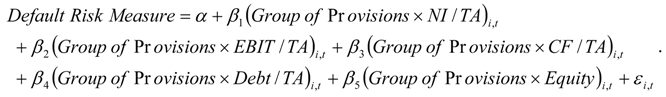
We conduct an additional cross-sectional-over-time set of regressions to grasp the differences between the various creditworthiness measures. This time, we regress the bankruptcy risk measures (Z-scores, O-scores, CFBM-scores, Merton model default probabilities, and S&P credit ratings) as dependent variables against the interaction terms between the five groups of corporate governance provisions (‘delay’, ‘protection’, ‘voting’, ‘state’, and ‘other’) and several accounting terms including net income, EBIT, cash flow, and debt, all scaled by total assets, and market value of equity, as follows:
3.5 Robustness Tests
After we eliminate multiple recurring firm-year observations we verify that our results are not biased by any type of serial correlations, heteroskedasticity, clustered errors, or censored data and conduct several robustness checks. We estimate the models through the Fama and MacBeth (1973) technique. We thus split the sample into separate years and calculate t-statistics by averaging the coefficients over the years and dividing the results by their normalized standard deviation.
12We also perform a general test to identify whether standard errors are clustered. We correct for possible heteroskedasticity and serial correlation by estimating the models with Newey-West (1987) standard errors as well. In addition, we test the models using asymptotic covariance matrix of the estimates under the assumption of heteroskedasticity.
We further test the models with a robust regression technique that assign weights to observations and a quantile regression where the coefficients are computed by minimizing the absolute deviations from the median rather than the mean. Furthermore, since the universal G-index contains a total of 24 governance provisions but our sample is bounded between 2 to 18 corporate governance provisions due to random factors, we test our models with a censored values methodology.
13 3.6 Descriptive Statistics
Table 1 provides summary statistics for the estimated variables. The data sample varies from fairly small to quite large firms, as indicated by the wide range of firm size. The records also diverge from exceptionally safe to highly risky firms, as expressed by the five bankruptcy risk measurements. Furthermore, corporate governance levels are rather different across the dataset, as designated by the G-index and by the groups of governance provisions. So is the dispersion of the firm-related control variables and the managerial characteristics. In addition to good representation over the years and across industries, our dataset is well diversified between different firms’ sizes, over a wide range of creditworthiness, and through different degrees of corporate governance; thus we may conclude that potential sample selection errors are kept to a minimum level.
4. RESULTS
This section summarizes the empirical findings of the various tests and discusses their economic meaning. As stated before, we suspect that our ways of measurement exhibit endogeneity, when both the default risk quantities and the corporate governance levels are affected by common managerial characteristics. We authenticate this phenomenon in
Table 2. All the Durbin-Wu-Hausman endogeneity tests detect statistically significant residuals of the G-index, and thus we reject exogeneity.
14We alleviate this endogeneity problem in several ways and examine whether the general level of corporate governance affects bankruptcy risk quantities through pooled cross-sections-over-time regressions, by 2SLS tests, through Fama and MacBeth (1973) methodology, and by using the Newey – West (1987) standard errors, as illustrated in
Table 3. Panel A portrays the relation to Altman Z-score. Panel B presents the association to the risk-neutral default probabilities as derived from the Merton structural model. Panel C shows the link to the S&P credit ratings.
15When testing accounting based Altman Z-score as a dependent variable, and the G-index as an independent variable, the model is statistically significant. In all of the examined specifications the G-index is inversely related to Altman’s Z-score with high significance levels. This test indicates that high G-index is associated with low Z-scores, or that a weak corporate governance level relates to high default probabilities, and vice versa. These results match our null hypothesis for a negative correlation between the level of corporate governance and bankruptcy risk.
When testing the default probability from the Merton model as a dependent variable, and the G-index as an independent variable, the models are statistically significant as well. G-index is positively correlated to Merton model default probabilities with fairly high significance levels in most of the specifications. These tests authenticate our previous results. A high G-index admits a high default probability, or alternatively a strong corporate governance level relates to a low bankruptcy risk.
All these tests thus far point to the fact that the corporate governance level indeed affects default likelihoods. Clearly, corporate governance is not the primary factor affecting bankruptcy risk measurements, yet we establish a robust negative association between the general level of corporate governance and objective estimations of bankruptcy risk, as stated in the null hypothesis.
When testing the S&P credit score as a dependent variable, and the G-index as an independent variable, the logit models are statistically significant. In almost all of the specifications we find a robust negative correlation between the general level of corporate governance, and the S&P credit numbers, except for the clustered standard errors test that identifies a positive such relation, but with a moderate significance level. These tests largely indicate that high a G-index relates to low credit number, or that a weak corporate governance level leads to a high credit rating, thus to a low default probability. Although these results are not entirely conclusive, they essentially agree with our alternative hypothesis for a positive correlation between corporate governance and default risk.
Next we explore which are the explicit groups of corporate governance provisions accountable for the above relations.
Table 4 reports the findings of these analyses. We find that ‘delay’ provisions are negatively associated with Z-Scores, and credit numbers, but positively correlated with Merton model default probabilities. These findings corroborate our prior results from the G-index analyses. However, ‘protection’ provisions and ‘other’ provisions are inversely related to all credit risk quantities. These results suggest that these types of corporate governance provisions convey mixed influence on survivability of firms.
While ‘state’ governance provisions portray a limited effect on bankruptcy risk measures in some of the Z-score tests, ‘voting’ provisions present highly robust relation to default risk quantities. The ‘voting’ group of provisions is negatively correlated to Z-scores, and positively associated with Merton model default probabilities and credit numbers. These findings imply that increases in the number of voting provisions prompt lower Z-scores, higher default likelihoods as captured by the Merton structural model, and lower S&P credit ratings. All of these default risk measures point to higher bankruptcy risk.
Table 5 presents the results of the accounting ratios tests. While the groups of ‘delay’ and ‘protection’ provisions generally increase market value of equity and thus reduce bankruptcy risk, they are associated with higher debt ratio, which increases default odds. The group of ‘protection’ provisions is further negatively correlated to profitability. However, ‘voting’ provisions reduce market value of equity, but are inversely related to leverage, although with lower significance level. The group of ‘state’ provisions is inversely related to profitability, and along with the group of ‘other’ corporate governance provisions they have positive correlations to the debt level.
By accumulating the results from
Table 4 and
Table 5, we feel secure in asserting that the group of ‘voting’ provisions is negatively correlated to bankruptcy risk, and thus supports the null hypothesis. The group of ‘state’ provisions is also inversely related to default odds, but with a lower impact. The remaining three groups of corporate governance provisions (‘delay’, ‘protection’, and ‘other’) exhibit mixed effect on creditworthiness of firms, yet with a slight tendency towards the null hypothesis.
Table 6 illustrates the findings from the interaction terms analyses. We recognize that governance provisions do not change cash flow much to affect bankruptcy risk. However, the objective methodologies of credit risk show that corporate governance provisions interact not only with scaled net income and market value of equity to influence creditworthiness, but also with scaled EBIT and debt. Yet, credit ratings largely fail to acknowledge these later relations.
5. SUMMARY
In this study we perform numerous tests. Some examine the relations between the universal level of corporate governance to bankruptcy risk measures, and some are meant to identify the precise groups of corporate governance provisions most accountable for these relations. The level of corporate governance is captured by the G-index, and by the specific groups of corporate governance provisions: ‘delay’, ‘protection’, ‘voting’, state’ and ‘other’. The different dimensions of bankruptcy risk are estimated by the Altman Z-score, by the Ohlson O-score, by the CFBM-score, by the default probabilities derived from the structural Merton model, and by the subjective S&P credit ratings.
We find that the objective approaches for estimating default risk -- the three scores derived from the accounting ratios, and the Merton model default probabilities portray a clear vision where corporate governance level is negatively correlated to the chances of bankruptcy filing with accordance to our null hypothesis. Hence, a high (low) G-index which designates weak (strong) corporate governance often increases (decreases) default probabilities. We further examine a more subjective approach for estimating bankruptcy risk -- the credit ratings analysis, and its relation to corporate governance. We report on somewhat inconclusive findings, with a tendency towards the alternative hypothesis, where a positive correlation is predicted between G-index and the chances to default.
By analyzing the specific groups of corporate governance provisions and their relations to bankruptcy risk quantities, as well as the sources of these relations, we find strong evidence that the group of ‘voting’ provisions is negatively correlated to bankruptcy risk, the group of ‘state’ provisions is inversely related to default odds, but with a lower influence, and the remaining three groups of corporate governance provisions (‘delay’, ‘protection’, and ‘other’) exhibit quarrelling effect on creditworthiness of firms, but with some propensity towards a negative association. We also detect that credit ratings often not only deviate from objective methodologies in correlating corporate governance level to default risk, but they also disregard some of the information available in corporate governance provisions and their relations to profitability and debt ratio. We thus conclude that corporate governance is an important component inversely related to bankruptcy risk in most cases, yet with a combined effect recorded among credit ratings. These mixed approaches towards the relation between corporate governance level and bankruptcy risk measures are the underlying forces for the conflicting results in the literature regarding the relation between corporate governance and bond’s yield.
Our main contributions in this study are the realization that overall, corporate governance level is negatively correlated to bankruptcy risk and the recognition that credit agencies prefer to take a mixed approach towards this issue, probably due to different effects of the specific corporate governance provisions. We provide vigorous evidence that ‘voting’ and ‘state’ corporate governance provisions are negatively correlated to bankruptcy risk, however the ‘delay’, ‘protection’, and ‘other’ provisions exhibit a combined impact towards default likelihoods. This quarrelling evidence explains the prior inconsistent findings in the literature regarding the relations between corporate governance and a bond’s yield spread.