A Mean-Variance Diagnosis of the Financial Crisis: International Diversification and Safe Havens

Department of Economics, Loughborough University, Leicestershire, UK
*
Author to whom correspondence should be addressed.
J. Risk Financial Manag. 2010, 3(1), 97-117; https://doi.org/10.3390/jrfm3010097
Published: 31 December 2010
Abstract
:We use mean-variance analysis with short selling constraints to diagnose the effects of the recent global financial crisis by evaluating the potential benefits of international diversification in the search for ‘safe havens’. We use stock index data for a sample of developed, advanced-emerging and emerging countries. ‘Text-book’ results are obtained for the pre-crisis analysis with the optimal portfolio for any risk-averse investor being obtained as the tangency portfolio of the All-Country portfolio frontier. During the crisis there is a disjunction between bank lending and stock markets revealed by negative average returns and an absence of any empirical Capital Market Line. Israel and Colombia emerge as the safest havens for any investor during the crisis. For Israel this may reflect the protection afforded by special trade links and diaspora support, while for Colombia we speculate that this reveals the impact on world financial markets of the demand for cocaine.
JEL CLASSIFICATION:
G00; G11; G151. INTRODUCTION
The potential benefits arising from international portfolio diversification are well documented in the financial literature. However, an issue of fundamental importance to investors everywhere, and particularly so at times of global crisis, is how diversification may also include investment in ‘safe havens’. Traditionally, times of crisis have induced flight into gold in particular and precious commodities in general but there may also be potential for investment in particular economies (countries). Unfortunately, at times of crisis both the international co-movement between stock markets and the prices of safe haven assets may increase rapidly, potentially making any ‘flight to safety’ either expensive or ineffective. An extremely interesting question therefore is whether there are any economic characteristics of safe havens that could allow them to be identified prior to a crisis – for example, safe haven countries could be those with either income inelastic international demand for specific exports or protected markets for exports in general. The contribution of this paper is to add to the debate on international diversification by using mean-variance analysis in a novel way to identify countries whose stock markets provided potential safe havens during the recent global financial crisis. The results are somewhat unexpected and potentially raise policy issues of considerable importance – Colombia emerges as the ‘safest haven’ by a very wide margin among the countries sampled, followed at some distance by Israel.
The paper is organised as follows: a review of the literature and the context of international portfolio diversification is given in the next section; the mean-variance methodology and the data sample are discussed in section 2 and section 3; the results and their implications are reviewed in section 4 for the pre-crisis and crisis periods respectively; the implications of the crisis period results are discussed in section 5; section 6 provides a brief overview of the paper and concluding remarks.
2. SAFE HAVENS AND PORTFOLIO DIVERSIFICATION
Early work on international diversification (Levy and Sarnat, 1970; Solnik, 1974) focused on the existence and degree of potential benefits from exploiting low cross-country correlations between asset returns through diversification suggested by the Mean-Variance model of Markowitz (1952). Later debate was more concerned with the stability of diversification benefits and on ‘country’ and ‘industry’ effects as sources for those benefits. The early emerging consensus was that country effects were generally the stronger (Heston and Rouwenhorst, 1994, and related later works) but it has more recently been asserted that diversification benefits tend to be unstable over time and reduced by the globalisation of financial markets (Shawky, Kuenzel and Mikhail, 1997; Quinn and Voth, 2008; Tavares, 2009; Hyde, Bredin and Nguyen, 2007) and that industry diversification has become increasingly important, especially during times of crisis when country effects are weakest (Phylaktis and Xia, 2009). Other developments of the diversification literature have addressed estimation errors, the sensitivity of mean-variance optimisation results to small variations in inputs and more sophisticated estimation of mean-variance inputs (DeMiguel, Garlappi and Uppal, 2009). The latter conclude that the out-of-sample performance of mean-variance optimisation is generally no better than naïve diversification, even when procedures designed to reduce estimation error are used. For our purposes there are other findings in the literature that are particularly interesting. Erb, Harvey and Viskanta, (1994) find that correlations between countries are highest when countries are in recession and lowest when in expansion, while Longin and Solnik (1995, 2001) find higher correlations between countries at times of higher volatility, with lower correlations in particular during bear markets. Hyde, Bredin and Nguyen, (2007), using data for 1991 to 2006, examine the asymmetric response of conditional correlations and variances to positive and negative returns. They find in particular that while conditional correlations (US$ denominated returns) have generally increased over time, providing evidence of increasing financial integration, they were also higher between crisis-hit Asian -Pacific markets during the Asian financial crisis and peaked between these markets and the European Union and the United States (EU/US) during the 2000-2003 bear market. In other words, diversification benefits may be lowest just when they are most needed, especially when recession is severe and/or globalised, as has been the case recently. This concern leads to two questions that we have asked in the context of mean-variance analysis: (i) were there benefits to international diversification during the recent financial crisis, and (ii) have there been any countries (‘safe havens’) that have provided diversification benefits in particular?
We argue that a ‘safe haven’ is an asset that provides a store of value at times of falling asset prices. A classic example is gold, whose London Bullion Market quoted price rose from £322.264 per ounce on July 8, 2007 (at the pre-crisis peak of the FTSE1001) to £686.822 on February 8, 2010 while the FTSE100 fell from 6690.12 to 5092.33. More generally, returns to a ‘safe haven’ asset will have low correlation with those of other assets in an investor’s portfolio (for example, the monthly returns to Gold, denominated in £, show a correlation of -.3984 with the FTSE100 over the period given). With respect to international diversification, a country may represent a store of value if its equity returns (priced in a common currency) show low correlations with those of other countries. It is therefore important to know why such correlations are low. One possible explanation could be that, despite trends towards financial integration, international investors face barriers to stock market investment (although in this case the country might not be an accessible ‘safe haven’). Alternatively, a low-correlation country could be one for which GDP and export earnings are poorly correlated with the business cycles of other countries (aggregate consumption in particular). This suggests that there could be relatively low international demand elasticity for the exports of a ‘safe haven’ with respect to global consumption – which could be the case for any type of protected trade. Since products differ in their income elasticity of demand, it is possible that particular industries could represent safe havens when stock markets are in recession. However, here we look for safe haven countries, with the general expectation that these could be any or all of: (i) dominated by a single ‘safe haven’ industry (ii) protected by preferential trading arrangements, or (iii) less well integrated with the increasingly globalised world economy.
Mean-variance analysis has a noticeably different application here to those that are generally seen in the literature, in that we do not attempt to forecast out-of-sample optimal portfolio weights or estimate weights for use in future investment portfolios but instead characterise international investment opportunities during the recent crisis (indeed, we suspect that forecasts based on any crisis sample would be vacuous). Forecasting errors and the accuracy of optimisation-based investment strategies are therefore not at issue.
Using a sample of developed, advanced-emerging and emerging stock markets, we find a strong contrast in the optimal investment opportunity sets for the pre-crisis and crisis periods. We observe a clear disjunction between investment opportunities and capital markets during the crisis period, as expected. However, unexpectedly, the efficient portfolio frontier collapses to just two countries, Colombia and Israel.
3. METHODOLOGY
International diversification in a mean-variance framework is a matter of choosing optimal country weights to minimise a portfolio variance subject to achieving a target expected return, with standard constraints on the asset weights.
Here x is a vector of n asset weights (proportions of wealth invested in each country index, j = 1…n), i is a unit vector, V is the covariance matrix of the monthly country index returns, R is a vector of mean returns to the country indices and E is the average portfolio return desired by the investor. The non-negativity constraint xj ≥ 0 prohibits short-selling of risky assets (this is realistic, since it is not possible for investors to engage in unlimited short selling of equity indices). An analytic solution to this problem is found by applying the well known Kuhn-Tucker conditions (which need not be stated here). Numerical solutions were obtained by using the Generalized Reduced Gradient algorithm (Lasdon, Waren, Jain and Rather, 1978) embodied in commercial software (Fylstra, Lasdon, Watson and Waren, , 1998).
Optimal portfolio weights x of risky assets in the presence of a risk-free asset are identified through the Sharpe ratio2 of the tangency portfolio:
4. DATA
We use a sample of developed countries with the addition of countries that could reasonably satisfy the ‘safe haven’ characteristics outlined above. Since demand for oil is strongly pro-cyclical it is unlikely that oil-producing countries would in general qualify as safe havens and these were excluded. No other countries with available equity market indices appear to be dominated by a single product (except that Colombia has a large black economy in cocaine). Israel was chosen because of its special trading arrangements with various countries (including both EU and US). No other countries appear to have such strong preferential trading status with large developed economies. Sub-Saharan African countries (with the exception of South Africa) were excluded on the grounds of their potential for political and military instability. A sample of other developing countries was chosen because the cross-country correlation of their stock returns is generally lower than is the case for developed countries, despite increasing in recent years and varying with market conditions (Hyde, Bredin and Nguyen, 2007).
To be included market index returns had to be available in $US. Data were collected from DataStream (Thomson Financial ltd.) for FTSE country indices for 13 developed, 6 advanced-emerging and 12 emerging countries (DataStream country classification). The indices were transformed from local currency into US$ using the Datastream conversion option that applies the closing exchange rate3 on the observation day. A five-year sample of monthly data, February 2004 to February 2009, (61 observations) was partitioned by the onset of the financial crisis in June 2007. The sample of countries, their classification by stage of market development, the Datastream code for the FTSE index used and their equity index mean returns and standard deviations are given in Table 1. Mean returns and their standard deviations for each sample group are shown in Table 2.
During both periods the ranking of risk is the same for the sample groups: developed countries overall have the lowest standard deviation and emerging countries the highest. Developed countries also show the lowest overall return in both periods. For individual countries, in the pre-crisis period, returns range from 4.69% for Egypt to 0.74% for the US, while risk ranges from 2.54% for the US to 9.87% for Columbia. During the crisis, returns range from -.04% for Colombia to -7.54% for Ireland, while risk ranges from 6.12% for Japan to 17.7% for India.
Every country has negative returns in the crisis period, falling from a monthly average of 2.26% pre-crisis to -3.19%, revealing the enormous pressure of the crisis on the global economy. In the crisis period Columbia has the highest mean return by a very large margin and a relatively low level of risk (6th lowest out of 31), followed at a distance by Israel with the second-highest return and the second-lowest risk. The US, unsurprisingly, performs badly in this period with a mean monthly loss of -3%. Disaggregated data (not shown) reveal that from September 2008 the mean monthly return for the US plummets to -7.75% (the crisis intensifies into serious bank losses – for example, Bear Stearns (sold to Morgan Chase), Merrill Lynch (sold to Bank of America), Lehman Bros.(broken up and sold) all disappear, while Fannie Mae (placed into conservatorship)Freddie Mac (placed into conservatorship), Citigroup and Bank of America receive government aid).
The 3-month US Treasury Bill was chosen as a risk-free asset, used to identify Sharpe ratios (giving the empirical capital market line and optimal portfolio for each portfolio frontier). The risk-free rate at the beginning of each period was chosen for this purpose, since in a static mean-variance model the investor makes once-and-for-all investment choices (including borrowing and lending) at the beginning of the investment period. Data were collected from The Board of Governors of the Federal Reserve System and converted to one-month rates of 0.8% (pre-crisis) and 3.8% (crisis).
5. RESULTS
5.1. Pre-Crisis Results
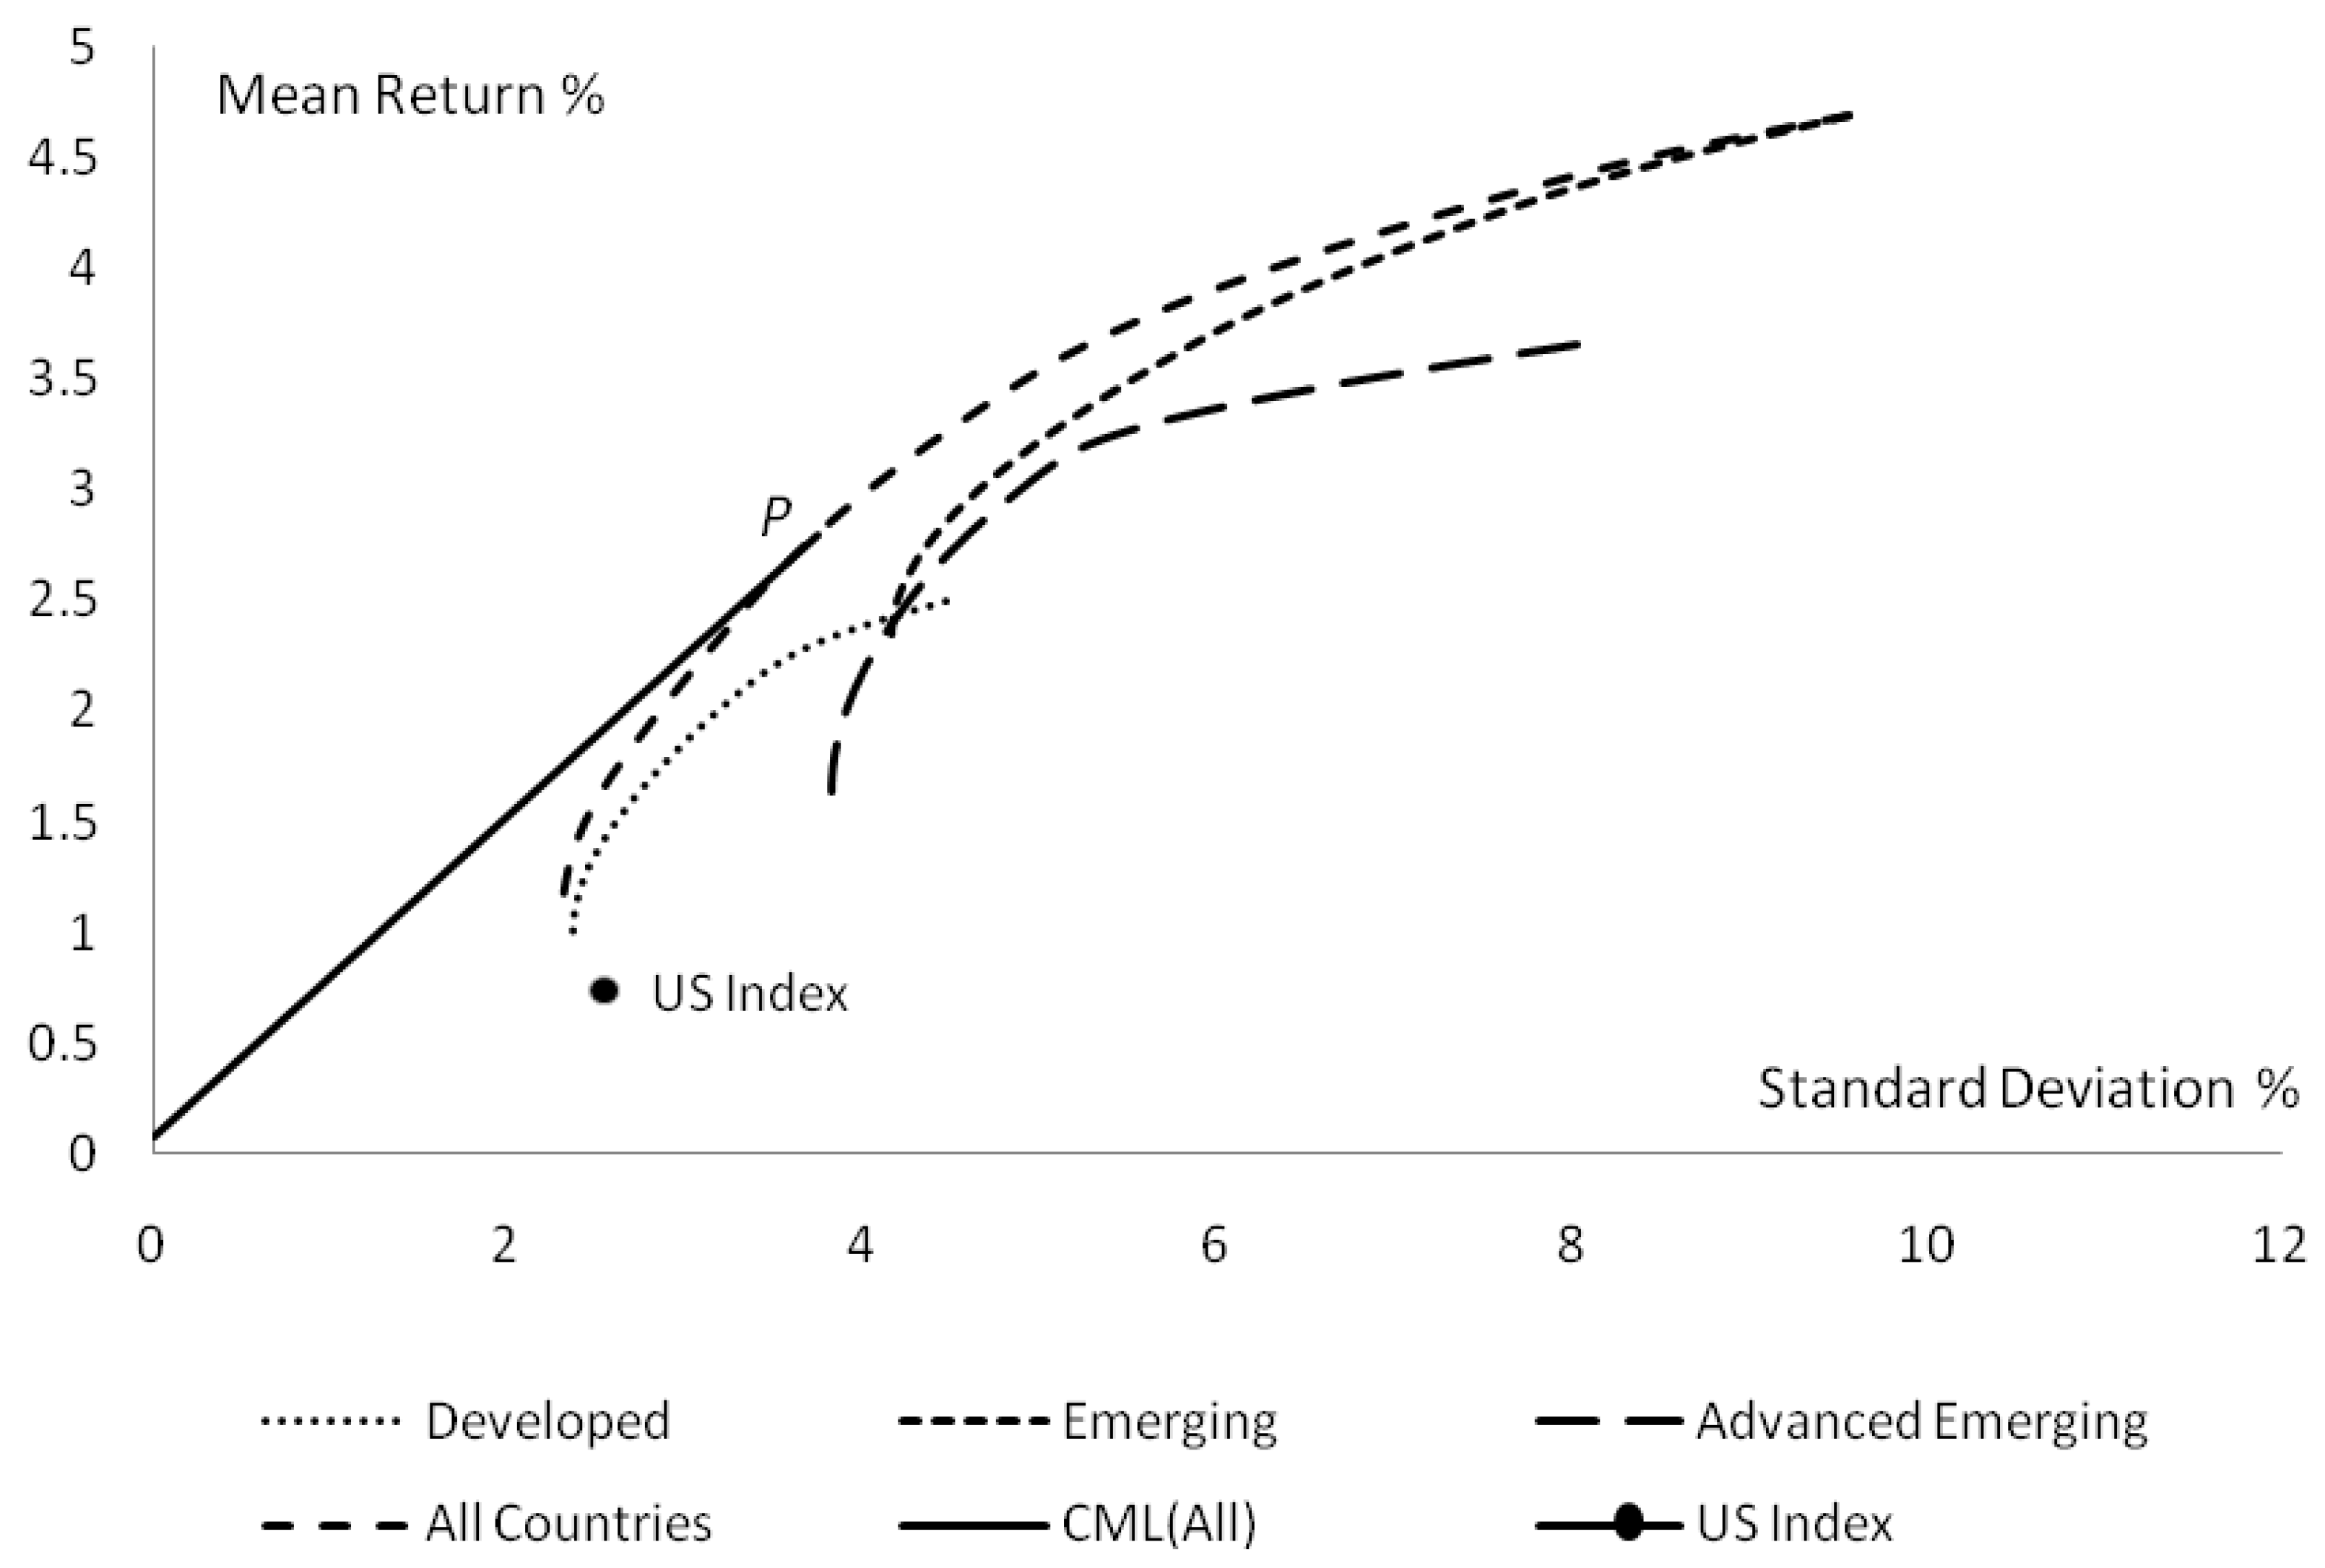
The gains from international portfolio diversification in the pre-crisis period are displayed in Figure 1 and Table 3. Note that the US is depicted as a mean-variance reference point in Figure 1. In Table 3 the optimal portfolios of risky assets are ranked according to their Sharpe ratios.
As expected, Figure 1 and Table 3 show that the pre-crisis gains from international diversification are maximized by choosing from the widest sample of countries – the All-Country optimal portfolio has the highest Sharpe ratio. Note that the Sharpe ratio (the capital market line) is shown only for the All-Country sample in Figure 1. Analogous lines for the subsamples are excluded for reasons of clarity.
The short selling constraint means that only 7 of the 31 countries sampled were assigned positive weights for this optimal portfolio. This may seem a small number but it is not an unusual finding when short selling is restricted and a few indices are dominant. In the case of unrestricted short selling, all countries would be represented in every optimal portfolio, but the short selling constraint removes all negatively weighted indices and creates ‘corner portfolios’ on the frontier (where the number of included indices may jump by an integer). Table 4 displays these countries and their investment weights in the optimal portfolio while Table 5 shows the correlation matrix of the index returns.
In view of the crisis period results (to be discussed below) it is interesting that Colombia has no weight in the pre-crisis optimal portfolio. Prior to the crisis, Colombia was the most risky country and offered little scope for diversification, but the collapse of other stock markets and increase in co-movement was apparently less marked for Colombia during the crisis. Hence Colombia emerges as a safe haven in the crisis but not as a safe haven in general.
It should also be remembered that the short-selling constraint was applied to the optimisation procedure so as to inject a degree of realism into the results. While unrestricted short selling would lead to very different weights it is highly unlikely that any of the resulting negative portfolio weights would be actually achievable.
We note that the US is excluded from the optimal portfolio of the All-Country frontier. This can be attributed to a low US average return (0.7%) and high correlations between the US and almost every country in the sample. Hence, despite the low risk accruing to US investment in the pre-crisis period, the inclusion of the US appears neither to increase the return nor reduce the risk of the optimal portfolio. The gains from international diversification are therefore very large for a US investor, with a potential increase of 181% in return per unit of risk made available by shifting from domestic investment (Sharpe ratio of 0.26) to the All-Country optimal portfolio (Sharpe Ratio of 0.73). Interestingly, the diversified portfolio of emerging market indices outperforms the internationally diversified portfolio for both the developed and advanced-emerging subsamples. Hence it is clear that in the pre-financial crisis period the potential gains arising from investment in emerging countries were substantial.
5.2. Crisis Period Results
The pattern of unconditional cross-country correlations between monthly returns confirms the observations of other writers. The full correlation tables are too large to be displayed here but we can report that the average pre-crisis correlation of 0.475 (all 31 countries) rises to 0.694 for the crisis period.
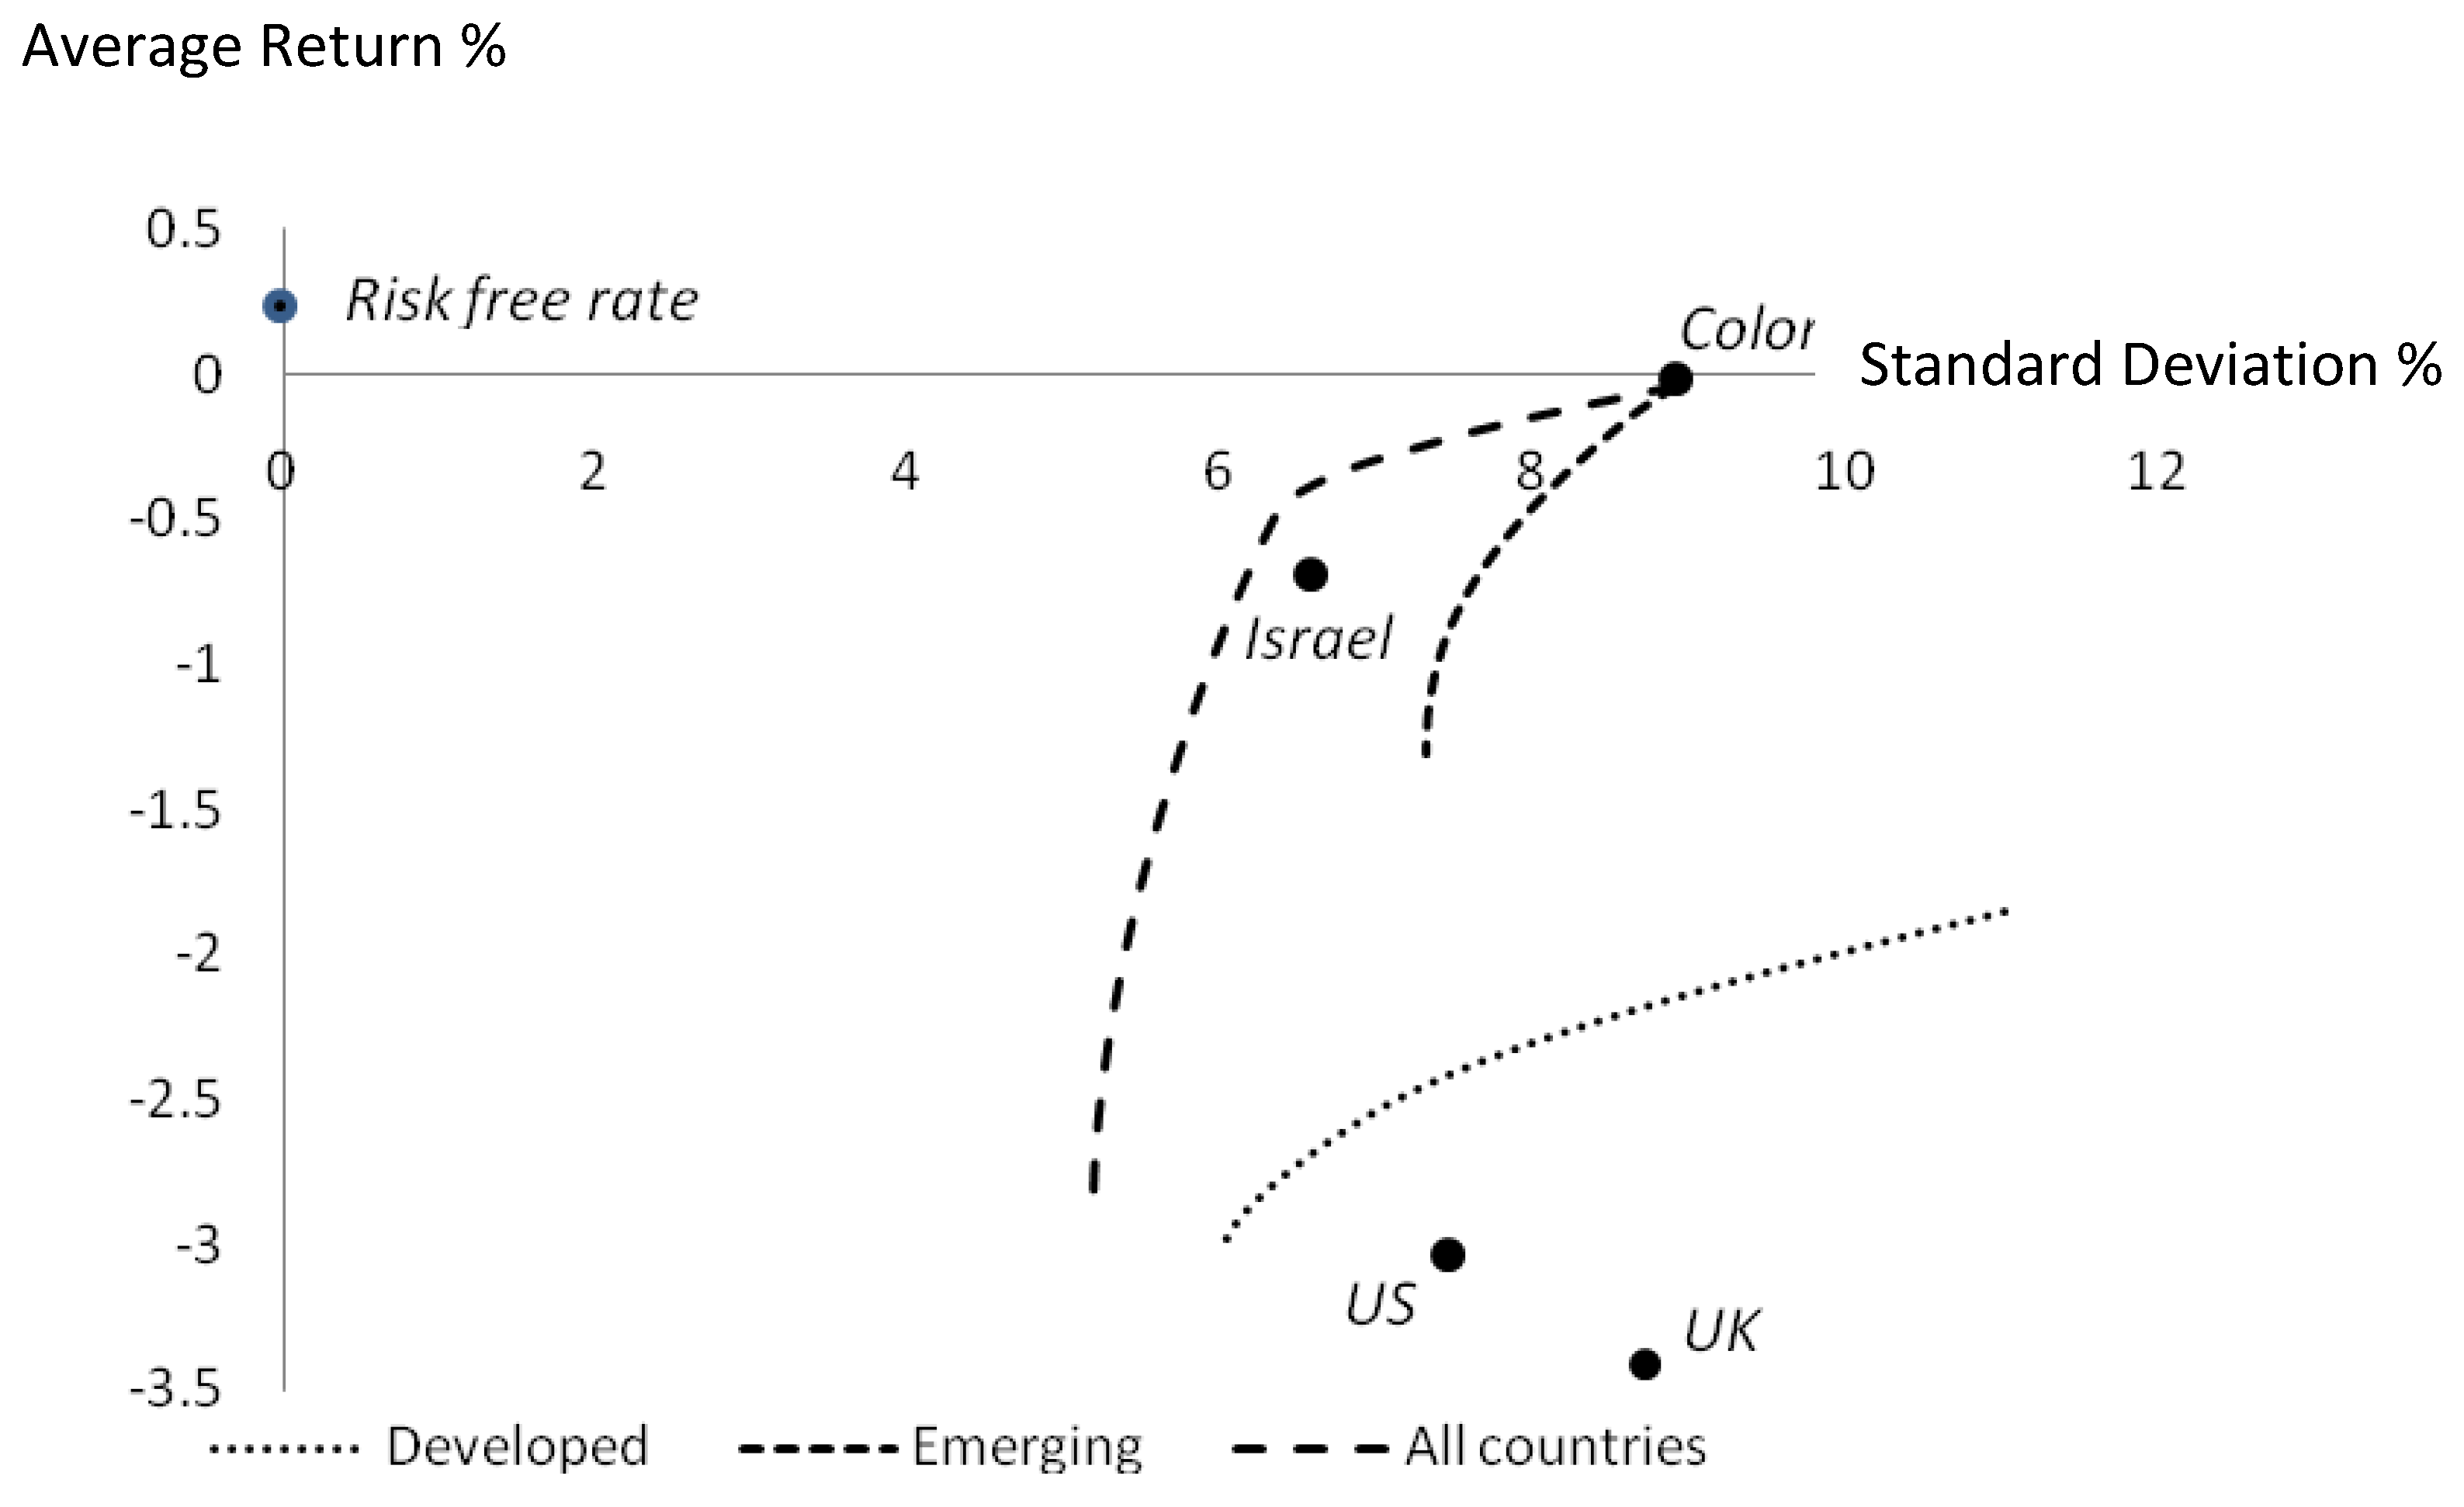
Figure 2 displays the impact of the crisis on the global financial system. With short sales prohibited, no combination of equity indexes can produce a positive return (every efficient frontier lies beneath the horizontal axis). The efficient frontier for the advancedemerging countries is a single point, representing a 100% weighting in Israel (which has a substantially lower standard deviation than other countries of the sample group – of course, a larger sample of countries might have yielded positive weights on other countries).
It is clear that developed countries experienced the worst effects of the financial crisis, since the efficient frontier for these countries lies below all the other efficient frontiers. Furthermore, the US mean-variance point lies well below the developed country efficient frontier (considering the role of the US in the financial crisis this is unsurprising). The slight kink in the All-Country frontier is a product of the short-selling constraint and reflects a jump from two to three indices with positive weights. Notably, Colombia has the highest mean return.
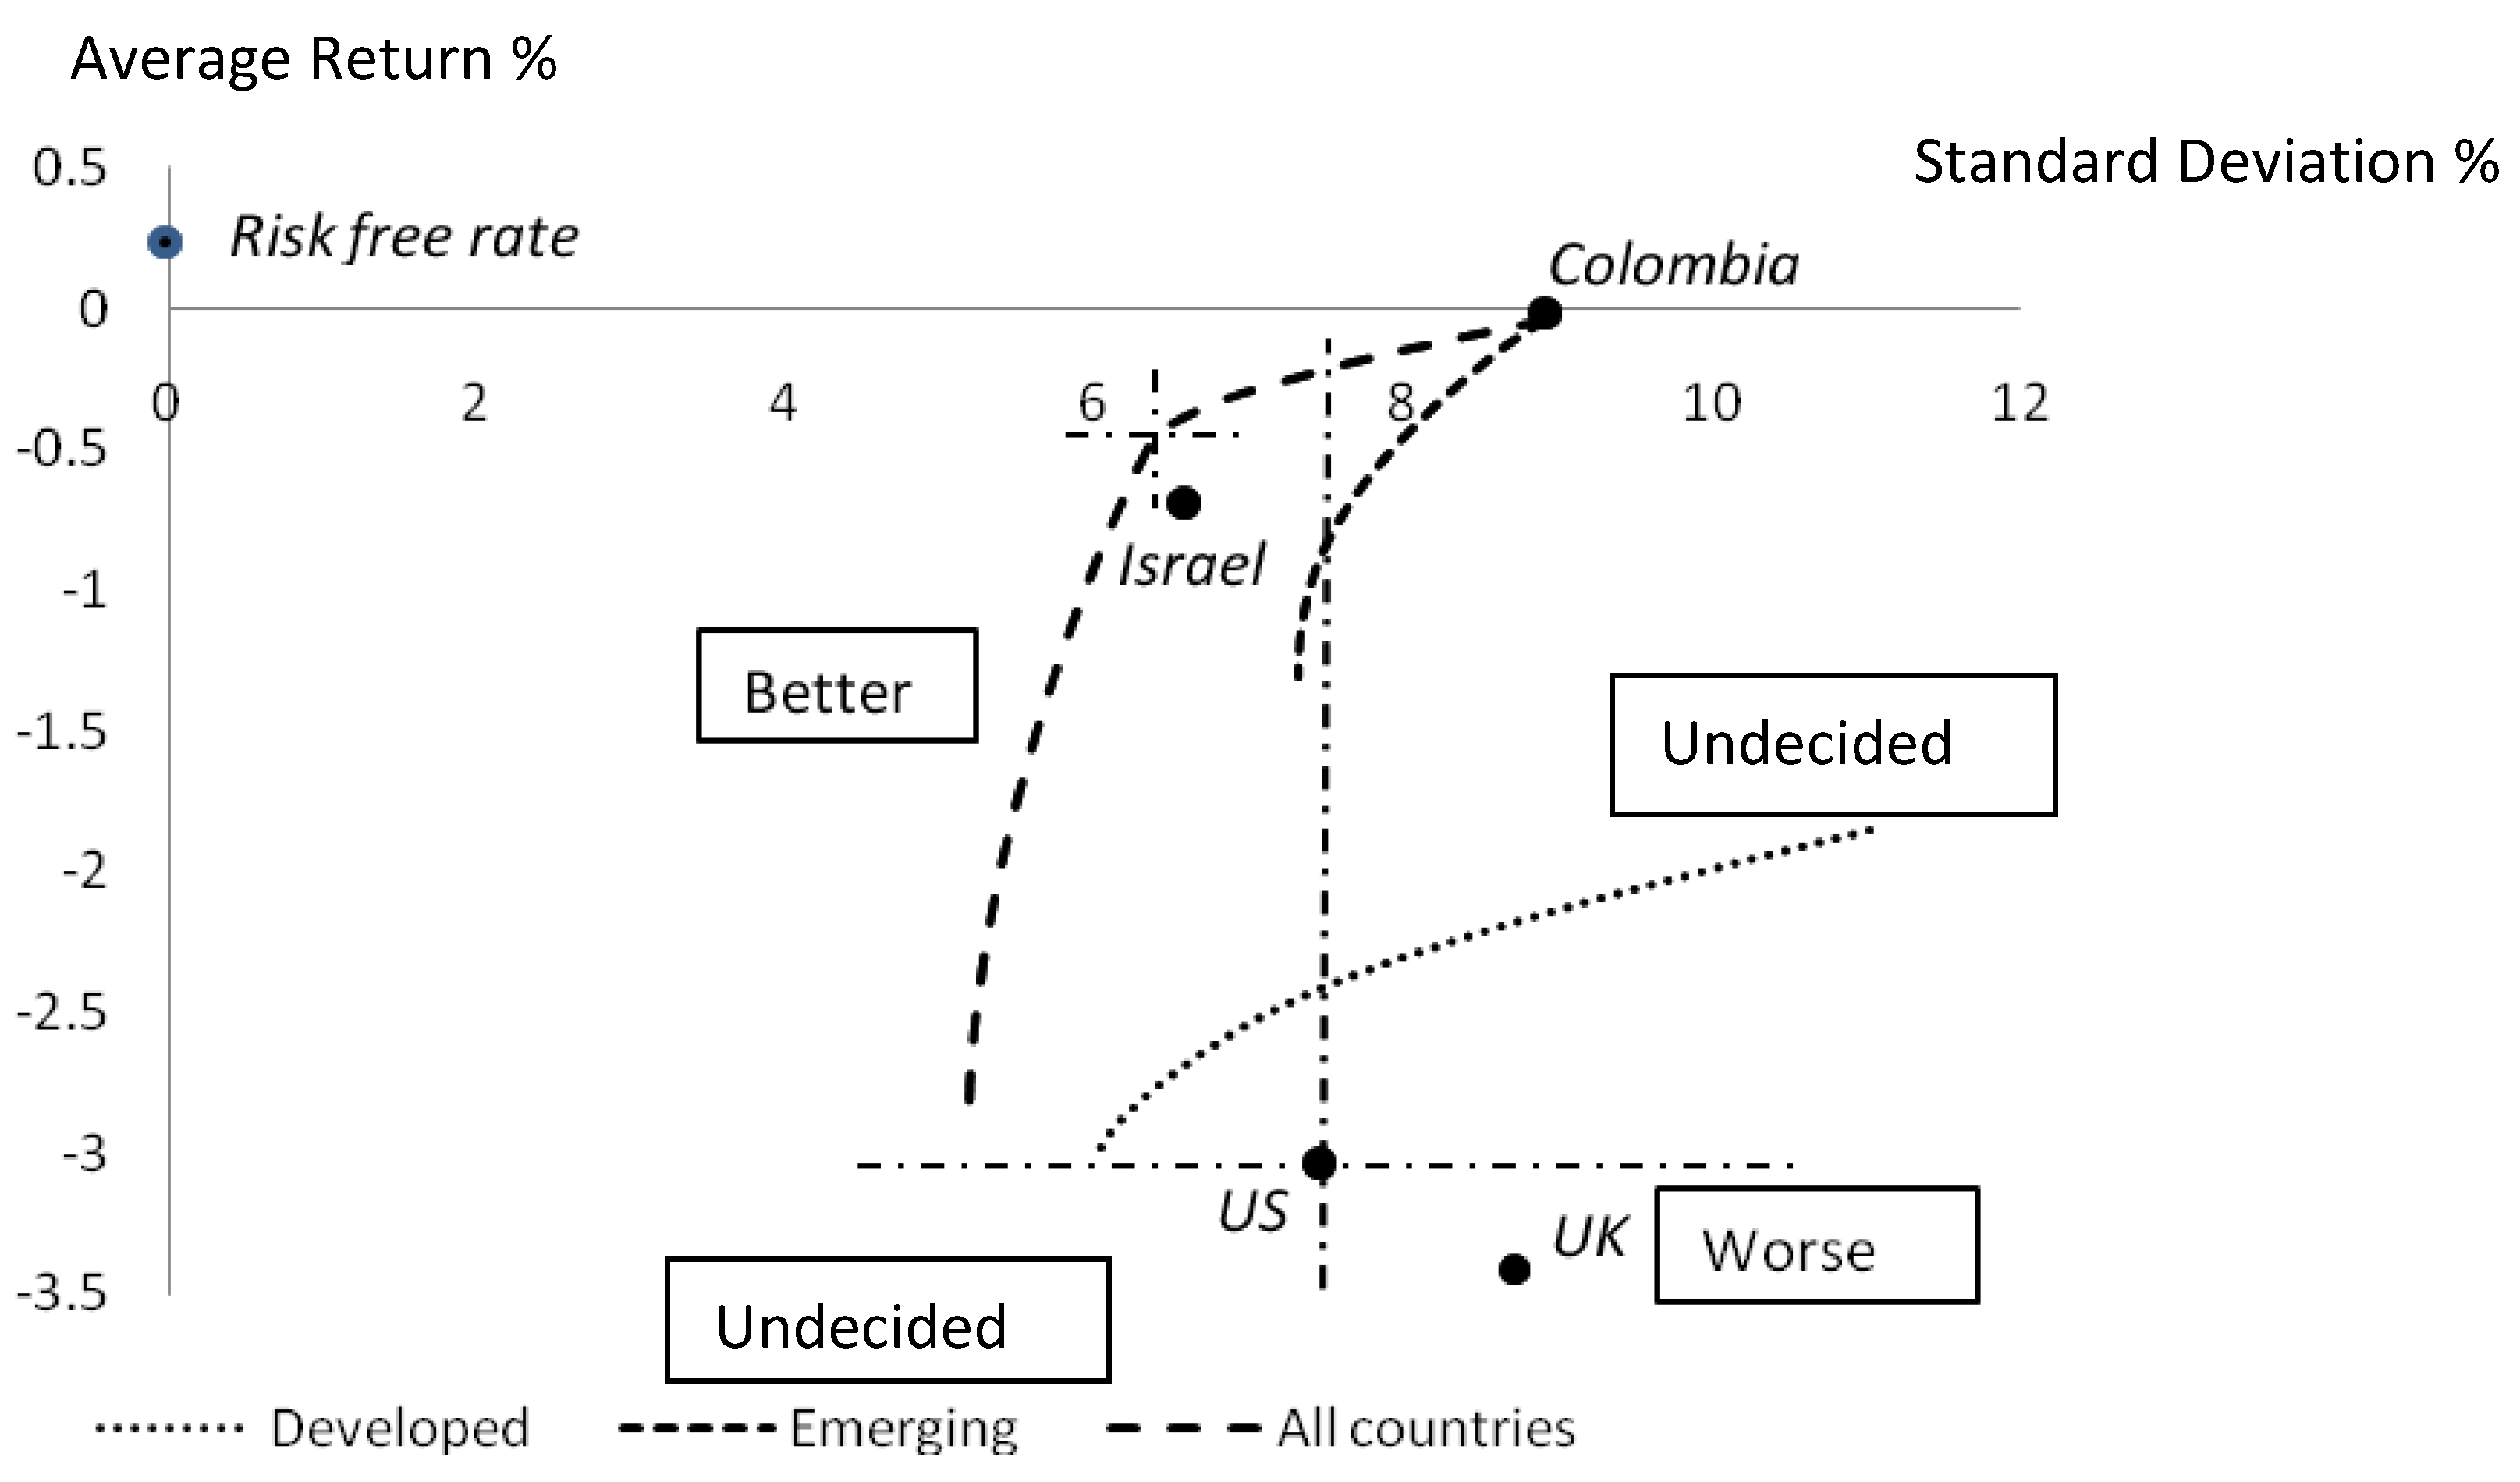
Sharpe Ratio analysis is not possible when the ratios are negative, as is the case here, so a quadrant analysis is used instead. Figure 3 shows the potential diversification benefits for a US investor.
In Figure 3 it is evident that segments of every efficient frontier lie in the ‘Better’ (lower risk and higher return) quadrant with respect to a US investor. The exact position of an optimal portfolio for a given investor is determined by their degree of risk aversion but clearly it lies on the All-Country efficient frontier – a potential optimal portfolio is shown that has a 74% weighting on Colombia and a 26% weighting on Israel (depending on risk aversion, an optimal portfolio of risky assets in the ‘Undecided’ quadrant is also possible). Evidently there are gains from international diversification during the crisis, even though investment returns are negative.
Applying a similar analysis for a Colombian investor (not shown in the figure) would reveal that there is no necessary gain from international diversification since all efficient frontiers lie in the ‘Undecided’ or ‘Worse’ quadrants. There is no other portfolio displaying both a higher return and lower risk than the Colombian portfolio but Colombian investors displaying higher degrees of risk-aversion might find some benefit from further diversification.
Notably, from the point of view of either a US or Colombian investor the optimal investment strategy implied by this particular analysis could be to invest in Colombia alone! This result is so sharp that we would be surprised if it were not robust across different techniques for estimating means, variances and covariances, and for different country samples. By this we do not imply that this would necessarily be a sensible realworld investment strategy, rather that the mean-variance diagnosis of the crisis reveals Colombia to have very strong and almost unique ‘safe haven’ properties in the analysis.
6. DISCUSSION: CHARACTERISTICS OF AN EFFICIENT FRONTIER PORTFOLIO IN THE CRISIS PERIOD
Colombia and Israel experienced respective mean monthly losses of -0.04% (close to zero) and -0.67% in the crisis period, when the average mean monthly loss of other countries was -3.19%, so while they do not emerge from the crisis unscathed they suffer far less. With respect to risk, measured by standard deviation of returns, both countries became relatively much less risky in the crisis period, Israel falling in risk from 18th to become the 2nd-safest out of the 31 countries, Colombia falling from the most risky country to 6th-safest. As would be expected, both Colombia and Israel have relatively low correlations with other countries (average correlations of 0.63 and 0.65 respectively, being the 3rd- and 4th-lowest of all 31 countries). Interestingly, Pakistan has the lowest average correlation by a very wide margin and appears to be almost uncorrelated with any other country (average correlation of 0.074) but also has the 7th-lowest average monthly return (-4.39%) and the 3rd-highest variance (15.8%) of all 31 countries, and is therefore dominated in the analysis. The optimisation procedure selects Colombia and Israel because, in the absence of short selling, their average return and covariance characteristics together mean that they dominate the optimal portfolios of any investor. That is, they can be characterised as ‘safe havens’ during the crisis.
We also observe that, while banks around the world struggled, Colombia’s banking industry appeared to be thriving:
“While more and more banks around the world seek state bailouts, Colombia's largest bank voted on Monday to give shareholders a bigger share of last year's record net profit, and announced new investments. Bancolombia BIC.CN(CIB.N) shareholders approved a 9.9 percent increase in their yearly dividend at the bank's annual meeting.” (Reuters March 2009).
We speculate that the emergence of Israel and Columbia as safe havens is the result of the special characteristics of these economies.
Israel has favored trading status with many countries, including free trade agreements with Canada (implemented 1 January 2007) and the US (implemented 1 September 1985), and an Association Agreement with the EU (implemented 1 June 2000) and receives substantial revenues from non-resident citizens. As a small economy with ‘niche’ markets, Israel appears therefore to be relatively better-protected against crisis than other countries. This raises issues of fundamental importance for policy makers, with strong implications in any climate in which trade protection for Israel might become subject to political debate. In particular, a weakening of trade links might expose Israel to significantly greater risk from events in financial markets. The existence of preferential trading arrangements may not lead per se to inelastic demand for Israeli products, but may certainly facilitate it, given potentially loyal markets. We speculate that a particular reason for the strength of Israel lies in ‘diaspora support’ – that is, the international Jewish community shows a loyalty to Israel that may exceed that for any other ex-patriot group. The notion that diaspora may have economic significance in trade was suggested in seminal work by Rauch and Trindade (2002) for China and more recently by Felbermayr and Flach (2009) for Israel. The idea has been developed further with respect to financial investment by Leblang (2010) who argues that transactions costs of investment are reduced by greater cultural ties, familiarity and home preference, by the emigrant population, noting that “New Zealand, Ireland and Israel all have well-developed diaspora engagement strategies designed to encourage economic behavior on the part of their external citizens” (p. 588). Unfortunately, while Leblang finds that diaspora networks contribute significantly to both portfolio investment and foreign direct investment, his results are not disaggregated and do not allow comparisons between Israel and other countries. We know of no work on the subject of diaspora home preference at times of crisis but agree with Leblang (2010) that this is a possible area for fruitful research.
In any event, the impact of Israel in our results is rather smaller than that of Colombia. The latter is more notably associated with illegal cocaine production and export than with any other economic sector. Proof is hard to find, but a potential reason for Colombia’s relative immunity to the financial crisis may lie in the degree to which revenue from Colombian cocaine exports has been isolated from negative shocks to world consumption. This is a multi-billion dollar industry estimated by the US Drug Enforcement Administration (2009) to be largely controlled by Colombia (around 55% of the world supply – a declining but still major supplier to the US). The Central Intelligence Agency (2009) estimates that a large proportion of the proceeds are either laundered or invested in Colombia through the Black Market Peso Exchange. Recent work (Brombacher and Maihold, 2009) suggests that while there has been a decline in Colombian cocaine exports to the US there has been a partially compensating increase in exports to Europe. These authors also note that eradication programs in Colombia, rather than forcing a reduction in supply, have forced producers to respond by rapid changes in the location of cultivation. According to the World Drug Report of the United Nations Office on Drugs and Crime (UNODC, 2009), in 2008 Colombia controlled around 51% of world cocaine supply in metric tons, reflecting fall in potential cocaine production in 2008 to 430 tons from a fairly stable average of about 616 tons from 2000 to 2007. However, the report also notes an increase in the ‘mean purity adjusted price’ from around $100 per gram in 2005 to around $200 per gram in mid 2008 with around 80% of that increase occurring since 2007 (p.72).
Clearly, Colombia has been hurt since 2007, both by the crisis and by increased efforts at drug enforcement in the US. However, despite a 27% fall in Colombian cocaine production in 2008 (UN News Centre, 2009) it is hard to avoid the speculation that the proceeds of the illicit drug trade in Colombia are filtering through to the Colombian economy and acting as a buffer against global financial crisis conditions. Therefore it would not be unreasonable to suggest that Colombia’s relative economic success throughout the financial crisis is closely related to its large involvement in the illicit drug trade. What is surprising is that the effect, if such it is, is sufficiently strong in a simple mean-variance analysis to reveal Colombia as a ‘safe haven’ for international diversification at a time of global financial crisis. Where incentives exist, funds will follow, so the potential benefit of investing in Colombian securities raises a question with fundamental policy significance. Under the law of unintended consequences, would such investment give further indirect support to the cocaine industry, and to international money laundering, or would it encourage investment in alternative industries?
The analysis here has admittedly used a restricted sample of countries and we therefore do not wish to push the results too far. In particular, we need to know whether other safe havens would emerge from a wider sample and whether there are any barriers to capital flows that could reduce the ability of investors to make safe-haven investments – in this case Colombia (Israel floated the shekel freely in 2003 and has few capital controls).
First, given the strength of these results we would be surprised if wider sampling removed the observed safe haven status of Colombia and Israel; rather we wonder if other countries might also qualify. Our results therefore strongly suggest that it might be fruitful to search in particular for countries with preferential trading status (maybe with loyal ‘diaspora’ markets) or industrial production concentrated in output with inelastic world demand.
Second, already significant capital controls in Colombia were strengthened in May 2007 and again in 2008, requiring first 40% and then 50% of portfolio investments to be held as medium term deposits in the Colombian central bank. These increased control measures were introduced in response to perceived short-term capital inflows and appreciation of the Peso during the crisis. While controls may restrict opportunities for investment in normal times, this evidence suggests that may not be a serious issue in times of crisis. Although we can assume that the deterrent effect of such controls on international investment is high at ‘normal’ times, in particular because of barriers to quick withdrawal of capital for normal portfolio balancing, this deterrent effect may be substantially reduced when alternative international investments are in uniform danger of very serious and sustained loss. Thus, smaller economies with capital controls are more likely to be excluded from international investment portfolios at normal times (when free movement of capital is essential) even where they are less integrated/correlated with global markets, but their relative desirability may increase at times of crisis. Finally we observe that the search for safe haven countries has to be judged with respect to other risks than capital control (in particular political and military instability) but a complete analysis of all risks in all possible countries is beyond the scope of this paper.
7. SUMMARY AND CONCLUSION
In this paper we examine the possibility that particular countries could emerge as ‘safe havens’ for international investors during a period of crisis, looking at the recent global financial crisis in particular. An important reason for the identification of ‘safe havens’ lies in the observation that benefits to international diversification can be sharply reduced during times of crisis, because of an increase in international stock price co-movement (an increase in the cross-country correlation of stock returns), potentially made worse by recent trends towards financial globalisation. We argue that a ‘safe haven’ country is one whose GDP (and hence domestic stock prices) would be relatively unaffected by shocks to world consumption. We use a standard mean-variance optimisation procedure with constraints on short selling to derive efficient portfolio frontiers based on monthly returns to $US-denominated market indices of 31 developed, advanced-developing and developing stock markets.
The results show ‘text-book’ international diversification opportunities in the precrisis period from 02/2004 to 05/2007 but a disjunction between stock and bond markets in the crisis period from 06/2007 to 02/2009. The average unconditional cross-country correlation rose, as expected, from 0.475 pre-crisis to 0.694 post-crisis. Two ‘safe-haven’ countries emerge for the crisis period, Colombia and (to a lesser extent) Israel. These countries have both the highest returns and almost the lowest correlations with other countries during the crisis period and are likely to be the only countries selected for the efficient portfolio of a $US investor. We argue that Israel may be protected by special trade arrangements, ‘diaspora support’ and the willingness of non-resident citizens to repatriate income and that Colombia may be protected by a relatively low response of cocaine revenue to changes in world income.
ACKNOWLEDGEMENTS
The authors are indebted to Tom Weyman-Jones for his invaluable comments on an earlier draft of this paper and to an anonymous referee for further insightful comments. Errors of course remain our own.
References
- D. Brombacher, and G. Maihold. The Transatlantic Cocaine Business: Europe’s Options as it Confronts New Drug Trafficking Routes. WP 45/2009; Madrid: Real Instituto Elcano, 2009. [Google Scholar]
- Central Intelligence Agency. “The World Factbook.” 2009. https://www.cia.gov/library/publications/the-world-factbook/fields/2086.html. [Google Scholar]
- V. DeMIguel, L. Garlappi, and R. Uppal. “Optimal Versus Naïve Diversification: How Inefficient is the 1/N Portfolio Strategy.” The Review of Financial Studies 22, 5 (2009): 1915–1953. [Google Scholar] [CrossRef]
- C.B. Erb, C.R. Harvey, and T.E. Viskanta. “Forecasting International Equity Correlations.” Financial Analysts Journal 50 (1994): 32–45. [Google Scholar] [CrossRef]
- S.L. Heston, and K.G. Rouwenhorst. “Does Industrial Structure Explain the Benefits of International Diversification.” Journal of Financial Economics 36 (1994): 3–27. [Google Scholar] [CrossRef]
- S.J. Hyde, D.P. Bredin, and N. Nguyen. “Correlation Dynamics Between AsiaPacific, EU and US Stock Returns, Munich Personal RePEc archive.” 2007. http://mpra.ub.unimuenchen.de/9681/.
- G. Felbermayr, and L. Flach. “Networks and Trade, Evidence from the Jewish Diaspora.” In paper presented to the 24th Annual Congress of the European Economics Association, Barcelona, 2009.
- D. Fylstra, L. Lasdon, J. Watson, and A. Waren. “Design and Use of the Microsoft Excel Solver.” Interfaces 28 (1998): 29–56. [Google Scholar] [CrossRef]
- L.S. Lasdon, A.D. Waren, A. Jain, and M. Rather. “Design and Testing of a Generalized Reduced Code for Nonlinear Programming.” ACM Transactions on Mathematical Software 4 (1978): 34–50. [Google Scholar] [CrossRef]
- D. Leblang. “Familiarity Breeds Investment: Diaspora Networks and International Investment.” American Political Science Review 104, 3 (2010): 584–600. [Google Scholar] [CrossRef]
- H. Levy, and M. Sarnat. “International Diversification of Investment Portfolios.” American Economic Review 60 (1970): 668–675. [Google Scholar]
- F. Longin, and B. Solnik. “Is the Correlation of International Equity Returns Constant: 1960-1990.” Journal of International Money and Finance 14 (1995): 3–26. [Google Scholar] [CrossRef]
- F. Longin, and B. Solnik. “Extreme Correlation of International Equity Markets.” Journal of Finance 56 (2001): 649–676. [Google Scholar] [CrossRef]
- H.M. Markowitz. “Portfolio Selection.” Journal of Finance 7 (1952): 77–91. [Google Scholar] [CrossRef]
- K. Phylaktis, and L. Xia. “Equity Market Comovement and Contagion: a Sectoral Perspective.” Financial Management 38 (2009): 381–409. [Google Scholar] [CrossRef]
- D.P. Quinn, and H.J. Voth. “Disappointing Diversification – Why Reducing Risks through Cross-Border Investment has not Lived up to Expectations, VOX comment.” 2008. http://www.voxeu.org/index.php?q=node/2520.
- J.E. Rauch, and V. Trindade. “Ethnic Chinese Networks in International Trade.” Review of Economics and Statistics 84, 1 (2002): 116–30. [Google Scholar] [CrossRef]
- F.K. Reilly, and K.C. Brown. Investment Analysis and Portfolio Management (eighth edition). Mason Ohio: Thomson South-Western, 2006. [Google Scholar]
- “Reuters.” 2009. http://uk.reuters.com/article/idUKN0243365820090302.
- H.A. Shawky, R. Kuenzel, and A.D. Mikhail. “International Portfolio Diversification: a Synthesis and an Update.” Journal of International Financial Markets, Institutions and Money 7 (1997): 303–327. [Google Scholar] [CrossRef]
- B.H. Solnik. “Why not Diversify Internationally Rather than Domestically.” Financial Analysts Journal 20 (1974): 48–54. [Google Scholar] [CrossRef]
- J. Tavares. “Economic Integration and the comovement of Stock Returns.” Economics Letters 103 (2009): 65–67. [Google Scholar] [CrossRef]
- United Nations. “News Centre.” 2009. http://www.un.org/apps/news/story.asp?NewsID=31200&Cr=Colombia&Cr1=&Kw1=Colombia&Kw2=&Kw3.
- “UNODC World Drug Report.” 2009. http://www.unodc.org/unodc/en/data-and-analysis/WDR-2009.html.
- US Drug Enforcement Administration. “National Drug Threat Assessment.” 2009. http://www.justice.gov/ndic/pubs31/31379/31379p.pdf. [Google Scholar]
Notes
- 1The FTSE100 is a value-weighted index of the leading 100 UK shares by market capitalisation, jointly created by the Financial Times and the London Stock Exchange.
- 2The Sharpe ratio for portfolio p is defined by (see Reilly and Brown, 2006, for an introduction). This is a commonly-used measure of portfolio performance in which the average portfolio return in excess of a risk-free rate of return is adjusted for portfolio risk (excess return to variability). Here we maximise the Sharpe ratio to find the asset weights of the tangency portfolio of the empirical capital market line.
- 3The conversion function in Datastream uses cross rates (conversion through the British pound: Peso/Pound – Pound/Dollar) rather than direct conversion (Peso/Dollar) using WMReuters historical rates, since data coverage is more thorough.
Figure 1.
Pre-Crisis Portfolio Frontiers by Sub-Sample of Countries
Notes:
- The US point provides the risk-return combination for the US equity index.
- Portfolio P is the optimal risky portfolio for diversification over all countries.
- The solid line is an empirical capital market line depicting the efficient frontier for all-country diversification, with a slope equal to the Sharpe ratio of portfolio P (the all-country Sharpe ratio).
- Efficient frontiers for sub-sample diversification are not shown for reasons of clarity, but the relevant Sharpe ratios are shown in Table 3.
Figure 2.
Post-Crisis Efficient Frontiers
Notes
- The advanced emerging efficient frontier consists of a single point – Israel
- Sharpe ratios are all negative and cannot be used to identify preferred portfolios. The locations of the UK and US markets are given for comparison.
Figure 3.
Benefits from International Diversification – US Investors
Notes:
- A US investor would definitely prefer to invest in the ‘Better’ quadrant, such as at the all-country frontier portfolio indicated, rather than in a purely domestic portfolio, but could also choose an all-country frontier portfolio from the ‘Undecided’ quadrant, depending on their degree of risk aversion.
- A similar quadrant analysis can be preformed for an investor from any other country.

| Pre-crisis February 2004 to May 2007 | Crisis Period June 2007 to February 2009 | |||||
|---|---|---|---|---|---|---|
| Country | Datastream FTSE Index code | DataStream Classification | Mean (%) | SD (%) | Mean (%) | SD (%) |
| Argentina | WIDNMKL~U$ | Emerging | 2.92 | 9.53 | -3.34 | 15.19 |
| Austria | WIEGYTL~U$ | Developed | 2.57 | 4.82 | -6.26 | 13.04 |
| Brazil | WIFRNCL~U$ | Adv. Emerg. | 3.65 | 8.02 | -0.90 | 16.58 |
| Chile | WIWGRML~U$ | Emerging | 1.99 | 4.57 | -1.04 | 10.53 |
| China | WIHGKGL~U$ | Emerging | 2.56 | 5.96 | -1.06 | 15.17 |
| Colombia | WIHUNGL~U$ | Emerging | 3.64 | 9.78 | -0.04 | 8.93 |
| Czech Rep. | WIINDNL~U$ | Emerging | 3.56 | 7.15 | -1.64 | 13.21 |
| Denmark | WIIDIAL~U$ | Developed | 1.88 | 3.84 | -2.54 | 10.73 |
| Egypt | WIEIREL~U$ | Emerging | 4.69 | 9.57 | -3.81 | 11.66 |
| France | WIISRLL~U$ | Developed | 1.53 | 3.45 | -3.57 | 9.28 |
| Germany | WIJPAN$~U$ | Developed | 1.76 | 4.23 | -3.28 | 10.76 |
| Hong Kong | WIKOREL~U$ | Developed | 1.52 | 4.01 | -1.85 | 11.02 |
| Hungary | WIMXCOL~U$ | Emerging | 3.39 | 9.26 | -5.61 | 15.34 |
| Indonesia | WINETHL~U$ | Emerging | 2.79 | 8.80 | -2.32 | 15.00 |
| India | WIPAKIL~U$ | Emerging | 2.22 | 7.34 | -4.84 | 17.70 |
| Ireland | WIPLNDL~U$ | Developed | 1.56 | 4.45 | -7.54 | 10.60 |
| Israel | WIRUSSL~U$ | Adv. Emerg. | 1.21 | 4.77 | -0.67 | 6.66 |
| Japan | WISNGPL~U$ | Developed | 1.18 | 5.12 | -3.08 | 6.12 |
| Korea | WISWDNL~U$ | Adv. Emerg. | 2.38 | 7.44 | -3.25 | 14.94 |
| Mexico | WISWITL~U$ | Adv. Emerg. | 3.14 | 5.12 | -3.17 | 13.82 |
| Netherlands | WITAIWL~U$ | Developed | 1.49 | 3.82 | -4.03 | 10.42 |
| Pakistan | WIUTDKL~U$ | Emerging | 2.30 | 7.42 | -4.39 | 15.77 |
| Poland | WIUSAML~U$ | Emerging | 3.22 | 8.71 | -4.57 | 15.52 |
| Russia | WISAFRL~U$ | Emerging | 2.66 | 8.62 | -3.91 | 16.51 |
| Singapore | WIDNMKL~U$ | Advanced | 2.02 | 3.48 | -3.30 | 10.50 |
| Sweden | WIEGYTL~U$ | Advanced | 1.95 | 4.60 | -4.41 | 10.19 |
| Switzerland | WIFRNCL~U$ | Advanced | 1.29 | 3.26 | -2.76 | 6.66 |
| Taiwan | WIWGRML~U$ | Adv. Emerg. | 0.77 | 6.12 | -3.24 | 9.33 |
| UK | WIHGKGL~U$ | Developed | 1.18 | 2.95 | -3.72 | 8.67 |
| United States | WIHUNGL~U$ | Developed | 0.74 | 2.54 | -3.0 | 7.45 |
| South Africa | WIINDNL~U$ | Adv. Emerg. | 2.42 | 6.76 | -1.77 | 14.30 |
| Pre-Crisis February 2004 to May 2007 | Crisis Period June 2007 to February 2009 | |||
|---|---|---|---|---|
| Country Grouping | Mean % | SD % | Mean % | SD % |
| Developed | 1.59 | 3.89 | -3.80 | 9.65 |
| Advanced Emerging | 2.26 | 6.37 | -2.17 | 12.60 |
| Emerging | 2.99 | 8.06 | -3.05 | 14.21 |
| All Countries | 2.26 | 5.99 | -3.19 | 11.99 |
| Ranking | Sharpe Ratio | SD (%) | E(R) (%) | No of Countries in Optimal Portfolio |
|---|---|---|---|---|
| All-Country | 0.73 | 3.75 | 2.80 | 7 |
| Emerging | 0.63 | 4.85 | 3.13 | 5 |
| Developed | 0.61 | 3.43 | 2.17 | 4 |
| Advanced-Emerging | 0.60 | 5.01 | 3.07 | 2 |
| US | 0.26 | 2.54 | 0.74 | 1 |
| Country | Country Group | Weight (%) |
|---|---|---|
| Austria | Developed | 1.76 |
| China | Emerging | 4.60 |
| Israel | Advanced-Emerging | 5.05 |
| Denmark | Developed | 14.22 |
| Egypt | Emerging | 17.28 |
| Singapore | Developed | 26.12 |
| Mexico | Advanced-Emerging | 30.97 |
| Country | AUT | CHN | ISR | DNK | EGY | SGP | MEX |
|---|---|---|---|---|---|---|---|
| AUT | 1.00 | 0.57 | 0.26 | 0.64 | 0.30 | 0.60 | 0.66 |
| CHN | 0.57 | 1.00 | 0.00 | 0.53 | 0.13 | 0.67 | 0.47 |
| ISR | 0.26 | 0.00 | 1.00 | 0.45 | -0.07 | 0.28 | 0.38 |
| DNK | 0.64 | 0.53 | 0.45 | 1.00 | 0.16 | 0.66 | 0.47 |
| EGY | 0.30 | 0.13 | -0.07 | 0.16 | 1.00 | 0.28 | 0.29 |
| SGP | 0.60 | 0.67 | 0.28 | 0.66 | 0.28 | 1.00 | 0.57 |
| MEX | 0.66 | 0.47 | 0.38 | 0.47 | 0.29 | 0.57 | 1.00 |
Share and Cite
MDPI and ACS Style
Eptas, A.; Leger, L.A. A Mean-Variance Diagnosis of the Financial Crisis: International Diversification and Safe Havens. J. Risk Financial Manag. 2010, 3, 97-117. https://doi.org/10.3390/jrfm3010097
AMA Style
Eptas A, Leger LA. A Mean-Variance Diagnosis of the Financial Crisis: International Diversification and Safe Havens. Journal of Risk and Financial Management. 2010; 3(1):97-117. https://doi.org/10.3390/jrfm3010097
Chicago/Turabian StyleEptas, Alexander, and Lawrence A. Leger. 2010. "A Mean-Variance Diagnosis of the Financial Crisis: International Diversification and Safe Havens" Journal of Risk and Financial Management 3, no. 1: 97-117. https://doi.org/10.3390/jrfm3010097