Article

Forecast Combinations for Structural Breaks in Volatility: Evidence from BRICS Countries

by
Davide De Gaetano
SOSE—Soluzioni per il Sistema Economico S.p.A., Via Mentore Maggini 48C, 00143 Roma, Italy
J. Risk Financial Manag. 2018, 11(4), 64; https://doi.org/10.3390/jrfm11040064
Submission received: 4 October 2018 / Revised: 16 October 2018 / Accepted: 17 October 2018 / Published: 21 October 2018
(This article belongs to the Special Issue Financial Time Series: Methods & Models)

Abstract

:
The aim of this paper is to investigate the relevance of structural breaks for forecasting the volatility of daily returns on BRICS countries (Brazil, Russia, India, China and South Africa). The data set used in the analysis is the Morgan Stanley Capital International MSCI daily returns and covers the period from 19 July 1999 to 16 July 2015. To identify structural breaks in the unconditional variance, a binary segmentation algorithm with a test, which considers both the fourth order moment of the process and persistence in the variance, has been implemented. Some forecast combinations that account for the identified structural breaks have been introduced and their performance has been evaluated and compared by using the Model Confidence Set (MCS). The results give significant evidence of the relevance of the structural breaks. In particular, in the regimes identified by the structural breaks, a substantial change in the unconditional variance is quite evident. In forecasting volatility, the combination that averages forecasts obtained using different rolling estimation windows outperforms all the other combinations

1. Introduction

Measuring and forecasting volatility in financial markets has attracted growing interest by academics, policy makers and practitioners during the last few decades. Volatility in the stock, bond and foreign exchange market can be used as a measurement of risk and its impact on the economy and on the stability of financial markets is an important public policy issue; it also plays a central role in the pricing of derivative securities. As a consequence, there is a large amount of literature on forecasting volatility and, in the last few decades, a lot of volatility models based on low-frequency data, such as generalized autoregressive conditional heteroskedasticity (GARCH) models, have been proposed. However, the financial markets are buffeted by suddenly important events that can lead to sharp breaks in the markets and thus breaks in parameters governing the volatility models can occur. In such cases, the inference on the parameters may be misleading as well as any policy implications drawn from the model. The accuracy of post-sample forecasting is affected as well. The presence of structural breaks in volatility of financial time series has been confirmed in many empirical studies. Examples can be found in the case of stock returns (Hammoudeh and Li 2008, Wang and Moore 2009), in the exchange rate returns (Rapach and Strauss 2008), in sovereign bond markets (Tamakoshi and Hamori 2014), in the real Gross Domestic Product growth (Fang and Miller 2009) and in the Realized volatility (De Gaetano 2018a). Strong evidence of the existence of multiple break points has been highlighted for BRICS countries (Morales and Gassie-Falzone 2011) which have experienced severe crises in the last 20 years.
The BRICS countries (Brazil, Russia, India, China and South Africa) are recognized as the most developed economies among the emerging markets. They are all developing or newly industrialized countries and are all characterized by large, fast-growing economies and strong influence on regional and global business. All together, they account for 26.46 % of world land area, 42.58 % of world population, 13.24 % of World Bank voting power and 14.91 % of International Monetary Fund (IMF) quota shares. According to IFM’s estimates, BRICS countries generated 22.53 % of the world GDP in 2015 and has contributed more than 50 % of world economic growth during the last 10 years1. Moreover, the importance of these countries in the World economy and in particular in the global financial market has been highlighted in many papers in the last few decades. For example, many studies have recognized the strong linkage between the BRICS economies the US and Eurozone economy (see Bhuyan et al. 2016; Ahmad et al. 2013 inter alia) and their significant dependence with the global stock and commodity markets (Mensi et al. 2014).
The aim of this paper is twofold. Our first objective is to confirm the presence of structural breaks in the volatility of MSCI daily returns on BRICS countries. Secondly, we investigate the relevance of structural breaks in forecasting by considering opportune forecast combinations which take into account their presence. The data are the Morgan Stanley Capital International (MSCI) daily returns on the BRICS countries and cover the period from 19 July 1999 to 16 July 2015. The analysis begins by identifying structural breaks in the unconditional variance. More specifically, a test for a single break in the presence of conditional heteroskedasticity has been employed. It is based on a statistic proposed in Sansó et al. (2004) which takes into account both the fourth order moment of the process and persistence in the variance. In order to extend the single break point method to multiple ones, a binary segmentation algorithm has been implemented. Following (Rapach and Strauss 2008), the identified structural breaks have been used to identify different sub-samples in which different GARCH(1,1) models have been estimated. The GARCH(1,1) model has been considered since it is a very parsimonious model and usually it is adequate to obtain good performances in terms of fitting and forecasting. In order to account for possible structural breaks in the generation of forecasts, we focus on some particular forecast combinations generated by the same model but over different estimation windows. This strategy has been successfully used in many empirical works in different areas. For example, in a regression framework, some methods have been proposed to choose the individual forecasts entering the combination and the relative weights (Pesaran and Timmermann 2007; Pesaran and Pick 2011; Pesaran et al. 2013; Tian and Anderson 2014). Applications in forecasting the equity premium can be found in Tian and Zhou 2016 and in the context of realized volatility in De Gaetano (2018a). Also in a GARCH framework, combinations of forecasts have been shown to improve forecast accuracy with respect to a single model (see for example Rapach and Strauss 2008; Rapach et al. 2008; De Gaetano 2018b).
In this paper, we focus on combinations that average the forecasts obtained by the individual GARCH(1,1) model and those obtained by considering different estimation windows. This approach is in the spirit of Clark and McCracken (2004) who present analytical, Monte Carlo, and empirical evidence that combining recursive and rolling forecasts, when linear predictive models are subject to structural change, could be superior to the individual forecasts. The forecasting performance of the proposed forecast combinations has been evaluated and compared by using the Model Confidence Set (MCS) proposed by Hansen et al. (2011). This procedure allows for constructing a set of models from a specified collection that consists of the best models in terms of a loss function and a given level of confidence. In particular, for each country and for different horizons, the forecasting performance of the considered methods have been evaluated with respect to different loss functions, the MSE and the QLIKE.
The structure of the paper is as follows: Section 2 presents the data and the methodology employed in the analysis. In particular, in Section 2.1, the methodology used to identify the structural breaks is illustrated and the results of an in-sample analysis for BRICS countries is presented; in Section 2.2, the proposed forecast combinations are illustrated and examined. In Section 3, a comparison among the proposed forecast combinations and two alternative benchmark methods are discussed. Some remarks close the paper.

2. Data and Methodology

The data set is obtained from Datastream and consists of MSCI (Morgan Stanley Capital International) daily returns on the BRICS countries. BRICS is the acronym for an association of five major emerging national economies: Brazil, Russia, India, China and South Africa. The grouping was originally known as “BRIC” before the inclusion of South Africa in 2010.
These countries are all developing or newly industrialized countries and they are all characterized by large, fast-growing economies and a strong influence on regional and global business. The data covers the period from 19 July 1999 to 16 July 2015.
Table 1 reports the descriptive statistics for MSCI daily returns on the BRICS countries. It shows the usual properties of daily financial returns data that are a small mean, a large standard deviation and evidence of non-normality as pointed out by the Jarque–Bera test. This feature is essentially due to an excess of kurtosis that highlights the presence of a large number of significant shocks.

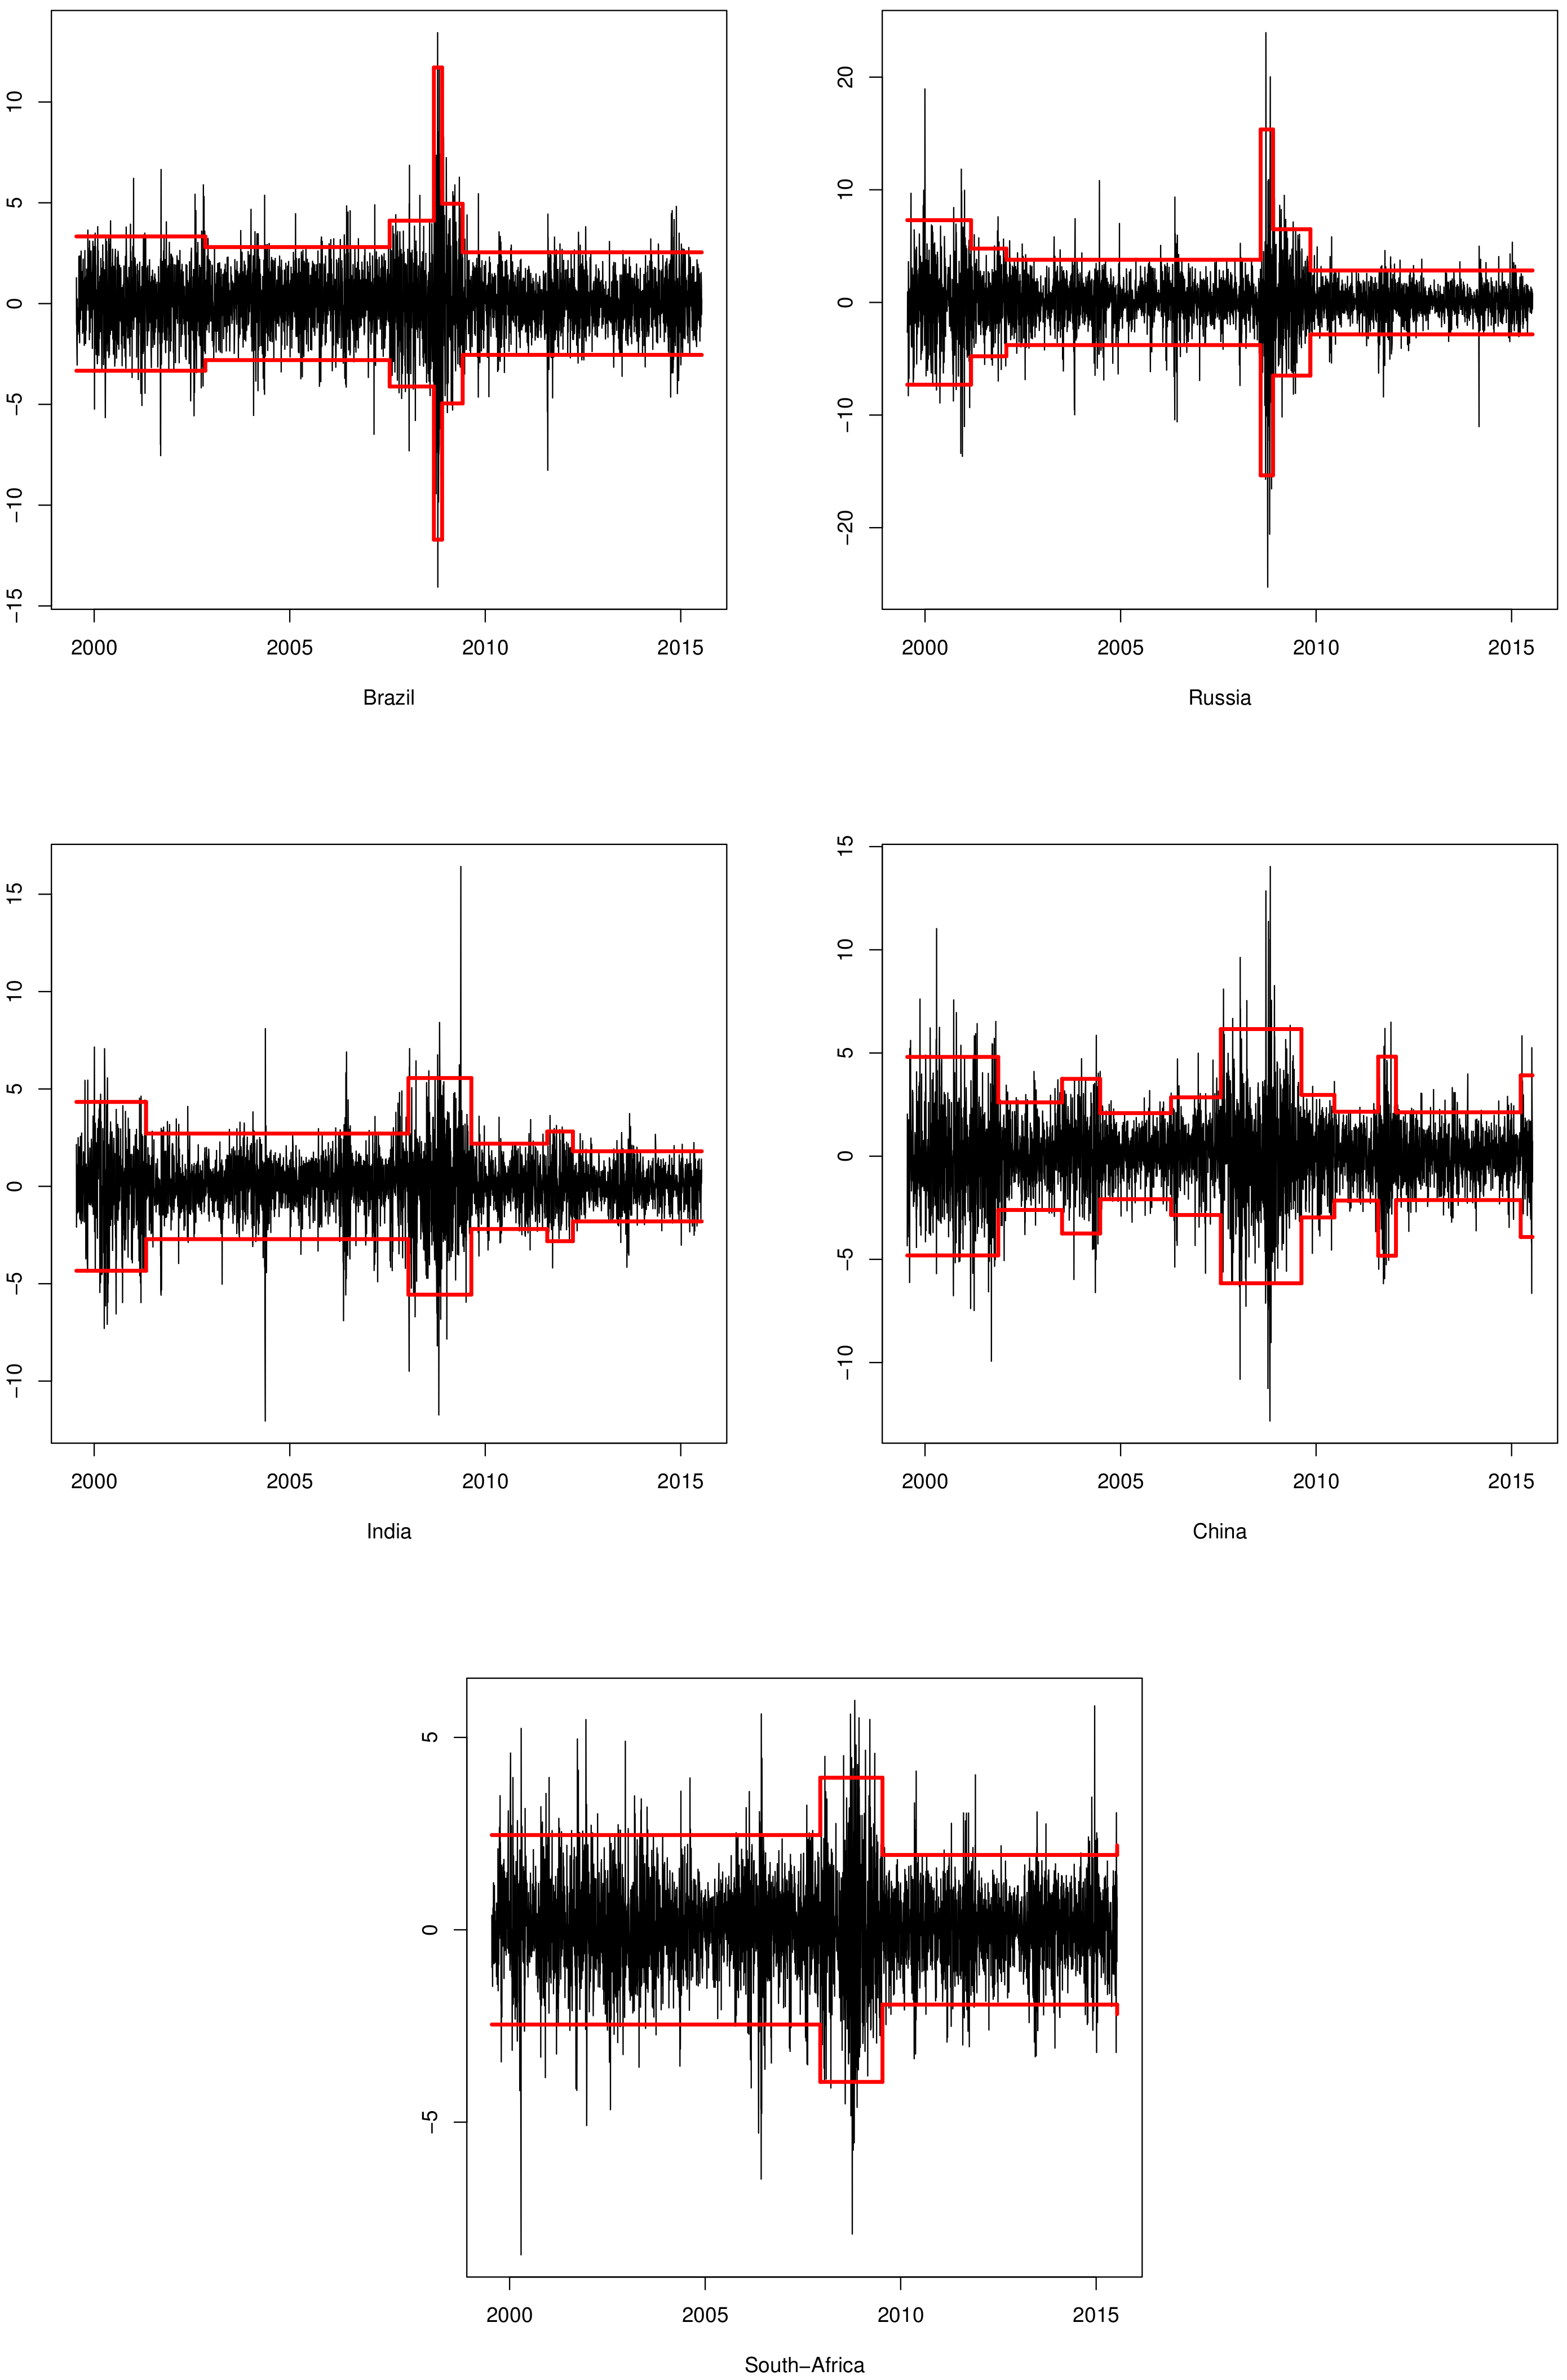
2.1. In-Sample Analysis

Let a t , t = 1 , , T denote the time series of the daily returns and assume, for simplicity, that the unconditional and conditional mean are zero.
In order to model the dynamic of a t , a GARCH(1,1) model has been used; it has been established as an adequate model to obtain good performances in terms of fitting and forecasting. The canonical GARCH(1,1) model is:
a t = σ t ϵ t σ t 2 = ω + β σ t 1 2 + α a t 1 2 ,
where ϵ t is a sequence of i.i.d. random variables with mean zero and unit variance. Conditions on ω , α and β need to be imposed for the previous equation to be well defined. In particular, ω > 0 and α , β 0 are imposed to ensure that the conditional variance σ t 2 is positive. Moreover, α + β < 1 ensures that the process is stationary. For a GARCH(1,1) process, the unconditional variance is defined as ω / ( 1 α β ) .
The parameters of model (1) are estimated by using the Quasi Maximum Likelihood Estimation in which the likelihood corresponding to the assumed distribution of ϵ t is maximized under the previous assumptions.
We are interested in testing whether the unconditional variance is constant over the available sample since a constant unconditional variance implies a not stable GARCH process governing conditional volatility. In order to identify possible structural breaks, a test for a single break in the presence of conditional heteroskedasticity has been employed. It is based on a statistic proposed in Sansó et al. (2004) which takes into account both the fourth order moment of the process and persistence in the variance. The test is based on the following statistic:
K 2 = s u p k | T 1 / 2 G k | ,
where C k = t = 1 k a t 2 for k = 1 , , T is the cumulative sum of squares of a t and G k = ω ^ 4 1 / 2 [ C k ( k / T ) C T ] and ω ^ 4 is a consistent estimator of ω 4 , the long-run fourth order moment of a t .
Under quite general conditions, in Sansó et al. (2004), it has shown that:
K 2 A s u p r | W * ( r ) | ,
where W * = W ( r ) r W ( 1 ) is a Brownian bridge and W ( r ) is a standard Brownian motion. Finite-sample critical values for the test can be determined by simulation.
The K 2 statistic is a generalization of the IT statistic proposed in Inclan and Tiao (1994), generally used to test the constancy of the unconditional variance of a time series. In particular, K 2 makes adjustments to the IT statistic to allow a t to obey a wide class of dependent processes, including GARCH processes, under the null.
In order to obtain a consistent estimator of the long-run fourth order moment of a t , which is also the long-run variance of the zero mean random variable ξ = a t 2 σ 2 , a non-parametric approach based on the Bartlett kernel (see also Rapach and Strauss 2008) has been used used. In particular, it is:
ω ^ 4 = γ ^ 0 + 2 l = 1 m [ 1 l ( m + 1 ) 1 ] γ ^ l ,
where
γ ^ l = T 1 t = l + 1 T ( ϵ t 2 σ ^ 2 ) ( ϵ t 1 2 σ ^ 2 )
and σ ^ 2 = T 1 C T . This estimator depends on the bandwidth m which can be selected using the procedure in Newey and West (1994).
In order to extend the single break point method to multiple ones, a binary segmentation algorithm has been implemented. It is based on successive application of the test to sub-series obtained consecutively after a change-point is found. The procedure starts by applying the detection method to the whole series. If no change-point is found, the procedure is stopped; otherwise, the data are split into two segments and the detection method is applying to each of them. The procedure is repeated until no further change-points are detected. The choice of a binary segmentation algorithm is justified by its simplicity and efficiency; it is very fast and it could be implemented with a low computational cost. However, the procedure could produce spurious break points because of the presence of extreme observations which can be erroneously interpreted as being change points (see Ross 2013). To partially solve this problem and to better identify the break points location, a pruning procedure, in the spirit of the ICCS algorithm (Inclan and Tiao 1994), has been implemented. In the case that m breaks have been detected at times τ 1 , …, τ m with τ 0 = 1 and τ m + 1 = T , the pruning procedure can be implemented as follows:
  • The detection method is applied to the segment ( τ i 1 , τ i + 1 ) for i = 1 , , m .
  • If no change-point is found in the segment ( τ i 1 , τ i + 1 ) , the break at τ i is not considered a change point. If a new change point is detected, it replaces the old one at τ i .
  • The procedure is repeated until the number of change points does not change and the points found in each new step are ”close” to those on the previous step.
The main problem, when a detection method is applied with a searching algorithm, is that the use of the same critical value for any segments may distort the performance of the iterative procedure. To overcome this problem, the response surfaces’ methodology has been used (see MacKinnon 1994 for details).
Table 2 reports the identified breaks dates.The proposed procedure identified five breaks for Brazil, Russia and India, ten breaks for China and only two breaks for South Africa. It is evident that the volatility may change in each country according not only to global, but also to specific financial, economic, social and political events.
In general, all of the BRICS countries, as the rest of the emerging markets, largely stood at the fringes of the global financial crisis that started in 2007 with the US Subprime market collapse and developed into a full-blown international banking crisis with the collapse of the investment bank Lehman Brothers on September 2008. This crisis affected global stock markets, where securities suffered large losses during 2008 and early 2009 with a reduction of volatility after this period. Therefore, in the period from 2007 to 2009, in all of the BRICS countries, there is evidence of the presence of structural break in volatility with different peaks.
Regarding individual BRICS countries, the identified breaks can be explained by looking at specific domestic events. According to Morales and Gassie-Falzone (2011), the first break identified for Brazil is in 2002 and it could be due to the Brazilian stock market crash and the pressures in the run up to the presidential election. The Indian and Russian markets share a common trend with a break point in April and March 2001, respectively, which is connecting with the dot-com bubble effects and to the energy crisis (Morales and Gassie-Falzone 2011). Moreover, for Russia, a high magnitude of unsystematic risk was observed in 2001–2002 when the Russian stock market was hardly on the radar of international portfolio managers (Nivorozhkin and Castagneto-Gissey 2016). Regarding India, the breaks in August 2011 is related to the ”August 2011 stock markets fall”, which is the sharp drop in stock prices due to fears of contagion of the European sovereign debt crisis. The effect of this crisis continued for the rest of the year; the break in March 2012 corresponds to the end of the effect of the crisis and a consequential reduction of volatility. The results for the Chinese market seem to be quite different; the large number of identified breaks and their locations could be also explained by regional volatility. As pointed out in Zhou et al. (2012), from 1996 to 2009, the Chinese stock market was not much influenced by other markets because it was not completely open to foreign investors. More precisely (see Li (2015) for a complete review of the market), in 1999, the government formally put forward the pilot plan of transferring state-owned stocks, but it did not work well, and the scheme was a shock to the stock market. However, due to the discrepancy between the market’s expectations and the implementation plan, the pilot project was led to some variations on the initial proposal from 2001 to 2003. In 2004, to solve the non-tradable shares issue some institutional reforms were made and, during 2006 and 2007, the Chinese market experienced the emergence of the stock market ‘bubble’. From 2007 to 2009, the market was affected by the global financial crisis which caused a peak in the volatility. In general, volatility spillovers among the Chinese and the other Asiatic markets, in particular Japanese and Indian markets, are more distinctive than those among the Chinese and Western markets are. This consideration could explain the presence of breaks in August 2011 and at the beginning of 2012 as previously pointed out for the Indian market. The last break in March 2015 could be explained by the Chinese stock market turbulence which began with the popping of the stock market bubble. For South Africa, the only identified structural breaks are those linked to the global financial crisis in the period 2007–2009.
Figure 1 shows the two-standard-deviation bands for each of the regimes defined by the structural breaks. Table 3 presents the full-sample GARCH(1,1) unconditional variance, as well as its values for the sub-samples defined by the structural breaks identified by the binary segmentation algorithm with the K 2 test, for all the considered series. As expected, a substantial change in the unconditional variance is quite evident. Note that, for Brazil, the unconditional variance of subsample 5 collapses to zero indicating that, in this period, the model is an IGARCH(1,1) without trend ( ω = 0 ), a model with the so-called ”persistent variance” property in which the current information remains important for the forecasts of the conditional variances for all horizons. For the other periods, the unconditional variance varies from 1.57, in the subsample 6 to 34.28 in subsample 4. For Russia, the unconditional variance of the GARCH(1,1) full sample model is equal to 5.10, whereas, in the subsamples, it varies from 1.99 to 58.93, a value more than 10 times larger than that observed in the full sample. In the case of India, as for Brazil, in the subsample 5, the estimated model is an IGARH(1,1) without a trend as suggested by the zero value of the unconditional variance. A significant variability among the identified subsamples is still evident. For China, the unconditional variance of the GARCH(1,1) full sample model is equal to 3.44 and, again, significant differences are observable in the eleven identified subsamples. The same feature is also noticeable for South Africa in which the unconditional variance varies from 0.99 to 3.75.
These features confirm the relevance of variance breaks in the analysis of MSCI daily returns for all five of the BRICS countries.

2.2. Out-of-Sample Analysis

Once the presence of structural breaks in the MSCI daily returns on the BRICS countries has been verified, the problem is how to take them into account when generating forecasts. In this paper, we focus on particular forecast combinations generated by the same model but over different estimation windows, a strategy that has been proved superior to forecasts generated by a single estimation window (see, for example, De Gaetano (2018b) and the references therein). In particular, we compare out-of-sample forecasts of volatility generated by two benchmark forecasting methods and four competing forecasting combinations. More specifically, we divide the sample for a given time series into in-sample and out-of-sample portions, where the in-sample portion spans the first R observations and the out-of-sample portion the last observations. The two benchmark methods are the following:
  • Expanding win. This method forms out-of-sample forecasts using a recursive (expanding) estimation window. For 1-step-ahead forecasts, an initial sample using data from t = 1 to t = R is used to estimate the model and the 1-step ahead out-of-sample forecast is produced. The sample is increased by one, the model is re-estimated and 1-step ahead forecasts are produced. The procedure continues until the end of the available out-of-sample period. This method ignores possible past breaks for forecasting and it is generally used when a stable GARCH(1,1) is assumed.
  • RiskMetrics. This model is defined as:
    σ t 2 = ( 1 λ ) k = 1 λ k 1 a t k 2 ,
    where λ is a parameter such that 0 < λ < 1 This model, also known as exponential variance smoother for its structure, uses the exponentially weighted moving average method that is meant to represent the finite memory of the market. The weights on past squared returns decline to zero.
    The model has also an interesting formulation which makes it successful in financial applications. It is easy to show that it is equivalent to:
    σ t 2 = ( 1 λ ) a t 2 + λ σ t 1 2 .
    Based on the assumption of Normally distributed returns, the RiskMetrics model completely ignores the presence of fat tails in the distribution function, which is an important feature of financial data. Nevertheless, despite the evident over simplification embedded in its formulation, it was commonly found that the model has satisfactory performances in forecasting financial data and it has become widely used in applications.
    The model depends on a single parameter λ that has to be estimated. By evaluating a large number of assets, RiskMetrics Group proposed to fix λ = 0.94 . In this case, no estimation is needed.
The performance of these two benchmark methods have been compared with that of six competing forecasting combinations, which, in the spirit of Clark and McCracken (2004), combine recursive and rolling forecasts.
  • Exp-Roll 0.25. This combination is the average of the forecasts obtained by a GARCH(1,1) expanding window and a GARCH that uses a rolling estimation window equal to 0.25 of the size of the in-sample period. In this second method, an initial sample using data from t = ( 1 0.25 ) R to t = R is used to estimate the model and the 1-step ahead out-of-sample forecast is produced. The window is moved ahead one time period, the model is re-estimated using data from t = ( 1 0.25 ) R + 1 , , R + 1 and 1-step ahead out-of-sample forecast is produced. The procedure continues until the end of the available out-of-sample period. This model is generally used to take potential and unknown breaks in the series into account.
  • Exp-Roll 0.50. The forecasts for this combination are generated in the same way as those for the GARCH(1,1) 0.25 rolling window, but with a rolling window equal to one-half of the size of the in-sample period is used. With respect to the previous model, this choice allows for having a trade-off between an accurate estimate of the parameters due to a relative long estimation window and the possibility that the data come from different regimes.
  • Exp-Roll 0.75. The forecasts for this method are generated the same as those for the GARCH(1,1) 0.25 rolling window model, with the exception that we use a rolling window equal to one-quarter of the size of the in-sample period. In this case, even if the estimation procedure is based on less observations, the problem of data from different regimes is overcome.
  • Exp-Break. This combination is the average of two forecasting methods. The first is the GARCH(1,1) expanding window. In the second, the forecasts are generated by using an estimation window determined by the last break. More precisely, the size of the estimation window is determined by applying the binary segmentation algorithm with the K 2 test to the data available at the time the forecast is made. For 1-step-ahead forecasts, an initial sample using data from t = 1 to t = R is used to detect the breaks’ points. The estimation window for the parameters of the GARCH(1,1) model is comprised of observations from the final break to R. If no breaks are detected over this period, the parameters are estimated using observations from 1 to R. The sample is increased by one and a new break point search is applied to observations from 1 to R + 1 . The estimation window is formed by observations to the new final break point to R + 1 . The procedure continues until the end of the viable out-of-sample period. The procedure uses only observations available during the period being analyzed for the detection of the more recent break point; therefore, it does nor suffer from the so-called look-ahead bias. However, if the break is detected near the end of the in-sample period, the parameters of the GARCH(1,1) model are estimated with a relatively short sample.
  • Mean-win. This is the average of the five individual forecasting methods using different window sizes: GARCH(1,1) with breaks, GARCH which uses three rolling estimation windows equal to 0.25, 0.50 and 0.75 of the size of the in-sample period and a GARCH(1,1) expanding window. This method (see Pesaran and Timmermann 2007) incorporates the trade-off between the bias and the variance of forecasting errors because windows of earlier data are generally included in computing the combination forecasts.
  • Trimmed-Mean-win. This is the average of the individual forecasts that result from excluding the highest and lowest ones from the considered mean-windows’ forecasts. This approach, in the spirit of Ahmad (1989), could be useful since it mitigates the influence of occasional outliers and, as a consequence, it is less sensitive to possible implausible forecasts.

3. Comparing Forecasting Models

The two benchmark methods and the proposed forecast combinations have been compared through a small forecasting exercise in which the out-of-sample sample spans the last p observations that cover the period from 1 March 2012 to the end of the sample, for a total of p = 873 observations. In this context, the volatility forecast over the out-of-sample period has been calculated for various day horizons (s = 1, 5, 20). The comparison is made by using the Model Confidence set, proposed in Hansen (2005) and Hansen et al. (2011). The objective of this procedure is to determine which methods, from an initial set M 0 of methods indexed by i = 1 , , M 0 , exhibit the same predictive ability in terms of a loss function, given a level of confidence. Let us consider M * ^ as the collection of the best methods, M 0 the initial collection of all the methods and L i , t the loss function associated with the method i in period t.
Define the relative performance variables as d i j , t = L i , t L j , t i , j M 0 and assume that E ( d i j , t ) is finite and does not depend on t. The set of the best models is defined by:
M * ^ = i M 0 : E ( d i j , t ) 0 j M 0 .
In order to determine M * ^ , a sequence of significance tests is made and the models that result to be significantly inferior to other elements of M 0 are eliminated. The MSC is a stepwise procedure which starts by setting M = M 0 . The test H 0 , M is then implemented at level α . If H 0 , M is not rejected, M ^ 1 α * = M ; if H 0 , M is rejected, an object from M is eliminated and the procedure is repeated until H 0 , M is not rejected. The set M ^ 1 α * is defined as the “superior set of models” (SSM) and it contains the surviving method.
Despite its sequential nature, the MCS procedure does not accumulate type I error. This is due to the fact that the test stops when the first hypothesis is not rejected.
In this procedure, a semi-quadratic test statistic S Q has been employed; it is defined as:
S Q = i < j ( d ¯ i j ) 2 v a r ^ ( d ¯ i j ) ,
where: d ¯ i j = 1 T t = 1 T ( L i , t L j , t ) L i , t being the loss function associated with the model i at time t. The critical values of the test as well as the estimation of the variance useful to construct the test statistic are obtained by using the block bootstrap (see Hansen et al. 2011).
In this application, B = 1000 bootstrap resamples have been generated and α has been fixed at 0.05.
The choice of the loss function is arbitrary and depends on the nature of the competing models. In this paper, two different loss functions have been considered. They are defined as:
MSE t = ( σ ˜ t 2 σ ^ t 2 ) 2 ,
QLIKE t = σ ˜ t 2 σ ^ t 2 log σ ˜ t 2 σ ^ t 2 1 ,
where σ ˜ t is some volatility measure and σ ^ t is the punctual volatility forecast. They are the most widely used loss functions and provide robust ranking of the models in the context of volatility forecasts (Patton 2011). Table 4 reports the Composition of the Superior Set of Models for 1-day horizon for the five BRICS countries and for the two different loss functions. It is interesting to note that the forecasting methods based on the GARCH(1,1) specification and the RiskMetrics are the models always eliminated from the SSM. Among the combinations which make adjustments to accommodate potential structural breaks, the roll break is always present in the SSM, for all of the five BRICS countries and for both the loss functions MSE and QLIKE. However, while for Russia and China no other combination enters into the SSM, for the other three countries Brazil, India and South Africa, the set also contains the trimmed version of the roll break combination.
Results for horizon 5 and for horizon 20, reported in Table 5 and Table 6, respectively, confirm the structure of the SSM. Again, for all five of the BRICS countries and for both of the loss functions considered, the forecasting methods based on the GARCH(1,1) specification and the RiskMetrics are always excluded from the SSM. Moreover, the roll break combination seems to have the best performance in terms of forecasting, being always in the SSM. For Brazil, India and South Africa, the trimmed version of the roll combination also enters in the SSM except for Brazil when the loss function is the MSE for horizon 20.

4. Conclusions

In this paper, the problem of structural breaks for forecasting the volatility of MSCI daily returns for BRICS countries has been investigated. The structural breaks in the unconditional variance of the five time series have been identified by using a binary segmentation algorithm with a test proposed by Sansó et al. (2004). It takes into account both the fourth order moment of the process and persistence in the variance and so it is suitable for financial time series. In particular, the attention has been focused on a GARCH(1,1) model.
The results of an in-sample analysis have highlighted that the procedure is able to identify structural breaks in all the BRICS countries and, as expected, significant changes in the unconditional variance are quite evident in the regimes identified by the structural breaks.
In the out-sample analysis, six different forecast combinations have been compared in terms of their predictive performance by using the Model Confidence Set. With this procedure, the set of “best models” in terms of two loss functions and a given level of confidence has been constructed. The results show that the forecasting methods which do not make adjustments to accommodate structural breaks have worse performance. Moreover, among the combinations that account for structural breaks, the one that averages forecasts obtained using different rolling estimation windows outperforms all the others, for all five of the BRICS countries.

Funding

This research received no external funding.

Acknowledgments

The views expressed in the article are those of the author and do not involve the responsibility of SOSE—Soluzioni per il Sistema Economico S.p.A.

Conflicts of Interest

The author declares no conflict of interest.

References

  1. Ahmad, Wasim, Sanjay Sehgal, and N. R. Bhanumurthy. 2013. Eurozone crisis and BRIICKS stock markets: Contagion or market interdependence? Economic Modelling 33: 209–25. [Google Scholar] [CrossRef]
  2. Armstrong, J. Scott. 1989. Combining forecasts: The end of the beginning or the beginning of the end? International Journal of Forecasting 5: 585–88. [Google Scholar] [CrossRef]
  3. Bhuyan, Rafiqul, Mohammad G. Robbani, Bakhtear Talukdar, and Ajeet Jain. 2016. Information transmission and dynamics of stock price movements: An empirical analysis of BRICS and US stock markets. International Review of Economics & Finance 46: 180–95. [Google Scholar]
  4. Clark, Todd E., and Michael W. McCracken. 2009. Improving Forecast Accuracy by Combining Recursive and Rolling Forecasts. International Economic Review 50: 363–95. [Google Scholar] [CrossRef]
  5. De Gaetano, Davide. 2018a. Forecast Combinations in the Presence of Structural Breaks: Evidence from US Equity Markets. Mathematics 6: 34. [Google Scholar] [CrossRef]
  6. De Gaetano, Davide. 2018b. Forecasting with GARCH models under structural breaks: An approach based on combinations across estimation windows. Communications in Statistics—Simulation and Computation. in press. [Google Scholar]
  7. Fang, WenShwo, and Stephen M. Miller. 2009. Modeling the volatility of real GDP growth: The case of Japan revisited. Japan and the World Economy 21: 312–24. [Google Scholar] [CrossRef]
  8. Hammoudeh, Shawkat, and Huimin Li. 2008. Sudden changes in volatility in emerging markets: The case of Gulf Arab stock markets. International Review of Financial Analysis 17: 47–63. [Google Scholar] [CrossRef]
  9. Hansen, Peter Reinhard, Asger Lunde, and James M. Nason. 2011. The model confidence set. Econometrica 79: 453–97. [Google Scholar] [CrossRef]
  10. Hansen, Peter Reinhard. 2005. A test for superior predictive ability. Journal of Business & Economic Statistics 23: 365–80. [Google Scholar]
  11. Inclan, Carla, and George C. Tiao. 1994. Use of Cumulative Sums of Squares for Retrospective Detection of Changes in Variance. Journal of American Statistic Association 89: 913–23. [Google Scholar]
  12. Li, Ping. 2015. Review of China’s Stock Market from 2002 to 2014. In The Chinese Stock Market Volume I. London: Palgrave Macmillan, pp. 1–38. [Google Scholar]
  13. MacKinnon, James G. 1994. Approximate asymptotic distribution functions for unit-root and cointegration tests. Journal of Business and Economic Statistics 12: 167–76. [Google Scholar]
  14. Mensi, Walid, Shawkat Hammoudeh, Juan Carlos Reboredo, and Duc Khuong Nguyen. 2014. Do global factors impact BRICS stock markets? A quantile regression approach. Emerging Markets Review 19: 1–17. [Google Scholar] [CrossRef]
  15. Morales, Lucía, and Esmeralda Gassie-Falzone. 2011. Structural Breaks and Financial Volatility: Lessons from BRIC Countries. Paper presented at IAMO Forum 2011, Halle (Saale), Germany, June 23–24; pp. 1–31. [Google Scholar]
  16. Newey, Whitney K., and Kenneth D. West. 1994. Automatic Lag Selection in Covariance Matrix estimation. Review of Economic Studies 61: 631–54. [Google Scholar] [CrossRef]
  17. Nivorozhkin, Eugene, and Giorgio Castagneto-Gissey. 2016. Russian stock market in the aftermath of the Ukrainian crisis. Russian Journal of Economics 2: 23–40. [Google Scholar] [CrossRef]
  18. Patton, Andrew J. 2011. Volatility forecast comparison using imperfect volatility proxies. Journal of Econometrics 160: 246–56. [Google Scholar] [CrossRef]
  19. Pesaran, M. Hashem, and Andreas Pick. 2011. Forecast combination across estimation windows. Journal of Business and Economic Statistics 29: 307–18. [Google Scholar] [CrossRef] [Green Version]
  20. Pesaran, M. Hashem, and Allan Timmermann. 2007. Selection of estimation window in the presence of breaks. Journal of Econometrics 137: 134–61. [Google Scholar] [CrossRef]
  21. Pesaran, M. Hashem, Andreas Pick, and Mikhail Pranovich. 2013. Optimal forecasts in the presence of structural breaks. Journal of Econometrics 177: 134–52. [Google Scholar] [CrossRef]
  22. Rapach, David E., and Jack K. Strauss. 2008. Structural breaks and GARCH models of exchange rate volatility. Journal of Applied Econometrics 23: 65–90. [Google Scholar] [CrossRef]
  23. Rapach, David E., Jack K. Strauss, and Mark E. Wohar. 2008. Forecasting stock return volatility in the presence of structural breaks. In Forecasting in the Presence of Structural Breaks and Model Uncertainty. Edited by David E. Rapach and Mark E. Wohar. Emerald Series Frontiers of Economics and Globalization; Bingley: Elsevier, pp. 381–416. [Google Scholar]
  24. Ross, Gordon J. 2013. Modelling financial volatility in the presence of abrupt changes. Physica A: Statistical Mechanics and Its Applications 392: 350–60. [Google Scholar] [CrossRef]
  25. Sansó, Andreu, Vicent Aragó, and Josep Lluís Carrion. 2004. Testing for Change in the Unconditional Variance of Financial Time Series. Revista de Economia Financiera 4: 32–53. [Google Scholar]
  26. Tamakoshi, Go, and Shigeyuki Hamori. 2014. Greek sovereign bond index, volatility, and structural breaks. Journal of Economics and Finance 38: 687–97. [Google Scholar] [CrossRef]
  27. Tian, Jing, and Heather M. Anderson. 2014. Forecast Combinations under Structural Break Uncertainty. International Journal of Forecasting 30: 161–75. [Google Scholar] [CrossRef]
  28. Tian, Jing, and Qing Zhou. 2016. Improving equity premium forecasts by incorporating structural break uncertainty. Accounting and Finance, 1–38. [Google Scholar] [CrossRef]
  29. Wang, Ping, and Tomoe Moore. 2009. Sudden changes in volatility: The case of five central European stock markets. Journal of International Financial Markets, Institutions and Money 19: 33–46. [Google Scholar] [CrossRef] [Green Version]
  30. Zhou, Xiangyi, Weijin Zhang, and Jie Zhang. 2012. Volatility spillovers between the Chinese and world equity markets. Pacific-Basin Finance Journal 20: 247–70. [Google Scholar] [CrossRef]
1.
The statistics are reported in the 9th BRICS Summit official site.
Figure 1. MSCI daily returns on BRICS countries from 19 July 1999 to 16 July 2015 and two-standard-deviation bands for the regimes defined by the structural breaks identified by the binary segmentation with K 2 test.
Jrfm 11 00064 g001
Table 1. Summary statistics. MSCI daily returns on BRICS countries from 19 July 1999 to 16 July 2015. p-values of the Jarque–Bera test are given in brackets.
BrazilRussiaIndiaChinaSouth Africa
Min−14.0700−25.2800−12.0500−12.8300−8.4480
1st Quant.−0.8301−0.9287−0.6768−0.8268−0.6103
Median0.00000.06830.03850.01110.0176
Mean0.03640.03690.04380.01100.0456
3rd Quant.0.94551.13100.84210.91110.7451
Max13.440023.950016.420014.04005.9620
Standard Devation1.65072.37881.57101.84291.2406
Skewness−0.1283−0.2913−0.22440.0086−0.1560
Kurtosis5.865113.06617.43045.45833.1091
Jarque–Bera test6002.8429786.809650.025189.171701.21
(0.000)(0.000)(0.000)(0.000)(0.000)
Table 2. Volatility breaks dates identified by the binary segmentation with a K 2 test.
BrazilRussiaIndiaChinaSouth Africa
4 November 20026 March 200130 April 200115 November 200112 December 2007
23 July 200730 January 200214 January 20084 July 200315 July 2009
8 September 20081 August 200824 August 200924 June 2004
24 November 200825 November 20083 August 201117 April 2006
4 June 20099 November 200930 March 201226 July 2007
17 August 2009
21 June 2010
4 August 2011
17 Janurary 2012
27 March 2015
Table 3. Unconditional variance for the GARCH(1,1) full sample model and for the sub-sample defined by the identified structural breaks. The values 0* are obtained in correspondence of an estimated GARCH(1,1) model in which the persistence in near to one (IGARCH model) and ω is equal to 0.
BrazilRussiaIndiaChinaSouth Africa
Full sample2.43815.10293.03423.43901.6642
Subsample 12.773214.13445.21015.95511.6023
Subsample 21.92965.67641.74961.68693.7474
Subsample 33.18793.58467.74523.70530.9962
Subsample 434.280158.92681.22071.0579
Subsample 50*9.87220*2.0532
Subsample 61.57311.99220.79919.0545
Subsample 72.6656
Subsample 81.5155
Subsample 95.0387
Subsample 101.1182
Subsample 113.8351
Table 4. MCS p-values for MSCI daily returns on BRICS countries. The forecasting horizon is equal to 1. The test statistic is S Q . The loss functions are MSE and QLIKE.
1 StepBrazilRussiaIndiaChinaSouth Africa
QLIKEMSEQLIKEMSEQLIKEMSEQLIKEMSEQLIKEMSE
Expanding win0.000.000.000.000.000.000.000.000.000.00
RiskMetrics0.000.000.000.000.000.000.000.000.000.00
Exp-Roll 0.250.000.000.000.000.000.000.000.000.000.00
Exp-Roll 0.500.000.000.000.000.000.000.000.000.000.00
Exp-Roll 0.750.000.000.000.000.000.000.000.000.000.00
Exp-Break0.000.000.000.000.000.000.010.010.000.00
Mean-win.0.291.001.001.001.000.991.001.001.000.65
Trimmed-Mean-win1.000.830.000.000.461.000.010.010.811.00
Table 5. MCS p-values for MSCI daily returns on BRICS countries. The forecasting horizon is equal to 5. The test statistic is S Q . The loss functions are MSE and QLIKE.
5 StepBrazilRussiaIndiaChinaSouth Africa
QLIKEMSEQLIKEMSEQLIKEMSEQLIKEMSEQLIKEMSE
Expanding win0.000.000.000.000.000.000.000.000.000.00
RiskMetrics0.000.000.000.000.000.000.000.000.000.00
Exp-Roll 0.250.000.000.000.000.000.000.000.000.000.00
Exp-Roll 0.500.000.000.000.000.000.000.000.000.000.00
Exp-Roll 0.750.000.000.000.000.000.000.000.000.000.00
Exp-Break0.000.000.000.000.000.000.030.080.000.00
Mean-win.0.140.781.001.001.000.481.001.001.001.00
Trimmed-Mean-win1.001.000.000.000.501.000.010.000.710.61
Table 6. MCS p-values for MSCI daily returns on BRICS countries. The forecasting horizon is equal to 20. The test statistic is S Q . The loss functions are MSE and QLIKE.
20 StepBrazilRussiaIndiaChinaSouth Africa
QLIKEMSEQLIKEMSEQLIKEMSEQLIKEMSEQLIKEMSE
Expanding win0.000.000.000.000.000.000.000.000.000.00
RiskMetrics0.000.000.000.000.000.000.000.000.000.00
Exp-Roll 0.250.000.010.000.000.000.000.000.000.000.00
Exp-Roll 0.500.000.000.000.000.000.000.000.000.000.00
Exp-Roll 0.750.000.000.000.000.000.000.000.000.000.00
Exp-Break0.000.000.000.000.000.000.010.010.000.00
Mean-win.1.001.001.001.000.950.281.001.000.860.92
Trimmed-Mean-win0.400.030.000.001.001.000.010.001.001.00

