Groups, Pricing, and Cost of Debt: Evidence from Turkey

1
College of Business Administration, University of Central Florida, FL 32816, USA
2
Gabelli School of Business, Fordham University, NY 10023, USA
*
Author to whom correspondence should be addressed.
J. Risk Financial Manag. 2018, 11(1), 14; https://doi.org/10.3390/jrfm11010014
Submission received: 13 February 2018
/
Revised: 13 March 2018
/
Accepted: 13 March 2018
/
Published: 16 March 2018
(This article belongs to the Special Issue Empirical Asset Pricing)
Abstract
:The paper examines the impact of business group affiliation on cost of loans in an emerging market setting. It focuses on operational strategy, organizational structure and internationalization policies of business group firms and their impact on borrowing cost of affiliated firms. Bank loans are a dominant source of corporate funding in emerging markets, in which business groups exist as leading economic entities. Yet, the impact of belonging to a group on the firm’s cost of debt has not been studied in depth. Our results reveal that the extent of group affiliation, government ownership, and diversification increase the cost of loans. However, a group bank is advantageous in terms of borrowing, and decreases the cost of loans. While foreign ownership is beneficial in terms of pricing, being affiliated with a foreign group is not. Being a financial firm and being cross-listed are not significantly associated with bank loan terms. Borrowing costs are thus influenced in various ways by organizational structure, operational strategies, and global policies of business groups and affiliates. Therefore, business groups may benefit from strategically implementing policies and selecting loan applicant firms.
JEL Classification:
G20; G21; G32; G34; F30; F341. Introduction
Is there an advantage/disadvantage in business group affiliation when seeking capital? Does affiliation level of the borrowers affect the assessment of the lenders? How about group strategies, structure or implemented policies? Altogether, what is the impact of business group affiliation on cost of borrowing? This study aims to provide more insight to address these economically important questions for business group affiliated firms.
Business groups are important economic actors in many markets around the world (La Porta et al. 1999). These entities consist of legally independent firms bound together (with formal or informal ties), and they act in coordination (Khanna and Rivkin 2001). The economic, social, and regulatory characteristics of countries play a role in the formation of these entities in each market setting. Nevertheless, these groups play a significant role in their respective economies and control a substantial part of their country’s productive assets (Weinstein and Yafeh 1995; Khanna and Yafeh 2007). They essentially serve as an important powerful form of an economic organization, specifically in emerging market economies (e.g., South Korean chaebols, Indian business houses and Turkish holdings). These groups are one of the major drivers behind the increased role of emerging economies within the global economy.
The existence of business groups has been a striking topic, and hence it has been examined by many researchers from various perspectives. A majority of these business groups are highly diversified entities with pyramidal or complex ownership structures.1 Since these groups are highly diversified, but controlled by dominant/founder shareholders2, studies often focus on their corporate control motivations, and on agency related governance concerns. Dominant/founder shareholders create corporate control via differentiating cash-flow/control rights (La Porta et al. 1999), cross-holdings (Claessens et al. 2000) and pyramid ownership structures (Bebchuk et al. 1999; Almeida and Wolfenzon 2006). With established control rights, the dominant shareholders of these groups create a joint standing against minority shareholders, creditors, regulatory agencies and any other third parties.
Corporate theory suggests that diversified corporations underperform, possibly due to agency problems and inefficient management (Berger and Ofek 1995; Denis et al. 1997). However, group affiliation provides many benefits such as: co-insurance/risk sharing effect (Ferris et al. 2003; Khanna and Yafeh 2007); use of funds to provide support to distressed group firms–propping- (Bae et al. 2002); monitoring by large controlling shareholders (Weinstein and Yafeh 1995); existence of internal markets and group financial support (Bianco and Nicodano 2006; Gopalan et al. 2007; Masulis et al. 2011); impact on the group banks’ performance (Francis et al. 2018); importance of group reputation/track record as a substitute for underdeveloped investor protection regulations (Khanna and Palepu 2000a; Gomes 2000); debt renegotiation power of large controlling shareholders against creditors (Davydenko and Strebulaev 2007); increased competitiveness, along with easier investment implementation and technology transfer (Guillen 2000).
On the other hand, business groups may also be associated with potential problems. Controlling shareholders may expropriate resources (tunneling) (Bae et al. 2002; Bertrand et al. 2002), or assert control rights against the interest of minority shareholders (Claessens et al. 2002; La Porta et al. 2002). It may be difficult for outsiders to monitor internal group activities (Lin et al. 2011). Allocation of resources through a group’s internal capital markets may be inefficient (Rajan et al. 2000; Scharfstein and Stein 2000). Further, groups may suffer inefficiencies and value loss from a diversification discount perspective (Berger and Ofek 1995; Lang and Stulz 1994).
These issues have been at the center of many studies, from structural and performance perspectives.3 Despite the importance of groups in the economic development of a significant number of countries4, one area of importance that has not been examined in detail is the impact of group affiliation on its members’ cost of loans. Bank loans are a primary source of corporate financing (e.g., Chava et al. 2009; Graham et al. 2008). Banks are the primary credit suppliers and external monitors in emerging markets (Demirguc-Kunt and Levine 2001; Love et al. 2007)5. Leveraging decisions of group-affiliated firms are significantly different from those of non-affiliated firms (Manos et al. 2007).6 Further, since single countries may be the best settings to understand financial contracting by hard-to-compare small and private firms (Qian and Strahan 2007),7 we will study group-affiliated loans through the lens of Turkey.
Since some business groups have banks within their structure, and member firms tend to act in coordination, financing capabilities of affiliated firms may differ from unaffiliated firms. It is of interest to examine if a group bank has an impact on group firms’ costs of debt. Hence, this study focuses on the loan market and a single emerging economy to understand the relationship among cost of debt, group affiliation, firm structure, corporate strategies, and other policies.8
Building on the extant literature on group affiliation, this paper examines its impact on the respective members’ cost of debt. It considers organizational structure (group affiliation extent, foreign and government ownership, being a financial firm, foreign group affiliation), operational strategy (having a group bank, being diversified or focused), and internationalization (cross-listing) to provide a more thorough perspective. Bank loans are the focus, and Turkish groups (holdings) and market are the setting.9 We analyze loan spread since default risk is the foremost determinant of loan pricing (Guner 2006), and is significantly impacted by corporate governance practices (Freixas and Rochet 1997). Strahan (1999) shows that the cost of loans is related to the riskiness of the borrowers, and non-price loan terms are related.10 For non-price loan terms, maturity and deal amount are examined.
The importance of emerging markets within the global economy has increased steadily over the past two decades. Emerging markets differ from developed markets in many respects. Though there are many other relevant characteristics, important differences are their rapid growth rates, abundant resources, increasing population, and dynamic internal demand. Similar to other emerging markets’ business groups, Turkish holdings play a dominant role within the economy and around the neighboring regions. Turkey presents an appropriate setting to examine business groups. It is highly integrated with European and Asian markets, with rapid growth in the last decade (fastest-growing European economy).11 Ownership data and group affiliation information is available and tightly monitored by regulatory agencies. Beyond Turkey, Turkish holdings are specifically active in neighboring regions: Eastern Europe, Middle East, Central Asia, and Northern Africa. These groups are highly diversified, and group firms are tightly controlled. Both family and non-family business groups exist. Turkey is not a transition economy, as liberalization policies have been implemented since the 1950s with an escalated trend after 1980s. Additionally, Turkish business groups have been studied to a lesser degree than other emerging economy business groups.
In examining the impact of group affiliation on a firm’s cost of bank loans, we seek answers to the following questions. (a) What is the impact of business group affiliation on an affiliated firm’s cost of loans, and does the extent of group affiliation matter? (b) What is the impact of having a group bank, or being a financial firm, on the cost of loans? (c) What is the impact of being focused or diversified on the cost of loans? (d) Does foreign or government ownership, foreign group affiliation, or cross-listing matter?
Using bank loan data from Dealscan and firm-specific data from Worldscope and the Borsa Istanbul (formerly Istanbul Stock Exchange) over the 1991–2011 time-period, we find that the extent of group affiliation increases loan costs (lower maturity and higher spread), and government ownership also increases costs (lower maturity, higher spread, lower deal amount). Having a group bank is advantageous in terms of cost of loans (longer maturity, lower spread), and foreign ownership is also (lower spread). However being affiliated with a foreign group is not beneficial (lower maturity). Additionally, diversification strategy is detrimental to loan terms (shorter maturity and smaller deal size).
Several studies have shown that emerging market firms that are diversified, have foreign ownership, or are cross-listed have a lower cost of bank loans. Our results therefore have important implications for understanding the relationship among an affiliated firm’s strategy, structure, cost of debt, and also for the development and growth of emerging markets. Overall, these findings suggest that there are cost-of-borrowing advantages in having a group bank, having foreign ownership, and being focused in terms of their decreasing impact on borrower firms’ cost of loans.
The rest of this paper is organized as follows. Section 2 outlines a brief overview of the Turkish market and information on Turkish business groups (holdings). Section 3 summarizes the hypothesis development and the interested research topics. Section 4 describes the dataset, and the variables constructed for regression analysis. Section 5 presents empirical tests and results, and Section 6 concludes.
2. A Brief Overview of the Turkish Economy and Turkish Business Groups
The Turkish economy is bank-oriented, similar to many European systems. In line with business groups in other emerging market, Turkish business groups play a dominant role in the economy. Moreover, they have major presence in the economies of neighboring regions (Eastern Europe, Middle East, Central Asia, and Northern Africa). Turkey presents a promising setting for examining groups, their strategies, and policies. Turkey is not a transitional country. It has actively implemented liberalization for almost 60 years, with an accelerated trend after the 1980s. Turkey has been a part of the European Union (EU) Customs Union since 1995, and an EU member candidate since 1999. Full membership discussions have stalled in recent years due to political trends and shifts in Turkey and the EU. Based on World Bank rankings, Turkey has the seventeenth largest gross domestic product in the world and the sixth largest in Europe. As in many emerging markets, a majority of the firms finance themselves with loans and equity.
Turkish business groups are generally organized under a holding company, a corporation that holds enough voting shares to control other group companies. It normally supervises and directs the management of affiliated corporations. However, some groups are coordinated by a lead firm rather than by a holding company. Both family and non-family groups exist. Most Turkish business groups are diversified, and operate in several industries, engaging in vertical or/and horizontal integration. Group firms are legally independent entities and provide their own financial statements. However, a limited number of Turkish companies are traded. As of May 2012, only 86 of the top 500 Turkish firms (based on size) were exchange listed, and 127 of the top 1000. (Turhan 2012).12 There are 12 Turkish companies on the Forbes Global 2000 list, of which five are financial and two are conglomerate (holding/group) institutions.
The majority of the firms finance themselves primarily with loans and equity, similar to other emerging markets. Some groups own a bank(s),13 but the bank(s) does not have coordinating power over the group as in Japanese keiretsus. In Turkey, pyramidal and complex ownership structures are observed. For instance, (non-leader) holding companies can exist as sub-groups within a larger business group.
3. Hypotheses Development
In this study, we seek to determine if the characteristics of Turkish business groups impact the cost of their business loans, examining price (spread %) as well as non-price (deal size and maturity) aspects of loan cost.14 There are eight main explanatory variables: extent of group affiliation; presence of a group bank; foreign ownership; foreign affiliation; government ownership; being a financial firm; or cross-listed; and diversification. If a factor is positively associated with loan spread, and negatively associated with maturity and deal amount, the interpretation will be that the factor increases the cost of loans. In the opposite cases, we would conclude that the explanatory variable reduces the cost of loans. Next, we examine the financial economic linkages between the eight variable and loan costs.
3.1. Group Affiliation Extent (Ownership %)
Ownership of business group affiliated firms is highly concentrated, and dominant/founder owners (also group owners) possess substantial control rights. This control can be summarized from two opposing lender perspectives at the time a loan is made. First, contributing to a negative view, a key concern may be potential expropriation of resources (or tunneling) by controlling shareholders (Bae et al. 2002; Bertrand et al. 2002; Morck et al. 2000; Claessens et al. 2002). Dominant control may hinder monitoring of internal group activities by outsiders (Lin et al. 2011).15 Inefficient management—due to increased span of control and possible agency problems—could weaken affiliated firm’s performance, increase the riskiness of future cash flows, and lower the probability of future loan repayments (Berger and Ofek 1995; Lang and Stulz 1994; Denis et al. 1997; Rajan et al. 2000; Scharfstein and Stein 2000).
Second, from a positive perspective, opposing view, group affiliation could create a co-insurance effect (or propping), as well as large shareholder monitoring and access to internal and external markets. Member firms may coordinate their actions, supporting distressed firms, in order to prevent possible group firm defaults (Ferris et al. 2003; Khanna and Yafeh 2005; Khanna and Yafeh 2007; Bae et al. 2002; Weinstein and Yafeh 1995; Bianco and Nicodano 2006; Gopalan et al. 2007).
These differing implications require an empirical resolution. On balance, the negative impact of group intensity seems stronger and results in Hypothesis 1:
Hypothesis 1.
All else equal, lenders increase the cost of loans when borrower firm has higher group ownership.
3.2. Having a Group Bank and Being a Financial Firm
Some business groups include a member bank(s). Since group owners possess high control rights and members act in coordination (Khanna and Rivkin 2001), group banks are expected to play a role in financing of groups and their affiliated firms. Unaffiliated lenders could perceive the existence of a group bank(s) from two opposing views, at the time of lending. Group banks could provide financial overall support and facilitate internal markets (Bianco and Nicodano 2006; Gopalan et al. 2007; Bae et al. 2002), in addition to being sources of funds. Especially in times of distress, a group bank’s financial support would be highly valuable. They may contribute to monitoring ability of large controlling shareholders (Weinstein and Yafeh 1995), and provide more expertise. From the perspective of co-insurance/risk sharing effects (Ferris et al. 2003; Khanna and Yafeh 2007), an affiliated borrower might be viewed as a “less risky borrower” with additional financial support and smaller default risk. Moreover, although being affiliated with a business group, financial institutions are still subject to stricter regulatory control, which could mitigate the risk perception of unaffiliated lenders.
On the other hand, the existence of a group bank may be considered negative criteria with respect to a member’s external loan applications. A potential concern could be related to the availability and the application priority of within-group internal funds. An affiliated firm’s first choice of loan application is expected to be from the group bank(s), from which a borrower may receive favorable terms. Thus, an external loan by a member firm might act as a negative signal.
Hypothesis 2.
All else equal, lenders reduce the cost of loans when the borrower’s group has a group bank.
Sometimes, the group firm that is borrowing may also be a group bank. Other factors may arise from a lender’s perspective. We hypothesize that within group support mechanisms apply here as well, leading to:
Hypothesis 3.
All else equal, lenders reduce the cost of loans when the borrower is a financial firm.
3.3. Foreign Ownership and Foreign Group Affiliation
Foreign ownership is expected to decrease the information asymmetries, and increase corporate transparency (Kang and Stulz 1997). Foreign investors in emerging markets are considered to be more experienced about in investments, information collection, and analysis, and hence foreign ownership is expected to increase the capitalization of firm-specific information (Gul et al. 2010). Foreign investors, specifically institutional investors, improve monitoring and may reduce the tunneling and propping intents of dominant shareholders (Khanna and Palepu 2000a). A dominant group leader may expropriate resources, reduce the value of loan collateral, and increase default risk (Lin et al. 2011). Additional and effective monitoring against dominant shareholders—for instance by foreign investors—is expected to result in more favorable loan contract terms for a borrower. Similarly, affiliation with a foreign business group may decrease the risk perception of lenders. This discussion leads to our next two hypotheses:
Hypothesis 4.
All else equal, lenders reduce the cost of loans when the borrower firm has foreign ownership.
Hypothesis 5.
All else equal, lenders reduce the cost of loans when the borrower is affiliated with a foreign group.
3.4. Government Ownership
Government ownership is associated with inefficient corporate governance, opaque financial disclosures, and less protection for minority shareholders (Shleifer 1998). Further, Gul et al. (2010) shows that less firm specific information is incorporated into stock price when the largest shareholder is government related. These suggestions of poor governance and information flow imply:
Hypothesis 6.
All else equal, lenders increase the cost of loans when the borrower has government ownership.
3.5. Being Cross-Listed
International cross-listings are expected to provide valuation and cost of capital advantages. Related reasons include access to foreign capital markets, ability in raise equity, stock liquidity, broader investor portfolios, more firm exposure, prestige (Foerster and Karolyi 1999; Lins et al. 2005). Cross-listed firms benefit from bonding to markets that provide stronger regulatory oversight, rigorous reporting requirements, and consequently better investor protection (Karolyi 2012). Information asymmetries are expected to be at a lower level due to additional disclosure requirements and monitoring provided by cross-listed market players (Doidge et al. 2004). Investor protection from cross-listing may limit controlling shareholder agency difficulties, and induce higher stock prices (La Porta et al. 2002). Doidge et al. (2004) argue that firms will cross-list their firms only if that is beneficial, with benefits arising from smaller expropriation risk, more efficient investment and growth. We predict that cost of loans is a function of being cross-listed, and test the following hypothesis:
Hypothesis 7.
All else equal, lenders reduce the cost of loans when the borrower is cross-listed.
3.6. Diversification
Diversification vs. focus has long been analyzed in the literature. For example, corporate finance theory suggests that firms should focus their business activities to reduce possible agency problems and utilize management expertise (Berger and Ofek 1995; Denis et al. 1997). Moreover, a focus strategy leads to better performance than diversification (Lang and Stulz 1994; DeLong 2001; Laeven and Levine 2007). On the other hand, some studies point out “relatedness” advantages of diversification that lead to better performance (Montgomery 1994; Comment and Jarrell 1995). Other researchers note that income diversification reduces perceived risk and has positive impact on return volatility (DeYoung and Roland 2001; Stiroh 2004). Business groups are generally diversified, but some of their affiliated firms may not be. To better understand the impact, we frame the question in the following manner:
Hypothesis 8.
All else equal, lenders reduce the cost of loans when the borrower is diversified.
4. Sample and Methodology
4.1. Sample
The sample is based on a final dataset of borrowing information of Turkish firms with 585 observations during the sample period of 1991–2011. It is built upon four major sources: Dealscan for loan information, Worldscope for borrowers’ financial statement information, Borsa Istanbul (formerly Istanbul Stock Exchange (ISE)) for listed borrowers’ financial and ownership information, and borrower websites for firm history, operations, and ownership information for both listed and unlisted firms.
The Loan Pricing Corporation (LPC) provides the price and non-price terms of loans in the Dealscan database. Loan terms of spread, maturity, and deal amount were collected from this source, and hand matched with borrower accounting data from the Worldscope database. This database provides financial statement information for large, publicly traded firms across the world. Additionally, Borsa Istanbul data sources are used for listed borrowers’ financial, subsidiary, and ownership information. Moreover, websites of borrower firms and regulatory agencies (e.g., Capital Markets Board of Turkey) are used for confirmation and to reach the optimum dataset. After cross-matching these sources, and limiting the sample to the available cost of loan information (Spread, Maturity, and Deal Amount), there remain 278 loan observations with 51 unique borrowers and 32 unique groups over a period of 21 years.
4.2. Variables
Spread, Maturity and Deal Amount are dependent variables, and they measure the cost of bank loans. Group Affiliation Extent, Group Bank, Foreign Group, Foreign Ownership, Government Ownership, Financial Firm, Cross-listed, and Diversified are the investigated independent variables. Loan and borrower characteristics, industry and year dummies are used as control variables. The variables are mainly grouped under six categories: loan terms, organizational structure, operational strategy, internationalization, firm characteristics, and industry and year dummy control variables.
4.2.1. Loan Term Variables
The All-in-Spread measure is the pricing term of loans, and it is used as the dependent variable in regression models. It is the amount in basis points over LIBOR (or the LIBOR equivalent) for each dollar drawn. It consists of the total of the borrowing spread and other annual fees paid to the bank group. The natural logarithm of this measure is used as the pricing loan term, ln (Spread). The Maturity measure is the contractual time-span of loans (expressed in months), and the Deal Amount measure is the amount of the loans. The natural logarithms of these measures represent the non-price loan term variables, ln (Maturity) and ln (Deal Amount). Loan contracts are multidimensional financial contracts, and they not only consist of terms such as interest rates, deal amount, and maturity, but also include terms such as size, collateral, and covenants (Qian and Strahan 2007). However, many such variables in emerging markets are not available. Hence we limit the analysis to three measures: ln (Spread), ln (Maturity), and ln (Deal Amount).
4.2.2. Organizational Structure Variables
The Group Affiliation Extent variable is calculated based on the group ownership percentage in borrower firms (0% indicates that there is no group association, and 100% means that the associated group owns all the firm’s shares). There are binary variables for Foreign Ownership and Government Ownership. Foreign Group is also binary, indicating whether an affiliated group is foreign. The Financial Firm variable indicates whether the firm is a financial firm.
4.2.3. Operational Strategy Variables
The Group Bank variable is a binary variable that indicates whether a borrower firm’s group has a bank. The Diversified variable is also a binary variable that indicates whether the borrower group firm operates as a focused firm or has subsidiaries operating in other industries.
4.2.4. Internationalization Variable
Cross-listed is a binary variable that indicates whether the borrower firm is listed in other markets besides the Borsa Istanbul.
4.2.5. Firm Characteristics Variables
Larger firms are commonly considered more stable and matured firms, and they are usually diversified and better known in debt markets. Hence, they are expected to have lower default risk. In order to control for this, the natural logarithm of Total Assets is used as the measure of firm size, ln (Assets).
Profitable firms should have lower default risks, and therefore lower contracting costs. To control for this, Profitability is measured as the ratio of net income to total assets.
Borrower firms may have different investment and growth opportunities. To control for these differences, Tobin’s Q variable is calculated as the market value of assets (book value of assets minus book value of equity plus market value of equity) over the book value of assets.
A high or low leverage ratio could be regarded in different ways. For example, borrower firms with a high leverage ratio could be considered to have a reputation in the debt markets, or to have more incentives to increase the riskiness of assets. To control for different leverage usage, we measure Leverage as the ratio of total debt to total assets.
Tangible assets are considered easier assets to collateralize, and therefore are expected to lead to lower borrowing costs. To control for this factor, the Tangibility variable is calculated as the ratio of the value of property, plant, and equipment (PP&E) to total assets, and incorporated into the analysis as a control variable.
4.2.6. Other Control Variables
Industry differences are controlled by using industry dummies, based on one-digit SIC codes. Year dummies are also included in the analysis to control for differences in key variables related to changing market conditions within the data time range. Moreover, loan terms are also included in the analysis as additional control variables following the literature, such that when loan pricing is examined with ln (Spread) as the dependent variable, the ln (Maturity) and ln (Deal Amount) variables are included in the analysis as additional control variables. Furthermore, loan types (revolver, term, facility etc.) are controlled for since they may influence loan terms.
Following the description of the data and the key variables, Table 1 presents the descriptive statistics of the cost of borrowing (Spread) and the other loan characteristics (Deal Amount and Maturity), the organizational structure (Group Affiliation Extent, Foreign Ownership, Foreign Group, Government Ownership, Financial Firm), the operational strategy (Group Bank, Diversified/Focused), the internationalization (Cross-listed) of borrowers, and other borrower characteristics (Total Assets, Profitability, Tobin’s Q, Leverage, Tangibility). Total Assets and Deal Amount information are in millions of USD.
4.3. Summary Statistics
Summary statistics of the dataset are presented in Table 1. It shows that the average value for the cost of borrowing (Spread) is 107.15 basis points, with a median of 80, a minimum of 5.25, and a maximum of 450 basis points. Whereas average maturity is only 20.74 months, deal amount is large (384.34 million USD). The Average Group Affiliation Extent is 57.20% in the Turkish market. A majority of the borrowing firm groups have a group bank, and borrower firms are diversified. Asset size varies, but the dataset is dominated by large firms with a mean of 20.8 billion USD. On average profitability is 3%, the leverage ratio is 28%, and tangibility is 7%.
Table 2 displays the pairwise correlation coefficients of all variables used in the regressions with the Bonferroni adjustment to calculated significance levels. All the correlation coefficients with Bonferroni-adjusted significance levels of 5% or better are starred. The relatively high correlation between Deal Amount and Total Assets (0.56) is consistent with the literature, since larger firms tend to receive higher loan amounts. We note that the following pairs also exhibit relatively high correlations: Financial Firm and Group Bank, Financial Firm and Tangibility, Financial Firm and Tobin’s Q, Cross-listed and Total Assets, with their correlation coefficients equal to 0.53, 0.61, 0.52 and 0.59, respectively.16
5. Tests and Empirical Results
To examine the impact of business group affiliation on borrower group firm’s cost of loans, the following estimations are run by using ordinary least squares (OLS). Cost of Loans (Spread, Maturity, or Deal Amount) is the dependent variable, and it is regressed on the organizational structure, operating strategy, and internationalization policy variables of borrower group firms, and control variables. The main empirical model is the following where each explanatory variable is subject to test with control variables:
Equation (1) presents the linear estimation of the cost of loan (spread, maturity, deal amount) of borrower group firm i at year t, where Xt represents the explanatory variables (group affiliation extent, foreign and government ownership, being a financial firm, foreign group affiliation, having a group bank, being diversified or focused, cross-listing) at year t, z represents the firm level control variables (size, profitability, investment/growth opportunities, leverage, tangibility) at year t − 1 and other control variables (industry and year dummies), and represents unspecified random factors at year t.
The impact of explanatory variables on the cost of loans is interpreted as follows: If an explanatory variable is positively associated with the pricing loan term (spread), and negatively associated with the non-pricing loan terms (maturity and deal amount), the interpretation is that it increases the cost of loans. If an explanatory variable is negatively associated with the pricing loan term (spread), and positively associated with the non-pricing loan terms (maturity and deal amount), the interpretation is that it reduces the cost of loans. In other words, Equation (1) tests whether organizational structure, operating strategy, and internationalization policies of borrower group firms increases (decreases) the cost of loans, while controlling for size, profitability, investment/growth opportunities, leverage, tangibility differences, and other factors (industry and year fixed effects). Reported standard errors are adjusted by using robust standard errors in all models, and are corrected by clustering for groups, in order to better address potential biases that may arise from serial data dependency.
Table 3 summarizes the regression results without inclusion of the control variables. Here, we test the impact of different affiliation levels of borrower firms on the cost of loans (spread, maturity and deal amount), and aim to understand how different affiliation levels vary across affiliated firms. The results show that group affiliation extent is positively associated with (increases) the pricing term of the loan whereas negatively associated with (decreasing) the time span and the amount of the loan. The coefficient of the variable Group Affiliation Extent (group ownership percentage at the time of borrowing) is positive and statistically significant when the pricing term of cost of loans is the dependent variable (spread). On the other hand, when the dependent variable is the non-pricing terms of cost of loans (maturity and deal amount), the coefficient of the variable Group Affiliation Extent (group ownership percentage at the time of borrowing) is negative and statistically significant. These results support our Hypothesis 1: “Lenders increase the cost of loans when borrower firm has higher group ownership”. In their analysis of stock price synchronicity, Küllü et al. (2018) find that Group Affiliation increases (decreases) synchronicity (firm specific information), hence less firm specific information is incorporated into the prices for affiliated firms. This result is consistent with the findings of this study. Since there is less firm specific information incorporated into the stock prices for group affiliated firms, lenders may prefer to increase cost of loans.
Table 4, Table 5 and Table 6 show the regression results with the inclusion of all control variables and in respect to each loan term dependent variable (Spread, Maturity and Deal Amount). The significant results are similar after introducing borrower characteristics and other control variables, with the only exception being the model where the dependent variable is Deal Amount. Table 4 shows the regression results with the inclusion of all control variables and in respect to each loan term dependent variable (Spread, Maturity and Deal Amount). Results show that group affiliation extent is significantly related with the loan pricing term spread. Regression model 1 results indicate that increasing the group affiliation by 10% raises the spread (loan pricing term) by 1.8%. Based on the sample mean spread of 107.15 basis points (bps), the increase is almost 2 basis points (bps). Table 5 summarizes the relationship when the dependent variable is non-price loan term maturity. Regression model 1 results indicate that increasing the group affiliation by 10% decreases the maturity (loan non-pricing term) by 2.5%. Based on the sample mean maturity of 20.74 months, the decrease is over 15 days. The impact of group affiliation extent on deal amount is not significant when all the control variables are included into the model. Although it is not the main aim of this study, lenders may have different priorities at the time of lending in regards to loan contract terms, such that as long as the rate and the loan maturity reflects the risk perception of the lender, deal amount restrictions could be approached as more relaxed. For example, since default risk is the most important determinant in loan pricing and reflected into the spread (Freixas and Rochet 1997), and lenders prefer short-term lending for rapid reviews of loans (Diamond 2004), emerging market firms’ requested amount of loans could be more tolerated by a group of lenders that share the risk in syndication loans.
Table 4, Table 5 and Table 6 results also present that government ownership is significantly related to loan pricing (spread) and non-pricing terms (maturity and deal amount) of loans. Government Ownership is positively associated with (increases) the interest rate whereas negatively associated with (decreases) the time span of the loan and the amount of the loan. Regression model 5 summarizes the results for government ownership, which supports our Hypothesis 6 that lenders increase the cost of loans when the borrower has government ownership.
Foreign ownership is negatively associated with (decreases) the interest rate, and affiliation with a foreign group is negatively associated with (decreases) maturity (regression model 3). These results provide support to our Hypothesis 4 that lenders reduce the cost of loans when the borrower firm has foreign ownership. However, they do not support our Hypothesis 5 that “lenders reduce the cost of loans when the borrower is affiliated with a foreign group”. Having foreign ownership is beneficial in terms of pricing (lower spread), but affiliation with a foreign group is detrimental in terms of time span of the loan (lower maturity).
Having a group bank is significant, and negatively associated with (decreases) deal amount, meaning that having a group bank is not that advantageous (based on regression model 2). Küllü et al. (2018) argues that having a group bank(s) decreases firm specific information incorporation into the stock prices. From a similar perspective as above, their result could lead to the expectation that having a group bank is not beneficial in terms of cost of bank loans. However, our later models (Equations (2) and (3)) results show that having a group bank (or banks) is beneficial in terms of the cost of loans (Hypothesis 2), when interaction terms are included. Although this seems as though there is inconsistency with the above-mentioned study, it should be noted that there may be other factors (such as previous relationships between lender banks and group bank) that could affect the cost of loans.
For cross-listing, a proxy for internationalization, the coefficient signs are as predicted by Hypothesis 7—it decreases spread, and increases maturity and deal amount (regression model 7), but they are insignificant. Additional disclosure requirements and international exposure are expected to lower information risk and reduce the cost of capital (Easley and O’Hara 2004). However, the significance level of results does not support that belief. Furthermore, neither diversification (Hypothesis 8) nor being a financial firm (Hypothesis 3) is significant (regression models 8 and 6, respectively).
Equations (2) and (3) further examines the linear estimation of the cost of loan (spread, maturity, deal amount) of borrower group firm i at year t when affiliation extent is in the picture, where Xt represents the other explanatory variables (foreign and government ownership, being a financial firm, foreign group affiliation, having a group bank, being diversified or focused, cross-listing) at year t, z represents the firm level control variables (size, profitability, investment/growth opportunities, leverage, tangibility) at year t − 1 and other control variables (industry and year dummies), and represents unspecified random factors at year t.
Table 7 summarizes the results where we introduce the extent of group affiliation in the presence of a group bank, and interact two terms. The results show that the having a group bank and the extent of group affiliation do matter in terms of cost of loans. Existence of a group bank shifts the sign of affiliation extent, although not significant. However, existence of a group bank is negatively associated with spread, and positively associated with maturity, indicating that there may be some advantages to having a group bank when the borrower is group affiliated. Deal amount relationship results are mixed.
Table 8 summarizes the results of affiliation extent and being diversified/ focused. Affiliation turns out to increase the cost of loans. Diversification is also positively associated with the cost of loans. Table 9 summarizes the foreign group affiliation and affiliation extent impact on cost of loans. Affiliation with a foreign group is negatively associated with maturity, and affiliation extent also decreases loan maturity, but affiliation extent increases loan spread.
Table 10 models examine the remaining explanatory variables (having a foreign ownership, government ownership, being cross-listed, and being a financial firm) at the presence of affiliation extent. Affiliation extent is significant, and negatively associated with maturity and positively associated with spread in all results. Deal amount relationship is not significant and unclear as mentioned before. Government ownership is also not beneficial in terms of negative association with maturity and deal amount. We also observe that profitability is highly significant in our models, yet—against intuition—with opposing signs. This result needs further detailed examination, an area for future research.
6. Conclusions
In the last two decades, emerging markets have become highly important in the global economy. In many of these markets, business groups are dominant actors. These business groups aggressively aim for external financing due to the fact that one of their main financing options is bank loans. The cost of their borrowing is an economically interesting topic, and worthy of further examination. Understanding the relationship among group affiliated firms’ cost of borrowing, operational strategies, organizational structure, and internationalization policies should provide useful insights for both group-affiliated firms and lenders.
This paper studies the impact of such factors on the cost of loans of business group firms in an emerging market setting. It aims to fill a gap in the literature by analyzing Turkish business group firms’ borrowing information. Specifically, we study the impact on loan terms of—extent of group affiliation; having a group bank; being a financial firm; being focused or diversified; having foreign ownership; affiliation with a foreign group; being listed in other markets. We anticipated observing an increase in the cost of loans when borrower firm has higher group ownership and government ownership; and on the other side, a decrease when the borrower’s group has a group-bank, borrower is a financial firm, has foreign ownership, affiliated with a foreign group, cross-listed and diversified.
The empirical evidence presented here shows that these factors matter and their impact is mixed. The extent of group affiliation increases loan costs (lower maturity and higher spread), and government ownership also increases costs (lower maturity, higher spread, lower deal amount). Having a group bank is advantageous in terms of cost of loans (longer maturity, lower spread), and foreign ownership is also (lower spread). However being affiliated with a foreign group is not beneficial (lower maturity). Additionally, diversification strategy is detrimental to loan terms (shorter maturity and smaller deal size). Overall, these findings suggest that there are cost-of-borrowing advantages in having a group bank, having foreign ownership, and being focused in terms of their decreasing impact on borrower firms’ cost of loans. Business groups can strategically pick, structure, and organize their affiliated firms, and try to optimize their borrowing.
Since our study is based on one emerging market and its borrower firms (Turkish market and business groups), data limitations exist, specifically due to the limited amount of listed firms and business groups in Turkish market. Yet informative as it is, our study should be followed by future research to better understand the impact of affiliation on cost of borrowing by expanding to other emerging markets and longer time periods.
Author Contributions
Melih Küllü and Steven Raymar worked together on the paper. Küllü conceived, designed and performed the experiments. Raymar worked on writing and positioning. Both authors worked on the analysis.
Conflicts of Interest
The authors declare no conflict of interest.
Nomenclature
| Variable | Definition |
| Ln (Spread) | Natural log of the loan spread. This is a loan pricing measure (“All-in Spread Drawn” from the Dealscan database. It is the amount that borrower pays in basis points over LIBOR or the LIBOR equivalent for each dollar drawn down). |
| Ln (Maturity) | Natural log of the loan maturity. Maturity is measured in months. |
| Ln (Deal Amount) | Natural log of the loan deal amount. (Amount is measured in millions of dollars). |
| Group Affiliation Extent (%) | Measure for organizational structure. (Group’s ownership percentage in borrower firms). |
| Foreign Ownership | Measure for organizational structure. (Foreign ownership exists or not). |
| Government Ownership | Measure for organizational structure. (Government ownership exists or not). |
| Group Bank | Measure for operating strategy. (Affiliated group has a group bank or not). |
| Diversified | Measure for operating strategy. (Borrower firm operates as a focused or diversified firm). |
| Financial Firm | Measure for organizational structure. (Borrower firm is a financial firm or not). |
| Cross-listed | Measure for internationalization. (Borrower firm is listed in other markets besides ISE, or not). |
| Foreign Group | Measure for organizational structure. (Affiliated group is foreign-based or not). |
| Ln (Assets) | Natural log of total assets. Measure for firm size. |
| Profitability | Measuring firm profitability (net income/total assets) |
| Tobin’s Q | Measure for investment and growth opportunities. (Market value of assets (book value of assets minus book value of equity plus market value of equity) over the book value of assets). |
| Leverage | Measuring firm leverage (debt/total assets) |
| Tangibility | Measuring firm tangibility (value of plant, property, and equipment/total assets) |
Appendix A
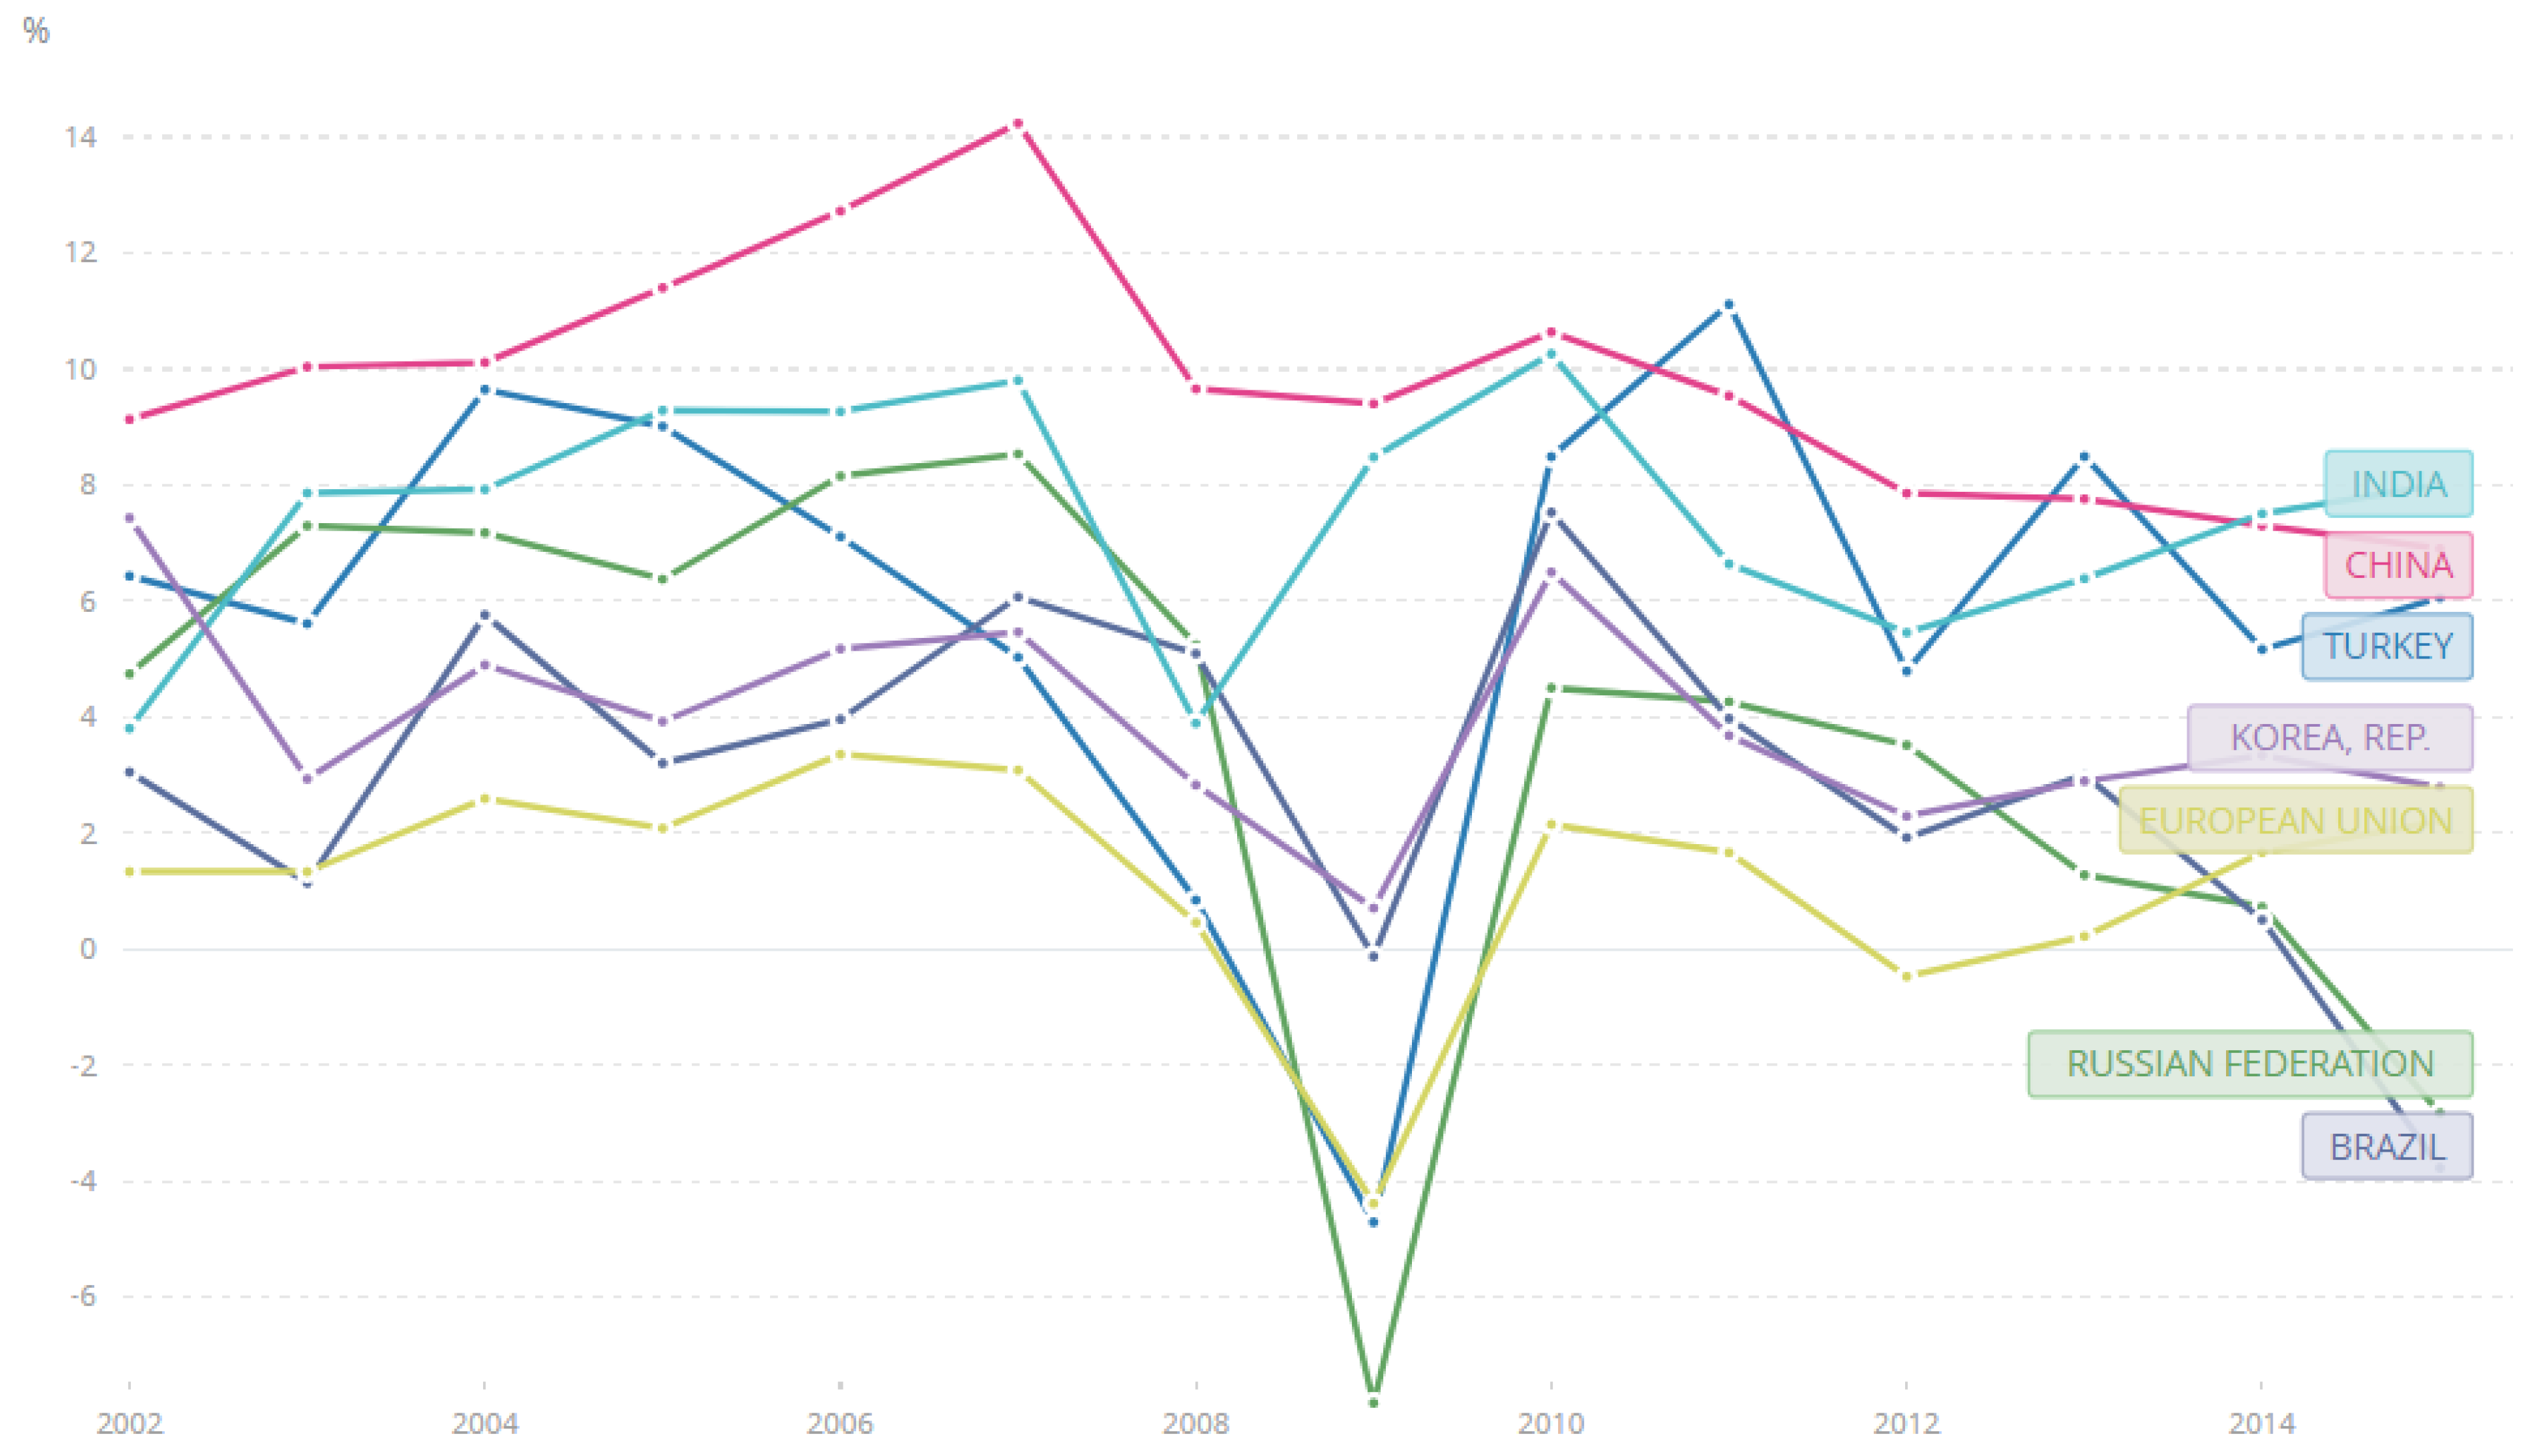
Figure A1.
GDP Growth (Annual %, 2002–2015), Source World Bank DataBank.

References
- Almeida, Heitor V., and Daniel Wolfenzon. 2006. A theory of pyramidal ownership and family business groups. Journal of Finance 61: 2637–81. [Google Scholar] [CrossRef]
- Aslan, Hadiye, and Praveen Kumar. 2012. Strategic Ownership Structure and the Cost of Debt. Review of Financial Studies 25: 2257–99. [Google Scholar] [CrossRef]
- Bae, Kee-Hong, and Vidhan K. Goyal. 2009. Creditor rights, enforcement, and bank loans. Journal of Finance 84: 823–60. [Google Scholar] [CrossRef]
- Bae, Kee-Hong, and Seok Woo Jeong. 2007. The value-relevance of earnings and book value, ownership structure, and business group affiliation: Evidence from Korean business groups. Journal of Business Finance & Accounting 34: 740–66. [Google Scholar]
- Bae, Kee-Hong, Jun-Koo Kang, and Jin-Mo Kim. 2002. Tunneling or value added? Evidence from mergers by Korean business groups. Journal of Finance 57: 2695–740. [Google Scholar] [CrossRef]
- Bebchuk, Lucian, Reinier Kraakman, and George Triantis. 1999. Stock pyramids, cross-ownership, and the dual class equity: The creation and agency costs of separating control from cash flow rights. In Concentrated Corporate Ownership. Edited by Randall K. Morck. Chicago: University of Chicago Press. [Google Scholar]
- Berger, Philip G., and Eli Ofek. 1995. Diversification’s effect on firm value. Journal of Financial Economics 37: 39–65. [Google Scholar] [CrossRef]
- Bertrand, Marianne, Simon Johnson, Krislert Samphantharak, and Antoinette Schoar. 2008. Mixing family with business: A study of Thai business groups and the families behind them. Journal of Financial Economics 88: 466–98. [Google Scholar] [CrossRef]
- Bertrand, Marianne, Paras Mehta, and Sendhil Mullainathan. 2002. Ferreting out tunneling: An application to Indian business groups. Quarterly Journal of Economics 117: 121–48. [Google Scholar] [CrossRef]
- Bianco, Magda, and Giovanna Nicodano. 2006. Pyramidal groups and debt. European Economic Review 50: 937–61. [Google Scholar] [CrossRef]
- Chang, Sea Jin, and Jaebum Hong. 2002. How much does the business group matter in Korea? Strategic Management Journal 23: 265. [Google Scholar] [CrossRef]
- Chava, Sudheer, Dmitry Livdan, and Amiyatosh K. Purnanandam. 2009. Do shareholder rights affect the cost of bank loans? Review of Financial Studies 22: 2973–3004. [Google Scholar] [CrossRef]
- Chernykh, Lucy. 2008. Ultimate ownership and control in Russia. Journal of Financial Economics 88: 169–92. [Google Scholar] [CrossRef]
- Claessens, Stijn, Simeon Djankov, and Larry Lang. 2000. The separation of ownership and control in East Asian corporations. Journal of Financial Economics 58: 81–112. [Google Scholar] [CrossRef]
- Claessens, Stijn, Simeon Djankov, Joseph P. H. Fan, and Larry Lang. 2002. Disentangling the incentive and entrenchment effects of large shareholdings. Journal of Finance 57: 2741–71. [Google Scholar] [CrossRef]
- Comment, Robert, and Gregg A. Jarrell. 1995. Corporate focus and stock returns. Journal of Financial Economics 37: 67–87. [Google Scholar] [CrossRef]
- Davydenko, Sergei A., and Ilya A. Strebulaev. 2007. Strategic Actions and Credit Spreads: An Empirical Investigation. Journal of Finance 62: 2633–71. [Google Scholar] [CrossRef]
- DeLong, Gayle L. 2001. Stockholder gains from focusing versus diversifying bank mergers. Journal of Financial Economics 59: 221–52. [Google Scholar] [CrossRef]
- DeYoung, Robert, and Karin P. Roland. 2001. Product mix and earnings volatility at commercial banks: Evidence from a degree of leverage model. Journal of Financial Intermediation 10: 54–84. [Google Scholar] [CrossRef]
- Demirguc-Kunt, Asli, and Ross Levine. 2001. Financial Structure and Economic Growth: A Cross-Country Comparison of Banks, Markets, and Development. Cambridge: MIT Press. [Google Scholar]
- Denis, David J., Diane K. Denis, and Atulya Sarin. 1997. Agency problems, equity ownership, and corporate diversification. Journal of Finance 52: 135–60. [Google Scholar] [CrossRef]
- Diamond, Douglas W. 1984. Financial intermediation and delegated monitoring. Review of Economic Studies 59: 393–414. [Google Scholar] [CrossRef]
- Diamond, Douglas W. 2004. Committing to commit: Short-term debt when enforcement is costly. AFA Presidential Address. Journal of Finance 59: 1447–80. [Google Scholar] [CrossRef]
- Doidge, Craig, G. Andrew Karolyi, and René M. Stulz. 2004. Why are foreign firms listed in the U.S. worth more? Journal of Financial Economics 71: 205–38. [Google Scholar] [CrossRef]
- Easley, David, and Maureen O’Hara. 2004. Information and the cost of capital. Journal of Finance 59: 1553–83. [Google Scholar] [CrossRef]
- Esty, Benjamin C., and William L. Megginson. 2003. Creditor rights, enforcement, and debt ownership structure: Evidence from the global syndicated loan market. Journal of Financial and Quantitative Analysis 38: 37–59. [Google Scholar] [CrossRef]
- Ferris, Stephen P., Kenneth A. Kim, and Pattanaporn Kitsabunnarat. 2003. The costs (and benefits?) of diversified business groups: The case of Korean chaebols. Journal of Banking & Finance 27: 251–73. [Google Scholar]
- Foerster, Stephen R., and G. Andrew Karolyi. 1999. The effects of market segmentation and investor recognition on asset prices: evidence from foreign stocks listing in the U.S. Journal of Finance 54: 981–1014. [Google Scholar] [CrossRef]
- Francis, Bill, Hasan Iftekhar, Koetter Michael, and Qiang Wu. 2012a. Corporate Boards and Bank Loan Contracting. Journal of Financial Research 35: 521–53. [Google Scholar] [CrossRef]
- Francis, Bill, Iftekhar Hasan, and Liang Song. 2012b. Are Firm- and Country-Specific Governance Substitutes? Evidence from Financial Contracts in Emerging Markets. Journal of Financial Research 35: 343–75. [Google Scholar] [CrossRef]
- Francis, Bill, Hasan Iftekhar, Melih Küllü, and Mingming Zhou. 2018. Should Banks Diversify or Focus? Know Thyself, the Role of Abilities. Economic Systems 42: 106–18. [Google Scholar] [CrossRef]
- Freixas, Xavier, and Jean-Charles Rochet. 1997. Microeconomics of Banking. Cambridge: MIT Press. [Google Scholar]
- Gomes, Armando. 2000. Going Public without Governance: Managerial Reputation Effects. Journal of Finance 55: 15–46. [Google Scholar] [CrossRef]
- Gonenc, Halit, Ozgur B. Kan, and Ece C. Karadagli. 2007. Business groups and internal capital markets. Emerging Markets Finance and Trade 43: 63–81. [Google Scholar] [CrossRef]
- Gopalan, Radhakrishnan, Vikram Nanda, and Amit Seru. 2007. Affiliated firms and financial support: Evidence from Indian business groups. Journal of Financial Economics 86: 759–95. [Google Scholar] [CrossRef]
- Graham, John R., Si Li, and Jiaping Qiu. 2008. Corporate misreporting and bank loan contracting. Journal of Financial Economics 89: 44–61. [Google Scholar] [CrossRef]
- Guillen, Mauro F. 2000. Business groups in emerging economies: A resource-based view. Academy of Management Journal 43: 362–80. [Google Scholar] [CrossRef]
- Gul, Ferdinand A., Jeong-Bon Kim, and Annie A. Qiu. 2010. Ownership concentration, foreign shareholding, audit quality, and stock price synchronicity: Evidence from China. Journal of Financial Economics 95: 425–42. [Google Scholar] [CrossRef]
- Gunduz, Lokman, and Ekrem Tatoglu. 2003. A comparison of the financial characteristics of group affiliated and independent firms in Turkey. European Business Review 15: 48. [Google Scholar] [CrossRef]
- Guner, A. Burak. 2006. Loan Sales and the Cost of Borrowing. Review of Financial Studies 19: 687–716. [Google Scholar] [CrossRef]
- Kang, Jun-Koo, and Rene Stulz. 1997. Why Is There a Home Bias? An Analysis of Foreign Portfolio Equity Ownership in Japan. Journal of Financial Economics 46: 3–28. [Google Scholar] [CrossRef]
- Karolyi, G. Andrew. 2012. Corporate Governance, Agency Problems and International Cross-listings: A Defense of the Bonding Hypothesis. Emerging Markets Review 13: 516–47. [Google Scholar] [CrossRef]
- Khanna, Tarun, and Krishna Palepu. 2000a. Is group affiliation profitable in emerging markets: An analysis of Indian diversified business groups. Journal of Finance 55: 867–91. [Google Scholar] [CrossRef]
- Khanna, Tarun, and Krishna Palepu. 2000b. The future of business groups: Long run evidence from Chile. Academy of Management Journal 43: 268–85. [Google Scholar] [CrossRef]
- Khanna, Tarun, and Jan W. Rivkin. 2001. Estimating the performance effects of business groups in emerging markets. Strategic Management Journal 22: 45–74. [Google Scholar] [CrossRef]
- Khanna, Tarun, and Yishay Yafeh. 2005. Business groups and risk sharing around the world. Journal of Business 78: 301–40. [Google Scholar] [CrossRef]
- Khanna, Tarun, and Yishay Yafeh. 2007. Business groups in emerging markets: Paragons or parasites? Journal of Economic Literature 45: 331–72. [Google Scholar] [CrossRef]
- Küllü, Melih, Doug Dyer, Gokhan Yilmaz, and Zenu Sharma. 2018. The Impact of Business Group Affiliation on Stock Price Informativeness: Evidence from an Emerging Market. Financial Markets, Institutions and Instruments. forthcoming. [Google Scholar]
- La Porta, Rafael, Florencio Lopez-de-Silanes, Andrei Shleifer, and Robert W. Vishny. 1998. Law and finance. Journal of Political Economy 106: 1113–55. [Google Scholar] [CrossRef]
- La Porta, Rafael, Florencio Lopez-de-Silanes, and Andrei Shleifer. 1999. Corporate ownership around the world. Journal of Finance 54: 471–517. [Google Scholar] [CrossRef]
- La Porta, Rafael, Florencio Lopez-de-Silanes, Andrei Shleifer, and Robert W. Vishny. 2002. Investor protection and corporate valuation. Journal of Finance 57: 1147–70. [Google Scholar] [CrossRef]
- Laeven, Luc, and Ross Levine. 2007. Is there a diversification discount in financial conglomerates? Journal of Financial Economics 85: 331–67. [Google Scholar] [CrossRef]
- Lang, Larry H. P., and Rene M. Stulz. 1994. Tobin’s q, corporate diversification, and firm performance. Journal of Political Economy 102: 1248–80. [Google Scholar]
- Lin, Chen, Yue Ma, Paul Malatesta, and Yuhai Xuan. 2011. Ownership structure and the cost of corporate borrowing. Journal of Financial Economics 100: 1–23. [Google Scholar] [CrossRef] [Green Version]
- Lins, Karl, Deon Strickland, and Marc Zenner. 2005. Do non-U.S. firms issue equity on U.S. exchanges to relax capital constraints? Journal of Financial and Quantitative Analysis 40: 109–33. [Google Scholar] [CrossRef]
- Love, Inessa, Lorenzo A. Preve, and Virginia Sarria-Allende. 2007. Trade credit and bank credit: Evidence from recent financial crises. Journal of Financial Economics 83: 453–69. [Google Scholar] [CrossRef]
- Manos, Ronny, Victor Murinde, and Christopher J. Green. 2007. Leverage and business groups: Evidence from Indian firms. Journal of Economics and Business 59: 443–65. [Google Scholar] [CrossRef]
- Masulis, Ronald W., Peter Kien Pham, and Jason Zein. 2011. Family Business Groups around the World: Financing Advantages, Control Motivations, and Organizational Choices. Review of Financial Studies 24: 3556–600. [Google Scholar] [CrossRef]
- Montgomery, Cynthia A. 1994. Corporate diversification. Journal of Economic Perspectives 8: 163–78. [Google Scholar] [CrossRef]
- Morck, Randall, Bernard Yeung, and Wayne Yu. 2000. The information content of stock markets: Why do emerging markets have synchronous stock price movements? Journal of Financial Economics 58: 215–60. [Google Scholar] [CrossRef]
- Qian, Jun, and Philip E. Strahan. 2007. How laws and institutions shape financial contracts: The case of bank loans. Journal of Finance 62: 2803–34. [Google Scholar] [CrossRef]
- Rajan, Raghuram, Henri Servaes, and Luigi Zingales. 2000. The cost of diversity: The diversification discount and inefficient investment. Journal of Finance 55: 35–80. [Google Scholar] [CrossRef]
- Scharfstein, David S., and Jeremy C. Stein. 2000. The dark side of internal capital markets: Divisional rent-seeking and inefficient investment. The Journal of Finance 55: 2537–64. [Google Scholar] [CrossRef]
- Shleifer, Andrei. 1998. State versus Private Ownership. The Journal of Economic Perspectives 12: 133–50. [Google Scholar] [CrossRef]
- Shumilov, Andrey. 2008. Performance of Business Groups: Evidence from Post-Crisis Russia. BOFIT Discussion Paper 24/2008. Finland: Bank of Finland, Institute for Economies in Transition. [Google Scholar]
- Stiroh, Kevin J. 2004. Diversification in banking: Is noninterest income the answer? Journal of Money, Credit and Banking 36: 853–82. [Google Scholar] [CrossRef]
- Strahan, Philip E. 1999. Borrower Risk and the Price and Nonprice Terms of Bank Loans. Working Paper. Boston: Boston College. [Google Scholar]
- Sufi, Amir. 2007. Information asymmetry and financing arrangements: Evidence from syndicated loans. Journal of Finance 62: 629–68. [Google Scholar] [CrossRef]
- Turhan, Ibrahim. 2012. IMKB’nin Gorunumu ve Gelecek Vizyonu. President’s Press Release on 21 May 2012. Istanbul: Borsa Istanbul. [Google Scholar]
- Weinstein, David E., and Yishay Yafeh. 1995. Japan’s corporate groups: Collusive or competitive? An empirical investigation of keiretsu behavior. Journal of Industrial Economics 43: 359–76. [Google Scholar] [CrossRef]
- Yurtoglu, B. Burcin. 2000. Ownership, control and performance of Turkish listed firms. Empirica 27: 193–222. [Google Scholar] [CrossRef]
| 1 | Corporate finance theory advocates that firms need to focus in order to lessen possible agency problems and employ management expertise (Denis et al. 1997). Moreover, many diversification studies find that membership in diversified conglomerates destroys value (Lang and Stulz 1994; Berger and Ofek 1995), and focus leads to superior performance compared to diversifying (DeLong 2001; Laeven and Levine 2007). On the other hand, Khanna and Palepu (2000b) argue that emerging market settings differ, and diversification may not destroy value in those settings. |
| 2 | Unlike widely-held US conglomerates, emerging market business groups tend to have concentrated corporate control (La Porta et al. 1998). They can be private family firms, or public, but governed with a very limited number of major shareholders. |
| 3 | Performance impact of group affiliation (Khanna and Rivkin 2001), the groups’ role of circumventing market inefficiencies (Chang and Hong 2002) and comparisons of affiliated and unaffiliated firms (Khanna and Palepu 2000a; Manos et al. 2007) are related subjects of study. |
| 4 | Business groups have been studied in various emerging market settings such as Chili (Khanna and Palepu 2000b), Thailand (Bertrand et al. 2008), South Korea (Bae and Jeong 2007; Bae et al. 2002), India (Khanna and Palepu 2000a; Bertrand et al. 2002; Gopalan et al. 2007), Russia (Chernykh 2008; Shumilov 2008), and in cross-country studies (Guillen 2000; Khanna and Rivkin 2001; Khanna and Yafeh 2005; Claessens et al. 2000). |
| 5 | Information asymmetry between borrowers and lenders is highly important in the lending process (Sufi 2007). Banks have access to proprietary information, and they are more effective monitors than equity and bond holders (Diamond 1984). |
| 6 | For example, these groups enjoy exceptional access to government and foreign loans. |
| 7 | Qian and Strahan (2007) study the creditor protection concept in syndicate lending. Bae and Goyal (2009) examine judicial efficiency in terms of lending structure and loan pricing, and Esty and Megginson (2003) examine project finance loans. |
| 8 | Existing theoretical literature shows that corporate governance and debt policies are highly related (Diamond 2004). Empirical studies show that both firm-level governance characteristics (Sufi 2007; Francis et al. 2012a; Chava et al. 2009), and country-level regulatory environment and business firm characteristics are highly important factors regarding bank loans and loan contract terms (Qian and Strahan 2007; Bae and Goyal 2009). Firm-level corporate governance has been found to have an impact on bank loan contracting (Francis et al. 2012b). The ability of controlling shareholders to expropriate from minority shareholders and creditors is a major concern (Claessens et al. 2000), and a main source of corporate credit risk is strategic actions of self-interested dominant shareholders (Aslan and Kumar 2012). |
| 9 | Khanna and Rivkin (2001) look at Turkish business groups in a cross-country study. Yurtoglu (2000) studies concentrated ownership structure, and its negative effects on firm performance. Gunduz and Tatoglu (2003) examine affiliated and unaffiliated firm performance in the Turkish market, and find that performance of these firms does not differ. Gonenc et al. (2007) examine the performance of affiliated and unaffiliated firms in Turkey, and show that internal capital markets are important, and that group affiliation improves accounting but does not improve market performance. |
| 10 | Effective corporate governance is expected to decrease the risks that are associated with information asymmetries. Easley and O’Hara (2004) argue that disclosure of information lowers the informational risk, and therefore decreases the cost of capital. |
| 11 | The Turkish economy is the fifteenth largest in the world, and the sixth largest in Europe based on World Bank gross domestic product (GDP) rankings. (Figure A1) Its economy has been steadily growing despite several crises it has faced in the last decade. It experienced an average growth rate of 6.8% from 2002 to 2007. After the 2008 global crisis, growth reached 9.2% in 2010, and 8.5% in 2011. |
| 12 | Borsa Istanbul, President’s Press Release on 21 May 2012. |
| 13 | Banks of several business groups had collapsed or were taken over by the government during the 1994, 1999 and 2001 financial crises. |
| 14 | In addition to these variables, covenants, secured or not, and other terms are also used in the literature. However, due to missing data, which is also common in some other emerging markets, these variables cannot be included in the analysis. |
| 15 | Not all group firms are public. In contrast, there are many private group firms, and dominant shareholders have a significant control in terms of group firm management. |
| 16 | Here we use 0.50 as the benchmark to define “high correlations” and “relatively high correlations.” Although this benchmark is rather arbitrary, it is a practical one for discussions. |

Table 1.
Descriptive statistics. Table 1 presents the descriptive statistics for loan contract characteristics (Spread, Deal Amount, Maturity), borrower organizational structure characteristics (Group Affiliation Extent, Foreign Ownership, Foreign Group, Government Ownership, Financial Firm), borrower operational strategy characteristics (Group Bank, Diversification), borrower internationalization characteristics (Cross-listed), other borrower characteristics (Total Assets, Profitability, Tobin’s Q, Leverage, Tangibility), and the time range of the sample data. Deal Amount and Total Assets values are in millions. Maturity is expressed in months. Group Affiliation Extent is calculated based on the ownership percentage information of borrower firms (0% indicates that there is no group association, and 100% means that the associated group owns all the firm’s shares). Binary variables indicate whether a Group Bank, Foreign Ownership, Government Ownership, or Foreign Group Affiliation exist, whether the borrower is Focused or Diversified, whether it is a Financial Firm, and whether it is Cross-listed).
| Variable | Obs. | Mean | Median | Std. Dev. | Min. | Max. |
|---|---|---|---|---|---|---|
| Maturity | 278 | 20.74 | 12 | 20.60 | 9 | 156 |
| Ln Maturity | 278 | 2.80 | 2.48 | 0.58 | 2.20 | 5.05 |
| Spread | 278 | 107.15 | 80 | 83.22 | 5.25 | 450 |
| Ln Spread | 278 | 4.44 | 4.38 | 0.69 | 1.66 | 6.11 |
| Deal Amount * | 278 | 384.34 | 250 | 415.98 | 15 | 3000 |
| Ln Deal Amount | 278 | 5.43 | 5.52 | 1.10 | 2.71 | 8.01 |
| Group Aff Extent | 278 | 57.20 | 52 | 21.30 | 25.33 | 99 |
| Ln Grp Aff Ext | 278 | 3.97 | 3.95 | 0.39 | 3.23 | 4.60 |
| Group Bank | 278 | 0.95 | 1 | 0.22 | 0 | 1 |
| Diversified | 278 | 0.86 | 1 | 0.35 | 0 | 1 |
| Foreign Group | 278 | 0.05 | 0 | 0.21 | 0 | 1 |
| Foreign Ownership | 278 | 0.40 | 0 | 0.49 | 0 | 1 |
| Financial | 278 | 0.83 | 1 | 0.38 | 0 | 1 |
| Cross-listed | 278 | 0.60 | 1 | 0.49 | 0 | 1 |
| Gov. Ownership | 278 | 0.03 | 0 | 0.17 | 0 | 1 |
| Total Assets * | 278 | 20,811.11 | 11,613.77 | 23,340.96 | 227.40 | 97,299.87 |
| Ln Assets | 278 | 16.11 | 16.27 | 1.36 | 12.33 | 18.39 |
| Tobin’s Q | 278 | 1.50 | 1.33 | 0.54 | 1.03 | 4.52 |
| Tangibility | 278 | 0.07 | 0.03 | 0.12 | 0.0004 | 0.67 |
| Leverage | 278 | 0.28 | 0.26 | 0.16 | 0.05 | 0.85 |
| Profitability | 278 | 0.03 | 0.02 | 0.03 | −0.13 | 0.18 |
* Values are in millions.
Table 2.
Correlation matrix. Table 2 displays all pairwise correlation coefficients of the variables used in the analysis with the Bonferroni adjustment to calculated significance levels. The definitions of the variables remain the same as in Table 1. All the correlation coefficients with a Bonferroni-adjusted significance level of 5% or better are starred.
| Variables | {1} | {2} | {3} | {4} | {5} | {6} | {7} | {8} | {9} | {10} | {11} | {12} | {13} | {14} | {15} | |
|---|---|---|---|---|---|---|---|---|---|---|---|---|---|---|---|---|
| {1} | LnMaturity | 1 | ||||||||||||||
| {2} | LnSpread | 0.42 * | 1 | |||||||||||||
| {3} | LnDeal Amt | 0.20 * | −0.01 | 1 | ||||||||||||
| {4} | LnGrpAffExt | −0.14 | 0.09 | −0.35 * | 1 | |||||||||||
| {5} | Group Bank | −0.38 * | −0.33 * | −0.18 * | 0.13 | 1 | ||||||||||
| {6} | Diversified | −0.21 * | −0.24 * | 0.13 | −0.38 * | 0.24 * | 1 | |||||||||
| {7} | ForeignGrp | 0.15 | 0.21 * | 0.19 * | 0.18 * | −0.30 * | −0.38 * | 1 | ||||||||
| {8} | ForeignOwn | 0.12 | 0.03 | 0.22 * | −0.36 * | −0.09 | −0.21 * | 0.36 * | 1 | |||||||
| {9} | Financial | −0.50 * | −0.49 * | −0.07 | −0.06 | 0.53 * | 0.39 * | −0.11 | −0.04 | 1 | ||||||
| {10} | Gov Own | −0.04 | −0.03 | 0.04 | 0.05 | 0.06 | 0.11 | −0.10 | −0.26 * | 0.09 | 1 | |||||
| {11} | Crosslisted | −0.17 * | −0.26 * | 0.23 * | −0.28 * | 0.37 * | 0.20 * | −0.11 | 0.39 * | 0.39 * | 0.40 * | 1 | ||||
| {12} | Ln Assets | −0.16 | −0.23 * | 0.56 * | −0.41 * | 0.23 * | 0.43 * | 0.08 | 0.22 * | 0.41 * | 0.12 | 0.59 * | 1 | |||
| {13} | Tobin’s Q | 0.45 * | 0.05 | 0.09 | −0.19 * | −0.28 * | −0.08 | 0.00 | 0.00 | −0.52 * | −0.27 * | −0.17 | −0.17 | 1 | ||
| {14} | Tangibility | 0.33 * | 0.18 | 0.06 | −0.19 * | −0.34 * | −0.02 | 0.04 | −0.10 | −0.61 * | −0.31 * | −0.26 * | −0.14 | 0.46 * | 1 | |
| {15} | Leverage | 0.07 | 0.07 | −0.11 | 0.13 | 0.04 | −0.15 | −0.02 | 0.03 | −0.04 | −0.07 | −0.17 * | −0.15 | −0.13 | −0.17 * | 1 |
| {16} | Profitability | 0.21 * | 0.10 | −0.11 | −0.21 * | −0.20 * | 0.00 | 0.11 | 0.07 | −0.23 * | −0.27 * | −0.13 | −0.24 * | 0.51 * | 0.27 * | −0.2 * |
Table 3.
OLS regressions of Cost of Loans on Group Affiliation Extent without any control variables. Table 3 presents the pooled ordinary least squares (OLS) regression results of ln (Maturity), ln (Spread), and ln (DealAmount) on Group Affiliation Extent. Group Affiliation Extent is calculated based on the percentage of group ownership in borrower firms (0% indicates that there is no group association, and 100% means that the associated group owns all the firm’s shares). No control variables are included. Robust standard errors are reported in parentheses. Each model is clustered at the group level to control for possible group fixed effects. *, **, and *** represent significance levels of 10%, 5%, and 1% respectively.
| Ln Spread | Ln Maturity | Ln DealAmount | |
|---|---|---|---|
| {1} | {2} | {3} | |
| Ln Group Aff. Extent | 0.145 ** | −1.137 *** | −0.182 ** |
| (0.072) | (0.129) | (0.073) | |
| Constant | 3.983 *** | 9.905 *** | 3.695 *** |
| (0.294) | (0.519) | (0.303) | |
| Loan Type Controls | No | No | No |
| Industry Controls | No | No | No |
| Year Controls | No | No | No |
| Observations | 448 | 580 | 540 |
| R-Square | 0.006 | 0.108 | 0.007 |
Table 4.
OLS regressions of spread on Group Affiliation Extent, Group Bank, Foreign Group, Foreign Ownership, Government Ownership, Financial Firm, Cross-listed, Diversified, and Borrower and Loan Characteristics. Table 4 presents the pooled ordinary least squares (OLS) regression results of ln (Spread) on Group Affiliation Extent, Group Bank, Foreign Group, Foreign Ownership, Government Ownership, Financial Firm, Cross-listed, Diversified, and Borrower and Loan Characteristics. Group Affiliation Extent is calculated based on the percentage of group ownership in borrower firms (0% indicates that there is no group association, and 100% means that the associated group owns all the firm’s shares). Binary variables indicate whether a Group Bank, Foreign Ownership, Government Ownership, or Foreign Group Affiliation exist, whether the borrower is Focused or Diversified, whether it is a Financial Firm, and whether it is Cross-listed. Control variables include firm and loan characteristics, and loan type, year and industry dummies. Robust standard errors are reported in parentheses. Each model is clustered at the group level to control for possible group fixed effects. *, **, and *** represent significance levels of 10%, 5%, and 1% respectively.
| Ln Spread | ||||||||
|---|---|---|---|---|---|---|---|---|
| {1} | {2} | {3} | {4} | {5} | {6} | {7} | {8} | |
| Ln Group Aff. Extent | 0.183 * | |||||||
| (0.09) | ||||||||
| Group Bank | 0.021 | |||||||
| (0.55) | ||||||||
| Foreign Group | 0.193 | |||||||
| (0.16) | ||||||||
| Foreign Ownership | −0.130 * | |||||||
| (0.08) | ||||||||
| Government Ownership | 0.178 * | |||||||
| (0.10) | ||||||||
| Financial Firm | 0.092 | |||||||
| (0.17) | ||||||||
| Cross-listed | −0.151 | |||||||
| (0.15) | ||||||||
| Diversified | −0.060 | |||||||
| (0.11) | ||||||||
| Ln Assets t−1 | −0.033 | −0.0718 * | −0.066 | −0.052 | −0.0747 * | −0.0759 ** | −0.035 | −0.062 |
| (0.05) | (0.04) | (0.04) | (0.05) | (0.04) | (0.04) | (0.05) | (0.04) | |
| Profitability t−1 | 3.618 *** | 3.549 *** | 3.550 *** | 3.415 *** | 3.559 *** | 3.512 *** | 3.524 *** | 3.569 *** |
| (0.79) | (0.81) | (0.82) | (0.75) | (0.80) | (0.83) | (0.81) | (0.79) | |
| Tobin’s Q t−1 | −0.193 | −0.234 | −0.223 * | −0.228 | −0.231 * | −0.233 * | −0.203 | −0.230 * |
| (0.13) | (0.16) | (0.13) | (0.14) | (0.13) | (0.13) | (0.14) | (0.13) | |
| Leverage t−1 | −0.200 | −0.319 | −0.304 | −0.287 | −0.279 | −0.326 | −0.307 | −0.322 |
| (0.32) | (0.25) | (0.28) | (0.31) | (0.29) | (0.28) | (0.29) | (0.29) | |
| Tangibility t−1 | 0.347 | 0.236 | 0.192 | 0.239 | 0.266 | 0.241 | 0.340 | 0.236 |
| (0.62) | (0.57) | (0.62) | (0.59) | (0.61) | (0.60) | (0.63) | (0.60) | |
| Ln Deal Amount | −0.014 | −0.009 | −0.012 | −0.013 | −0.005 | −0.009 | −0.004 | −0.012 |
| (0.06) | (0.06) | (0.07) | (0.06) | (0.07) | (0.07) | (0.07) | (0.06) | |
| Ln Maturity | 0.470 *** | 0.445 *** | 0.456 *** | 0.458 *** | 0.450 *** | 0.437 *** | 0.456 *** | 0.442 *** |
| (0.09) | (0.10) | (0.10) | (0.09) | (0.10) | (0.10) | (0.10) | (0.09) | |
| Constant | 3.454 *** | 5.070 *** | 4.666 *** | 4.901 *** | 5.008 *** | 4.572 *** | 4.309 *** | 4.884 *** |
| (1.15) | (0.72) | (0.77) | (0.74) | (0.70) | (0.87) | (1.10) | (0.81) | |
| Loan Type Controls | Yes | Yes | Yes | Yes | Yes | Yes | Yes | Yes |
| Industry Controls | Yes | Yes | Yes | Yes | Yes | Yes | Yes | Yes |
| Year Controls | Yes | Yes | Yes | Yes | Yes | Yes | Yes | Yes |
| Observations | 278 | 278 | 278 | 278 | 278 | 278 | 278 | 278 |
| R-Square | 0.653 | 0.647 | 0.65 | 0.654 | 0.649 | 0.648 | 0.651 | 0.648 |
| Adj. R-Square | 0.596 | 0.59 | 0.593 | 0.597 | 0.592 | 0.59 | 0.594 | 0.59 |
Table 5.
OLS regressions of maturity on Group Affiliation Extent, Group Bank, Foreign Group, Foreign Ownership, Government Ownership, Financial Firm, Cross-listed, Diversified, and Borrower and Loan Characteristics. Table 5 presents the pooled ordinary least squares (OLS) regression results of ln (Maturity) on Group Affiliation Extent, Group Bank, Foreign Group, Foreign Ownership, Government Ownership, Financial Firm, Cross-listed, Diversified and Borrower and Loan Characteristics. Group Affiliation Extent is calculated based on percentage of group ownership in borrower firms (0% indicates that there is no group association, and 100% means that the associated group owns all the firm’s shares). Binary variables indicate whether a Group Bank, Foreign Ownership, Government Ownership, or Foreign Group Affiliation exist, whether the borrower is Focused or Diversified, whether the firm is Financial Firm, and whether it is Cross-listed. Control variables include firm and loan characteristics, and loan type, year, and industry dummies. Robust standard errors are reported in parentheses. Each model is clustered at the group level to control for possible group fixed effects. *, **, and *** represent significance levels of 10%, 5%, and 1% respectively.
| Ln Maturity | ||||||||
|---|---|---|---|---|---|---|---|---|
| {1} | {2} | {3} | {4} | {5} | {6} | {7} | {8} | |
| Ln Group Aff. Extent | −0.257 *** | |||||||
| (0.08) | ||||||||
| Group Bank | −0.274 | |||||||
| (0.27) | ||||||||
| Foreign Group | −0.291 *** | |||||||
| (0.06) | ||||||||
| Foreign Ownership | 0.111 | |||||||
| (0.07) | ||||||||
| Government Ownership | −0.219 *** | |||||||
| (0.05) | ||||||||
| Financial Firm | 0.338 | |||||||
| (0.25) | ||||||||
| Cross-listed | 0.160 | |||||||
| (0.11) | ||||||||
| Diversified | −0.063 | |||||||
| (0.12) | ||||||||
| Ln Assets t−1 | −0.0707 * | −0.009 | −0.026 | −0.034 | −0.014 | −0.037 | −0.057 | −0.010 |
| (0.04) | (0.04) | (0.04) | (0.04) | (0.03) | (0.04) | (0.04) | (0.04) | |
| Profitability t−1 | −3.918 *** | −3.859 *** | −3.873 *** | −3.794 *** | −3.918 *** | −3.954 *** | −3.871 *** | −3.896 *** |
| (1.15) | (1.05) | (1.16) | (1.30) | (1.22) | (1.20) | (1.20) | (1.18) | |
| Tobin’s Q t−1 | 0.260 ** | 0.360 *** | 0.306 ** | 0.319 *** | 0.322 *** | 0.307 ** | 0.292 ** | 0.324 *** |
| (0.11) | (0.11) | (0.11) | (0.11) | (0.11) | (0.12) | (0.11) | (0.11) | |
| Leverage t−1 | −0.024 | 0.171 | 0.121 | 0.116 | 0.093 | 0.101 | 0.130 | 0.133 |
| (0.18) | (0.15) | (0.15) | (0.19) | (0.15) | (0.15) | (0.15) | (0.16) | |
| Tangibility t−1 | −0.288 | −0.090 | −0.064 | −0.137 | −0.169 | −0.125 | −0.244 | −0.139 |
| (0.30) | (0.29) | (0.27) | (0.33) | (0.30) | (0.32) | (0.31) | (0.30) | |
| Ln Deal Amount | 0.033 | 0.014 | 0.031 | 0.031 | 0.022 | 0.029 | 0.021 | 0.026 |
| (0.05) | (0.05) | (0.05) | (0.05) | (0.05) | (0.05) | (0.05) | (0.05) | |
| Ln Spread | 0.321 *** | 0.310 *** | 0.316 *** | 0.322 *** | 0.315 *** | 0.300 *** | 0.319 *** | 0.311 *** |
| (0.09) | (0.09) | (0.09) | (0.08) | (0.09) | (0.09) | (0.08) | (0.09) | |
| Constant | 4.256 *** | 1.748 ** | 2.183 *** | 2.265 *** | 1.724 ** | 1.881 * | 2.933 *** | 1.663 * |
| (1.03) | (0.76) | (0.74) | (0.75) | (0.74) | (0.93) | (0.86) | (0.82) | |
| Loan Type Controls | Yes | Yes | Yes | Yes | Yes | Yes | Yes | Yes |
| Industry Controls | Yes | Yes | Yes | Yes | Yes | Yes | Yes | Yes |
| Year Controls | Yes | Yes | Yes | Yes | Yes | Yes | Yes | Yes |
| Observations | 278 | 278 | 278 | 278 | 278 | 278 | 278 | 278 |
| R-Square | 0.676 | 0.664 | 0.667 | 0.666 | 0.663 | 0.668 | 0.666 | 0.66 |
| Adj. R-Square | 0.622 | 0.608 | 0.613 | 0.611 | 0.608 | 0.614 | 0.611 | 0.605 |
Table 6.
OLS regressions of Deal Amount on Group Affiliation Extent, Group Bank, Foreign Group, Foreign Ownership, Government Ownership, Financial Firm, Cross-listed, Diversified, and Borrower and Loan Characteristics. Table 6 presents the pooled ordinary least squares (OLS) regression results of ln (Deal Amount) on Group Affiliation Extent, Group Bank, Foreign Group, Foreign Ownership, Government Ownership, Financial Firm, Cross-listed, Diversified, and Borrower and Loan Characteristics. Group Affiliation Extent is calculated based on the percentage of group ownership in borrower firms (0% indicates that there is no group association, and 100% means that the associated group owns all the firm’s shares). Binary variables indicate whether a Group Bank, Foreign Ownership, Government Ownership, or Foreign Group Affiliation exist, and whether the borrower is Focused or Diversified, whether it is a Financial Firm, and whether it is Cross-listed. Control variables include firm and loan characteristics, and loan type, year, and industry dummies. Robust standard errors are reported in parentheses. Each model is clustered at the group level to control for possible group fixed effects. *, **, and *** represent significance levels of 10%, 5%, and 1% respectively.
| Ln Deal Amount | ||||||||
|---|---|---|---|---|---|---|---|---|
| {1} | {2} | {3} | {4} | {5} | {6} | {7} | {8} | |
| Ln Group Aff. Extent | 0.079 | |||||||
| (0.12) | ||||||||
| Group Bank | −0.716 *** | |||||||
| (0.17) | ||||||||
| Foreign Group | 0.094 | |||||||
| (0.15) | ||||||||
| Foreign Ownership | −0.039 | |||||||
| (0.09) | ||||||||
| Government Ownership | −0.305 ** | |||||||
| (0.12) | ||||||||
| Financial Firm | −0.045 | |||||||
| (0.12) | ||||||||
| Cross-listed | 0.139 | |||||||
| (0.11) | ||||||||
| Diversified | −0.170 | |||||||
| (0.12) | ||||||||
| Ln Assets t−1 | 0.536 *** | 0.529 *** | 0.523 *** | 0.526 *** | 0.524 *** | 0.524 *** | 0.486 *** | 0.544 *** |
| (0.05) | (0.03) | (0.03) | (0.04) | (0.04) | (0.04) | (0.04) | (0.04) | |
| Profitability t−1 | −2.838 * | −2.733 ** | −2.882 * | −2.915 * | −2.914 * | −2.879 * | −2.890 * | −2.812 * |
| (1.51) | (1.20) | (1.47) | (1.45) | (1.48) | (1.50) | (1.48) | (1.38) | |
| Tobin’s Q t−1 | 0.164 | 0.247 ** | 0.153 | 0.149 | 0.149 | 0.151 | 0.125 | 0.150 |
| (0.10) | (0.10) | (0.11) | (0.11) | (0.11) | (0.11) | (0.11) | (0.10) | |
| Leverage t−1 | −1.091 *** | −1.013 *** | −1.135 *** | −1.133 *** | −1.194 *** | −1.136 *** | −1.141 *** | −1.150 *** |
| (0.22) | (0.21) | (0.19) | (0.20) | (0.19) | (0.20) | (0.19) | (0.20) | |
| Tangibility t−1 | −1.221 | −1.109 | −1.293 * | −1.269 * | −1.308 * | −1.272 * | −1.360 * | −1.271 * |
| (0.75) | (0.67) | (0.73) | (0.73) | (0.72) | (0.72) | (0.73) | (0.68) | |
| Ln Maturity | 0.079 | 0.032 | 0.073 | 0.072 | 0.050 | 0.069 | 0.050 | 0.059 |
| (0.12) | (0.10) | (0.12) | (0.12) | (0.11) | (0.11) | (0.12) | (0.12) | |
| Ln Spread | −0.023 | −0.014 | −0.020 | −0.021 | −0.008 | −0.015 | −0.006 | −0.020 |
| (0.11) | (0.09) | (0.12) | (0.11) | (0.12) | (0.11) | (0.12) | (0.11) | |
| Constant | −2.860 | −2.955 ** | −2.377 * | −2.235 | −2.267 | −2.571 ** | −1.634 | −2.531 * |
| (1.82) | (1.19) | (1.24) | (1.31) | (1.36) | (1.06) | (1.38) | (1.35) | |
| Loan Type Controls | Yes | Yes | Yes | Yes | Yes | Yes | Yes | Yes |
| Industry Controls | Yes | Yes | Yes | Yes | Yes | Yes | Yes | Yes |
| Year Controls | Yes | Yes | Yes | Yes | Yes | Yes | Yes | Yes |
| Observations | 278 | 278 | 278 | 278 | 278 | 278 | 278 | 278 |
| R-Square | 0.78 | 0.787 | 0.78 | 0.78 | 0.781 | 0.779 | 0.781 | 0.781 |
| Adj. R-Square | 0.744 | 0.752 | 0.743 | 0.743 | 0.745 | 0.743 | 0.745 | 0.745 |
Table 7.
OLS regressions of Cost of Loans on Group Affiliation Extent, Group Bank, and Borrower and Loan Characteristics. Table 7 presents the pooled ordinary least squares (OLS) regression results of ln (Maturity), ln (Spread), and ln (DealAmount) on Group Affiliation Extent, Group Bank, interaction terms, and Borrower and Loan Characteristics. Group Affiliation Extent is calculated based on the percentage of group ownership in borrower firms (0% indicates that there is no group association, and 100% means that the associated group owns all the firm’s shares). Control variables include firm and loan characteristics, and loan type, year, and industry dummies. Robust standard errors are reported in parentheses. Each model is clustered at the group level to control for possible group fixed effects. *, **, and *** represent significance levels of 10%, 5%, and 1% respectively.
| Ln Maturity | Ln Spread | Ln DealAmount | |||||||
|---|---|---|---|---|---|---|---|---|---|
| {1} | {2} | {3} | {4} | {5} | {6} | {7} | {8} | {9} | |
| Ln Group Aff. Extent | −0.257 *** | −0.241 *** | 0.427 | 0.183 * | 0.187 *** | −1.055 | 0.0785 | 0.144 | 0.879 |
| (0.08) | (0.09) | (0.40) | (0.09) | (0.06) | (0.68) | (0.12) | (0.10) | (0.82) | |
| Group Bank | −0.17 | 2.464 * | −0.0517 | −4.949 * | −0.768 *** | 2.142 | |||
| (0.27) | (1.44) | (0.53) | (2.44) | (0.18) | (3.42) | ||||
| GrpAff * GroupBank | −0.678 * | 1.262 * | −0.749 | ||||||
| (0.39) | (0.70) | (0.87) | |||||||
| Ln Assets t−1 | −0.0707 * | −0.0611 | −0.0635 | −0.0328 | −0.03 | −0.0247 | 0.536 *** | 0.557 *** | 0.553 *** |
| (0.04) | (0.04) | (0.04) | (0.05) | (0.04) | (0.04) | (0.05) | (0.04) | (0.05) | |
| Profitability t−1 | −3.918 *** | −3.876 *** | −3.771 *** | 3.618 *** | 3.624 *** | 3.423 *** | −2.838 * | −2.615 ** | −2.511 ** |
| (1.15) | (1.03) | (0.93) | (0.79) | (0.80) | (0.90) | (1.51) | (1.21) | (1.12) | |
| Tobin’s Q t−1 | 0.260 ** | 0.286 ** | 0.284 ** | −0.193 | −0.185 | −0.181 | 0.164 | 0.281 *** | 0.279 *** |
| (0.11) | (0.12) | (0.12) | (0.13) | (0.16) | (0.16) | (0.10) | (0.09) | (0.09) | |
| Leverage t−1 | −0.0237 | 0.00624 | −0.0667 | −0.2 | −0.191 | −0.0537 | −1.091 *** | −0.913 *** | −0.991 *** |
| (0.18) | (0.19) | (0.19) | (0.32) | (0.27) | (0.31) | (0.22) | (0.23) | (0.29) | |
| Tangibility t−1 | −0.288 | −0.249 | −0.311 | 0.347 | 0.359 | 0.471 | −1.221 | −1.005 | −1.072 |
| (0.30) | (0.30) | (0.26) | (0.62) | (0.57) | (0.62) | (0.75) | (0.68) | (0.67) | |
| Ln Deal Amount | 0.0329 | 0.024 | 0.0219 | −0.0139 | −0.0166 | −0.0127 | |||
| (0.05) | (0.05) | (0.05) | (0.06) | (0.05) | (0.05) | ||||
| Ln Spread | 0.321 *** | 0.318 *** | 0.322 *** | −0.0229 | −0.0262 | −0.0202 | |||
| (0.09) | (0.09) | (0.10) | (0.11) | (0.09) | (0.09) | ||||
| Ln Maturity | 0.470 *** | 0.469 *** | 0.472 *** | 0.0794 | 0.0558 | 0.051 | |||
| (0.09) | (0.10) | (0.10) | (0.12) | (0.10) | (0.11) | ||||
| Constant | 4.256 *** | 3.600 *** | 1.078 | 3.454 *** | 3.495 *** | 8.123 *** | −2.86 | −4.081 ** | −6.127 * |
| (1.03) | (1.11) | (1.72) | (1.15) | (1.08) | (2.56) | (1.82) | (1.53) | (3.41) | |
| Loan Type Controls | Yes | Yes | Yes | Yes | Yes | Yes | Yes | Yes | Yes |
| Industry Controls | Yes | Yes | Yes | Yes | Yes | Yes | Yes | Yes | Yes |
| Year Controls | Yes | Yes | Yes | Yes | Yes | Yes | Yes | Yes | Yes |
| Observations | 278 | 278 | 278 | 278 | 278 | 278 | 278 | 278 | 278 |
| R-Square | 0.678 | 0.679 | 0.680 | 0.648 | 0.648 | 0.652 | 0.784 | 0.792 | 0.793 |
| Adj. R-Square | 0.623 | 0.623 | 0.623 | 0.588 | 0.587 | 0.589 | 0.747 | 0.756 | 0.756 |
Table 8.
OLS regressions of Cost of Loans on Group Affiliation Extent, Diversified, and Borrower and Loan Characteristics. Table 8 presents the pooled ordinary least squares (OLS) regression results of ln (Maturity), ln (Spread), and ln (DealAmount) on Group Affiliation Extent, Diversified, interaction terms, and Borrower and Loan Characteristics. Group Affiliation Extent is calculated based on the percentage of group ownership in borrower firms (0% indicates that there is no group association, and 100% means that the associated group owns all the firm’s shares). Control variables include firm and loan characteristics, and loan type, year, and industry dummies. Robust standard errors are reported in parentheses. Each model is clustered at the group level to control for possible group fixed effects. *, **, and *** represent significance levels of 10%, 5%, and 1% respectively.
| Ln Maturity | Ln Spread | Ln Deal Amount | |||||||
|---|---|---|---|---|---|---|---|---|---|
| {1} | {2} | {3} | {4} | {5} | {6} | {7} | {8} | {9} | |
| Ln Group Aff. Extent | −0.257 *** | −0.270 *** | −1.619 *** | 0.183 * | 0.179 * | −0.284 | 0.0785 | 0.0567 | −1.446 ** |
| (0.08) | (0.09) | (0.54) | (0.09) | (0.10) | (0.40) | (0.12) | (0.12) | (0.57) | |
| Diversified | −0.105 | −6.295 ** | −0.0289 | −2.123 | −0.16 | −6.955 *** | |||
| (0.11) | (2.34) | (0.11) | (1.80) | (0.12) | (2.43) | ||||
| GrpAff * Diversified | 1.420 ** | 0.48 | 1.558 *** | ||||||
| (0.52) | (0.42) | (0.55) | |||||||
| Ln Assets t−1 | −0.0707 * | −0.0568 | −0.0371 | −0.0328 | −0.0291 | −0.0235 | 0.536 *** | 0.554 *** | 0.554 *** |
| (0.04) | (0.04) | (0.04) | (0.05) | (0.05) | (0.05) | (0.05) | (0.05) | (0.05) | |
| Profitability t−1 | −3.918 *** | −3.865 *** | −3.833 *** | 3.618 *** | 3.625 *** | 3.532 *** | −2.838 * | −2.775 * | −2.932 ** |
| (1.15) | (1.07) | (0.94) | (0.79) | (0.79) | (0.76) | (1.51) | (1.41) | (1.27) | |
| Tobin’s Q t−1 | 0.260 ** | 0.257 ** | 0.224 ** | −0.193 | −0.193 | −0.198 | 0.164 | 0.16 | 0.138 |
| (0.11) | (0.10) | (0.08) | (0.13) | (0.13) | (0.13) | (0.10) | (0.10) | (0.10) | |
| Leverage t−1 | −0.0237 | −0.0422 | −0.284 | −0.2 | −0.206 | −0.287 | −1.091 *** | −1.113 *** | −1.346 *** |
| (0.18) | (0.19) | (0.22) | (0.32) | (0.33) | (0.34) | (0.22) | (0.21) | (0.25) | |
| Tangibility t−1 | −0.288 | −0.299 | −0.553 * | 0.347 | 0.344 | 0.25 | −1.221 | −1.234 * | −1.495 ** |
| (0.30) | (0.28) | (0.30) | (0.62) | (0.62) | (0.63) | (0.75) | (0.71) | (0.68) | |
| Ln Deal Amount | 0.0329 | 0.0289 | −0.00203 | −0.0139 | −0.015 | −0.0247 | |||
| (0.05) | (0.05) | (0.05) | (0.06) | (0.06) | (0.06) | ||||
| Ln Spread | 0.321 *** | 0.318 *** | 0.282 *** | −0.0229 | −0.0245 | −0.0393 | |||
| (0.09) | (0.09) | (0.08) | (0.11) | (0.11) | (0.12) | ||||
| Ln Maturity | 0.470 *** | 0.468 *** | 0.444 *** | 0.0794 | 0.0697 | −0.00508 | |||
| (0.09) | (0.09) | (0.09) | (0.12) | (0.12) | (0.12) | ||||
| Constant | 4.256 *** | 3.639 *** | 10.42 *** | 3.454 *** | 3.431 *** | 5.627 ** | −2.86 | −2.967 | 4.312 |
| (1.03) | (1.00) | (2.78) | (1.15) | (1.17) | (2.27) | (1.82) | (1.82) | (3.61) | |
| Loan Type Controls | Yes | Yes | Yes | Yes | Yes | Yes | Yes | Yes | Yes |
| Industry Controls | Yes | Yes | Yes | Yes | Yes | Yes | Yes | Yes | Yes |
| Year Controls | Yes | Yes | Yes | Yes | Yes | Yes | Yes | Yes | Yes |
| Observations | 278 | 278 | 278 | 278 | 278 | 278 | 278 | 278 | 278 |
| R-Square | 0.676 | 0.677 | 0.699 | 0.653 | 0.653 | 0.655 | 0.78 | 0.781 | 0.788 |
| Adj. R-Square | 0.622 | 0.623 | 0.646 | 0.596 | 0.595 | 0.595 | 0.744 | 0.744 | 0.751 |
Table 9.
OLS regressions of Cost of Loans on Group Affiliation Extent, Foreign Group, and Borrower and Loan Characteristics. Table 9 presents the pooled ordinary least squares (OLS) regression results of ln (Maturity), ln (Spread), and ln (DealAmount) on Group Affiliation Extent, Foreign Group, interaction terms, and Borrower and Loan Characteristics. Group Affiliation Extent is calculated based on the percentage of group ownership in borrower firms (0% indicates that there is no group association, and 100% means that the associated group owns all the firm’s shares). Control variables include firm and loan characteristics, and loan type, year, and industry dummies. Robust standard errors are reported in parentheses. Each model is clustered at group level to control for possible group fixed effects. *, **, and *** represent significance levels of 10%, 5%, and 1% respectively.
| Ln Maturity | Ln Spread | Ln Deal Amount | |||||||
|---|---|---|---|---|---|---|---|---|---|
| {1} | {2} | {3} | {4} | {5} | {6} | {7} | {8} | {9} | |
| Ln Group Aff. Extent | −0.257 *** | −0.230 *** | −0.230 ** | 0.183 * | 0.166 * | 0.159 * | 0.0785 | 0.0701 | 0.0763 |
| (0.08) | (0.08) | (0.08) | (0.09) | (0.09) | (0.08) | (0.12) | (0.13) | (0.13) | |
| Foreign Group | −0.215 *** | −0.169 | 0.143 | −3.273 | 0.0735 | 3.301 | |||
| (0.07) | (2.10) | (0.17) | (3.67) | (0.16) | (3.43) | ||||
| GrpAff * ForeignGrp. | −0.0103 | 0.779 | −0.736 | ||||||
| (0.48) | (0.85) | (0.77) | |||||||
| Ln Assets t−1 | −0.0707 * | −0.0701 * | −0.0701 * | −0.0328 | −0.0325 | −0.0346 | 0.536 *** | 0.536 *** | 0.537 *** |
| (0.04) | (0.04) | (0.04) | (0.05) | (0.05) | (0.05) | (0.05) | (0.05) | (0.05) | |
| Profitability t−1 | −3.918 *** | −3.879 *** | −3.881 *** | 3.618 *** | 3.611 *** | 3.732 *** | −2.838 * | −2.833 * | −2.954 * |
| (1.15) | (1.11) | (1.15) | (0.79) | (0.80) | (0.77) | (1.51) | (1.51) | (1.56) | |
| Tobin’s Q t−1 | 0.260 ** | 0.254 ** | 0.254 ** | −0.193 | −0.19 | −0.198 | 0.164 | 0.165 | 0.173 |
| (0.11) | (0.11) | (0.11) | (0.13) | (0.13) | (0.13) | (0.10) | (0.10) | (0.11) | |
| Leverage t−1 | −0.0237 | −0.0203 | −0.0204 | −0.2 | −0.202 | −0.19 | −1.091 *** | −1.092 *** | −1.100 *** |
| (0.18) | (0.19) | (0.18) | (0.32) | (0.32) | (0.32) | (0.22) | (0.22) | (0.23) | |
| Tangibility t−1 | −0.288 | −0.218 | −0.219 | 0.347 | 0.302 | 0.39 | −1.221 | −1.243 | −1.324 |
| (0.30) | (0.28) | (0.29) | (0.62) | (0.64) | (0.67) | (0.75) | (0.77) | (0.81) | |
| Ln Deal Amount | 0.0329 | 0.0342 | 0.0342 | −0.0139 | −0.015 | −0.0131 | |||
| (0.05) | (0.05) | (0.05) | (0.06) | (0.06) | (0.06) | ||||
| Ln Spread | 0.321 *** | 0.322 *** | 0.322 *** | −0.0229 | −0.0249 | −0.0216 | |||
| (0.09) | (0.09) | (0.09) | (0.11) | (0.12) | (0.11) | ||||
| Ln Maturity | 0.470 *** | 0.477 *** | 0.475 *** | 0.0794 | 0.0836 | 0.0834 | |||
| (0.09) | (0.10) | (0.10) | (0.12) | (0.12) | (0.11) | ||||
| Constant | 4.256 *** | 3.832 *** | 4.340 *** | 3.454 *** | 3.349 *** | 3.288 *** | −2.86 | −2.906 | −2.853 |
| (1.03) | (1.02) | (1.04) | (1.15) | (1.11) | (1.13) | (1.82) | (1.80) | (1.81) | |
| Loan Type Controls | Yes | Yes | Yes | Yes | Yes | Yes | Yes | Yes | Yes |
| Industry Controls | Yes | Yes | Yes | Yes | Yes | Yes | Yes | Yes | Yes |
| Year Controls | Yes | Yes | Yes | Yes | Yes | Yes | Yes | Yes | Yes |
| Observations | 278 | 278 | 278 | 278 | 278 | 278 | 278 | 278 | 278 |
| R-Square | 0.676 | 0.68 | 0.68 | 0.653 | 0.654 | 0.656 | 0.78 | 0.78 | 0.78 |
| Adj. R-Square | 0.622 | 0.626 | 0.624 | 0.596 | 0.596 | 0.596 | 0.744 | 0.743 | 0.742 |
Table 10.
OLS regressions of Spread, Maturity and Deal Amount on Group Affiliation Extent, Foreign Ownership, Government Ownership, Financial Firm, Cross-listed, and Borrower and Loan Characteristics. Table 10 presents the pooled ordinary least squares (OLS) regression results of ln (Spread, Maturity, Deal Amount) on Group Affiliation Extent, Foreign Ownership, Government Ownership, Financial Firm, Cross-listed, and Borrower and Loan Characteristics. Group Affiliation Extent is calculated based on the percentage of group ownership in borrower firms (0% indicates that there is no group association, and 100% means that the associated group owns all the firm’s shares). Control variables include firm and loan characteristics, and loan type, year, and industry dummies. They are excluded for brevity. Robust standard errors are reported in parentheses. Each model is clustered at the group level to control for possible group fixed effects. *, **, and *** represent significance levels of 10%, 5%, and 1% respectively.
| Ln Spread | Ln Maturity | Ln Deal Amount | ||||||||||
|---|---|---|---|---|---|---|---|---|---|---|---|---|
| {1} | {2} | {3} | {4} | {1} | {2} | {3} | {4} | {1} | {2} | {3} | {4} | |
| Ln GrpAffExt. | 0.108 | 0.175 * | 0.189 * | 0.184 * | −0.247 ** | −0.248 *** | −0.237 *** | −0.256 *** | 0.067 | 0.092 | 0.077 | 0.075 |
| −0.19 | −0.09 | −0.1 | −0.1 | −0.09 | −0.08 | −0.07 | −0.08 | −0.11 | −0.12 | −0.12 | −0.11 | |
| Foreign | −0.088 | 0.012 | −0.013 | |||||||||
| −0.13 | −0.06 | −0.09 | ||||||||||
| Gov. Own. | 0.152 | −0.176 *** | −0.316 ** | |||||||||
| −0.11 | −0.05 | −0.12 | ||||||||||
| Financial | 0.122 | 0.284 | −0.032 | |||||||||
| −0.16 | −0.23 | −0.11 | ||||||||||
| Cross-listed | −0.152 | 0.158 | 0.137 | |||||||||
| −0.14 | −0.11 | −0.11 | ||||||||||
| Constant | 4.015 ** | 3.521 *** | 3.069 ** | 2.745 ** | 3.665 *** | 4.135 *** | 3.596 *** | 4.874 *** | −2.772 | −2.998 | −3.145 * | −2.242 |
| −1.69 | −1.13 | −1.27 | −1.12 | −1.16 | −1.08 | −1.02 | −1.14 | −1.69 | −1.79 | −1.57 | −1.83 | |
| Borr. Cont. | Yes | Yes | Yes | Yes | Yes | Yes | Yes | Yes | Yes | Yes | Yes | Yes |
| Loan Cont. | Yes | Yes | Yes | Yes | Yes | Yes | Yes | Yes | Yes | Yes | Yes | Yes |
| Ind. Cont. | Yes | Yes | Yes | Yes | Yes | Yes | Yes | Yes | Yes | Yes | Yes | Yes |
| Year Cont. | Yes | Yes | Yes | Yes | Yes | Yes | Yes | Yes | Yes | Yes | Yes | Yes |
| Obs. | 278 | 278 | 278 | 278 | 278 | 278 | 278 | 278 | 278 | 278 | 278 | 278 |
| R-Sq. | 0.655 | 0.654 | 0.654 | 0.657 | 0.676 | 0.678 | 0.682 | 0.681 | 0.78 | 0.782 | 0.78 | 0.781 |
| Adj. R-Sq. | 0.597 | 0.596 | 0.595 | 0.599 | 0.621 | 0.623 | 0.628 | 0.627 | 0.743 | 0.745 | 0.743 | 0.744 |
© 2018 by the authors. Licensee MDPI, Basel, Switzerland. This article is an open access article distributed under the terms and conditions of the Creative Commons Attribution (CC BY) license (http://creativecommons.org/licenses/by/4.0/).
Share and Cite
MDPI and ACS Style
Küllü, A.M.; Raymar, S. Groups, Pricing, and Cost of Debt: Evidence from Turkey. J. Risk Financial Manag. 2018, 11, 14. https://doi.org/10.3390/jrfm11010014
AMA Style
Küllü AM, Raymar S. Groups, Pricing, and Cost of Debt: Evidence from Turkey. Journal of Risk and Financial Management. 2018; 11(1):14. https://doi.org/10.3390/jrfm11010014
Chicago/Turabian StyleKüllü, A. Melih, and Steven Raymar. 2018. "Groups, Pricing, and Cost of Debt: Evidence from Turkey" Journal of Risk and Financial Management 11, no. 1: 14. https://doi.org/10.3390/jrfm11010014