4.1. ACRs in Residences and Bedrooms
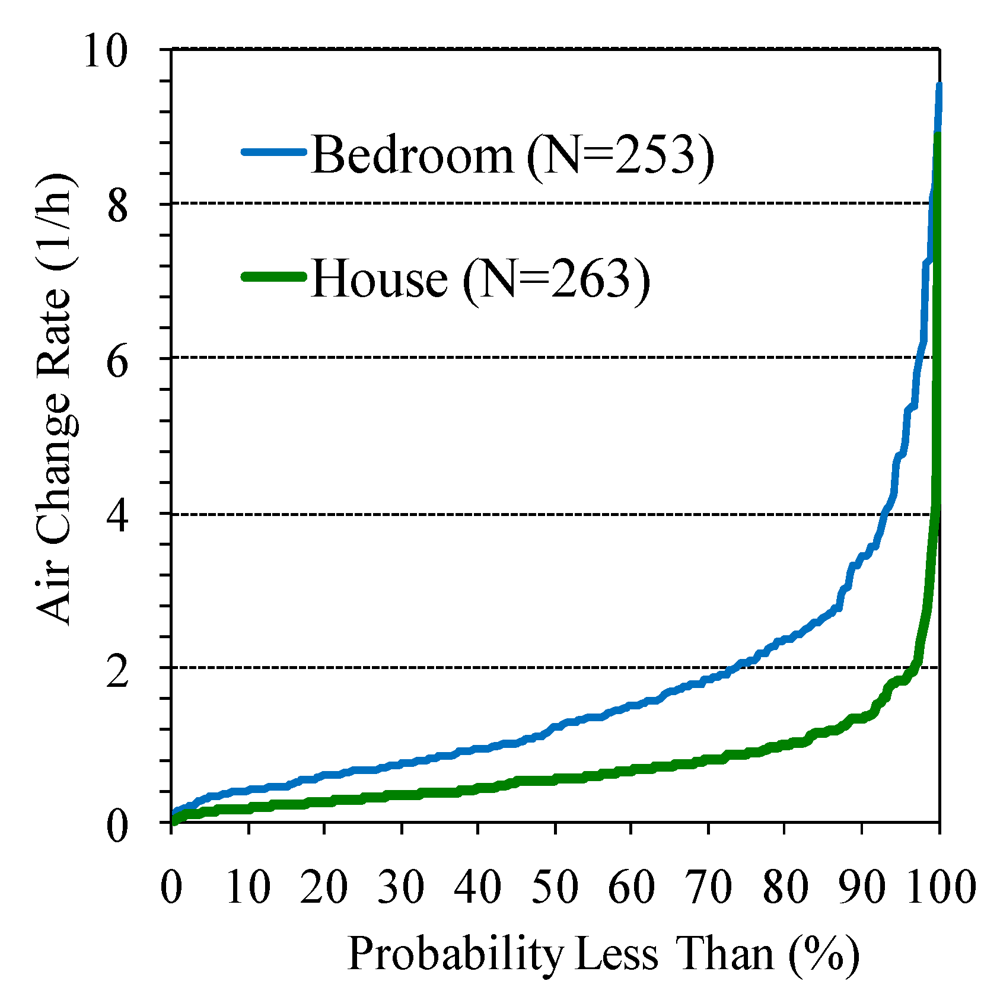
In houses, ACRs averaged 0.73 ± 0.76 h
−1 (median = 0.57 h
−1, n = 263) and the interquartile range (IQR) was 0.32 to 0.90 h
−1. The distribution of ACRs (
Figure 2) show that most values fell in a narrow range, e.g., only 10% of measurements were below 0.2 h
−1 and 1% exceeded 4 h
−1, and measurements were lognormally distributed (
p = 0.32, Anderson-Darling test). The house ACRs exclude flows between two zones,
i.e., only outside air entering the zone is considered. ACRs in the control group (median = 0.56 h
−1, n = 74), standard intervention group (0.60 h
−1, n = 101) and enhanced intervention group (median = 0.54 h
−1, n = 88) did not differ statistically (
p = 0.75, Kruskal-Wallis test).
In bedrooms, ACRs averaged 1.7 ± 1.5 h
−1 (median = 1.2 h
−1, n = 253) and the IQR was 0.68 to 2.07 h
−1. Overall, bedroom ACRs were approximately twice that seen for the house, suggesting that windows were frequently open (at least in the summer) or that the bedrooms were relatively “leaky”. Most of the sampled bedrooms were small (volume of only 28 ± 12 m
3), and all had at least one (and sometimes several) operable windows and exterior walls. The large exterior wall-to-volume ratio in these bedrooms may increase air infiltration due the driving forces of the wind and stack effects (indoor-outdoor temperature differences) compared to the house as a whole, and thus yield a higher ACR. The distribution of bedroom ACRs, also shown in
Figure 2, was neither normal nor lognormal, thus the variance proportions analysis was not conducted. These ACRs did not differ by group (
p = 0.40; median levels in control, standard, and enhanced intervention groups were 1.31 h
−1 [n = 69], 1.33 [n = 99], and 1.03 [n = 85], respectively). ACRs in bedrooms and houses were weakly, but significantly correlated (Spearman r = 0.21,
p = 0.001).
Figure 2.
Cumulative distributions of ACRs in houses and bedrooms.
Figure 2.
Cumulative distributions of ACRs in houses and bedrooms.
Because ACRs did not differ by intervention group, these data were pooled for subsequent analyses. Standard and enhanced interventions were merged and are denoted as the “with filter” group; the control group is called “without filter” group. Four observations were excluded as outliers (3 bedroom ACRs ≥ 10 h−1 and 1 bedroom ACR ≤ 0.1 h−1), representing only 1.6% of the collected data.
Table 1.
Air change rates in the house and child’s bedrooms by season.
Table 1.
Air change rates in the house and child’s bedrooms by season.
| Outcome | Season | Without filter | With filter | All groups |
|---|
| N | Average | SD | Median | N | Average | SD | Median | N | Average | SD | Median |
|---|
| ACRH (h−1) | Spring | 21 | 0.46 | 0.24 | 0.37 | 58 | 0.61 | 0.62 | 0.41 | 79 | 0.57 | 0.55 | 0.40 |
| Summer | 33 | 0.91 | 1.53 | 0.46 | 49 | 0.69 | 0.45 | 0.60 | 82 | 0.78 | 1.03 | 0.58 |
| Fall | 8 | 0.78 | 0.50 | 0.60 | 44 | 0.78 | 0.65 | 0.60 | 52 | 0.78 | 0.63 | 0.60 |
| Winter | 12 | 0.97 | 0.61 | 0.79 | 38 | 0.84 | 0.64 | 0.72 | 50 | 0.88 | 0.63 | 0.74 |
| All | 74 | 0.78 | 1.08 | 0.55 | 189 | 0.72 | 0.60 | 0.57 | 263 | 0.73 | 0.76 | 0.57 |
| p-value * | 0.060 | 0.037 | 0.002 |
| ACRB (h−1) | Spring | 20 | 1.41 | 1.05 | 0.96 | 56 | 1.19 | 0.81 | 1.05 | 76 | 1.25 | 0.87 | 1.00 |
| Summer | 29 | 1.88 | 1.84 | 1.34 | 46 | 2.27 | 2.16 | 1.74 | 75 | 2.12 | 2.03 | 1.50 |
| Fall | 8 | 2.18 | 1.92 | 1.30 | 45 | 1.50 | 1.27 | 1.14 | 53 | 1.60 | 1.39 | 1.23 |
| Winter | 12 | 1.67 | 1.02 | 1.43 | 37 | 1.65 | 1.29 | 1.30 | 49 | 1.65 | 1.22 | 1.30 |
| All | 69 | 1.74 | 1.52 | 1.31 | 184 | 1.63 | 1.49 | 1.18 | 253 | 1.66 | 1.50 | 1.23 |
| p-value * | 0.822 | 0.048 | 0.049 |
ACRs differed by season (
Table 1). House ACRs were lowest in spring and highest in winter, with an overall variation of about 53% based on median seasonal values. Based on the variance proportions analysis, temporal variation (year and season) explained 74% of the total variation, and house-to-house variation explained the remainder, 26%, showing a strong need for seasonal measurements. Homes with filters showed smaller and marginally significant seasonal changes. The reason for differences between the groups with and without filters is not clear. While not statistically significant, homes with filters were slightly smaller (volume = 362 ± 146 m
3 versus 371 ± 124 m
3) and younger (average age was 54
versus 61 years, though definitive ages were known for only 39 of the homes) than homes without filters. Occupants in homes receiving filters were instructed to try to keep bedroom doors closed or partially closed (to maximize the filter’s effect), but compliance with this instruction was likely low.
In bedrooms, ACRs also varied by season, and again the lowest values occurred in spring. However, the highest ACRs in bedrooms occurred in summer (excluding the small number of homes tested without filters), probably reflecting the use of air conditioners, opened windows, or fans to cool the bedrooms. Thus, compared to ACRs in houses, ACRs in the bedrooms were higher and showed different seasonal trends. As discussed below, these are important and striking results that are not well recognized in the literature.
Comparison to the literature. The house ACRs measured in the present study are generally comparable to those reported in several recent studies, all of which used the constant injection tracer gas method. In the Detroit Exposure and Aerosol Research Study (DEARS), median ACRs in 120 households in Detroit ranged from 0.7 to 1.4 h
−1, depending on season [
32]. In another southeast Michigan study, but in the more suburban and affluent communities of Ann Arbor and Ypsilanti, ACRs were lower, averaging 0.43 ± 0.37 h
−1 (n = 15) [
33]. Homes in nearby Windsor, Ontario, Canada were also “tighter” than the Detroit homes, with a geometric mean ACR in winter of 0.32 h
−1 (95th percentile confidence interval [CI]: 0.26 to 0.40 h
−1; n = 32), and only 0.19 h
−1 (CI: 0.15 to 0.24 h
−1; n = 42) in summer [
34]. In the Relationship among Indoor Outdoor and Personal Air (RIOPA) study, which measured approximately 100 residences each in Elizabeth, NJ, Houston, TX and Los Angeles, CA, the median ACR was 0.71 h
−1 (n = 506), and ACRs differed by city (0.87, 0.88 and 0.47 h
−1, respectively), as well as by season [
35]. An analysis of the 1997 U.S. Department of Energy Residential Energy Consumption Survey, which included 140 single-family houses in 19 cities, showed a median ACR of 0.44 h
−1 (range from 0.26 to 0.58 h
−1) [
36]. Overall, the ACRs in the present study are somewhat higher than those found in similar (northern) climates, reflecting the age, lack of weatherization, and often poor condition of the Detroit housing stock, factors associated with increased building leakage area. However, ACRs in the study homes are lower than for residences located in more moderate climates, which can use natural ventilation more extensively.
ACRs in bedrooms. There are few reports of ACRs measured in bedrooms. In Europe, low ACRs have been found in bedrooms, for example, the geometric mean ACR in children’s bedrooms in Odense, Denmark was 0.46 ± 2.09 h
−1 (n = 500) [
37,
38]. The mean ACR in children’s bedrooms of single family homes in Sweden ranged from 0.31 to 0.47 h
−1 (n = 390), and depended on the ventilation system, construction period, foundation type and number of floors [
39]. Notably, northern European residences typically have very low ACRs, e.g., ACRs in the single-family houses in the Swedish study just noted averaged 0.36 h
−1 (n = 333) [
39]. Due to the substantial differences in building air tightness, ventilation, climate and other factors, ACRs in the US and Europe were not expected to be similar. Nonetheless, it is interesting to note that bedrooms in the Detroit homes have much higher ACRs than the remainder of the house and thus likely to be rather drafty in winter. In contrast, the two European studies show similar ACRs in houses and bedrooms.
A number of studies reporting ACRs, especially those reporting results for bedrooms, have used a single PFT or SF
6 tracer in all zones or rooms [
9], or have used occupant-generated CO
2 as a tracer [
40]. These studies can have significant limitations and potential biases that are eliminated in the present study by the use of multiple PFT tracers.
Temporal variability. Seasonal differences in ACRs have been shown in many studies. As noted earlier, ACRs in homes in Windsor, Canada increased significantly in winter. In a nonsmoking household in Boston, MA, ACRs measured for one or two 6-day periods in two seasons using SF
6 increased greatly in summer (mean = 3.80 h
−1) when windows and doors were opened compared to winter (0.15 h
−1); two other houses monitored in this study did not show seasonal differences [
41]. In the RIOPA study, ACRs in Houston homes decreased in the summer cooling season (median = 0.37 h
−1) compared to winter (0.63 h
−1); Los Angeles showed the opposite trend where ACRs increased in summer (1.13 h
−1) compared to winter (0.61 h
−1); and homes in Elizabeth showed similar ACRs in heating (median = 0.88 h
−1) and cooling (0.63 h
−1) seasons [
35]. An older (1982–1987) study of 2,844 homes across the USA showed significant differences in ACRs by region, but considering all homes, ACRs were lowest in fall (average = 0.41 ± 0.58 h
−1), highest in summer (1.50 ± 1.53 h
−1), and comparable in spring (0.65 ± 0.57 h
−1) and winter (0.55 ± 0.46 h
−1) [
42].
Seasonal variation in ACRs is driven by indoor-outdoor temperature gradients, wind speeds, occupant behavior, and building characteristics including the presence of air conditioners. ACRs typically increase in winter in regions with heating needs (like Michigan and Canada) due to greater indoor/outdoor temperature differences and higher wind speeds, and the stack effect (due to temperature differences) is enhanced in multistory buildings [
1,
11,
34]. In summer and in warm climates, air conditioner use can lower ACRs, as seen in Houston, while in moderate climates or when temperatures are mild, natural (and sometimes mechanical) ventilation promoted by opened windows and doors increases ACRs [
9,
35,
41]. In the present study, winters are typically cold and moderately windy, which increases ACRs; summers can be hot and humid, and air conditioner use is common. However, summers in the study period were cooler than normal and only 30% of the Detroit homes had central air conditioning, thus air conditioner use was less frequent and probably not representative of the broader region. For the house, ACRs were highest in winter and lowest in the spring when indoor-outdoor temperature rates were small. As noted earlier, bedrooms showed a different trend: again ACRs were lowest in spring, but ACRs were highest in summer, likely reflecting natural or enhanced (fans and air conditioners) ventilation.
Factors associated with ACRs. The house and occupant characteristics associated with ACRs are shown in
Table 2. House ACRs were negatively and significantly associated with house size (area and number of bedrooms), the presence of a central air conditioner, indoor CO
2 and VOC concentrations, and the presence of cigarette smokers. ACRs were positively associated with recent sweeping and dusting, and indoor PM concentrations. Similar results were found for bedroom ACRs with the addition of negative correlations with outdoor wind speed. Daily average wind speeds during the sampling period ranged from 1.8 to 5.1 m/s, and wind speed was negatively but not statistically significantly correlated to the house ACRs. The lack of significant associations with the meteorological variables is likely a result of the weeklong ACR measurements, which average over shorter-term fluctuations in these variables, as well as wind and sun sheltering, which diminishes the agreement with airport meteorological data.
Table 2.
Association between ACRs and house and building/occupant characteristics. Spearman correlation coefficients used for continuous variables, and Kruskal-Wallis tests for categorical variables. Statistically significant associations (p < 0.05) in bold. PNC = particle number count; CSA = child’s sleep area (e.g., bedroom); * C = continuous variable; I = indicator variable; M = multilevel categorical variable.
| Variable | Type * | ACRH | ACRB |
|---|
| N | Correlation Coefficient | p-value | N | Correlation Coefficient | p-value |
|---|
| House | Floor area | C | 256 | −0.363 | <0.001 | 247 | −0.073 | 0.255 |
| Forced air heating system/others | I | 225/29 | - | 0.943 | 217/29 | - | 0.522 |
| No. of bedrooms | C | 254 | −0.135 | 0.031 | 246 | −0.040 | 0.533 |
| Present/not present central AC | I | 86/168 | - | 0.012 | 83/163 | - | 0.620 |
| Present/not present ventilation fan | I | 75/188 | - | 0.374 | 73/180 | - | 0.789 |
| Furnace filter change frequency | C | 117 | 0.046 | 0.620 | 114 | 0.111 | 0.238 |
| Child’s sleeping area | Floor area | C | 257 | −0.097 | 0.119 | 248 | −0.083 | 0.192 |
| Room volume | C | 257 | −0.069 | 0.273 | 248 | −0.088 | 0.167 |
| Number of windows | C | 248 | −0.016 | 0.805 | 241 | 0.015 | 0.815 |
| Occupancy | No. of adults | C | 263 | −0.076 | 0.222 | 253 | −0.070 | 0.268 |
| No. of children | C | 263 | 0.079 | 0.202 | 253 | −0.021 | 0.741 |
| Dogs present | C | 83 | 0.199 | 0.072 | 81 | −0.005 | 0.961 |
| Cats present | C | 29 | −0.020 | 0.917 | 26 | −0.158 | 0.440 |
| Present/not present either dogs or cats | I | 102/161 | - | 0.651 | 99/154 | - | 0.638 |
| Smoking | Never any smokers indoors/smokers indoor | I | 148/115 | - | 0.029 | 142/111 | - | 0.842 |
| Any smokers in household/no smokers | I | 153/110 | - | 0.023 | 148/105 | - | 0.174 |
| Number of smokers | C | 263 | 0.162 | 0.008 | 253 | 0.079 | 0.212 |
| Cleaning | Use/not use a vacuum cleaner | I | 117/22 | - | 0.416 | 115/21 | - | 0.246 |
| Vacuumed CSA in the last 2 weeks | C | 117 | −0.004 | 0.967 | 115 | 0.014 | 0.879 |
| Swept/dusted CSA in the last 2 weeks | C | 263 | 0.212 | 0.001 | 253 | 0.164 | 0.009 |
| Air pollutants | Outdoor | PM2.5 (µg/m3) | C | 210 | 0.092 | 0.184 | 201 | 0.132 | 0.061 |
| Indoor | PM (µg/m3) | C | 225 | 0.152 | 0.023 | 216 | 0.146 | 0.032 |
| 0.3−1.0 µm PNC (#/liter) | C | 224 | 0.077 | 0.248 | 214 | 0.216 | 0.001 |
| 1-5 µm PNC (#/liter) | C | 224 | 0.055 | 0.415 | 214 | 0.064 | 0.352 |
| CO2 (ppm) | C | 241 | −0.246 | <0.001 | 233 | −0.334 | <0.001 |
| Naphthalene (µg/m3) | C | 252 | −0.188 | 0.003 | 242 | −0.095 | 0.142 |
| BTEX (µg/m3) | C | 252 | −0.345 | <0.001 | 242 | −0.199 | 0.002 |
| TVOC (µg/m3) | C | 252 | −0.311 | <0.001 | 242 | −0.184 | 0.004 |
| Meteorology | Average temperature | C | 263 | −0.062 | 0.318 | 253 | 0.029 | 0.647 |
| Minimum relative humidity | C | 263 | 0.201 | 0.001 | 253 | 0.069 | 0.274 |
| Average daily station pressure | C | 263 | 0.079 | 0.199 | 253 | 0.188 | 0.003 |
| Resultant wind direction | C | 263 | 0.017 | 0.786 | 253 | −0.024 | 0.701 |
| Average wind speed | C | 263 | −0.090 | 0.147 | 253 | −0.132 | 0.035 |
| Season (Spring, Summer, Fall, Winter) | M | - | - | 0.002 | - | - | 0.049 |
The associations between ACRs and the various factors are generally consistent with expectations. For example, CO
2 can be an indicator of occupancy and ventilation, and CO
2 levels generally increase with low ACRs. Similarly, concentrations of VOCs and other pollutants with indoor sources will increase with low ACRs. Individuals may open windows and doors when sweeping and dusting, which will increase ACRs; these activities are also likely to entrain dust and thus increase PM concentrations. The Detroit data does not include variables reflecting opened windows and doors, a strong determinant of ACRs as shown in studies in Ohio [
11], California and Virginia [
8], Redwood City and Watsonville, CA [
43], Columbus, OH [
11], Odense, Denmark [
37], and Boston, MA [
41]. As noted earlier, wind speed and indoor-outdoor temperature differentials are important determinants of ACRs [
1,
8,
9,
11]. ACRs decrease in homes with central air conditioning, especially in summer, reflecting closed windows [
22]. Other factors affecting ACRs, which have been incorporated in several predictive models, include the presence of an attached garage [
34], floor area, envelope airtightness (often related to the house age), number of floors, foundation type, presence of a forced air distribution system, the number of units in apartment buildings, climate and city/region [
36].
4.2. Interzonal Flows
A seasonal analysis of interzonal flows between the house and bedroom, including proportions 𝛼
HB and 𝛼
BH, is shown in
Table 3. Overall, 55 ± 18% of the air entering the bedroom came from the house; the balance directly entered the bedroom from outdoors. For the house’s main living area, an average of 26 ± 20% of air entered from the child’s bedroom; most air entered directly from outdoors. While some change in these proportions was seen by season, intervention group and the presence of central air conditioning and smokers, these differences were not statistically significant.
Table 3.
Proportion of interzonal flows in the house and bedroom by season and intervention group.
Table 3.
Proportion of interzonal flows in the house and bedroom by season and intervention group.
| Outcome | Season | Without filter | With filter | All groups |
|---|
| N | Average | SD | Median | N | Average | SD | Median | N | Average | SD | Median |
|---|
| 𝛼HB | Spring | 20 | 0.55 | 0.18 | 0.60 | 55 | 0.53 | 0.16 | 0.53 | 75 | 0.54 | 0.17 | 0.54 |
| Summer | 23 | 0.57 | 0.21 | 0.58 | 38 | 0.51 | 0.19 | 0.53 | 61 | 0.53 | 0.20 | 0.53 |
| Fall | 7 | 0.46 | 0.25 | 0.52 | 42 | 0.60 | 0.18 | 0.62 | 49 | 0.58 | 0.20 | 0.61 |
| Winter | 11 | 0.55 | 0.21 | 0.58 | 38 | 0.54 | 0.18 | 0.53 | 49 | 0.54 | 0.18 | 0.55 |
| All | 61 | 0.55 | 0.20 | 0.58 | 173 | 0.55 | 0.18 | 0.54 | 234 | 0.55 | 0.18 | 0.55 |
| p-value * | 0.804 | 0.189 | 0.525 |
| 𝛼BH | Spring | 20 | 0.30 | 0.19 | 0.30 | 55 | 0.23 | 0.17 | 0.20 | 75 | 0.25 | 0.17 | 0.22 |
| Summer | 23 | 0.38 | 0.28 | 0.31 | 38 | 0.27 | 0.24 | 0.21 | 61 | 0.31 | 0.26 | 0.26 |
| Fall | 7 | 0.24 | 0.26 | 0.24 | 42 | 0.24 | 0.17 | 0.20 | 49 | 0.24 | 0.18 | 0.20 |
| Winter | 11 | 0.21 | 0.17 | 0.16 | 38 | 0.25 | 0.15 | 0.24 | 49 | 0.24 | 0.15 | 0.22 |
| All | 61 | 0.31 | 0.23 | 0.27 | 173 | 0.25 | 0.18 | 0.20 | 234 | 0.26 | 0.20 | 0.22 |
| p-value * | 0.249 | 0.942 | 0.753 |
Bedroom ACRs were negatively correlated with 𝛼HB (r = −0.36, p < 0.001) and 𝛼BH (r = −0.30, p < 0.001), indicating that tighter homes (low house and bedroom ACRs) had relatively higher flows between zones. In homes with forced air central air conditioning and heating systems, for example, windows are normally closed and air circulates rapidly throughout the house. Conversely, homes with higher ACRs tend to have flows that are decoupled between zones. While our study does not indicate the causes, this pattern could be explained by local exchange that occurs, for example, as windows are opened in several rooms and on several floors, causing separate (decoupled) air flow patterns in different portions of the building.
As noted, few measurements of airflows within residences or other buildings are available [
4,
5,
13,
44]. Short-term tests conducted in three homes with the ventilation system off showed that interzonal air flows (measured using a tracer gas) varied strongly as a function of door position or opening width [
4,
44]. Several modeling exercises have been completed. A two zone model for a single-story house in California, which gave reasonable fit between predicted and observed CO concentrations, showed interzonal air flow ratios of 0.976 (𝛼
BA, proportion of room A’s intake air coming from room B) and 0.614 (𝛼
AB, proportion of room B’s intake air from room A) after smoking a cigar for 15 min in the kitchen (emission rate of 60 mg/min) [
13]. This house is not representative of Detroit homes, e.g., ACRs were very high (4.0 and 4.6 h
−1 for the kitchen and living room, respectively), and the two zones had similar volumes (34 and 36 m
3). An aerosol dynamics model using experimental data in a two zone test facility showed interzonal flows from 0.6 to 154 m
3·h
−1 from a non-smoking room (31 m
3) to a smoking room (36 m
3), and reverse flows from 1.1 to 163 m
3·h
−1, depending on the sealing between rooms, ventilation and filtration system [
4]. Again, room volumes and configurations are not comparable to our study. Thus, the present study is believed to be one of the first reports of interzonal airflows within North American residences. (We previously reported on flows between attached garages and residences, along with several others) [
33].
4.3. Scenario Analyses
Model parameters.
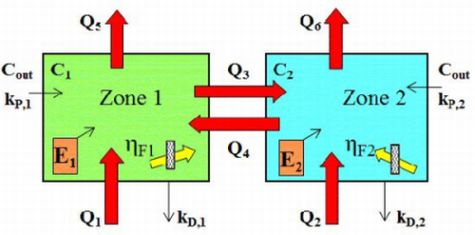
Table 4 shows statistics of the measured parameters used by the two-zone model. As noted, interzonal flows Q
3 and Q
4 were positively correlated with outdoor airflows (Q
1, Q
2) and house volume, and interzonal flow Q
4 was negatively correlated with bedroom volume and positively correlated with outdoor pollutant concentrations (data not shown).
Table 4.
Statistics of airflows for house (Q1–Q4) and filter (QF2), house and bedroom volumes (V1, V2), and outdoor PM concentrations (Cout), including number of observations (N), average, standard deviation (SD), median, 25th, 75th and 90th percentile values.
Table 4.
Statistics of airflows for house (Q1–Q4) and filter (QF2), house and bedroom volumes (V1, V2), and outdoor PM concentrations (Cout), including number of observations (N), average, standard deviation (SD), median, 25th, 75th and 90th percentile values.
| Parameter | Unit | N | Average | SD | 25th | Median | 75th | 90th |
|---|
| Q1 | m3·h−1 | 234 | 242 | 272 | 109 | 179 | 287 | 446 |
| Q2 | m3·h−1 | 234 | 43 | 39 | 17 | 31 | 52 | 87 |
| Q3 | m3·h−1 | 234 | 57 | 76 | 23 | 41 | 71 | 102 |
| Q4 | m3·h−1 | 234 | 84 | 138 | 27 | 54 | 96 | 166 |
| QF2 | m3·h−1 | 156 | 456 | 223 | 282 | 499 | 661 | 722 |
| V1 | m3 | 234 | 360 | 137 | 261 | 359 | 434 | 495 |
| V2 | m3 | 234 | 28 | 11 | 22 | 25 | 29 | 36 |
| Cout | μg·m−3 | 179 | 11 | 4 | 8 | 10 | 14 | 17 |
The nominal parameters derived for modeling purposes, intended to be representative of the field data, were as follows. House and bedroom volumes V1 and V2 were set to study averages, 360 and 28 m3, respectively. Airflows Q1, Q2, Q3 and Q4, scaled to the mean house volume, were 263, 50, 60 and 94 m3·h−1, respectively. As described earlier, QF2 was set to 280 m3·h−1, and Cout to 11 μg·m−3, kD,1 and k D,2 to 0.2 h−1, and kP,1 and kP,2 to 0.5.
Scenario results.
Table 5 shows PM concentrations predicted for all scenarios, along with average concentrations measured in bedrooms, both with and without filters, and with and without the detection of ETS. (As mentioned, PM measurements in the living area were unavailable.) Observed concentrations were considerably elevated if smokers were present, and greatly lowered with the filter [
15,
22].
In scenario 1 (emission sources in the living area), the nominal emission rate (10 cigarettes day
−1) yielded PM concentrations of 24 and 15 µg·m
−3 in the living area and bedroom, respectively; concentrations in the bedroom dropped greatly, to only 4 µg·m
−3, when the HEPA filter was used (scenario 1F). This nominal case closely matched the field study results in predicting a 73% reduction of PM levels in the bedroom due to the filter, as compared to the 69 to 80% measured [
15]. However, predicted PM concentrations were low compared to measurements. Matching observed concentrations (39 µg·m
−3) when ETS was present (by adjusting the number of cigarettes) required 33.5 cigarettes day
−1 if the filter was not present (scenario 1MT), and 85 cigarettes day
−1 if the filter was present (25 µg·m
−3, scenario 1FMT). Especially the latter cigarette consumption rate seems unreasonably high, and these two scenarios produced correspondingly high PM predictions in the living area (71 and 172 µg·m
−3). Most likely, some smoking, cooking and other PM emissions occur in or near the bedroom (e.g., dust from bedding, resuspension and exfoliated skin) [
45], which were not modeled in this scenario (emissions were assumed to occur in only the living area). When ETS was not present, PM emission rates equivalent to 21.5 and 37.5 cigarette day
−1 matched concentrations measured in the bedroom without and with the filter, respectively (27 and 12 µg·m
−3, scenarios 1M and 1FM). Like the results just discussed, these scenarios do not consider other emission sources of PM, which are certainly present in residences. Again, we note that the number of cigarettes smoked daily is used as an indicator of PM emissions. The actual PM emissions may be more benign than ETS, which has a unique nature and the potential for serious health impacts.
Table 5.
Average concentrations observed in homes and results of scenario analyses, including adjustment of emission rates to match observed concentrations. C1 and C2 are concentrations in living room (LA) and bedrooms (BR), respectively.
Table 5.
Average concentrations observed in homes and results of scenario analyses, including adjustment of emission rates to match observed concentrations. C1 and C2 are concentrations in living room (LA) and bedrooms (BR), respectively.
| Case or Scenario | Condition | Emission Rate | No Filter | With Filter (F) |
|---|
| Type | No. | (cig/day) | (mg·h−1) | C1 (LA) (µg·m−3) | C2 (BR) (µg·m−3) | C1 (LA) (µg·m−3) | C2 (BR) (µg·m−3) |
|---|
| Observed in Field Study | - | Houses with ETS | - | - | - | 39 | - | 25 |
| - | Houses without ETS | - | - | - | 27 | - | 12 |
| Source in Living Area | 1, 1F | Nominal rate | 10.0 | 7.5 | 24 | 15 | 22 | 4 |
| 1MT | Match to ETS without filter | 33.5 | 25.1 | 71 | 39 | 64 | 10 |
| 1FMT | Match to ETS with filter | 85.0 | 63.8 | 172 | 92 | 157 | 25 |
| 1M | Match to non-ETS without filter | 21.5 | 16.1 | 47 | 27 | 43 | 7 |
| 1FM | Match to non-ETS with filter | 37.5 | 28.1 | 78 | 43 | 72 | 12 |
| Source in Bedroom | 2, 2F | Nominal rate | 10.0 | 7.5 | 20 | 78 | 8 | 21 |
| 2MT | Match to ETS without filter | 4.7 | 3.5 | 12 | 39 | 6 | 10 |
| 2FMT | Match to ETS with filter | 12.0 | 9.0 | 24 | 93 | 9 | 25 |
| 2M | Match to non-ETS without filter | 3.0 | 2.3 | 9 | 27 | 5 | 7 |
| 2FM | Match to non-ETS with filter | 5.5 | - | 13 | 45 | 6 | 12 |
| No Indoor Sources | 3, 3F | Without filter | - | - | 4 | 5 | 4 | 1 |
Scenario 2, where indoor emissions occur in only the bedroom, yielded considerably different results. In this case, the nominal emission rate (10 cigarettes day−1) without a filter produced 78 and 20 µg·m−3 in the bedroom and living area, respectively, and 21 and 8 µg·m−3 with the filter (scenarios 2, 2F). The bedroom concentration become quite elevated due to this room’s small volume (despite its relatively rapid ACR), and the relatively small fraction of air from the bedroom to the rest of the house limited concentrations in other living areas. Again, the HEPA filter provides good control of PM in the bedroom, reducing concentrations by 74%, and also in the rest of the house (which was not seen in scenario 1). Matching observed concentrations with ETS detection required the equivalent of 4.7 cigarettes day−1 without the filter, and 12 cigarettes day−1 with the filter (scenarios 2MT and 2FMT, respectively). When ETS was not detected, emission rates equivalent to 3 and 5.5 cigarette day−1 matched concentrations observed without and with the filter (scenarios 2M and 2FM, respectively). Compared to smoking in the living area (scenario 1), much lower emission rates in the bedroom are needed to match observed concentrations.
Without indoor emission sources, scenario 3 shows that infiltration of outdoor PM gives living area and bedroom concentrations that are similar and low, 4 and 5 µg·m
−3, respectively, without the filter. The bedroom concentration is minimal (1 µg·m
−3) with the filter (scenario 3F). The PM
2.5 infiltration factors (calculated as the ratio of the indoor to outdoor concentrations) were 0.36 and 0.45 in the living area and bedroom, respectively. The PM
2.5 infiltration factor measured in other Detroit homes in DEARS was 0.70 ± 0.33, which included homes with and without indoor sources [
32]. Since indoor sources can increase measured infiltration factors, and given the limitations of the two zone IAQ model and the use of several literature values in this study (
i.e., models were not fitted), the modeled infiltration factors are reasonable.
The actual emission rates, air flows and other factors affecting PM levels in the study homes almost certainly differed from the modeled scenarios, thus explaining some of the results and the apparent discrepancies in
Table 5. In particular, specific emission rates and source locations are unknown, emissions likely occur in both zones simultaneously, most model parameters will vary in time, literature values of some parameters may not apply, and the considerable variation in house configurations is simulated only approximately using point estimates such as the mean. Further, several differences in house parameters were noted where ETS was detected, e.g., volumes of these houses and bedrooms (V
1 = 329 ± 132 m
3; V
2 = 24 ± 5 m
3; n = 49) were significantly smaller than those without ETS detection (V
1 = 368 ± 138 m
3, V
2 = 29 ± 12 m
3; n = 185,
p = 0.026;
p = 0.014, Mann-Whitney test). (No other differences were noted.) Additionally, occupants may have changed their behavior when monitored or if the HEPA filter was present.
Notably, most of the modeled scenarios show strong differences of PM concentrations in the two zones in the house. For strong emission sources in (only) the living area, concentrations in the bedroom are 43 to 47% lower than those in the living area without a filter, and 83 to 84% lower with a filter (scenarios 1 and 1F, respectively). For strong emission sources in (only) the bedroom, concentrations in the bedroom are 65 to 74% higher without the filter, and 31 to 65% higher with the filter (scenarios 2 and 2F). These differences are due to the limited interzonal flow rates and the strong emission source that boosts concentrations well above that due to the penetration of (contaminated) outdoor air. In all scenarios, the HEPA filter substantially lowers concentrations in the bedroom. Moreover, the filter substantially lowers living area concentrations if emissions occur primarily in the bedroom (scenario 2F). Without indoor sources, levels in the bedroom slightly exceed those in the living area, a result of relatively greater penetration and exchange rates in the bedroom. Thus, the high ACRs in bedrooms can be important for exposure estimation purposes, especially given the substantial fraction of time people spend in bedrooms. Of course, results depend on the choice of model parameters, which is analyzed next.
4.4. Sensitivity Analyses
The relative sensitivity (RS) of each model parameter for six scenarios is shown in
Table 6. As expected, high sensitivity (RS = 0.54 to 0.94) is shown for indoor emission rates E
1 and E
2. This means that increasing E
1 by 10%, for example, will increase concentrations in the living area and bedroom by 8.2 and 6.9%, respectively. In this case, results do not depend whether or not a filter is present. PM levels in the bedroom (C
2) were also sensitive to air filter use (RS = −0.68), as noted earlier.
Table 6.
Relative sensitivity of model parameters on predicted concentrations in living area (LR) and bedroom (BR) for six scenarios (scenario number in parentheses). Absolute values greater than 0.40 are shown in bold.
Table 6.
Relative sensitivity of model parameters on predicted concentrations in living area (LR) and bedroom (BR) for six scenarios (scenario number in parentheses). Absolute values greater than 0.40 are shown in bold.
| Para-meter | Units | Emissions in Living Area | Emissions in Bedroom | No Indoor Emissions |
|---|
| No Filter (1) | W/Filter (1F) | No Filter (2) | W/Filter (2F) | No Filter (3) | W/Filter (3F) |
|---|
| LR | BR | LR | BR | LR | BR | | BR | LR | BR | LR | BR |
|---|
| Predicted concentrations |
| C1 | µg·m−3 | 24 | - | 22 | - | 20 | - | 8 | - | 4 | - | 4 | - |
| C2 | µg·m−3 | - | 15 | - | 4 | - | 78 | - | 21 | - | 5 | - | 1 |
| Relative sensitivity |
| E1 | µg·h−1 | 0.82 | 0.69 | 0.83 | 0.69 | - | - | - | - | - | - | - | - |
| E2 | µg·h−1 | - | - | - | - | 0.78 | 0.94 | 0.54 | 0.94 | - | - | - | - |
| Q1 | m3·h−1 | −0.50 | −0.42 | −0.45 | −0.37 | −0.47 | −0.06 | −0.18 | −0.01 | 0.16 | 0.08 | 0.30 | 0.13 |
| Q2 | m3·h−1 | −0.04 | −0.29 | 0.00 | 0.05 | −0.36 | −0.43 | −0.05 | −0.09 | 0.02 | 0.08 | 0.03 | 0.44 |
| Q3 | m3·h−1 | 0.05 | 0.35 | 0.03 | 0.69 | −0.35 | −0.41 | −0.06 | −0.10 | −0.01 | −0.03 | 0.02 | 0.30 |
| Q4 | m3·h−1 | −0.09 | −0.08 | −0.18 | −0.15 | 0.69 | 0.09 | 0.36 | 0.02 | 0.01 | 0.01 | −0.15 | −0.06 |
| CoutkP,1 | µg·m−3 | 0.16 | 0.13 | 0.16 | 0.13 | 0.19 | 0.03 | 0.44 | 0.03 | 0.87 | 0.42 | 0.96 | 0.42 |
| CoutkP,2 | µg·m−3 | 0.02 | 0.18 | 0.01 | 0.18 | 0.03 | 0.03 | 0.02 | 0.03 | 0.13 | 0.58 | 0.04 | 0.58 |
| kD,1 | h−1 | −0.19 | −0.16 | −0.17 | −0.14 | −0.19 | −0.03 | −0.17 | −0.01 | −0.19 | −0.09 | −0.17 | −0.08 |
| kD,2 | h−1 | −0.01 | −0.05 | 0.00 | −0.01 | −0.05 | −0.05 | −0.01 | −0.01 | −0.01 | −0.05 | 0.00 | −0.01 |
| V1 | m3 | −0.19 | −0.16 | −0.17 | −0.14 | −0.19 | −0.03 | −0.17 | −0.01 | −0.19 | −0.09 | −0.17 | −0.08 |
| V2 | m3 | −0.01 | −0.05 | 0.00 | −0.01 | −0.05 | −0.05 | −0.01 | −0.01 | −0.01 | −0.06 | 0.00 | −0.02 |
| ηF2QF2 | m3·h−1 | - | - | −0.03 | −0.68 | - | - | −0.39 | −0.68 | - | - | −0.05 | −0.68 |
In Scenario 1, PM concentrations in the bedroom were sensitive to interzonal flow Q3 (living area to bedroom), especially if a filter was present (RS = 0.69 and 0.35, with and without filter, respectively). PM concentrations were relatively unaffected by deposition rate (kD,2) and bedroom volume (V2). In Scenario 3 where outdoor pollutants were the only PM source, outdoor airflows Q1 and Q2 were key variables, especially in the bedroom when filters were used, and particle penetration factor kP,1 and outdoor PM concentration Cout became among the most sensitive parameters (especially in the living area). The influence of kP,2 and Cout was considerably lower, a result of the much larger volume of the living area compared to the bedroom.
As noted, the importance of interzonal flows Q
3 and Q
4 depended on the scenario. Low interzonal flows will impede transfers between zones, however, exposure to ETS will likely occur throughout a house even if smoking is restricted to one room [
46]. While some degree of isolation and lower ETS exposure can be attained by closing doors and opening windows in the room containing smokers [
13], the typical house design and HVAC configuration in the USA can quickly deliver pollutants throughout a house [
2]. Thus, isolation is incomplete and this strategy has limited effectiveness. The two zone models allow easy evaluation of such strategies.
The key outcome of the sensitivity analysis is the identification of those model parameters that most strongly affect results. Results of the two zone model show that among the many parameters, emission rates, air flows and air filter use significantly affect pollutant levels, and thus it is important to obtain the most accurate data for these parameters to accurately model concentrations and exposures in homes. The results also demonstrate that with strong and localized sources like cigarettes, or with the use of a free-standing air filter, the assumption that the house is a single zone with uniform concentrations will not yield accurate results for either the smoker in the main living area or an individual in a bedroom.


