Uneven Magnitude of Disparities in Cancer Risks from Air Toxics


Abstract
:
1. Introduction
2. Data and Methods
2.1. Air Toxics and Socioeconomic Data
2.2. Data Analysis
3. Results
3.1. Estimates and Contributors of Cancer Risks


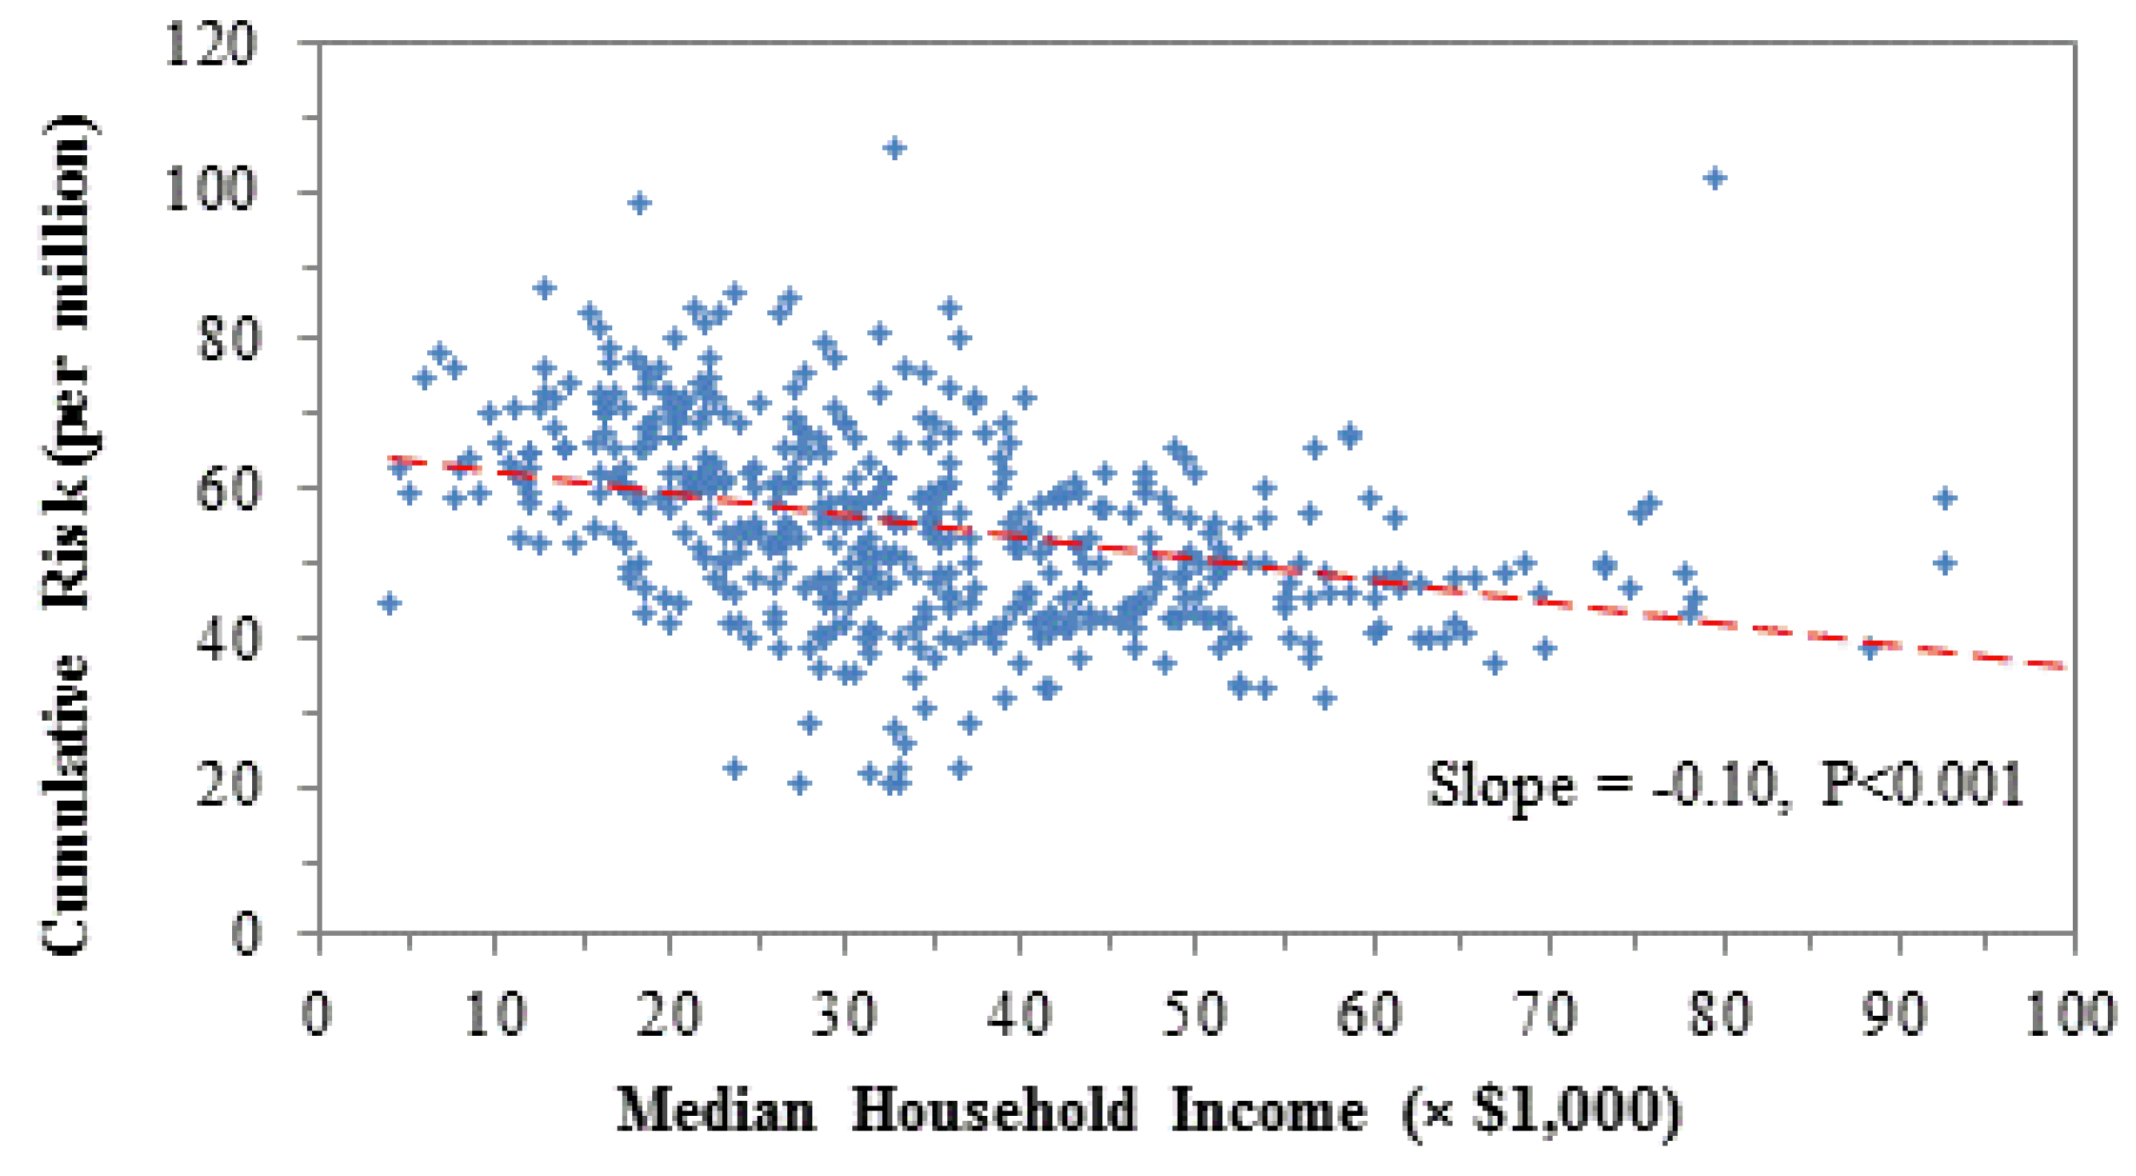
3.2. Socioeconomic Disparities in Cancer Risk

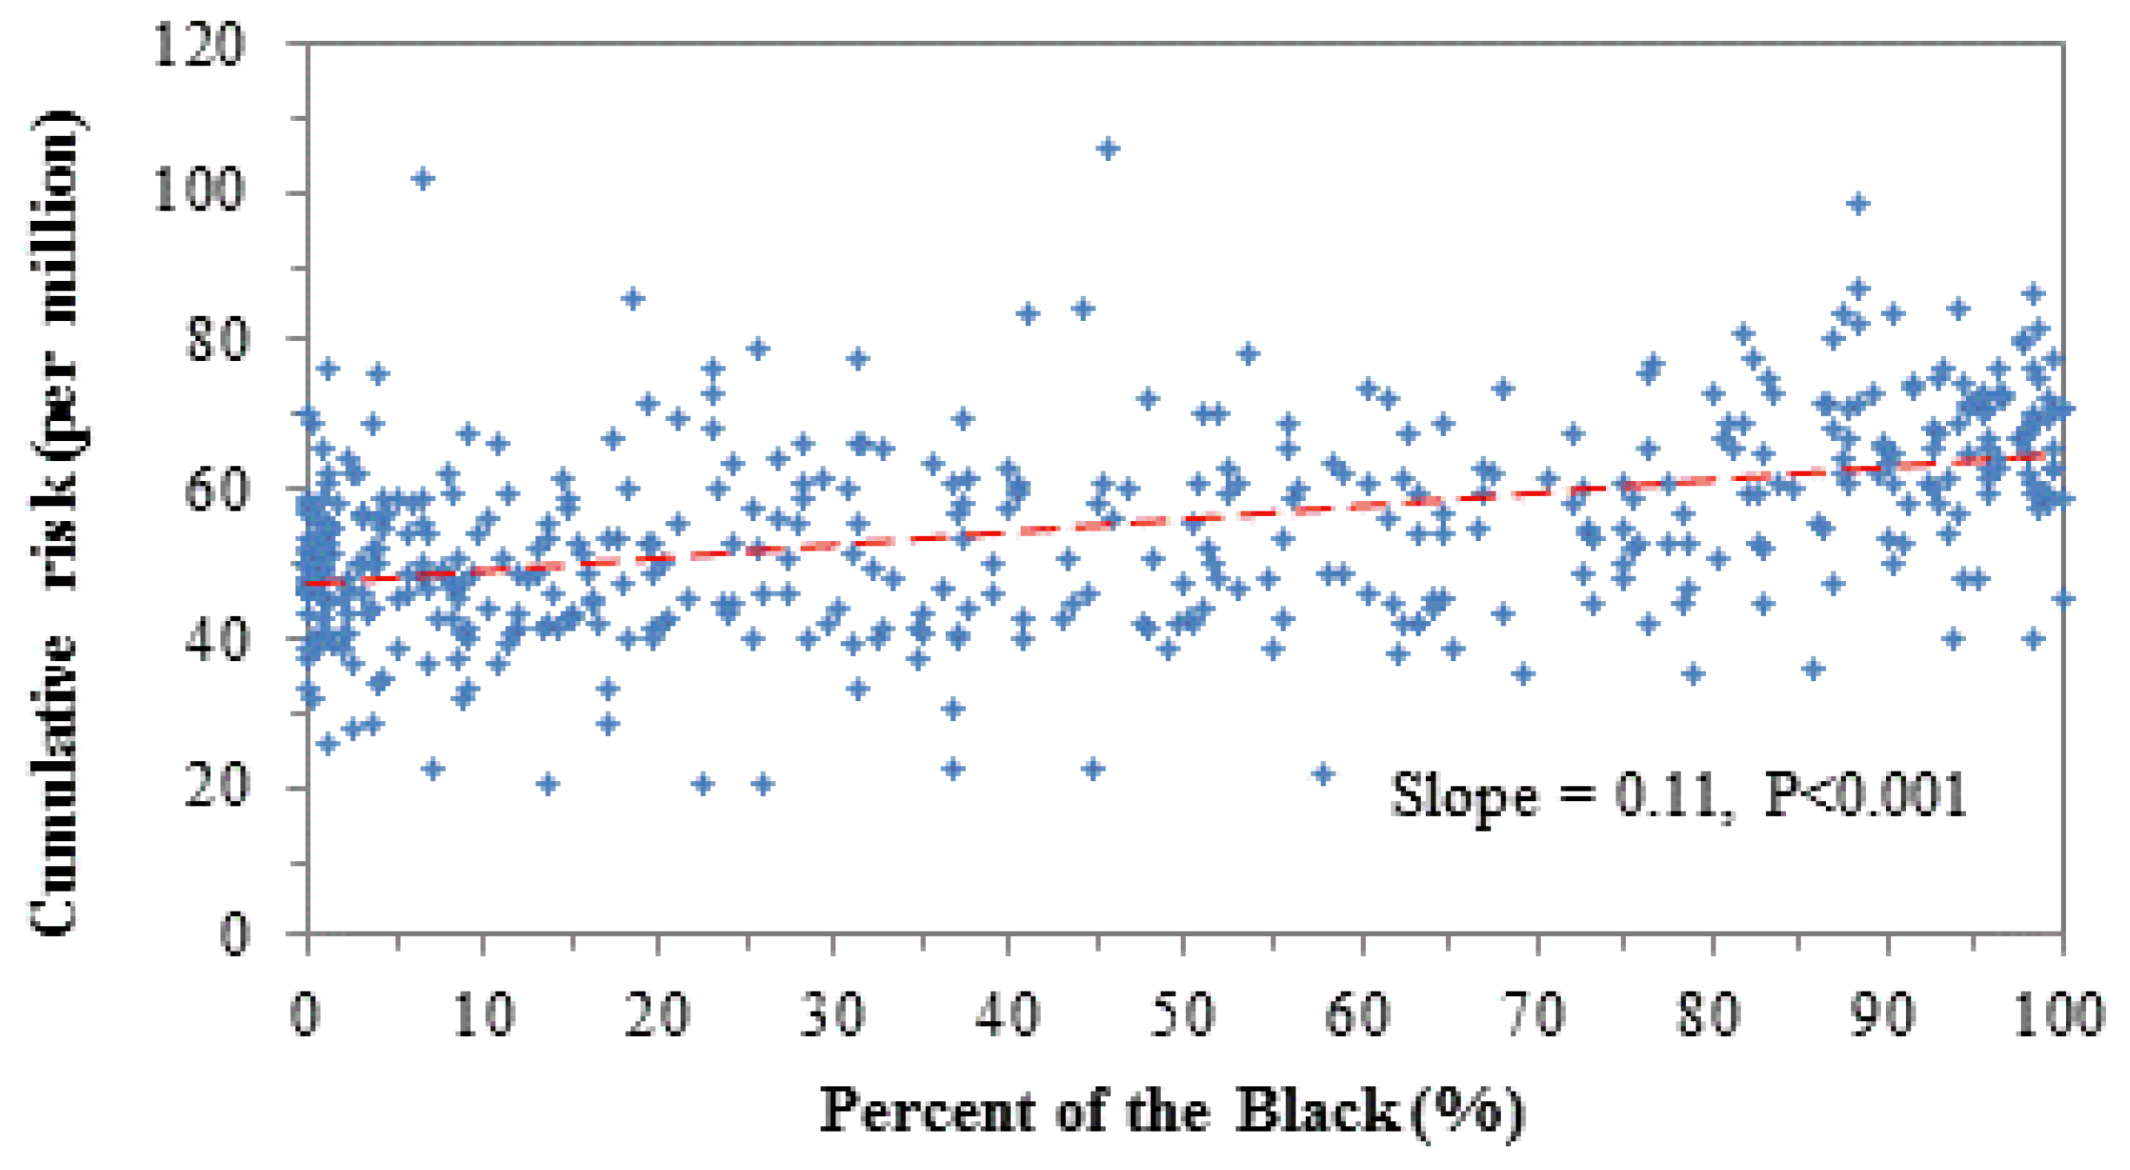
| VOCs | Income 1 | 95% C.I. | Race 2 | 95% C.I. 3 | ||
|---|---|---|---|---|---|---|
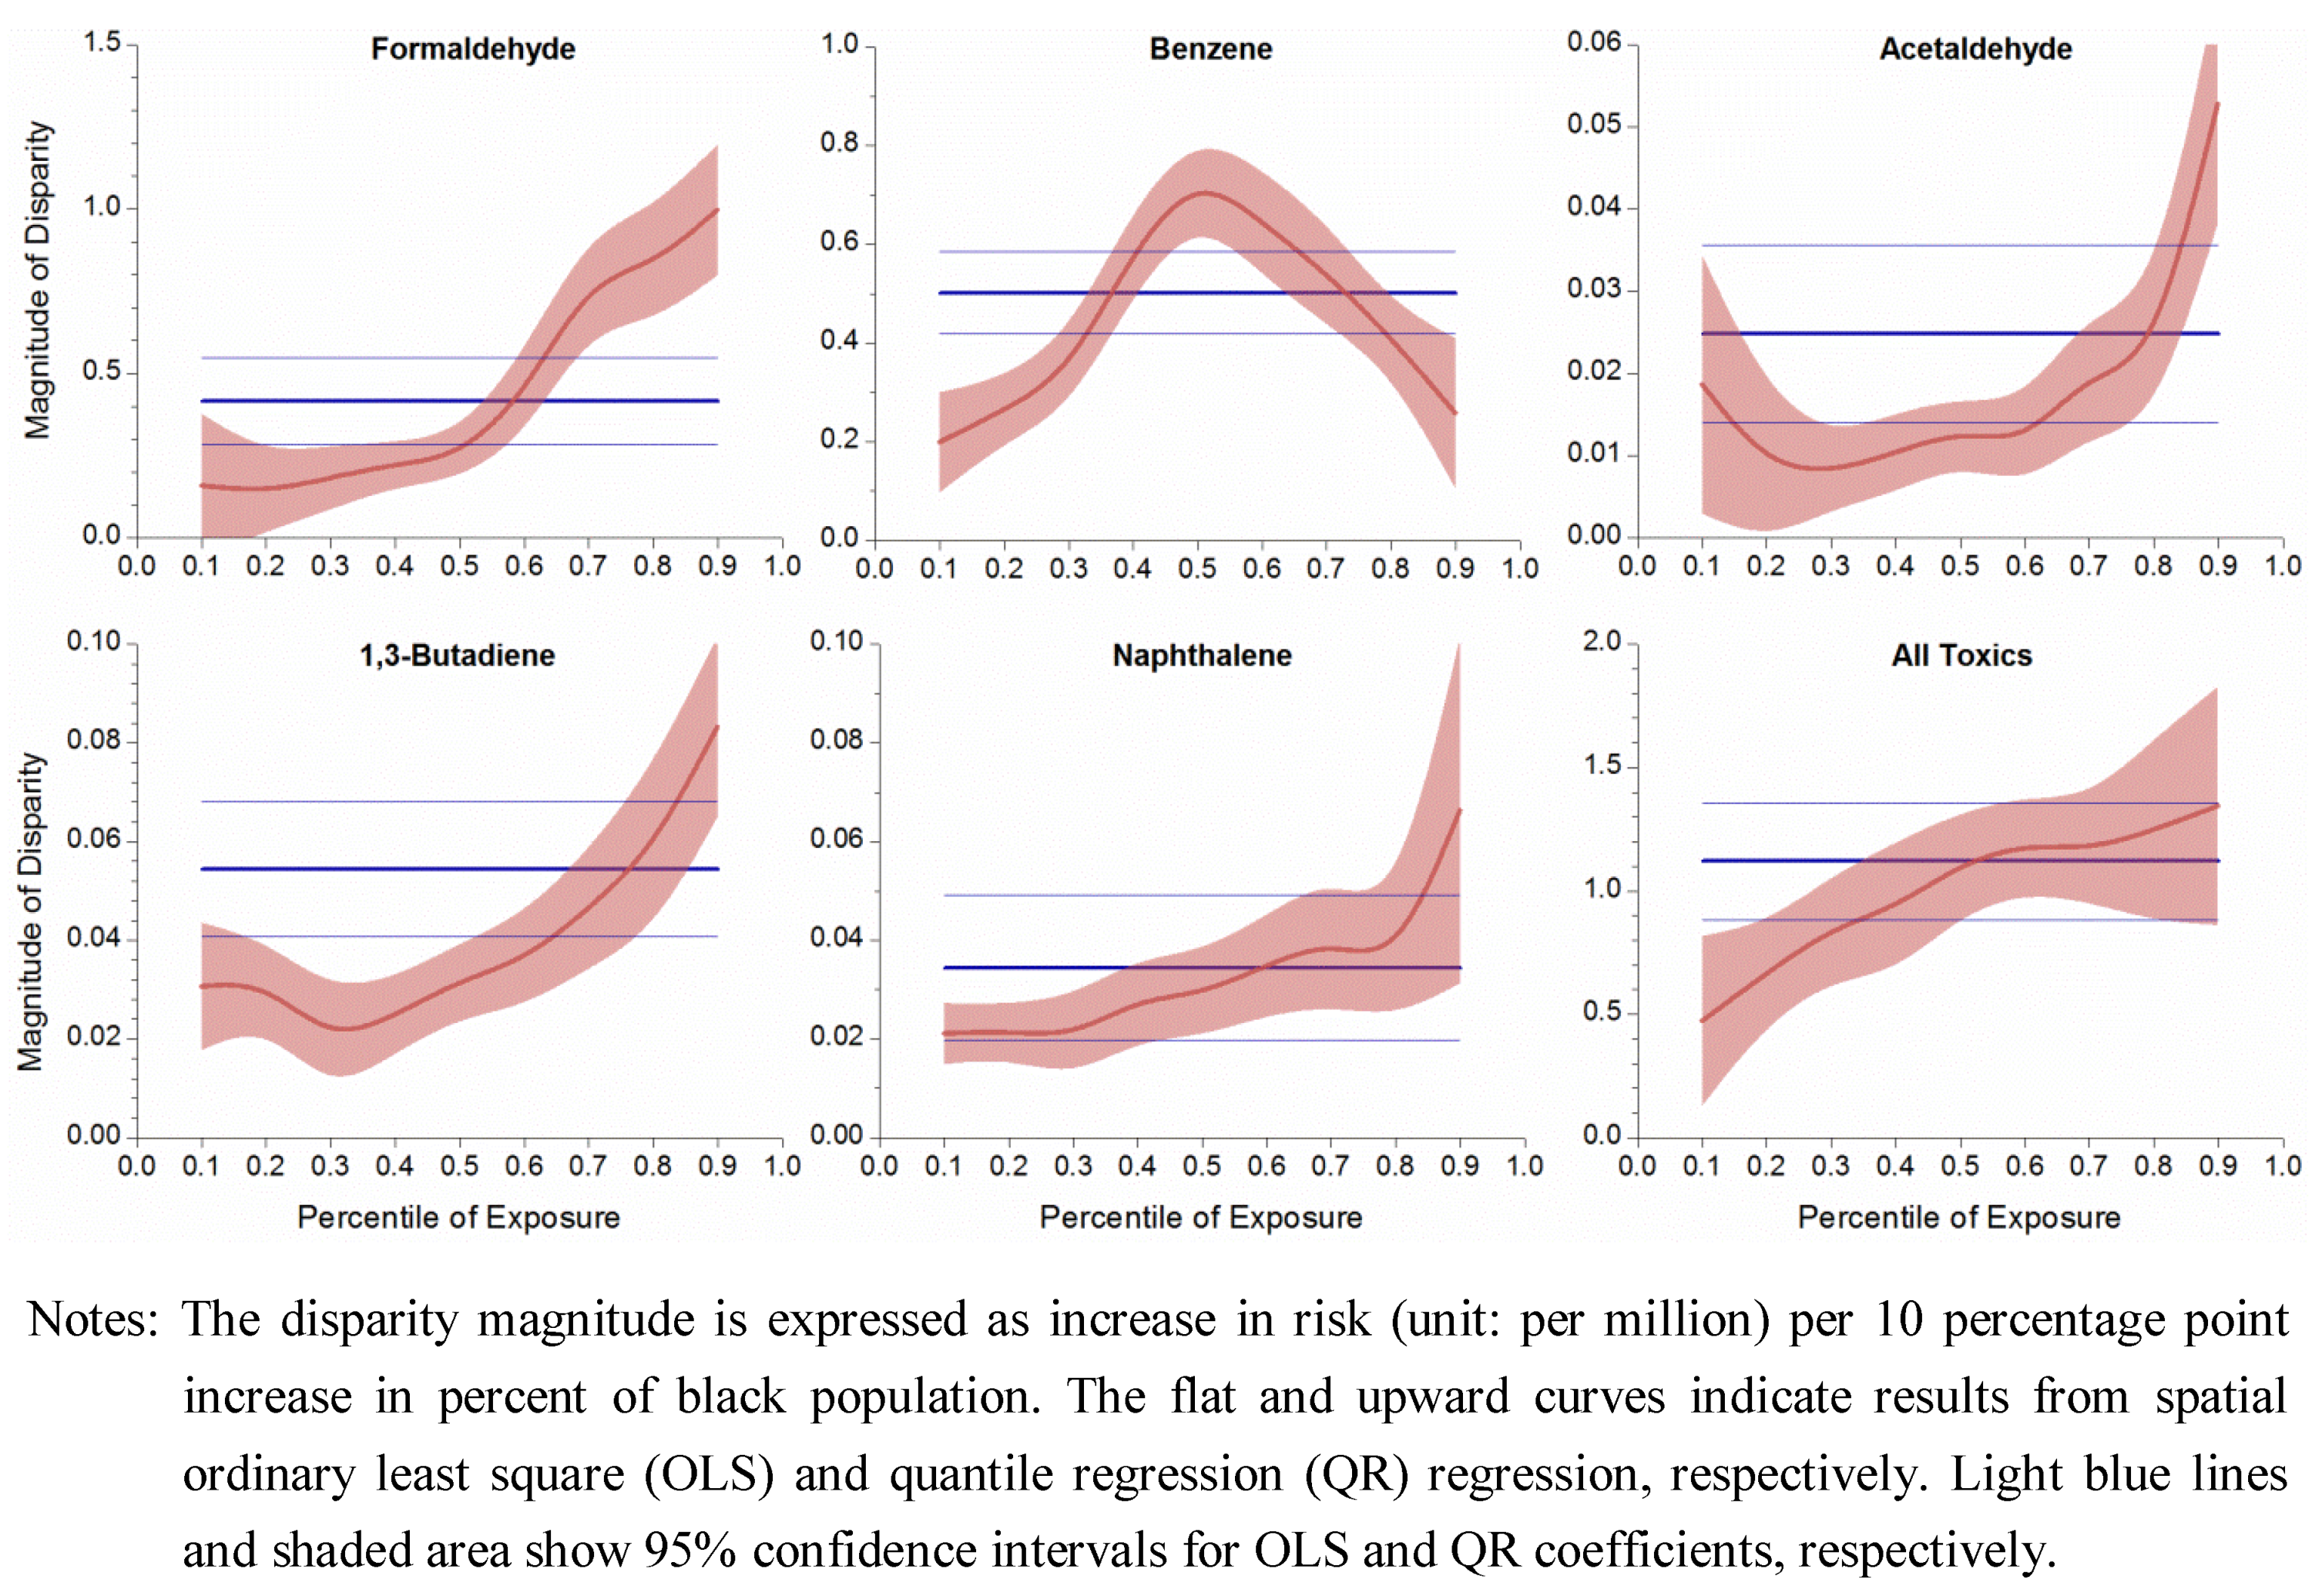
| Formaldehyde | −0.38 | (−0.60, | −0.17) | 0.42 | (0.28, | 0.55) |
| Benzene | −0.36 | (−0.49, | −0.22) | 0.50 | (0.42, | 0.58) |
| Acetaldehyde | −0.03 | (−0.04, | −0.01) | 0.02 | (0.01, | 0.04) |
| 1,3-Butadiene | −0.06 | (−0.09, | −0.04) | 0.05 | (0.04, | 0.07) |
| Naphthalene | −0.05 | (−0.08, | −0.03) | 0.03 | (0.02, | 0.05) |
| All toxics | −0.98 | (−1.36, | −0.60) | 1.12 | (0.88, | 1.36) |
3.3. Racial Disparities

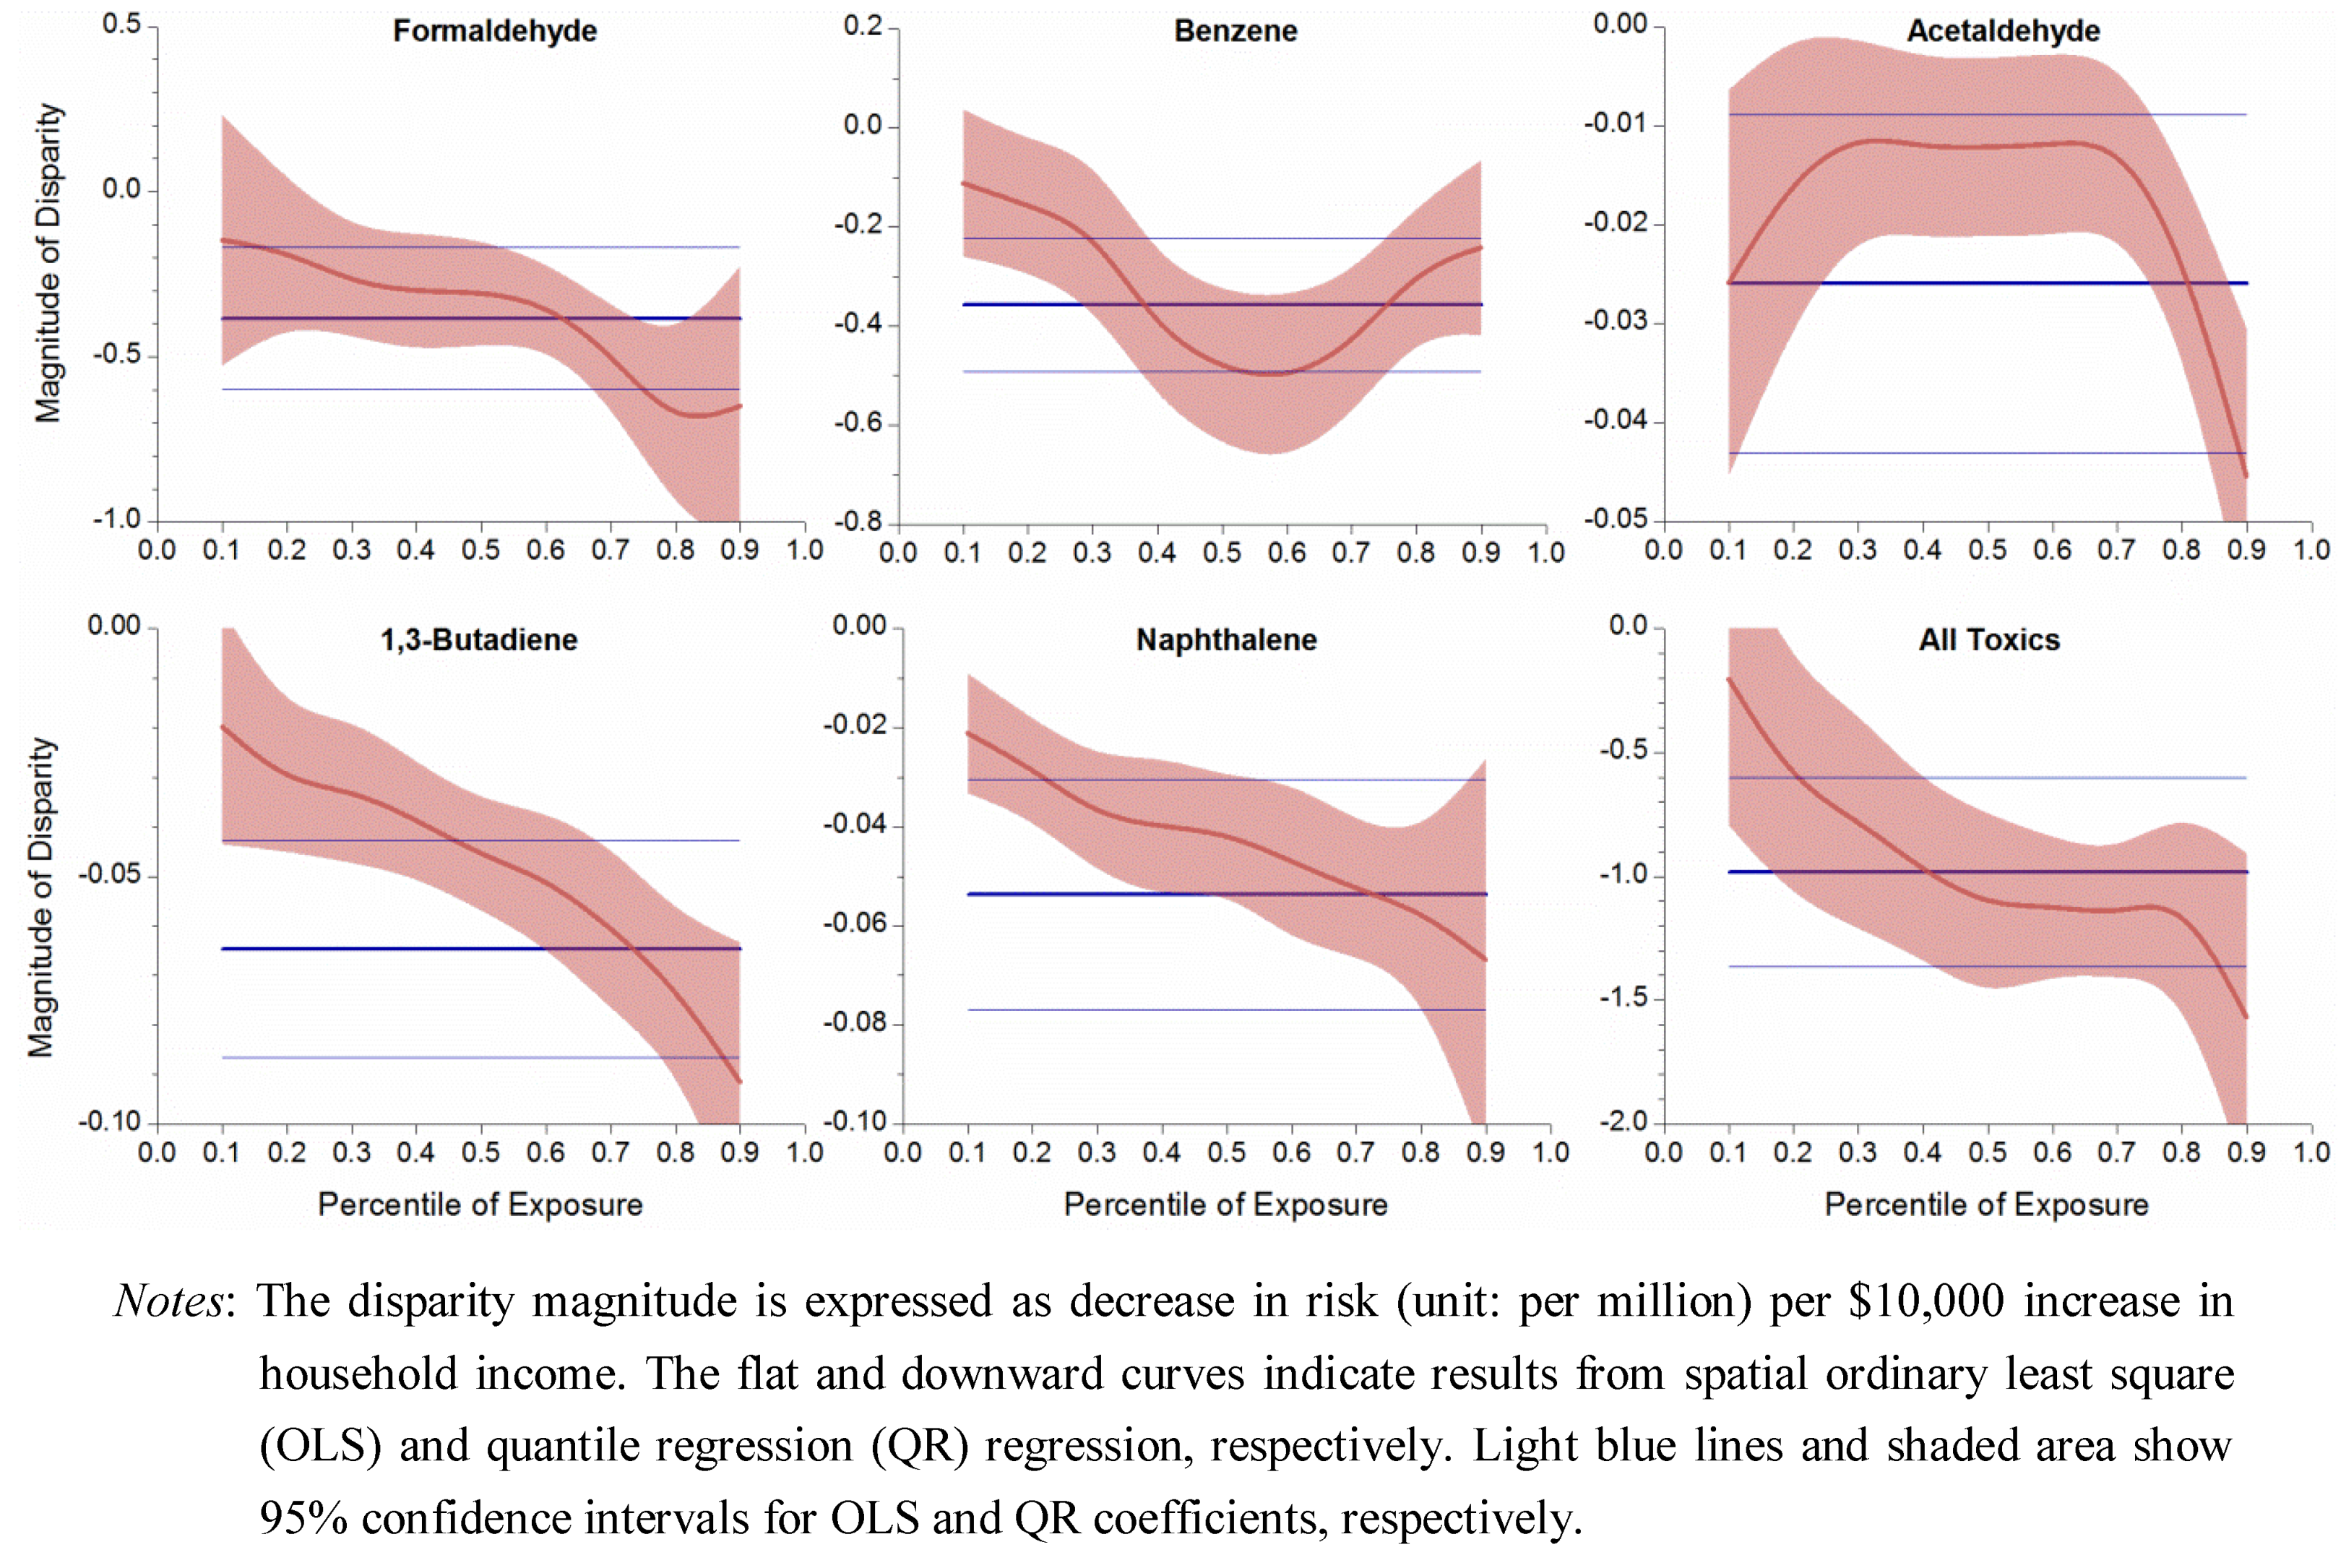
3.4. Uneven Magnitude of Disparity

4. Discussion
4.1. Explanations of Risk Disparities in Cancer Alley
4.2. Strategies to Eliminate Disparity in Air Toxics Exposure
4.3. Limitations
5. Conclusions
Acknowledgments
Conflict of Interest
References
- Fiedler, N.; Laumbach, R.; Kelly-McNeil, K.; Lioy, P.; Fan, Z.H.; Zhang, J.F.; Ottenweller, J.; Ohman-Strickland, P.; Kipen, H. Health effects of a mixture of indoor air volatile organics, their ozone oxidation products, and stress. Environ. Health Perspect. 2005, 113, 1542–1548. [Google Scholar] [CrossRef]
- Suh, H.H.; Bahadori, T.; Vallarino, J.; Spengler, J.D. Criteria air pollutants and toxic air pollutants. Environ. Health Perspect. 2000, 108, 625–633. [Google Scholar]
- Galbraith, D.; Gross, S.A.; Paustenbach, D. Benzene and human health: A historical review and appraisal of associations with various diseases. Crit. Rev. Toxicol. 2010, 40, 1–46. [Google Scholar]
- Morgan, K.T. A brief review of formaldehyde carcinogenesis in relation to rat nasal pathology and human health risk assessment. Toxicol. Pathol. 1997, 25, 291–307. [Google Scholar] [CrossRef]
- Jia, C.R.; Batterman, S. A critical review of naphthalene sources and exposures relevant to indoor and outdoor air. Int. J. Environ. Res. Public Health 2010, 7, 2903–2939. [Google Scholar] [CrossRef]
- Dominici, F.; Peng, R.D.; Barr, C.D.; Bell, M.L. Protecting human health from air pollution: Shifting from a single-pollutant to a multipollutant approach. Epidemiology 2010, 21, 187–194. [Google Scholar] [CrossRef]
- Health Effects Institute. HEI Strategic Plan for Understanding the Health Effects of Air Pollution. Available online: www.healtheffects.org/Pubs/StrategicPlan2010-2015.pdf (accessed on 15 October 2011).
- US Environmental Protect Agency. Air Pollution Research Improves Understanding of Multipollutant Impacts on Human Health. Available online: nepis.epa.gov/Adobe/PDF/P1004V9E.pdf (accessed on 15 October 2011).
- O’Neill, M.S.; Jerrett, M.; Kawachi, L.; Levy, J.L.; Cohen, A.J.; Gouveia, N.; Wilkinson, P.; Fletcher, T.; Cifuentes, L.; Schwartz, J. Health, wealth, and air pollution: Advancing theory and methods. Environ. Health Perspect. 2003, 111, 1861–1870. [Google Scholar] [CrossRef]
- Apelberg, B.J.; Buckley, T.J.; White, R.H. Socioeconomic and racial disparities in cancer risk from air toxics in Maryland. Environ. Health Perspect. 2005, 113, 693–699. [Google Scholar] [CrossRef]
- Hipp, J.R.; Lakon, C.M. Social disparities in health: Disproportionate toxicity proximity in minority communities over a decade. Health Place 2010, 16, 674–683. [Google Scholar] [CrossRef]
- Linder, S.H.; Marko, D.; Sexton, K. Cumulative cancer risk from air pollution in Houston: Disparities in risk burden and social disadvantage. Environ. Sci. Technol. 2008, 42, 4312–4322. [Google Scholar] [CrossRef]
- Abel, T.D. Skewed riskscapes and environmental injustice: A case study of metropolitan St. Louis. Environ. Manage. 2008, 42, 232–248. [Google Scholar] [CrossRef]
- Chakraborty, J. Cancer risk from exposure to hazardous air pollutants: spatial and social inequities in Tampa Bay, Florida. Int. J. Environ. Health Res. 2012, 22, 165–183. [Google Scholar] [CrossRef]
- Mohai, P.; Saha, R. Reassessing racial and socioeconomic disparities in environmental justice research. Demography 2006, 43, 383–399. [Google Scholar] [CrossRef]
- Simonsen, N.; Scribner, R.; Su, L.J.; Williams, D.; Luckett, B.; Yang, T.; Fontham, E.T.H. Environmental exposure to emissions from petrochemical sites and lung cancer: The lower mississippi interagency cancer study. J. Environ. Health Res. 2010. [Google Scholar] [CrossRef]
- Allen, B. Uneasy Alchemy: Citizens and Experts in Louisiana’s Chemical Corridor Disputes; MIT Press: Cambridge, MA, USA, 2003. [Google Scholar]
- US Census Bureau. Census 2000, Summary Tape File 3 (SF 3). Available online: www.census.gov/census2000/sumfile3.html (accessed on 15 October 2011).
- Chen, V.W.; Andrews, P.A.; Wu, X.C.; Correa, C.N.; Fontham, E.T. Cancer incidence in the industrial corridor: An update. J. La State Med. Soc. 1998, 150, 158–167. [Google Scholar]
- Groves, F.D.; Andrews, P.A.; Chen, V.W.; Fontham, E.T.; Correa, P. Is there a “cancer corridor” in Louisiana? J. La. State Med. Soc. 1996, 148, 155–165. [Google Scholar]
- Wong, O.; Foliart, D.E. Epidemiological factors of cancer in Louisiana. J. Environ. Pathol. Toxicol. Oncol. 1993, 12, 171–183. [Google Scholar]
- Kearney, G.; Kiros, G.E. A spatial evaluation of socio demographics surrounding National Priorities List sites in Florida using a distance-based approach. Int. J. Health Geogr. 2009, 8, 1–10. [Google Scholar] [CrossRef]
- Maantay, J. Asthma and air pollution in the Bronx: Methodological and data considerations in using GIS for environmental justice and health research. Health Place 2007, 13, 32–56. [Google Scholar] [CrossRef]
- US EPA Office of Air Quality & Planning Standards (OAQPS). An Overview of Methods for EPA’s National-Scale Air Toxics Assessment. Available online: www.epa.gov/ttn/atw/nata2005/05pdf/nata_tmd.pdf (accessed on 15 October 2011).
- US Census Bureau, The Geographic Areas Reference Manual (GARM); US Department of Commerce, Bureau of the Census: Washington, DC, USA, 1994.
- Eastern Research Group, Inc. Results of the 2005 NATA Model-to-Monitor Comparison, Final Report; US EPA: Washington, DC, USA, 2010. [Google Scholar]
- Rogers, R.G. Living and dying in the USA-Sociodemographic determinants of death among blacks and whites. Demography 1992, 29, 287–303. [Google Scholar] [CrossRef]
- Grineski, S.E.; Collins, T.W.; Ford, P.; Fitzgerald, R.; Aldouri, R.; Velazquez-Angulo, G.; Aguilar, M.D.R.; Lu, D.J. Climate change and environmental injustice in a bi-national context. Appl. Geogr. 2012, 33, 25–35. [Google Scholar] [CrossRef]
- Chakraborty, J. Automobiles, air toxics, and adverse health risks: Environmental inequities in Tampa Bay, Florida. Ann. Assn. Amer. Geogr. 2009, 99, 674–697. [Google Scholar] [CrossRef]
- Yu, K.M.; Lu, Z.D.; Stander, J. Quantile regression: Applications and current research areas. J. R. Stat. Soc. Ser. B Stat. 2003, 52, 331–350. [Google Scholar]
- Koenker, R.; Hallock, K.F. Quantile regression. J. Econ. Perspect. 2001, 15, 143–156. [Google Scholar] [CrossRef]
- Manahan, S.E. Environmental Chemistry; Lewis Publishers: Boca Raton, FL, USA, 2000; pp. 370–372. [Google Scholar]
- Thompson, W.E.; Hickey, J.V. Society in Focus: An Introduction to Sociology; Allyn & Bacon: Boston, MA, USA, 2004; pp. 198–226. [Google Scholar]
- Green, D.P.; Strolovitch, D.Z.; Wong, J.S. Defended neighborhoods, integration, and racially motivated crime. Amer. J. Sociol. 1998, 104, 372–403. [Google Scholar]
- Payne-Sturges, D.; Gee, G.C. National environmental health measures for minority and low-income populations: Tracking social disparities in environmental health. Environ. Res. 2006, 102, 154–171. [Google Scholar] [CrossRef]
- Bullard, R.D. Dumping in Dixie: Race, Class and Environmental Quality; Westview Press: Boulder, CO, USA, 2000; pp. 97–102. [Google Scholar]
- Szasz, A. Ecopopulism: Toxic Waste and the Movement for Environmental Justice; University of Minnesota Press: Minneapolis, MN, USA, 1994; pp. 4–6. [Google Scholar]
- D’Souza, J.C.; Jia, C.R.; Mukherjee, B.; Batterman, S. Ethnicity, housing and personal factors as determinants of VOC exposures. Atmos. Environ. 2009, 43, 2884–2892. [Google Scholar] [CrossRef]
- Brulle, R.J.; Pellow, D.N. Environmental justice: Human health and environmental inequalities. Annu. Rev. Public Health 2006, 27, 103–124. [Google Scholar] [CrossRef]
- Colten, C.E. The rusting of the chemical corridor. Technol. Culture 2006, 47, 95–101. [Google Scholar] [CrossRef]
- Medina-Ramon, M.; Goldberg, R.; Melly, S.; Mittleman, M.A.; Schwartz, J. Residential exposure to traffic-related air pollution and survival after heart failure. Environ. Health Perspect. 2008, 116, 481–485. [Google Scholar]
- Pellow, D.N. Environmental inequality formation-Toward a theory of environmental injustice. Amer. Behav. Sci. 2000, 43, 581–601. [Google Scholar]
- Freudenburg, W.R. Privileged access, privileged accounts: Toward a socially structured theory of resources and discourses. Soc. Forces 2005, 84, 89–114. [Google Scholar] [CrossRef]
- Cole, L.; Foster, S. From the Ground Up: Environmental Racism and the Rise of the Environmental Justice Movement; New York University Press: New York, NY, USA, 2001; pp. 1–4. [Google Scholar]
- Ferraro, K.F.; Farmer, M.M. Double jeopardy to health hypothesis for African Americans: Analysis and critique. J. Health Soc. Behav. 1996, 37, 27–43. [Google Scholar] [CrossRef]
- CDC, The Healthy People 2010 Final Review; Centers for Disease Control and Prevention: Atlanta, GA, USA, 2011.
- Abel, T.D.; Stephan, M. The limits of civic environmentalism. Amer. Behav. Sci. 2000, 44, 614–628. [Google Scholar] [CrossRef]
- Campbell, H.E.; Peck, L.R.; Tschudi, M.K. Justice for all? A cross-time analysis of toxics release inventory facility location. Rev. Policy Res. 2010, 27, 1–25. [Google Scholar] [CrossRef]
- Sexton, K.; Adgate, J.L.; Ramachandran, G.; Pratt, G.C.; Mongin, S.J.; Stock, T.H.; Morandi, M.T. Comparison of personal, indoor, and outdoor exposures to hazardous air pollutants in three urban communities. Environ. Sci. Technol. 2004, 38, 423–430. [Google Scholar]
- US EPA, Calculating Upper Confidence Limits for Exposure Point Concentrations at Hazardous Waste Sites; US Environmental Protection Agency: Washington, DC, USA, 2002.
Appendix
| Socioeconomic and Racial Variables | The US * | DRA * | Louisiana * | Cancer Alley |
|---|---|---|---|---|
| Total Population | 279,731,048 | 8,035,514 | 2,778,118 | 1,690,858 |
| Population Density | 73.9 | 52.01 | 63.2 | 215.1 |
| Median Household Income (in 1,000s) | 35.4 | 30.0 | 28.7 | 37.0 |
| Percent in Poverty | 12.0 | 18.6 | 19.3 | 18.6 |
| Percent Black | 12.1 | 29.8 | 27.5 | 40.1 |
| Percent Age 65+ | 12.4 | 13.1 | 11.9 | 11.0 |
| Percent Female Headed Household | 7.1 | 9.2 | 9.2 | 10.6 |
| Percent < High School Degree | 19.4 | 27.2 | 27.2 | 21.8 |
| Socioeconomic and racial variables | Initial | Rotated | ||||
|---|---|---|---|---|---|---|
| Factor1 | Factor2 | Factor1 | Factor2 | |||
| Total population | –0.32 | 0.78 | –0.29 | – 0.79 | ||
| Population density | 0.57 | –0.22 | 0.56 | 0.24 | ||
| Median household income | – 0.86 | 0.06 | – 0.86 | –0.09 | ||
| Poverty percent | 0.93 | 0.04 | 0.93 | –0.01 | ||
| Percent of the black | 0.86 | 0.17 | 0.86 | –0.14 | ||
| Percent of the population age > 65 | –0.22 | – 0.83 | –0.25 | 0.82 | ||
| Percent of female headed household | 0.93 | 0.03 | 0.93 | 0.00 | ||
| Percent of less than high school degree | 0.83 | 0.02 | 0.83 | 0.00 | ||
| Air Toxics | CAS No. | Outdoor Sources 1 | Cancer of Concern 2 | EPA Cancer Classification 2 |
|---|---|---|---|---|
| Formaldehyde | 50-00-0 | Combustion, oxidation of methane, vehicular exhausts, emissions from resins in particle board. | Squamous cell carcinoma | B1, probable human carcinogen |
| Benzene | 71-43-2 | Tobacco smoke, vehicle service stations, motor vehicle exhaust, industrial emissions | Acute myeloid leukemia | A, known human carcinogen |
| Acetaldehyde | 75-07-0 | Production of perfumes, polyester resins, and basic dyes, fruit and fish preservative, flavoring agent, solvent in the rubber, tanning, and paper industries | Squamous cell carcinoma | B2, probable human carcinogen |
| Carbon tetrachloride | 56-23-5 | Drinking water, industrial emissions | Possible liver cancer, lymphatic leukemia, non-Hodgkin's lymphoma | Carcinogenicity is undergoing reassessment |
| Ethyleneoxide | 75-21-8 | Sterilize medical equipment and supplies, fumigant to spray agricultural products | Leukemia, stomach cancer, pacreatic cancer, Hodgkin's disease | B1, bordering on B2, limitations in human carcinogenic evidence |
| 1,3-Butadiene | 106-99-0 | Emissions from the production of rubber, plastics, and resins, vehicle engine exhaust, smoke from fires, cigarette smoke | Hemato-lymphopoietic, stomach, and respiratory cancer | A, known human carcinogen |
| Naphthalene | 91-20-3 | Burning of wood and fossil fuels, industrial discharges, automobile exhaust, cigarette smoke, moth repellants, asphalt emissions | Pulmonary alveolar proteinosis | C, possible human carcinogen |
| Sources / VOCs | The U.S. | DRA Area* | Louisiana* | Cancer Alley | |||||||||||
|---|---|---|---|---|---|---|---|---|---|---|---|---|---|---|---|
| (n = 3,276) | (n = 241) | (n = 53) | (n = 11) | ||||||||||||
| Ave | Med | P90 | Ave | Med | P90 | Ave | Med | P90 | Ave | Med | P90 | ||||
| Sources | |||||||||||||||
| Point | 0.55 | 0.17 | 1.34 | 0.57 | 0.23 | 1.09 | 0.55 | 0.26 | 1.19 | 2.81 | 2.14 | 5.83 | |||
| Non-point | 2.73 | 1.74 | 6.06 | 1.68 | 1.38 | 2.94 | 1.88 | 1.51 | 3.07 | 3.99 | 2.87 | 5.26 | |||
| On-road | 1.80 | 0.76 | 4.44 | 0.89 | 0.59 | 1.71 | 1.02 | 0.73 | 2.01 | 2.68 | 1.88 | 5.82 | |||
| Non-road | 0.71 | 0.36 | 1.63 | 0.40 | 0.30 | 0.75 | 0.60 | 0.44 | 1.19 | 2.97 | 2.08 | 4.84 | |||
| Background | 7.20 | 6.81 | 10.6 | 6.81 | 6.51 | 8.5 | 7.96 | 7.97 | 9.4 | 9.36 | 8.87 | 11.2 | |||
| Secondary | 17.4 | 16.6 | 26.8 | 24.9 | 24.9 | 29.6 | 25.1 | 25.4 | 30.1 | 24.0 | 25.6 | 27.0 | |||
| Total | 30.3 | 29.1 | 44.8 | 35.3 | 34.6 | 41.0 | 37.1 | 35.9 | 43.1 | 45.8 | 46.4 | 53.2 | |||
| VOCs | |||||||||||||||
| Formaldehyde | 15.9 | 15.2 | 24.6 | 21.8 | 21.7 | 26.3 | 22.1 | 22.1 | 26.1 | 23.8 | 24.4 | 28.4 | |||
| Benzene | 3.26 | 2.86 | 6.19 | 2.48 | 2.16 | 3.93 | 3.09 | 2.81 | 4.70 | 6.62 | 5.91 | 8.57 | |||
| Acetaldehyde | 2.79 | 2.66 | 4.27 | 3.98 | 3.98 | 4.72 | 3.93 | 4.06 | 4.74 | 3.41 | 3.36 | 4.12 | |||
| Carbon tetrachloride | 2.85 | 2.85 | 2.87 | 2.86 | 2.86 | 2.87 | 2.85 | 2.86 | 2.87 | 2.87 | 2.87 | 2.88 | |||
| Ethylene oxide | 0.32 | 0.23 | 0.69 | 0.44 | 0.31 | 0.96 | 1.04 | 1.05 | 1.45 | 1.51 | 1.44 | 1.83 | |||
| 1,3-Butadiene | 0.63 | 0.45 | 1.41 | 0.39 | 0.34 | 0.68 | 0.50 | 0.45 | 1.00 | 1.13 | 1.14 | 1.70 | |||
| Naphthalene | 0.63 | 0.39 | 1.42 | 0.36 | 0.31 | 0.63 | 0.39 | 0.37 | 0.63 | 1.03 | 1.07 | 1.46 | |||


© 2012 by the authors; licensee MDPI, Basel, Switzerland. This article is an open-access article distributed under the terms and conditions of the Creative Commons Attribution license (http://creativecommons.org/licenses/by/3.0/).
Share and Cite
James, W.; Jia, C.; Kedia, S. Uneven Magnitude of Disparities in Cancer Risks from Air Toxics. Int. J. Environ. Res. Public Health 2012, 9, 4365-4385. https://doi.org/10.3390/ijerph9124365
James W, Jia C, Kedia S. Uneven Magnitude of Disparities in Cancer Risks from Air Toxics. International Journal of Environmental Research and Public Health. 2012; 9(12):4365-4385. https://doi.org/10.3390/ijerph9124365
Chicago/Turabian StyleJames, Wesley, Chunrong Jia, and Satish Kedia. 2012. "Uneven Magnitude of Disparities in Cancer Risks from Air Toxics" International Journal of Environmental Research and Public Health 9, no. 12: 4365-4385. https://doi.org/10.3390/ijerph9124365