A Systematic Review of Socioeconomic Indicators and Dental Caries in Adults

Abstract
:1. Introduction
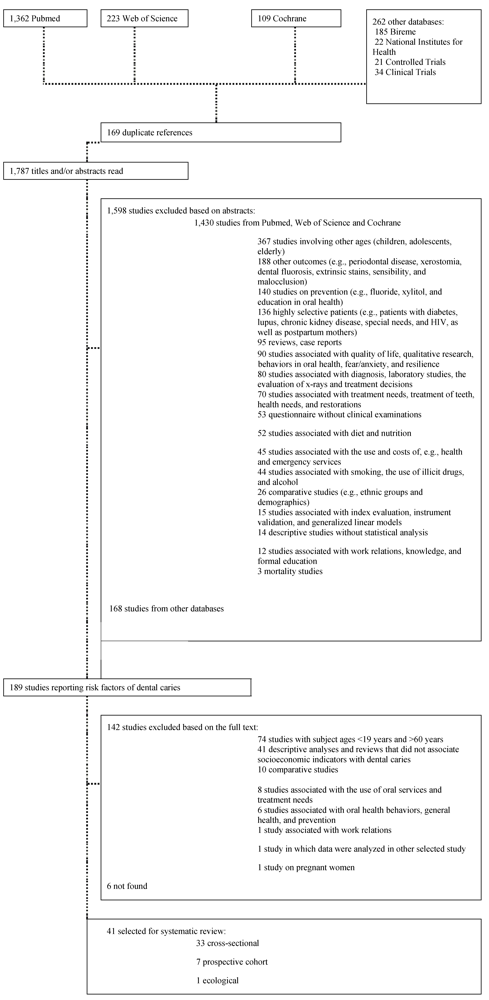
2. Methods
2.1. Search Strategy
2.2. Selection of Studies and Data Extraction
2.3. Quality Assessment
2.4. Data Synthesis

3. Results
3.1. Quality Assessment

| Authors, year | Country | Location of data collection | Total number of respondents (Final sample size) | Subjects’ age (years) | Caries index | Socioeconomic indicator | Other measures | Association between socioeconomic indicators and dental caries | Newcastle-Ottawa scale |
|---|---|---|---|---|---|---|---|---|---|
| Nikias et al., 1975 [28] | USA | Clinical setting | 1,290 (1,122) | 19+ years | Decayed teeth | Status: poverty and non-poverty | Gender, age, edentulousness, soft tissue lesions, gingival status, oral hygiene levels, visit to dentist, frequency of brushing | Poverty and more dental caries | 5 (9) |
| Mean | (p < 0.05) * | ||||||||
| Number of decayed teeth: none, 1-2, 3 or more | |||||||||
| Hansen, 1977 [29] | Norway | Clinical setting | 177 (117) | 35 years | DMFT | Years of schooling | Gender | Less schooling and more dental caries | 6 (9) |
| Decayed teeth | (≤10 and >10) | ||||||||
| Mean | (p > 0.05) * | ||||||||
| Meyer et al., 1983 [30] | Portugal | Clinical setting | 73 (73) | 21 to 30 years | DMFT | Lower socioeconomic status (manual laborers) and higher socioeconomic status (the first three classes of students graduating from the new dental school in Lisbon) | Periodontal Index, gender, oral hygiene | Lower socioeconomic status and lower DMFT =15.9 ± 6.3, 10.0 ± 5.0 | 6 (9) |
| DMFS | |||||||||
| Mean | |||||||||
| DMFS = 42.6 ± 25.0, 24.1 ± 15.3 | |||||||||
| (p < 0.05) * | |||||||||
| Tervonen et al., 1991 [31] | Finland | Not reported | 1,600 (883) | 25, 35, 50 years | Number of decayed teeth | Years of education: university level, college, vocational school, compulsory, secondary school, less than 6 years of junior high school. | Periodontal disease, age, gender, number of teeth, regularity of attendance for treatment, attitude to preservation of teeth, and others. | Less schooling and more decayed teeth | 7 (9) |
| (p < 0.05) ** | |||||||||
| (D < 7 or ≥7) | |||||||||
| OR = 1.12 (1.03–1.20) | |||||||||
| Marcenes & Sheiham, 1992 [32] | Brazil | Subjects’ homes | 164 (164) | 35 to 44 years | DMFS | Socioeconomic status by ABA-ABIPEME | Periodontal status, age, frequency of brushing, sugar consumption, frequency of dental care, mental demand of work, marital quality, and others | Lower socioeconomic status and greater DMFS | 7 (9) |
| Mean | |||||||||
| (p < 0.05) * | |||||||||
| (p > 0.05) ** | |||||||||
| Eriksen et al., 1996 [33] | Portugal | Clinical setting | 322 (196) | 30 to 39 years | Number of decayed surfaces-DS | Social class: class 1, class 2 and class 3 | Smoking, psychological status, eating between meals, tooth cleaning (OHI-S), brushing frequency, interdental cleaning, use of fluoridated toothpaste, gender, regular dental visits, and others | Lower social class and more decayed surfaces | 6 (9) |
| Years of schooling: ≤10 and >10 | |||||||||
| (p > 0.05) * | |||||||||
| DS = 12.6 ± 11.1, 12.4 ± 11.6, 15.7 ± 13.2 | |||||||||
| Mean | |||||||||
| Less schooling and more decayed surfaces | |||||||||
| (p > 0.05) * | |||||||||
| DS = 14.5 ± 12.7, 11.7 ± 10.8 | |||||||||
| Berset et al., 1996 [34] | Norway | Dental Faculty, University of Oslo | 178 (121) | 35 years | DMFS | Social class: low, medium, high | Oral hygiene, brushing frequency, use of fluoride toothpaste, saliva secretion, mutans strep., gender, dental visits, and others | Low social class and carious surfaces | 7 (9) |
| Mean | |||||||||
| Years of schooling: ≤12 and >12 | |||||||||
| (p < 0.001)* | |||||||||
| (3.4 ± 4.1, 1.1 ± 1.1, 1.3 ± 1.5) | |||||||||
| Finances: no/minor/major problems | |||||||||
| <12 years of schooling and higher number of carious surfaces | |||||||||
| (p < 0.01) * | |||||||||
| (3.1 ± 3.8, 1.4 ± 1.8) | |||||||||
| Unsatisfied with own economic status and carious surfaces | |||||||||
| (p < 0.01) * | |||||||||
| (1.5 ± 2.0, 1.6 ± 1.3, 4.4 ± 4.5) | |||||||||
| Variation in decayed surfaces could be explained by social class, economic condition and others | |||||||||
| (R2 = 0.35) ** | |||||||||
| Hescot et al., 1997 [35] | France | Exam carried out on clusters (transport-able dental chair) | 1,000 (1,000) | 35 to 44 years | DMFT and decayed teeth (DT) | Occupational group: high, medium, low (derived from the combination of occupational activity, educational level and household income) | Gender, residence (urban, rural), one or more surface fillings, treatment need (pulp care, extraction or other treatment) | Lower occupational group and more decayed teeth | 6 (9) |
| Mean | |||||||||
| (p > 0.05) * | |||||||||
| DT = 0.9 ± 1.8, 1.2 ± 2.2, 1.3 ± 2.0 | |||||||||
| Schuller, 1999 [36] | Norway | Not reported | Evaluation of two sample groups in 1983 (945 (796)) and 1994 (702 (454)) | 23 to 24 years | Decayed and filled surfaces (DFS) | Years of education: ≤12 and ≥13 | Gender, residence (urban, rural), time since last dental visit, type of dental clinic, use of dental service, treatment received, oral hygiene score, and others | Less schooling and more decayed and filled surfaces in both years analyzed | 6 (9) |
| Mean | |||||||||
| (p < 0.05) * | |||||||||
| (1983 = 40.7, 37.0) | |||||||||
| (1994 = 22.3, 15.6) | |||||||||
| Sgan-Cohen et al., 1999 [37] | Israel | Clinical setting of military institute | 1,300 (1,084) | 25 to 44 years | DMFT | Years of education: <12, 12 and >12 | Gender, age | Less schooling and more decayed teeth | 6 (9) |
| Decayed teeth (DT) | |||||||||
| Mean | |||||||||
| (p < 0.001) * | |||||||||
| DT = 1.75 ± 2.4, 1.53 ± 2.2, 0,89 ± 1.4 | |||||||||
| (p < 0.001) ** | |||||||||
| Number of years of education with the D component-Rb = −0.16 | |||||||||
| Unell et al., 1999 [38] | Örebro and Östergötland(Sweden) | Not reported | 6,343 (513) | 50 years and older | Decayed and filled teeth | Occupational status: white-collar workers in leading positions, white-collar workers, entrepreneurs, blue-collar workers | Marital status, gender, residence (rural, town, city), working hours, general self-perceived health, mouth dryness, tobacco user, satisfied with dental care, use of dental services, and others | Lower occupational status and more decayed teeth | 7 (9) |
| Decayed teeth (DT) | |||||||||
| Education: college, high school/grammar school, | |||||||||
| (p < 0.05) ** | |||||||||
| secondary education, primary education | |||||||||
| Less schooling and more decayed teeth | |||||||||
| (p < 0.05) ** | |||||||||
| Brodeur et al., 2000 [40] | Canada | Not reported | 4,742 (2,110) | 35 to 44 years | DMFT/DMFS | Family income: | Last visit to a dentist, gender, number of teeth in mouth, language spoken, age, area of residence (metropolitan, urban, rural), and others | Lower income and more decayed | 7 (9) |
| Decayed surfaces (crown and root) DS | less than $30,000, $30,000 to $59,999, $60,000 and greater (ref.) | ||||||||
| Mean | (p < 0.05) * | ||||||||
| Number of decayed surfaces: ≤3 and ≥4 | Education: primary/high school, vocational training/college, university (ref.) | <$30,000-DS = 2.6 ≥$60,000-DS = 0.9 | |||||||
| (p < 0.05) ** | |||||||||
| OR = 3.8 (2.19–6.48) | |||||||||
| 2.9 (1.72–4.86) | |||||||||
| Less schooling and more decayed surfaces (p < 0.05) * | |||||||||
| Primary-DS = 2.3 | |||||||||
| University-DS = 1.3 | |||||||||
| (p > 0.05) ** | |||||||||
| OR = 1.2 (0.79–1.81) | |||||||||
| 1.1 (0.69–1.71) | |||||||||
| Doughan et al., 2000 [41] | Lebanon | Clinical setting | 401 (401) | 35 to 44 years | DMFT | Socioeconomic status: low, middle, high | Gender, residence (urban, rural), treatment need | Worse socioeconomic status and more decayed teeth | 7 (9) |
| Decayed teeth- DT | |||||||||
| Mean | |||||||||
| (p < 0.05) * | |||||||||
| DT = 5.7 ± 5.7, 4.0 ± 4.7, 2.2 ± 2.8) | |||||||||
| Skudutyte et al., 2000 [42] | Lithuania | Clinical setting | 767 (380) | 35 to 44 years | DMFT/DMFS | Education: low, medium, high | Gender, residence (urban, rural), fluoridated water, oral hygiene index (OHI-S) | Less schooling and more decayed teeth | 6 (9) |
| Decayed teeth-DT | |||||||||
| Decayed surfaces | |||||||||
| Mean/Median | |||||||||
| (p < 0.05) * | |||||||||
| DT = 3.0, 2.0, 1.0 | |||||||||
| Paulander et al., 2003 [45] | Sweden | Clinical setting | 588 (588) | 35 and 50 years | DMFS | Education: low and high | Number of teeth, probing attachment level, periodontal treatment needs, prevalence of dental caries, dietary habits, and others | Less schooling and more DS | 6 (9) |
| Decayed surfaces-DS | |||||||||
| Mean | |||||||||
| (p > 0.05) * | |||||||||
| 35 years- | |||||||||
| DS = 1.3 (−0.2–2.7) | |||||||||
| 0.5 (−0.3–1.1) | |||||||||
| 50 years- | |||||||||
| DS = 0.4 (0.2–0.6) | |||||||||
| 0.4 (0.1–0.7) | |||||||||
| Senna et al., 2005 [47] | Italy | Clinical setting of a military institute | 3,661 (2,908) | 19 to 25 years | DMFT | Educational level: completed college or graduate school, high school, secondary school and primary school | Gingival and periodontal status | Less schooling and more decayed teeth | 5 (9) |
| Decayed teeth-DT | |||||||||
| Mean | |||||||||
| (p < 0.05) * | |||||||||
| DT = 0.7 ± 1.2, 1.0 ± 1.4, 1.5 ± 1.9, 1.9 ± 1.9 | |||||||||
| Badel et al., 2006 [12] | Croatia | Clinical setting of a military institute | 248 (248) | 19 to 29 years | DMFT | Schooling in 3 categories: primary, secondary, university | Sugar intake | Less schooling and more decayed teeth | 6 (9) |
| Decayed teeth | |||||||||
| (quartile cutoffs: Q25, Q50 and Q75%) | |||||||||
| (p < 0.05) * | |||||||||
| Q75% = 5, 4, 1.5 | |||||||||
| Julihn et al., 2006 [48] | Sweden | Clinical setting | 800 (696) | 19 years | DMFS | Educational level of father: ≤9 years, 10–12 years, >12 years | Gender, chronic disease, country of birth, years living in Sweden, oral hygiene, attitude toward dental care, dental fear, gingival bleeding index (GBI), and others | Less education of the father and more decayed surfaces | 7 (9) |
| <10 and ≥10 | |||||||||
| Occupational status of mother and father: unemployed, laborer, white-collar worker | |||||||||
| (p < 0.01) * | |||||||||
| (p > 0.05) ** | |||||||||
| Worse occupation of the father and more decayed surfaces | |||||||||
| (p < 0.01) * | |||||||||
| (p > 0.05) ** | |||||||||
| Worse occupation of the mother and more decayed surfaces | |||||||||
| (p < 0.01) * | |||||||||
| (p > 0.05) ** | |||||||||
| Varenne et al., 2006 [49] | Burkina Faso | Subjects’ homes | 493 (493) | 35 to 44 years | DMFT | Occupation: shop keeper, government employee, smallholder/craftsman, housewife, farmer/breeder(ref.) | Gender, ethnical group, dental visits, use of chewstick, consumption of fresh fruits, location (urban, rural), and others | Government employee and higher DMFT | 7 (9) |
| Mean | |||||||||
| Absence/presence of caries | |||||||||
| Educational level: high, moderate, low | |||||||||
| (p < 0.05) ** | |||||||||
| OR = 5.26 | |||||||||
| High educational level and higher CPOD | |||||||||
| (p < 0.05) ** | |||||||||
| OR = 2.99 | |||||||||
| Hessari et al., 2007 [51] | Iran | Non-specific | 8,301 (8,301) | 35 to 44 years | DMFT | Level of education: illiterate, low, medium, high | Gender, place of residence (urban, rural) | Less schooling and more decayed teeth | 7 (9) |
| Decayed teeth-DT | |||||||||
| Mean | |||||||||
| (p < 0.05) * | |||||||||
| Men-DT = 2.7 ± 2.7, 2.8 ± 2.6, 2.4 ± 2.7, 1.9 ± 2.4 | |||||||||
| Women-DT = 2.8 ± 2.7, 2.8 ± 2.8, 1.9 ± 2.4, 1.9 ± 2.6 | |||||||||
| Roberts-Thomson & Stewart, 2008 [52] | Australia | Clinical setting | 1,261(644) | 20 to 24 years | DMFS | Tertiary education (yes or no) | Gender, country of birth, living at home, visit in last 2 years, usual reason for visit, site of last visit, brushing, current smoker, alcohol use, and others | Less schooling and more cavitated caries (p > 0.05) * | 7 (9) |
| Decayed surfaces-DS | Employed (yes or no) | ||||||||
| Mean | Income (<$20,000 or $20,000 or more) | ||||||||
| DMFS modified by Protocol of US National Institute of Dental Research: precavitated decayed surface | |||||||||
| Government benefits (yes or no) | |||||||||
| DS = 0.64 ± 3.00, 1.06 ± 2.55 | |||||||||
| Unemployed and more cavitated caries (p < 0.05) * | |||||||||
| Mean | |||||||||
| DS = 0.64 ± 1.47, 1.16 ± 5.83 | |||||||||
| (p < 0.05) ** | |||||||||
| Lower income and more cavitated caries (p > 0.05) * | |||||||||
| DS = 0.94 ± 3.18, 0.85 ± 2.18 | |||||||||
| Receiving benefits and more cavitated caries (p < 0.05) * | |||||||||
| DS = 1.68 ± 4.94, 0.70 ± 1.76 | |||||||||
| (p > 0.05) ** | |||||||||
| Skudutyte-Rysstad et al., 2009 [54] | Norway | Clinical setting | 149 (149) | 35 years | DMFT | Education: no university or university | Gender, marital status, region of birth, dental anxiety score, frequency of brushing, use of dental floss, dental visits, time since last dental visit, smoking | Less schooling and more decayed surfaces | 6 (9) |
| DMFS | Household income (NOK/year): | ||||||||
| Decayed surfaces on dentin (≥2 and <2)-DS | ≤299,000 (low), | ||||||||
| 300,000–599,000 (medium) and ≥600,000 (high) | |||||||||
| (p < 0.05) * | |||||||||
| Lower income and more decayed surfaces | |||||||||
| (p < 0.05) * | |||||||||
| (p < 0.05) ** | |||||||||
| DS-OR = 4.5 (1.9–10.2) | |||||||||
| Brennan et al., 2010 [17] | Australia | Clinical setting | 879 (709) | 45 to 54 years | DMFT | Household income: under AU$30,000, AU$30,000–$60,000, over AU$60,000 | Gender, place of birth, dental knowledge of tooth decay prevention | Lower income and more decayed teeth | 7 (9) |
| Decayed teeth-DT | |||||||||
| Mean | |||||||||
| (p < 0.01) * | |||||||||
| DT = 0.8 ± 0.13, 0.4 ± 0.07, 0.2 ± 0.03 | |||||||||
| (p < 0.01) ** | |||||||||
| Geyer et al., 2010 [16] | Germany | Not reported | 1,779 (925) | 35 to 44 years | DMFT | Income in categories: highest, second highest, intermediate, second lowest and lowest; | Gender, age (years) | Lower income and higher DMFT | 7 (9) |
| (≤21 and >21) | |||||||||
| Educational level: 12–13 years, 10 years and 8–9 years of schooling | (p < 0.05) * | ||||||||
| OR = 3.74 (1.66–8.46) | |||||||||
| Cumulative effects: income + educational level l = highest socioeconomic positions, intermediate positions, lowest positions | |||||||||
| (p < 0.05) ** | |||||||||
| OR= 2.34 (1.00–5.55) | |||||||||
| Less schooling and higher DMFT | |||||||||
| (p < 0.05) * | |||||||||
| OR = 3.75 (1.99–7.05) | |||||||||
| (p < 0.05) ** | |||||||||
| OR = 2.95 (1.52–5.74) | |||||||||
| Socioeconomic status - lowest positions: income + education level and higher DMFT | |||||||||
| (p < 0.05)** | |||||||||
| OR = 6.06 (2.06–17.87) | |||||||||
| Celeste et al., 2011 [55] | Brazil | Subjects’ homes | 22,839 (20,695) | 35 to 44 years | DMFT | Gini (quartile), municipal income (quartile), household income (based on minimum wage) | Gender, age, place of residence (urban, rural), last dental visit., edentulism, prevalence of periodontal attachment loss >8 mm | More iniquity results in more decayed teeth | 7 (9) |
| Untreated dental caries | |||||||||
| Mean | |||||||||
| (p < 0.05) ** | |||||||||
| Brennan et al., 2011 [18] | Australia | Clinical setting | 879 (709) | 45 to 54 years | DMFT | Household income (under $80,000+ and <$80,000 | Dental visit pattern, dental self-care (tooth brushing) | Lower income and more decayed teeth | 7 (9) |
| Decayed teeth-DT | |||||||||
| Mean | Education: tertiary and secondary | ||||||||
| (p < 0.01) * | |||||||||
| DT = 0.1 ± 0.03, 0.5 ± 0.05 | |||||||||
| (p < 0.001) ** | |||||||||
| Income $80,000+ | |||||||||
| Beta = −0.27 | |||||||||
| Lesser schooling and more decayed teeth | |||||||||
| (p < 0.01) * | |||||||||
| DT = 0.2 ± 0.03, 0.5 ± 0.06 | |||||||||
| (p < 0.01) ** | |||||||||
| Education tertiary Beta = −0.25 | |||||||||
| Chandra et al., 2011 [56] | India | Not reported | 1,198 (1,187) | 19 to 57 years | DMFT | Socioeconomic status(SES): upper, upper middle, lower middle, upper lower, lower | Gender, periodontal status, oral pre-malignant, malignant lesions, demographic profile, etc. | Lower socioeconomic status and more decayed teeth | 6 (9) |
| Decayed teeth-DT | |||||||||
| Mean | |||||||||
| (Modified Kuppuswamy scale were based on the 1988–1989) | |||||||||
| (p < 0.001)* | |||||||||
| Upper-DT = 0.07 (±0.32) | |||||||||
| Lower DT = 0.96 (±2.06) |
| Authors, year | Country | Location of data collection | Total number of respondents (Final sample size) | Subjects’ age (years) | Caries index | Socioeconomic indicator | Other measures | Association between socioeconomic indicators and dental cariess | Newcastle-Ottawa scale |
|---|---|---|---|---|---|---|---|---|---|
| Bille, 1980 [62] | Denmark | Subjects’ homes | 389 (313) | Data evaluated at 20 years of age (cross-sectional) | DMFS | Subjects’ socioeconomic status and parents’ socioeconomic status by occupation: | Gender, dental visits | Lower socioeconomic status of parents and higher DMFS | 6 (9) |
| Mean | |||||||||
| (p > 0.05)* | |||||||||
| low (unemployment, unskilled and semiskilled occupations); | Lower socioeconomic status of subject and higher DMFT | ||||||||
| (p < 0.01)* | |||||||||
| medium (non-manual and manual skilled occupations); | |||||||||
| and high (intermediate non-manual, administrative and professional occupations) | |||||||||
| Bjertness et al., 1992 [60] | Norway | Not reported | 116 (81) Data evaluated in 1973 and 1988 | 35 and 50 years | Decayed | Years at school: | Alcohol, exercise, smoking, psychological status, sugar between meals, teeth cleaning, use of fluoride, interdental cleaning, allergies, medications, regular dental visits, and others | Less schooling and more decayed teeth | 8 (9) |
| teeth-DT | ≤10 and >10 | ||||||||
| Mean | Social class: class 1, class 2, class 3; | ||||||||
| (p > 0.05) * | |||||||||
| Satisfaction with own finances: unsatisfied, satisfied; | DT = 1.27 ± 0.452, 1.22 ± 0.417 | ||||||||
| Lower social class and more decayed teeth | |||||||||
| (p > 0.05) * | |||||||||
| DT = 1.46 ± 0.522, 1.19 ± 0.398, 1.22 ± 0.428 | |||||||||
| Dissatisfaction with finances and more decayed teeth | |||||||||
| (p > 0.05) * | |||||||||
| DT = 1.14 ± 0.378, 1.24 ± 0.432 | |||||||||
| Hahn et al., 1999 [64] | Germany | Clinical setting | 300 (298) | 50 to 60 years | DMFT | Education: low, middle, high | Gender, low-sugar nutrition, use of fluoride, dental attendance, reason for last visit, smoking habits, and others | Less schooling and decayed roots | 7 (9) |
| in the beginning of the study | Decayed root | ||||||||
| (p > 0.05) ** | |||||||||
| (cross-sectional) | Education- | ||||||||
| Β = 0.0129 | |||||||||
| Gilbert et al., 2001 [59] | USA | Not reported | 873 (723) (24 months) | 45 years and older | Decayed or filled root surface | High school graduate (yes, no) | Regular dental visits; flosses daily or more often; flosses, but less than daily; area of residence (rural, urban) | Less schooling and more new caries or restorations | 8 (9) |
| (new root decay only; new root filling(s) only; both new decay and new filling(s) or neither) | Income ( able to pay, but with difficulty or not able to pay) | ||||||||
| (p < 0.05) * | |||||||||
| Not able to pay and more new caries | |||||||||
| (p < 0.05) ** | |||||||||
| OR = 2.5 | |||||||||
| Thomson et al., 2004 [58] | New Zealand | Not reported | 922 (838) | Dental exam for caries at ages 5 and 26 years | DMFS | Socioeconomic trajectory (evaluated at 5 and 26 years of age): high-high, low-high, high-low, low-low | Tooth loss, periodontal disease, self-care, brush less than once daily, gender, time spent living in fluoridated area | Low-low and high-low socioeconomic trajectories and more decayed surfaces | 9 (9) |
| Decayed surfaces-DS | |||||||||
| Decayed/filled surfaces | |||||||||
| Loss due to caries | |||||||||
| Mean | |||||||||
| (p < 0.05) ** | |||||||||
| Mean DS | |||||||||
| High-high = 1.26 | |||||||||
| Low-high = 1.61 | |||||||||
| High-low = 1.94 | |||||||||
| Low-low = 2.05 | |||||||||
| Holst & Schuller, 2011 [63] | Nord-Trondelag | Clinical setting | Two Birth-cohorts in age groups between 35–44 from 1983 to 2006 | Age-group 35–44 years | DMFT | Education: quartile (shortest education, second shortest education, second longest education, longest education) | Age | 1983 -Less schooling and more DS | 6 (9) |
| DMFS | |||||||||
| (p < 0.05) * | |||||||||
| 2006- education and DMFS (p > 0.05) * | |||||||||
| Year 1983 = 500 (300) | Decayed surfaces-DS | ||||||||
| 1994 = 350 (135) | Decayed teeth-DT | ||||||||
| Mean | |||||||||
| 2006 = 250 (158) | |||||||||
| (cross-sectional results over 33 years) | |||||||||
| Shearer et al., 2012 [61] | New Zealand | Not reported | Birth cohort of 1,037 children born at the queen Mary Hospital | 32 years | DMFS | Socioeconomic (SES): low, medium, high | Sex, use of dental services, smoking status, familial risk, plaque trajectory | Less SES at age 32 and more DMFS | 8 (9) |
| Decayed surface-DS | |||||||||
| (p > 0.05) ** | |||||||||
| Low SES-RR = 1.15 (0.95–1.40) | |||||||||
| 932 dentally examined at age 32 years (626—had both parents interviewed (complete information) | Mean | ||||||||
| DMFS >20 | Medium SES | ||||||||
| DMFS = 12 | RR = 1.05 (0.88–1.26) |
| Authors, year | Country | Location of data collection | Total number of respondents (Final sample size) | Subjects’ age (years) | Caries index | Socioeconomic indicator | Other measures | Association between socioeconomic indicators and dental caries | Newcastle-Ottawa scale | |
|---|---|---|---|---|---|---|---|---|---|---|
| Bernabe et al., 2009 [57] | 18 countries | National statistics on dental caries experience obtained from WHO Oral Health Country/Area Profile Programme | Ecological data from the 50 richest countries in the world (18 included in the analysis) | 35 to 44 years | DMFT | Gross domestic product per capita; | Caries index, restorative index, treatment index | Worse Gini coefficient and more decayed teeth | 5 (9) | |
| Decayed teeth-DT | ||||||||||
| Gross national income per capita in 2000 (in dollars); | ||||||||||
| (p > 0.05) * | ||||||||||
| (Surveys conducted between 1995 and 2005) | ||||||||||
| Gini coefficient |
3.2. Study Location and Language
3.3. Population Characteristics
3.4. Measures of Dental Caries and Data Collection
- √ Mean number of surfaces with non-cavitated caries [52];
- √ Mean number of teeth with root decay [64];
- √ Mean number and percentage of functional teeth [28];
- √ Quartiles of total number of decayed teeth and DMFT index (25, 50 and 75%) [13];
- √ Total number of decayed teeth and total number of decayed/filled teeth [38];
- √ Number of decayed teeth, categorized as none, one to two decayed teeth and three or more decayed teeth [28];
- √ DMFT, categorized as ≤21 and >21 [16];
- √ DMFS, categorized as <10 and ≥10 [48];
- √ DMFS, categorized as >20 [61];
- √ DMFS, categorized as 12 [61];
- √ Number of decayed surfaces, categorized as <4 and ≥4 [40];
- √ Number of decayed teeth, categorized as ≥7 and <7 [31];
- √ Number of decayed surfaces, categorized as ≥2 and <2 [54];
- √ Absence of new carious lesions or new restorations [59];
3.5. Socioeconomic Indicators and Other Variables
3.6. Statistical Analysis of Associations between Dental Caries and Socioeconomic Indicators
| Socioeconomic indicator | Multivariate analysis: Socioeconomic indicator and dental cariesOR (95%CI) or Beta or R2 or RR | ||
|---|---|---|---|
| Type of association * | + (95% CI does not include 1.0 or p < 0.05) | − (95% CI does not include 1.0 or p < 0.05) | # (95% CI includes 1.0 or p > 0.05) |
| SCHOOLING | |||
| Schooling Subject’s | |||
| Tervonen et al., 1991 [31] | OR = 1.12 (1.03–1.20) | ||
| Sgan-Cohen et al., 1999 [37] | R = −0.16 (p < 0.001) | ||
| Hahn et al., 1999 [64] | (p > 0.05) | ||
| Unell et al., 1999 [38] | (p < 0.05) | ||
| Brodeur et al., 2000 [40] | OR = 1.2 (0.79–1.81) | ||
| Sgan-Cohen et al., 2000 [43] | (p < 0.001) | ||
| Varenne et al., 2006 [49] | OR = 2.99 (p < 0.05) | ||
| Geyer et al., 2010 [16] | OR = 2.95 (1.52–5.74) | ||
| Brennan et al., 2011 [18] | Β = −0.25 (p < 0.01) | ||
| Schooling Father’s | |||
| Julihn et al., 2006 [48] | (p > 0.05) | ||
| SUBJECT’S INCOME | |||
| Brodeur et al., 2000 [40] | OR = 3.8 (2.19–6.48) | ||
| Gilbert et al., 2001 [59] | OR = 2.5 (p < 0.05) | ||
| Brennan et al., 2007 [50] | (p < 0.001) | ||
| Skudutyte-Rysstad et al., 2009 [54] | OR = 4.5 (1.9–10.2) | ||
| Brennan et al., 2010 [17] | (p < 0.01) | ||
| Geyer et al., 2010 [16] | OR = 2.34 (1.00–5.55) | ||
| Brennan et al., 2011 [18] | Beta = −0.27 (p < 0.001) | ||
| OCCUPATION/JOB | |||
| Occupation/Subject’s job | |||
| Unell et al., 1999 [38] | (p < 0.05) | ||
| Varenne et al., 2006 [49] | OR = 5.26 (p < 0.05) | ||
| Roberts-Thomson et al., 2008 [52] | (p < 0.05) | ||
| Occupation/Father’s job | |||
| Julihn et al., 2006 [48] | (p > 0.05) | ||
| Occupation/Mother’s job | |||
| Julihn et al., 2006 [48] | (p > 0.05) | ||
| SOCIOECONOMIC STATUS-SES | |||
| SES Subject’s | (p > 0.05) | ||
| Marcenes & Sheiham, 1992 [32] | R2 = 0.35 | ||
| Berset et al., 1996 [34] | OR = 6.06 (2.06–17.87) | ||
| Geyer et al., 2010 [16] | |||
| Shearer et al., 2012 [61] | RR = 1.15 (0.95–1.40) | ||
| Subject’s SES trajectory | |||
| Thomson et al., 2004 [58] | (p < 0.05) | ||
| SOCIAL INDEX-Gini | |||
| Celeste et al., 2009 [53] | OR = 2.49 (2.30–2.68) | ||
| Celeste et al., 2011 [55] | (p < 0.05) | ||
4. Discussion and Conclusions
4.1. Strengths and Weaknesses of the Review
4.2. Heterogeneity of Studies and Methodological Quality
4.3. Statement of Principal Findings
4.4. Suggestions for Further Research
Acknowledgments
Conflict of Interest
References
- Marthaler, T.M. Changes in dental caries 1953–2003. Caries Res. 2004, 38, 173–181. [Google Scholar] [CrossRef]
- Petersen, P.E. Sociobehavioural risk factors in dental caries—International perspectives. Community Dent. Oral Epidemiol. 2005, 33, 274–279. [Google Scholar] [CrossRef]
- van Nieuwenhuysen, J.P.; Carvalho, J.C.; D’Hoore, W. Status of dental caries in Belgium and neighboring countries. Rev. Belge Med. Dent. 2002, 57, 186–205. [Google Scholar]
- Tickle, M. The 80:20 phenomenon: Help or hindrance to planning caries prevention programmes? Community Dent. Health 2002, 19, 39–42. [Google Scholar]
- Narvai, P.C.; Frazão, P.; Roncalli, A.G.; Antunes, J.L.F. Cárie dentária no Brasil: Declínio, polarização, iniqüidade e exclusão social. Rev. Panam Salud Publica 2006, 19, 385–393. [Google Scholar] [CrossRef]
- Berkman, L.F. Social epidemiology: Social determinants of health in the United States: Are we losing ground? Annu Rev. Public Health 2009, 30, 27–41. [Google Scholar]
- Krieger, N. Theories for social epidemiology in the 21st century: An ecosocial perspective. Int J. Epidemiol. 2001, 30, 668–677. [Google Scholar] [CrossRef]
- Rothman, K.J.; Stein, Z.; Susser, M. Rebuilding bridges: What is the real role of social class in disease occurrence? Eur. J. Epidemiol. 2011, 26, 431–432. [Google Scholar] [CrossRef]
- Holst, D.; Schuller, A.A.; Aleksejuniené, J.; Eriksen, H.M. Caries in population—A theoretical, causal approach. Eur. J. Oral Sci. 2001, 109, 143–148. [Google Scholar] [CrossRef]
- Luglie, P.F.; Cellai, A.; Cossi, R.; Chessa, G. Dental caries and socioeconomic development of Sardinian population. Minerva Stomatol. 1989, 38, 673–678. [Google Scholar]
- Ogunbodede, E.O.; Olusile, A.O.; Ogunniyi, S.O.; Faleyimu, B.L. Socio-economic factors and dental health in an obstetric population. West. Afr. J. Med. 1996, 15, 158–162. [Google Scholar]
- Badel, T.; Restek-Despotusic, S.; Kern, J.; Keros, J.; Segovic, S. Caries in croatian army recruits in 2000. Acta Med. Croat. 2006, 60, 315–318. [Google Scholar]
- Bastos, J.L.; Nomura, L.H.; Peres, M.A. Dental caries and associated factors among young male adults between 1999 and 2003 in Southern Brazil. Community Dent. Health 2007, 24, 122–127. [Google Scholar]
- Crossner, C.G.; Unell, L. A longitudinal study of dental health from the age of 14 to 41. Swed. Dent. J. 2007, 31, 65–74. [Google Scholar]
- Hopcraft, M.S.; Morgan, M.V. Pattern of dental caries experience on tooth surfaces in an adult population. Community Dent. Oral Epidemiol. 2006, 34, 174–183. [Google Scholar] [CrossRef]
- Geyer, S.; Schneller, T.; Micheelis, W. Social gradients and cumulative effects of income and education on dental health in the fourth German oral health study. Community Dent. Oral Epidemiol. 2010, 38, 120–128. [Google Scholar] [CrossRef]
- Brennan, D.; Spencer, J.; Roberts-Thomson, K. Dental knowledge and oral health among middle-aged adults. Aust. N. Z. J. Public Health 2010, 34, 472–475. [Google Scholar] [CrossRef]
- Brennan, D.S.; Spencer, A.J.; Roberts-Thomson, K.F. Dental self-care and visiting behaviour in relation to social inequality in caries experience. Community Dent. Health 2011, 28, 216–221. [Google Scholar]
- Bandeca, M.C.; Nadalin, M.R.; Calixto, L.R.; Saad, J.R.; Silva, S.R. Correlation between oral health perception and clinical factors in a Brazilian community. Community Dent. Health 2011, 28, 64–68. [Google Scholar]
- Nau, J.Y. The sad dental state of French peasants. Rev. Med. Suisse 2011, 7, 1834–1835. [Google Scholar]
- Pierleoni, P.; Fazio, D. Epidemiologic study of dental caries in a group of soldiers from the Alpine Regiment of Trentino-Alto Adige. Arch. Stomatol. 1979, 20, 205–215. [Google Scholar]
- Reddy, V.R. Dental caries in the permanent teeth of the people of Gulbarga, Karnataka. Acta Anthropogenet. 1980, 4, 89–127. [Google Scholar]
- Treldal, K.; Oustad, B. Dental health habits of 40-year old patients in Aust-Agder county. Dental status of non-recall patients. Nor. Tannlaegeforen Tid. 1990, 100, 328–332. [Google Scholar]
- Berge, K.A.; Fylkesnes, K. Dental health and dental attendance among 25- and 40-year olds. Nor. Tannlaegeforen Tid. 1991, 101, 408–412. [Google Scholar]
- Rao, S.; Singh, M.A.; Singh, B.P.; Rao, M.S. Oral health assessment of an adult rural community. J. Pierre Fauchard Acad. 1994, 8, 15–19. [Google Scholar]
- Murariu, A.; Danila, I.; Hanganu, C. Dental caries in adults, 35 to 44 years, Iasi county. Rev. Med. Chir. Soc. Med. Nat. Iasi. 2007, 111, 482–486. [Google Scholar]
- Wells, G.A.; Shea, B.; O’Connell, D.; Peterson, J.; Welch, V.; Losos, M.; Tugwell, P. The Newcastle-Ottawa Scale (NOS) for Assessing the Quality of Nonrandomized Studies in Meta-Analyses. Available online: http://www.ohri.ca/programs/clinical_epidemiology/oxford.asp (accessed on 9 September 2012).
- Nikias, M.K.; Fink, R.; Shapiro, S. Comparisons of poverty and nonpoverty groups on dental status, needs, and practices. J. Public Health Dent. 1975, 35, 237–259. [Google Scholar] [CrossRef]
- Hansen, B.F. Caries experience in a Norwegian urban population. Community Dent. Oral Epidemiol. 1977, 5, 132–135. [Google Scholar]
- Meyer, K.; Freitas, E.; Davis, R.K.; Freitas, J.; Kristoffersen, T. Dental health among young adult Portuguese in relation to socio-economic differences. Rev. Port. Estomatol Cir. Maxilofac. 1983, 24, 461–478. [Google Scholar]
- Tervonen, T.; Knuuttila, M.; Nieminen, P. Risk factors associated with abundant dental caries and periodontal pocketing. Community Dent. Oral Epidemiol. 1991, 19, 82–87. [Google Scholar] [CrossRef]
- Marcenes, W.S.; Sheiham, A. The relationship between work stress and oral health status. Soc. Sci Med. 1992, 35, 1511–1520. [Google Scholar] [CrossRef]
- Eriksen, H.M.; Marques, M.D.; Bjertness, E.; Moe, B. Dental caries determinants in an adult Portuguese population and a comparison with Norwegian adults. Acta Odontol Scand. 1996, 54, 49–54. [Google Scholar] [CrossRef]
- Berset, G.P.; Eriksen, H.M.; Bjertness, E.; Hansen, B.F. Caries experience of 35-year-old Oslo residents and changes over a 20-year period. Community Dent. Health 1996, 13, 238–244. [Google Scholar]
- Hescot, P.; Bourgeois, D.; Doury, J. Oral health in 35–44 year old adults in France. Int Dent. J. 1997, 47, 94–99. [Google Scholar] [CrossRef]
- Schuller, A.A. Better oral health, more inequality—Empirical analysis among young adults. Community Dent. Health 1999, 16, 154–159. [Google Scholar]
- Sgan-Cohen, H.D.; Horev, T.; Zusman, S.P.; Katz, J.; Eldad, A. The prevalence and treatment of dental caries among Israeli permanent force military personnel. Mil. Med. 1999, 164, 562–565. [Google Scholar]
- Unell, L.; Soderfeldt, B.; Halling, A.; Birkhed, D. Explanatory models for clinically determined and symptom-reported caries indicators in an adult population. Acta Odontol Scand. 1999, 57, 132–138. [Google Scholar] [CrossRef]
- Aleksejuniene, J.; Eriksen, H.M.; Holst, D. Variation in caries and treatment experience in 35–44-year-old Lithuanians. Community Dent. Oral Epidemiol. 2000, 28, 356–364. [Google Scholar]
- Brodeur, J.M.; Payette, M.; Benigeri, M.; Gagnon, P.F.; Olivier, M.; Chabot, D. Dental caries in Quebec adults aged 35 to 44 years. J. Can. Dent. Assoc. 2000, 66, 374–379. [Google Scholar]
- Doughan, B.; Kassak, K.; Bourgeois, D.M. Oral health status and treatment needs of 35–44-year old adults in Lebanon. Int Dent. J. 2000, 50, 395–399. [Google Scholar] [CrossRef]
- Skudutyte, R.; Aleksejuniene, J.; Eriksen, H.M. Dental caries in adult Lithuanians. Acta Odontol. Scand. 2000, 58, 143–147. [Google Scholar] [CrossRef]
- Sgan-Cohen, H.D.; Katz, J.; Horev, T.; Dinte, A.; Eldad, A. Trends in caries and associated variables among young Israeli adults over 5 decades. Community Dent. Oral Epidemiol. 2000, 28, 234–240. [Google Scholar]
- Lin, H.C.; Wong, M.C.; Zhang, H.G.; Lo, E.C.; Schwarz, E. Coronal and root caries in Southern Chinese adults. J. Dent. Res. 2001, 80, 1475–1479. [Google Scholar] [CrossRef]
- Paulander, J.; Axelsson, P.; Lindhe, J. Association between level of education and oral health status in 35-, 50-, 65- and 75-year-olds. J. Clin. Periodontol. 2003, 30, 697–704. [Google Scholar] [CrossRef]
- Ceylan, S.; Acikel, C.H.; Okcu, K.M.; Kilic, S.; Tekbas, O.F.; Ortakoglu, K. Evaluation of the dental health of the young adult male population in Turkey. Mil. Med. 2004, 169, 885–889. [Google Scholar]
- Senna, A.; Campus, G.; Gagliani, M.; Strohmenger, L. Socio-economic influence on caries experience and CPITN values among a group of Italian call-up soldiers and cadets. Oral Health Prev. Dent. 2005, 3, 39–46. [Google Scholar]
- Julihn, A.; Barr, A.M.; Grindefjord, M.; Modeer, T. Risk factors and risk indicators associated with high caries experience in Swedish 19-year-olds. Acta Odontol. Scand. 2006, 64, 267–273. [Google Scholar] [CrossRef]
- Varenne, B.; Petersen, P.E.; Ouattara, S. Oral health behaviour of children and adults in urban and rural areas of Burkina Faso, Africa. Int. Dent. J. 2006, 56, 61–70. [Google Scholar]
- Brennan, D.S.; Spencer, A.J.; Roberts-Thomson, K.F. Caries experience among 45–54 year olds in Adelaide, South Australia. Aust. Dent. J. 2007, 52, 122–127. [Google Scholar] [CrossRef]
- Hessari, H.; Vehkalahti, M.M.; Eghbal, M.J.; Murtomaa, H.T. Oral health among 35- to 44-year-old Iranians. Med. Princ. Prac.t 2007, 16, 280–285. [Google Scholar] [CrossRef]
- Roberts-Thomson, K.; Stewart, J.F. Risk indicators of caries experience among young adults. Aust. Dent. J. 2008, 53, 122–127. [Google Scholar] [CrossRef]
- Celeste, R.K.; Nadanovsky, P.; Leon, P.L.; Fritzell, J. The individual and contextual pathways between oral health and income inequality in Brazilian adolescents and adults. Soc. Sci. Med. 2009, 69, 1468–1475. [Google Scholar] [CrossRef]
- Skudutyte-Rysstad, R.; Sandvik, L.; Aleksejuniene, J.; Eriksen, H.M. Dental health and disease determinants among 35-year-olds in Oslo, Norway. Acta Odontol. Scand. 2009, 67, 50–56. [Google Scholar] [CrossRef]
- Celeste, R.K.; Fritzell, J.; Nadanovsky, P. The relationship between levels of income inequality and dental caries and periodontal diseases. Cad. Saude Publica 2011, 27, 1111–1120. [Google Scholar] [CrossRef]
- Chandra Shekar, B.R.; Reddy, C. Oral health status in relation to socioeconomic factors among the municipal employees of Mysore city. Indian J. Dent. Res. 2011, 22, 410–418. [Google Scholar] [CrossRef]
- Bernabe, E.; Sheiham, A.; Sabbah, W. Income, income inequality, dental caries and dental care levels: An ecological study in rich countries. Caries Res. 2009, 43, 294–301. [Google Scholar] [CrossRef]
- Thomson, W.M.; Poulton, R.; Milne, B.J.; Caspi, A.; Broughton, J.R.; Ayers, K.M. Socio-economic inequalities in oral health in childhood and adulthood in a birth cohort. Community Dent. Oral Epidemiol. 2004, 32, 345–353. [Google Scholar] [CrossRef]
- Gilbert, G.H.; Duncan, R.P.; Dolan, T.A.; Foerster, U. Twenty-four month incidence of root caries among a diverse group of adults. Caries Res. 2001, 35, 366–375. [Google Scholar] [CrossRef]
- Bjertness, E.; Eriksen, H.M.; Hansen, B.F. Factors of importance for changes in dental caries among adults. A follow-up study of Oslo citizens from the age of 35 to 50 years. Acta Odontol. Scand. 1992, 50, 193–200. [Google Scholar]
- Shearer, D.M.; Thomson, W.M.; Caspi, A.; Moffitt, T.E.; Broadbent, J.M.; Poulton, R. Family history and oral health: Findings from the Dunedin Study. Community Dent. Oral Epidemiol. 2012, 40, 105–115. [Google Scholar] [CrossRef]
- Bille, J. Dental caries in a group of 20-year-olds after previous participation in public child dental health services in Copenhagen, Denmark. Community Dent. Oral Epidemiol. 1980, 8, 27–32. [Google Scholar] [CrossRef]
- Holst, D.; Schuller, A.A. Equality in adults’ oral health in Norway. Cohort and cross-sectional results over 33 years. Community Dent. Oral. Epidemiol. 2011, 39, 488–497. [Google Scholar]
- Hahn, P.; Reinhardt, D.; Schaller, H.G.; Hellwig, E. Root lesions in a group of 50–60 year-old Germans related to clinical and social factors. Clin Oral Investig. 1999, 3, 168–174. [Google Scholar] [CrossRef]
- Petersen, P.E.; Bourgeois, D.; Ogawa, H.; Day-Estupinan, S.; Ndiaye, C. The global burden of diseases and risk to oral health. Bull. Word Health Organ. 2005, 83, 66–69. [Google Scholar]
- Barros, R.P.; Henriques, R.; Mendonca, R. Desigualdade e pobreza no Brasil: Retrato de uma estabilidade inaceitável. Rev. Bras. Ci Soc. 2000, 15, 123–142. [Google Scholar] [CrossRef]
- Junqueira, S.R.; Araújo, M.E.; Antunes, J.L.F.; Narvai, P.C. Indicadores socioeconômicos e recursos odontológicos em Municípios do Estado de São Paulo, Brasil, no final do século XX. Epidemiol Serv Saude 2006, 15, 41–53. (in Portuguese). [Google Scholar]
- McGillivray, M.; Howard, W. Measuring development? The UNDP’s human development index. J. Int. Dev. 2006, 5, 183–192. [Google Scholar] [CrossRef]
- Dahlgren, G.; Whitehead, M. Policies and Strategies to Promote Social Equity in Health. Available online: http://whaqlibdoc.who.int/euro/-1993/EUR_ICP_RPD414(2) (accessed on 15 October 2011).
- Higgins, J.P.T.; Altman, D.G. Chapter 8: Assessing Risk of Bias in Included Studies. In Cochrane Handbook for Systematic Reviews of Interventions; John Wiley & Sons Ltd.: London, UK, 2008. [Google Scholar]
© 2012 by the authors; licensee MDPI, Basel, Switzerland. This article is an open-access article distributed under the terms and conditions of the Creative Commons Attribution license (http://creativecommons.org/licenses/by/3.0/).
Share and Cite
Costa, S.M.; Martins, C.C.; Bonfim, M.d.L.C.; Zina, L.G.; Paiva, S.M.; Pordeus, I.A.; Abreu, M.H.N.G. A Systematic Review of Socioeconomic Indicators and Dental Caries in Adults. Int. J. Environ. Res. Public Health 2012, 9, 3540-3574. https://doi.org/10.3390/ijerph9103540
Costa SM, Martins CC, Bonfim MdLC, Zina LG, Paiva SM, Pordeus IA, Abreu MHNG. A Systematic Review of Socioeconomic Indicators and Dental Caries in Adults. International Journal of Environmental Research and Public Health. 2012; 9(10):3540-3574. https://doi.org/10.3390/ijerph9103540
Chicago/Turabian StyleCosta, Simone M., Carolina C. Martins, Maria de Lourdes C. Bonfim, Lívia G. Zina, Saul M. Paiva, Isabela A. Pordeus, and Mauro H. N. G. Abreu. 2012. "A Systematic Review of Socioeconomic Indicators and Dental Caries in Adults" International Journal of Environmental Research and Public Health 9, no. 10: 3540-3574. https://doi.org/10.3390/ijerph9103540