Article

Aircraft Noise and Quality of Life around Frankfurt Airport

1
ZEUS GmbH, Sennbrink 46, 58093 Hagen, Germany
2
Hörzentrum Oldenburg GmbH, Marie-Curie-Str. 2, 26129 Oldenburg, Germany
3
Department of Psychology, University Hamburg, Von-Melle-Park 5, 20146 Hamburg, Germany
4
Institute of Hygiene and Environmental Medicine, Faculty of Medicine, Justus-Liebig-University Giessen, Friedrichstr. 16, D-35392 Giessen, Germany
*
Author to whom correspondence should be addressed.
Int. J. Environ. Res. Public Health 2010, 7(9), 3382-3405; https://doi.org/10.3390/ijerph7093382
Submission received: 16 July 2010 / Revised: 26 August 2010 / Accepted: 26 August 2010 / Published: 31 August 2010
(This article belongs to the Special Issue Noise and Quality of Life)

Abstract

:
In a survey of 2,312 residents living near Frankfurt Airport aircraft noise annoyance and disturbances as well as environmental (EQoL) and health-related quality of life (HQoL) were assessed and compared with data on exposure due to aircraft, road traffic, and railway noise. Results indicate higher noise annoyance than predicted from general exposure-response curves. Beside aircraft sound levels source-related attitudes were associated with reactions to aircraft noise. Furthermore, aircraft noise affected EQoL in general, although to a much smaller extent. HQoL was associated with aircraft noise annoyance, noise sensitivity and partly with aircraft noise exposure, in particular in the subgroup of multimorbid residents. The results suggest a recursive relationship between noise and health, yet this cannot be tested in cross-sectional studies. Longitudinal studies would be recommendable to get more insight in the causal paths underlying the noise-health relationship.

1. Introduction

Frankfurt Airport (Frankfurt am Main, Germany) is an important international airport in Europe with an estimated 486,000 movements (10% at night-time), 53 million passengers and 2 million tons of cargo (in 2008). For 2020 about 701,000 movements (88 Mio passengers, more than 3 million tons of cargo) are predicted. In order to manage this predicted amount of movements it is intended to construct a new 4th runway to increase the current capacity of 83 to 120 flight movements per hour. The opening of the new runway is expected in 2011.
After the announcement of the airport expansion in 1998 a regional mediation process started and a round table, the Regional Dialogue Forum Frankfurt Airport (RDF), was formed in order to continue information on and discussion about the development of the airport. Members of the RDF are representatives of action groups, local authorities, trade unions, churches, regional industry, and aviation industry. After a feasibility study about the assessment of aircraft noise effects was carried out in 2003 [1] the RDF commissioned a main field study on the effects of aircraft noise in communities in the vicinity of Frankfurt Airport. This main field study (FRA-S) was carried out from 2004 to 2006 and took place before the final approval decision about the expansion was made at the end of 2007. The study aimed at assessing the reactions to aircraft noise of residents around an international airport in a situation between the announcement and the planned implementation of the expansion of the airport. The objectives of the field study in particular were:
  • ▪ to assess the impact of aircraft noise before airport expansion, i.e., the construction of the new 4th runway;
  • ▪ to get an update of the regional exposure-response relationship for aircraft noise annoyance and disturbances due to aircraft noise (communication, restoration, concentration/work, sleep);
  • ▪ to get information about the status quo of environmental and health-related quality of life and any effects of aircraft noise on that status quo.
A report with the results of the study was finalized in 2006 [2]. This article presents the main findings of FRA-S with regard to reactions to aircraft noise (annoyance) and more comprehensive outcomes concerning the environmental and health-related quality of life.

2. Working Model of Aircraft Noise Effects

To meet the objectives as defined by the RDF the study comprises, beside the assessment of aircraft noise exposure, instruments for the ascertainment of aircraft noise annoyance and its non-acoustical co-determinants, as well as instruments for the assessment of environmental (EQoL) and health-related quality of life (HQoL).
The underlying theoretical concept used as a working model in this study is based on noise-related stress models [3,4] referring to the transactional stress concept of Lazarus and colleagues [5]. These models describe the relationship between noise exposure, coping, and annoyance [4], and further mental as well as physical health outcomes [3]. That is, long-term noise annoyance can be understood as strain (reappraisal) resulting from an assessment process including the perceived disturbance and annoyance due to the sound (primary appraisal) and the perceived control over the noise situation [6], i.e., among others the perceived possibilities to cope with noise [3] (secondary appraisal). Chronic psychological strain, going along with physiological stress reactions to noise exposure [7] may increase the risk of health problems, in particular cardiovascular diseases [7] and/or disorders in mental health [8].
Whereas van Kamp [3] describes the role of appraisal of stressors (noise), activation, and coping with the noise for the prediction of health complaints, Stallen [4] points out the importance of the social aspect of noise (“you expose me”) on perceived control and, thus, on annoyance and further source-related attitudes. Stallen’s model provides a theoretical frame for the often found associations between non-acoustical, attitudinal factors (e.g., attitudes towards the source and towards authorities) and noise annoyance [911] indicating that these attitudes co-determine noise annoyance in a similar of even higher extend than the annoying sound itself [10,12]. Stallen identifies the noise policy or the way the sound production is managed as a second external stimulus of stress reactions to noise in addition to the sound itself. This social-psychological perspective of noise reactions is supported by findings about the impact of procedural (un-)fairness [13] and the regional political discourse [14] on aircraft noise annoyance.
In environmental psychological approaches the role of the perceived environmental context on human’s well-being and health (person-environment fit) has been emphasized for many years and stress models as described above are supplemented by the description of the restorative as well as aversive impact of the (physical) environment [15]. Following this research perspective, aircraft noise can be understood as an environmental stressor affecting the perceived environmental quality as well as stress-induced health outcomes.
In a similar way, the multi-dimensional concept of quality of life, including aspects of emotional, functional, mental, physical, and social well-being as perceived by the individual [16], offers a wide frame to investigate the possible health-related outcomes of (aircraft) noise. In several studies the association between transportation noise, environmental (EQoL) and health-related quality of life (HQoL) was investigated [1719]. In this study, in line with the suggestion of Lercher [20] to combine transactional and contextual stress models (including environmental context factors) and to conceptually integrate the notion of EQoL and HQoL in environmental health impact assessment, the noise-related stress concept and the deduced instruments and assessments include the following aspects:
  • ▪ Aircraft noise exposure as the environmental stressor of interest.
  • ▪ Psychological reactions to aircraft noise: disturbances due to aircraft noise, measures to cope with aircraft noise and—as a key psychological stress reaction—aircraft noise annoyance, defined as “a psychological concept which describes a relation between an acoustic situation and a person who is forced by noise to do things he/she does not want to do, who cognitively and emotionally evaluates this situation and feels partly helpless” [21, p. 525].
  • ▪ Contextual, personal and attitudinal (social) factors potentially co-determining noise reactions
  • ▪ Sleep quality potentially affected directly by aircraft noise exposure at night or indirectly by the reactions to aircraft noise at daytime.
  • ▪ Health-related variables as further outcomes of aircraft noise: health complaints, HQoL.
  • ▪ EQoL: Residential satisfaction in total and with regard to infrastructure, quietness, attractiveness.
Note, that, although there is evidence of impacts of noise on health (mediated by psychological noise reactions), the aircraft noise exposure-annoyance-health association can also be interpreted the other way around: that is, vulnerable people—those who are more sensitive to noise and/or those who suffer from pre-existing illness—may have reduced behavioural or cognitive resources to cope with the noise exposure and therefore react with stronger annoyance to the noise and, hence, perceive a reduced HQoL [22]. It was shown in other publications concerning the FRA-S data that the prevalence of chronic and acute health diseases ever diagnosed by a doctor as well as the frequency of medicine use were not associated with aircraft noise exposure in terms of higher prevalence of diseases and medical consumption with increasing aircraft sound levels [23,24]. However, several diagnosed diseases and the use of headache drugs, sleeping drugs, calmatives, and asthma drugs were found to be associated with noise sensitivity [24], an individual disposition that, while independent from noise exposure, increases the susceptibility of an individual to noise in general [25]. Whether noise sensitivity and the diagnosed health diseases and medical consumption, respectively, are both indicators of a general ‘vulnerability’ [26,27] or of a common underlying personal dimension such as neuroticism [28] or negative affectivity [29,30], or whether pre-existing illnesses modify the sensitivity to noise (and other environmental stressors) in general, and therewith causes elevated reactions to noise, is not yet clear. Nevertheless, it is plausible to assume that most of the assessed diagnosed diseases and medical consumption indicate objective health problems and therewith resident’s morbidity which (pre-)exists independently from the aircraft noise exposure. It is further hypothesized that multimorbidity—here defined as the occurrence of two or more health diseases –, cause, similar to noise sensitivity, a reduced ability to cope with aircraft noise and in line with this moderates the impact of aircraft noise on HQoL.
Similar to the health variables, residential satisfaction and noise reactions such as annoyance may be reciprocally associated with each other. Several studies found associations of residential satisfaction with noise annoyance [31,32]. It is somewhat unclear whether residential satisfaction is a secondary reaction to noise (mediated by annoyance) or a modifier of noise reactions prior to noise annoyance or both.
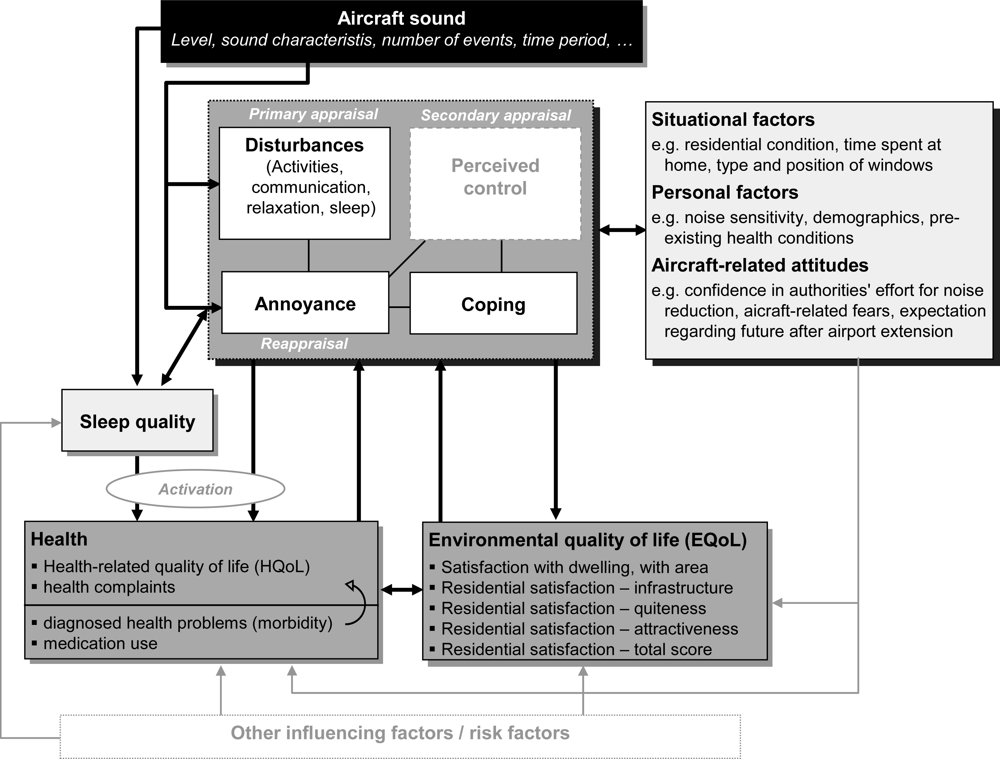
The different variables of reactions to noise, further outcomes with regard to HQoL and EQoL as well as potential personal, attitudinal and situational factors co-determining these variables are included in a summarized conceptual model of aircraft noise effects in Figure 1. It is not the aim of this paper to verify this model in detail. In FRA-S the working model was rather used as an orientation for the development of the questionnaires and the statistical analyses.

3. Methods

3.1. Sample and Procedure

The field study on the effects of aircraft noise on residents’ quality of life was carried out in 2005 in communities within a 40-kilometre distance from Frankfurt Airport. The subjects were sampled using a stratified random sampling method. That is, 66 residential areas were selected according to the aircraft noise exposure in 2003 with equivalent sound level contours for daytime LAeq,16h (6 am to 10 pm) as strata (see [2] for more details). Within the selected areas a total of 3,795 randomly selected residents was asked for an interview, of which 2,312 took part in the study (response rate 61%). The interviews were carried out from April to December 2005. The month in which a subject was contacted by the interviewer was selected at random. The participants were interviewed in face-to-face interviews (on average 45 minutes long) with regard to their residential situation, health-related quality of life, annoyance and disturbances due to noise, in particular to aircraft noise (study part I). The exposure to noise from aircraft, railway and road traffic noise was calculated for the address of each participant. In addition, a subsample of 200 persons assessed on four successive days their hourly aircraft noise annoyance, main activity, location, and—in case of indoor stay—the window position (study part II). This article presents the results of study part I.

3.2. Measures

3.2.1. Noise Exposure

For the address of each participant aircraft noise exposure was modelled on the base of the flight movements of the six busiest months of the year 2005 according to the German aircraft noise calculation procedure with aircraft categories as proposed by the German Federal Environment Agency in 1999 (AzB-99; [33]). Several acoustical parameters were calculated including the equivalent sound level (LAeq), maximum sound level (Lmax), and number of events (flight movements) above specified thresholds. For the analyses described in this article, aircraft noise load was indicated by the equivalent sound level for daytime (LAeq,16h; 6 am–10 pm), night-time (LAeq,8h; 10 pm–6 am), and for 24 hours of the day using the Day-Night level Ldn (including a penalty of 10 dB(A) for the night-time) as well as the Day-Evening-Night Level Lden (including a penalty of 5 dB(A) for the evening and 10 dB(A) penalty for the night-time). In addition, address-related road traffic and railway sound levels for daytime (LAeq,16h) and for the night-time (LAeq,8h) were assessed on the base of noise maps.

3.2.2. Questionnaire

According to the conceptual model of aircraft noise effects described above, the following topics were assessed in the questionnaires:
  • ▪ Residential situation and residential satisfaction
  • ▪ Reactions to environmental noise, in particular aircraft noise
  • ▪ Attitudes related to aircraft and Frankfurt Airport in general
  • ▪ Health-related variables: health-related quality of life, health complaints, diagnosed diseases, use of medicine, sleep quality
  • ▪ Personal factors: socio-demographic factors, individual noise sensitivity
The variables assessed in the questionnaire and analyzed within the context of this paper are listed in Appendix 1 of this article.

4. Results

Altogether, 2,312 residents were interviewed in the field study. In one case the address was not matched to the correct Gauss-Krueger coordinates, which were necessary to estimate address-related aircraft noise exposure. Therefore, the statistical analyses are based on data of 2,311 persons. The sample distributions of the study participants with regard to gender, age, socio-economical status, and aircraft noise exposure are shown in tables 2 and 3.

4.1. Aircraft Noise Annoyance

Results of correlation analyses between parameters of aircraft noise exposure and the aircraft noise annoyance experienced by the interviewed residents indicate that aircraft noise annoyance is associated with sound levels (equivalent, mean maximum sound level) as well as with the number of flyovers (N55, N70). However, the strongest exposure-annoyance relationship for aircraft noise was found between the equivalent sound level and aircraft noise annoyance (Table 4).
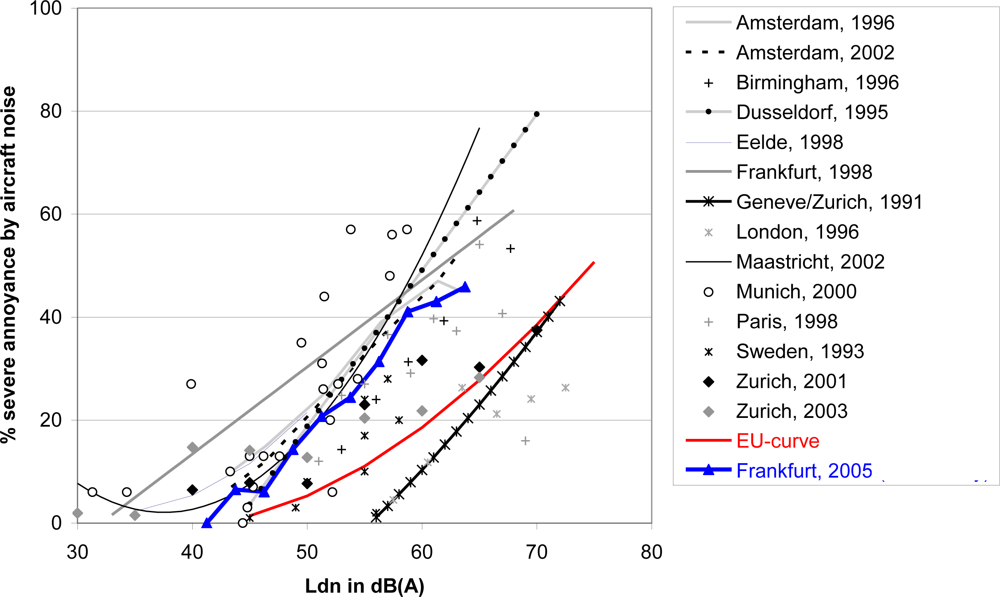
Exposure-response relationships were analyzed for the percentage of highly annoyed people. According to Schultz [41], a person has been defined as being highly annoyed (HA) when he or she chose the upper 27–28% of categories of the annoyance scale. This is the case for annoyance judgments of category 8 or higher on the 11-point scale. Results of this study with regard to the percentage of people highly annoyed by aircraft noise (%HA) was compared with findings of other international studies. Figure 2 shows the international comparison with regard to %HA related to the Day Night Level Ldn [42]. As can be seen, moderate sound levels already lead to severe noise annoyance due to aircraft noise. Compared to the generalized curve for %HA due to aircraft noise revealed by the meta-analysis of Miedema and Oudshoorn [43], also published in the EU position paper on noise annoyance with regard to Lden ([44] see red ‘EU-curve’), the blue ‘Frankfurt curve’ indicates higher annoyance at a given Day Night Level Ldn. Nevertheless, the ‘Frankfurt 2005-curve’ is largely in line with most of the findings of the other field studies presented in Figure 2 and with results of further recently published studies not presented in Figure 2 [46,47]. The underlying data of the ‘EU-curve’ date from 1965 to 1992. Some authors suggest that the recently published studies on aircraft noise annoyance not included in the meta-analyses of Miedema and colleagues indicate a trend of increasing aircraft noise annoyance at a given sound level over the last decades [42,47,48]. These authors consider the respective EU-curve on aircraft noise annoyance as outdated.
In order to identify further aircraft noise reactions and non-acoustical factors associated with aircraft noise annoyance correlation analyses have been done between aircraft noise exposure, annoyance, and further reactions to aircraft noise as well as attitudinal, situational, and personal factors. The coefficients are presented in Table 5.
Aircraft noise annoyance is relative highly correlated with all disturbance judgments, both with disturbances of daily activities indoors (day and night) and outdoors (Table 5). In accordance with this result, with increasing sound levels and aircraft noise annoyance residents more often take measures to cope with the aircraft noise and to avoid disturbances due to aircraft noise. The results in Table 5 further indicate that the source-related attitudes and expectations are associated with aircraft noise annoyance. This is in line with results of many field studies on community reactions to noise [9,11]. These attitudes are also in a less degree but still significant (except positive expectations) correlated with the aircraft sound level. The correlation with aircraft noise exposure decreases after adjusting for annoyance. This indicates that the attitudes can be understood as (secondary) reactions to aircraft noise partly mediated by annoyance. This is confirmed by the finding that each partial correlation between aircraft sound level and annoyance controlled by each attitudinal factor is marginal lower in comparison to the zero-order correlation between aircraft sound level and annoyance. The interpretation of the source-related attitudes as secondary to aircraft noise annoyance is also supported by results of structural equation modeling done by Kroesen and colleagues, who found that none of the paths from the psychological factors to aircraft noise annoyance were significant, whereas for a part of the attitudinal factors (concern about negative health effects of noise, belief that noise can be prevented) the reverse path from the annoyance to the attitudes was statistically significant [49].
Among the personal factors the individual noise sensitivity is correlated with aircraft noise annoyance (r = 0.36) but as expected not with the aircraft sound level. In comparison to this socio-demographical factors play a minor role for aircraft noise annoyance as results of two-factorial ANOVAs with aircraft noise annoyance [11-point scale] as the dependent variable and 5-dB-Lden-class as well as each of the selected grouped socio-demographic variables as independent factors suggest. This is in line with previous research [9]. However, some effects of these variables on annoyance were found, although with little effect size: Age was found to be non-linear related to aircraft noise annoyance, that is annoyance due to aircraft noise was higher in the group of middle-aged adults (40–60 years) in comparison to those younger or older than this group (F[2;2229] = 11.14, p < 0.001, ŋp2 = 0.01). This non-linear effect of age on noise annoyance is also reported by Miedema and Vos [11] and van Gerven et al. [50].
Interviewed residents with a lower socio-economic status reported less annoyance due to aircraft noise than residents with middle and higher socio-economic status (F[1;2252] = 14.80, p < 0.001, ŋp2 = 0.01). In accordance with this house owners were found to be more annoyed by aircraft noise than tenants (F[1;2252] = 60.77, p < 0.001, ŋp2 = 0.03). Probably those residents who could afford ownership fear the loss of house values and in line with this are more annoyed by aircraft noise in comparison to those without properties. In fact, the fear of diminished house prices is correlated with aircraft noise annoyance (r = 0.54, p < 0.001) and with aircraft sound level Lden (r = 0.17, p < 0.001). As expected the correlation coefficients are much higher for house owners (house price–annoyance: r = 62, p < 0.001; house price–Lden: r = 0.32, p < 0.001) than for tenants (house price–annoyance r = 0.37, p < 0.001; house price–Lden r = −0.09, p = 0.006).

4.2. Environmental Quality of Life

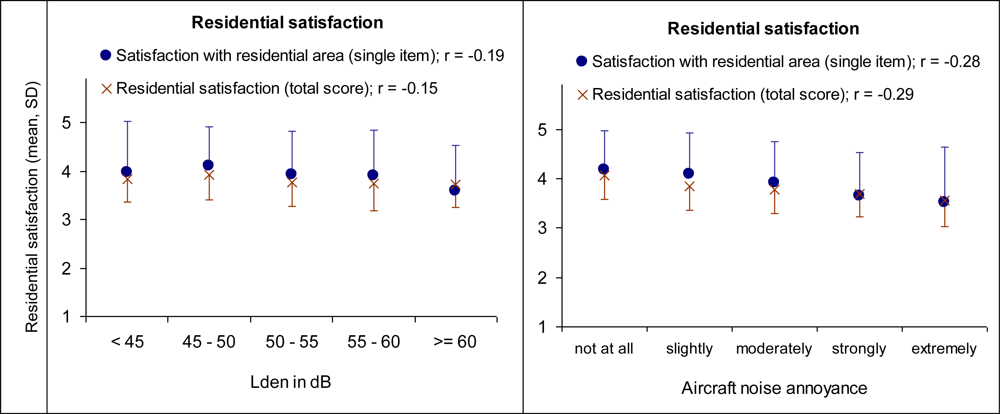
Table 5 shows that the residential satisfaction, in particular the satisfaction with the residential area outside the dwelling (single item and total residential satisfaction score including mainly area-related attributes), is correlated with annoyance and—weakly but significantly—with aircraft noise exposure. In particular satisfaction with house insulation and quietness in the residential area are both correlated with aircraft noise exposure and annoyance. In the partial correlation analyses between aircraft noise exposure and the satisfaction scores controlled by annoyance, the exposure-satisfaction association diminishes (except for satisfaction with house insulation and quietness) in comparison to the respective zero-order correlation. However, the annoyance—exposure correlation remains almost the same in the partial correlation analyses controlled by residential satisfaction. The correlation between satisfaction with quietness and aircraft noise exposure decreases somewhat after control for annoyance, but remains on a relative moderate level. This indicates that residential satisfaction, in particular the satisfaction with house insulation and quietness in the local area, can be interpreted as a secondary reaction to aircraft noise exposure partly mediated by annoyance. Note, that the aircraft noise exposure-annoyance correlation also decreases after control for the satisfaction with house insulation and quietness, suggesting that the annoyance may in turn partly be moderated by the satisfaction with house insulation and quietness. All in all, for residents living in the vicinity of Frankfurt Airport the results of the correlational analyses indicate that being stressed by aircraft noise lessen the satisfaction with the residential area and, thus, the perceived local environmental quality of life in general (see also Figure 3).

4.3 Health Related Quality Of Life (SF12/36), Sleep Quality, and Health Complaints

The following tables show descriptive statistics for the health complaints and SF12/36 scores as indicators of HQoL and for sleep quality (PSQI score) as indicator of nocturnal HQoL. The statistics are grouped by aircraft sound level for daytime and night-time (Table 6) and by aircraft noise annoyance and noise sensitivity (Table 7). Although on a descriptive level subjects of different sound level groups differ with regard to single health variables, no systematic increase with increasing noise exposure could be observed. Actually, HQoL with regard to vitality and mental health decreases with increasing aircraft sound level at daytime from <45 dB(A) up to the sound level class 50–55 dB(A), but then increases again for residents exposed to higher sound level classes at daytime. Similar, residents exposed to the lowest and highest aircraft sound level classes for daytime and night-time reported less health complaints with regard to the stomach, the limbs and in total than residents with aircraft noise exposure in between these sound level classes. The sleep quality is worst for residents exposed to 50 to 60 dB(A) at daytime and 50 to 55 dB(A) at night-time than for residents with less or higher aircraft noise exposure.
Accordingly, with increasing aircraft sound levels no increase in the risk (odds ratio) of HQoL below average, bad sleep quality and in the intensity of health complaints above average could be observed in logistic regression analyses with the health-related variables as criteria and aircraft noise exposure at daytime (for sleep quality: at night-time), annoyance, and noise sensitivity as predictors (Table 8). Similar results of the regression analyses were observed when the predictor LAeq for daytime was exchanged with LAeq for night-time. All regression analyses were adjusted for age, gender, socio-economical status, home ownership, residential satisfaction, usual window position in the sleeping room at night, and number of hours away from home. For analysing the impact of aircraft noise on physical health, e.g., cardiovascular risk effects in noisy areas it is obvious and a gold standard also to adjust regression models as described above for variables like body mass index, smoking and alcohol usage. But this study aimed at the effects of aircraft noise on annoyance, subjective health, environmental quality, and HQoL. For this purpose we decided in the study protocol in the beginning of the study not to include all these variables, due to budget limit and time limit of the duration of the interviews.
Table 8 shows that the health-related variables are proportionally related to psychological reactions to noise, indicated by annoyance due to aircraft noise. That is, the risk of health complaints (GSCL-24 scores), bad sleep quality (PSQI), and poor SF12/36 HQoL scores are related to annoyance indicating lower health-related quality of life with increasing aircraft noise annoyance. However, for the SF12 mental health score in the model including LAeq,16h as predictor this association failed the level of significance.
In addition, the risk of reduced HQoL is associated with an increase in individual sensitivity to noise with regard to all assessed HQoL variables. The results hold true for logistic regression analyses with sound level and annoyance as continuous as well as categorized predictors with the lowest class of sound level and annoyance as reference. The findings are similar for regression models including both sound level and annoyance as predictors and for separate models with either sound level or annoyance as predictor. Logistic regression models calculated separately for males and females reveal similar results.
Whether the “V”-shaped differences in HQoL across the aircraft sound level classes (see Table 6) persist in different subgroups distinguished with regard to socio-demographic, attitudinal (expectation concerning the future QoL after airport expansion), situational (usual window position), and personal (noise sensitivity, multi-morbidity) factors was tested in two types of GLM (with a significance level of p < 0.01). The first type of GLM includes aircraft sound level, age, gender, and socio-economical status as independent variables and selected HQoL variables (SF12/36 scores, total health complaints, sleep quality) as dependent variables. The second type includes, beside aircraft sound level, the attitudinal, situational, and personal factors as independent variables.
Due to limited space in this paper not all results of the GLM are presented here (see [2] for more details). To summarize: no interaction occurred that would indicate a significant moderating effect of the socio-demographic variables on the impact of aircraft-noise exposure on health outcomes. Significant main effects were observed with regard to sound level (see Table 6), age (older residents reported lower HQoL than younger), gender (female residents reported lower HQoL than males), and socio-economical status (residents with lower status reported lower HQoL than residents with higher status).
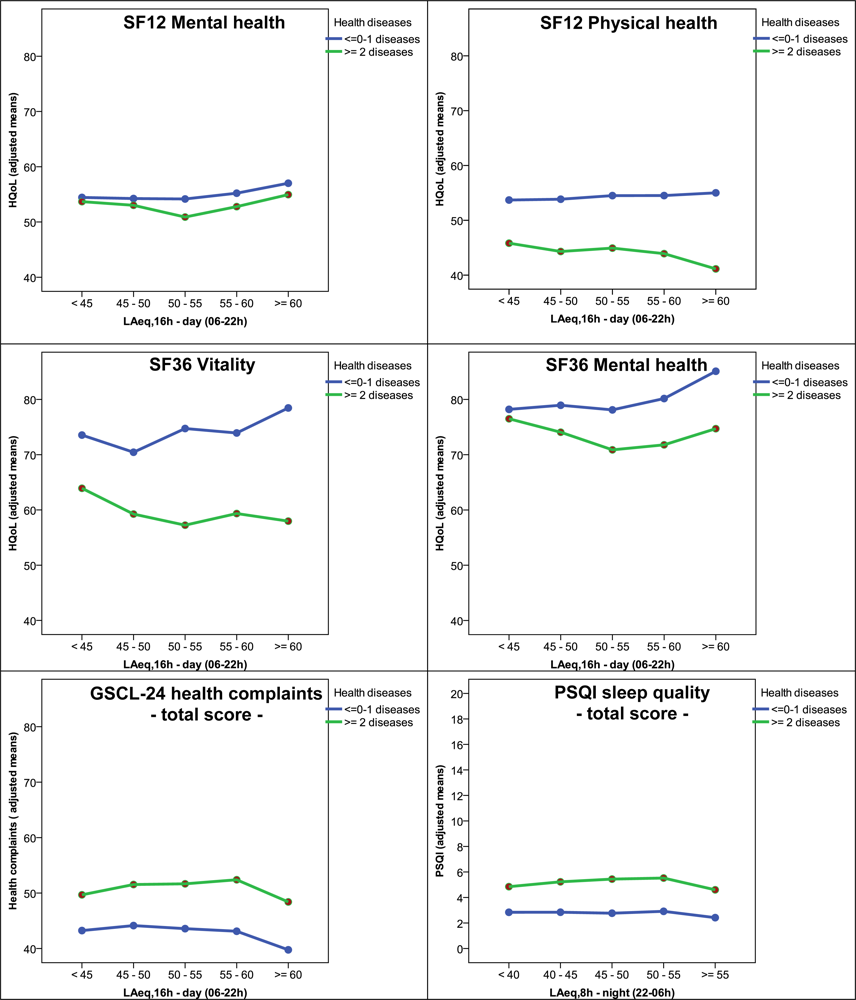
Results of the second type of GLM indicate higher HQoL for residents with up to one diagnosed health disease in comparison to those with two or more diseases, lower HQoL for those reporting negative expectations with regard to future (residential) life and for those judged themselves as being higher sensitive to noise in general compared to the lower noise-sensitive residents. With regard to potential impacts of aircraft noise on HQoL in subgroups of the residents the interactions between the described non-acoustical variables and aircraft noise exposure are of interest. Statistically significant interactions with aircraft sound levels were observed for the usual window position at daytime and for noise sensitivity. Yet, these interactions reflect marginal effects and cannot be interpreted in terms of a systematic moderating effect on the aircraft noise-HQoL relationship. This is somewhat different for the interaction morbidity x LAeq (for night-time concerning the criterion ‘PSQI sleep quality’ and for daytime with regard to the other HQoL criteria); see Table 9 and Figure 4. As can be seen from Figure 4, in the subgroups of residents reporting at least two health diseases (ever) diagnosed by a doctor, HQoL decreases somewhat with increasing aircraft noise exposure. This is particular true for residents exposed to lower to middle-ranged aircraft sound levels up to about 55 dB LAeq with regard to the SF12/36 scores (except SF12 mental health). In contrast to this, the HQoL of residents with less than two diseases remains constant or increases somewhat with increasing aircraft sound level. This interaction is not observed with regard to the reported health complaints and sleep quality. However, the described interaction confirms the notion of pre-existing health problems moderating the impact of (aircraft) noise exposure on health-related quality of life as described above in section 2.
One reason for the finding that above 50–55 dB(A) there is no consistent decrease in HQoL with increasing aircraft sound level could be a kind of self-selection, i.e., people with severe health problems have moved away or decided not to live in high aircraft noise-exposed areas in the vicinity of Frankfurt Airport. But this post hoc explanation cannot be proved with the present data, because no information about migration is available in this study. However, length of residence was assessed in the questionnaire. Nonetheless, adding this variable as a covariate in the GLMs described above does not reveal more information or lead to alternative conclusions.
In a pilot study, Cischinsky et al. [51] investigated the in- and out-migration in the region around Frankfurt Airport (Rhine-Main region). Although aircraft noise was not the most important reason for the migration it became more important on subsequent motivation ranks. Nevertheless, because high aircraft noise-exposed areas in the vicinity of Frankfurt Airport have also other infrastructural disadvantages, a clear conclusion about the causal link between aircraft noise and migration motivation could not be drawn in the study of Cischinsky and colleagues.
The result of an association between (severe) aircraft noise annoyance and HQoL is confirmed by results from other studies [52,53]. Results of the adjusted regression analyses suggest furthermore an association independently from the annoyance between noise sensitivity and most of the investigated health variables. This is in line with other studies that report relations between noise sensitivity, annoyance, and health complaints [27,54,55]. Yet, the causal path of the association between noise annoyance, noise sensitivity, and health effects is not clear. There are mainly three different explanatory approaches and interpretations discussed with regard to this issue: (1) Noise sensitivity is an indicator of an individual’s vulnerability, which is closely related to (reported) health problems and which modifies individual noise reaction, suggesting that the noise exposure-annoyance-health relationship itself may be spurious [26]; (2) The noise sensitivity-annoyance-health relationship responsible for the dilution of a direct association between noise exposure and (reported) health incorporates a recall bias, which is absent when noise sensitivity is assessed before the occurrence or diagnosis of health disorders [56]; (3) The pre-existing health status and noise sensitivity are two interrelated ‘vulnerability’ factors which sap one’s energy to cope with noise (and other stressors), and, thus, moderate the impact of noise exposure on noise reactions (annoyance) as well as on HQoL in general [22,27,57].
It seems that ‘recall bias’ is not the whole story. This interpretation of the findings neglects the relationship between noise sensitivity and physiological functions [58,59]. And, a recall bias would be more plausible in terms of reported health complaints (misleadingly?) attributed to noise but not in terms of a positive noise sensitivity-health association diluting a direct noise-health association. The third explanation seems to be the most plausible one. It fits with results of previous noise-related studies about the effect of health status on noise reactions [22,27,60]. It is also in line with general stress models recognizing pre-existing chronic health problems as stress-enhancing [61] and partly with results of this study, where it was shown that among the multimorbid residents reported HQoL decreased somewhat with increasing aircraft sound levels at least in low to middle-ranged sound level classes.

5. Conclusions

In 2005 a field study about residents’ responses to aircraft noise was carried out in 66 residential areas in the vicinity of the Frankfurt International Airport. Residents (2,312) were interviewed with regard to their reactions to aircraft noise and their environmental as well as health-related quality of life. For the address of each participant sound levels for aircraft, road traffic, and railway noise were assessed. The study took place between the announcement (in 1998) and the approval decision (at the end of 2007) of the airport expansion (construction of a 4th runway).
Among several indicators of aircraft noise exposure the equivalent sound level showed the highest correlation with aircraft noise annoyance. The percentage of people (highly) annoyed by aircraft noise was found to be higher than predicted from general exposure-response curves. However, the degree of aircraft noise annoyance in communities around Frankfurt Airport is, all in all, in line with results from other recently published studies. Beside the sound level, non-acoustical factors, in particular the expectations with regard to future residential life after airport expansion and the confidence in authorities’ effort for aircraft noise reduction, were associated with the reactions to noise and with HQoL. The results of this study indicate that aircraft noise exposure not only has an impact on noise-specific (stress) reactions but also—although with much lower effect size—on perceived EQoL in general.
The HQoL variables were found to be associated with aircraft noise annoyance as well as with the individual noise sensitivity. The more residents were annoyed by aircraft noise the poorer was their HQoL. This is in particular true for higher noise-sensitive residents than for lower sensitive ones. In addition, within the group of multimorbid residents an association between aircraft sound level and HQoL was observed. However, again, this effect was rather small.
All in all, it could be shown that the impact of aircraft noise on residents living in the vicinity of an airport effects noise-specific stress reactions (annoyance, disturbances) as well as QoL in general. Yet, the strengths of the impact of aircraft noise exposure on QoL decreases coming from noise-specific reactions (e.g., annoyance) to environmental-specific reactions (EQoL) and finally to health-related outcomes (HQoL). Furthermore, it became obvious that the noise-HQoL relationship is not a simple, uni-directional one. It is likely that aircraft noise affects the health of people in particular when they face limited resources to cope with the noise, e.g., due to pre-existing illness and/or elevated sensibility to noise in general. Limited coping ability, again, enhances the strain and enables the development of further stress-related health problems and limitations in HQoL. Admittedly, this assumed recursive process cannot be tested in cross-sectional studies, nor in experimental studies on acute noise reactions. Longitudinal studies would be recommendable to get more insight in the causal paths underlying the noise-health relationship.

Acknowledgments

The Frankfurt Noise Effect Study was carried out on behalf of IFOK GmbH, Bensheim, Germany, in the framework of the Regional Dialogue Forum Frankfurt Airport (RDF). The additional analyses of the data with regard to health impacts of aircraft noise described in this contribution was commissioned and supported by the Public Health Department, Frankfurt am Main, Germany.

References

  1. Bullinger, M; von Mackensen, S; Eikmann, T; Herr, C; Seitz, H; Höger, R; Machunsky, M; Schmaus, I; Schreckenberg, D; Guski, R. Machbarkeitsstudie ‘Fluglärm und Lebensqualität’. Methodenstudie im Auftrag des Regionalen Dialogforums Flughafen Frankfurt. (Feasibility Study ‘Aircraft Noise and Quality Of Life’); ZEUS GmbH: Bochum, Germany, 2003; Available online: http://www.verkehrslaermwirkung.de/RDF_MB-Studie_03_030203.pdf (accessed on 1 May 2010).
  2. Schreckenberg, D; Meis, M. Belästigung durch Fluglärm im Umfeld des Frankfurter Flughafens (Effects of aircraft noise on noise annoyance and quality of life around Frankfurt Airport); AG Fluglärmwirkung: Bochum/Oldenburg, Germany, 2006; Available online: http://www.verkehrslaermwir-kung.de/RDF0911.pdf (accessed on 1 May 2010).
  3. van Kamp, I. Coping with Noise and its Health Consequences; Dissertation; Styx & PP Publications: Groningen, The Netherlands, 1990. [Google Scholar]
  4. Stallen, PJM. A theoretical framework for environmental noise annoyance. Noise Health 1999, 3, 69–79. [Google Scholar]
  5. Lazarus, RS; Folkman, S. Stress, Appraisal, and Coping; Springer: New York, NY, USA, 1984. [Google Scholar]
  6. Hatfied, J; Job, RFS; Hede, AJ; Carter, NL; Peploe, P; Taylor, R; Morrel, S. Human response to environmental noise: The role of perceived control. Int. J. Behav. Med 2002, 9, 341–359. [Google Scholar]
  7. Babisch, W. The noise/stress concept, risk assessment and research needs. Noise Health 2002, 4, 1–11. [Google Scholar]
  8. van Kamp, I; Davies, H. Environmental noise and mental health: Five year review and future directions. Noise as a public health problem Proceedings of 9th Congress of the International Commission on the Biological Effects of Noise (ICBEN), Mashantucket, CT, USA, 21–25 July 2008, Griefahn, B, Ed.; IfADo; Dortmund, Germany, 2008; pp. 295–301. [Google Scholar]
  9. Fields, JM. Effect of personal and situational variables on noise annoyance in residential areas. J. Acoust. Soc. Amer 1993, 93, 2753–2763. [Google Scholar]
  10. Guski, R. Personal and social variables as co-determinants of noise annoyance. Noise Health 1999, 3, 45–56. [Google Scholar]
  11. Miedema, HME; Vos, H. Demographic and attitudinal factors that modify annoyance from transportation noise. J. Acoust. Soc. Amer 1999, 105, 3336–3344. [Google Scholar]
  12. Job, RFS. Community response to noise: A review of factors influencing the relationship between noise exposure and reaction. J. Acoust. Soc. Amer 1988, 83, 991–1001. [Google Scholar]
  13. Maris, E. The Social Side of Noise Annoyance, Doctorial thesis; University Leiden: Leiden, The Netherlands. 2008.
  14. Bröer, C. Beleid Vormt Overlast. Hoe beleidsdiscoursen de beleving van geluid bepalen (Policy annoyance. How Policy Discourses Shape the Experience of Aircraft Sound); Aksant. Published thesis; Universiteit van Amsterdam: Amsterdam, The Netherlands, 2006. [Google Scholar]
  15. Bell, PA; Greene, TC; Fisher, JD; Baum, A. Environmental Psychology, 5th ed; Harcourt: Orlando, FL, USA, 2001. [Google Scholar]
  16. Bullinger, M. Quality of life—definition, conzeptualizsation and implications—A methodologists view. Theor. Surg 1991, 6, 143–149. [Google Scholar]
  17. Bullinger, M; Hygge, S; Evans, GW; Meis, M; von Mackensen, S. The psychological cost of aircraft noise for children. Zentralbl. Hyg. Umweltmed 1999, 202, 127–138. [Google Scholar]
  18. Franssen, EAM; Staatsen, BAM; Lebret, E. Assessing health consequences in an environmental impact assessment. The case of Amsterdam Airport Schiphol. Environ. Impact Assess. Rev 2002, 22, 633–653. [Google Scholar]
  19. Lercher, P. Soundscape research, quality of life and health: an integrated environmental health viewpoint. In Proceedings of Inter-Noise 2007 [CD-ROM]; Turkish Acoustical Society: Istanbul, Turkey, 2007; Paper No. 033. [Google Scholar]
  20. Lercher, P. Which health outcomes should be measured in health-related environmental quality of life studies. Landscape Urban Plan 2003, 65, 63–72. [Google Scholar]
  21. Guski, R; Felscher-Suhr, U; Schuemer, R. The concept of noise annoyance: How international experts see it. J. Sound Vib 1999, 223, 513–527. [Google Scholar]
  22. Tarnopolsky, A; Barker, SM; Wiggins, RD; McLean, EK. The effect of aircraft noise on the mental health of a community sample: a pilot study. Psychol. Med 1978, 8, 219–233. [Google Scholar]
  23. Schreckenberg, D; Eikmann, T; Herr, CEW; zur Nieden, A; Heudorf, U. Fluglärm und Gesundheit in der Rhein-Main Region 2005 (Aircraft Noise and Health in the Rhine-Main Region); Amt für Gesundheit (Public Health Department): Frankfurt, Germany, 2009. [Google Scholar]
  24. Schreckenberg, D; Heudorf, U; Eikmann, T; Herr, CEW; zur Nieden, A; Meis, M. Aircraft noise and health of residents living in the vicinity of Frankfurt Airport. In Proceedings of Euronoise 2009 [CD-ROM]; Institute of Acoustics: Edinburgh, UK, Paper No. 445.
  25. Job, RSF. Noise sensitivity as a factor influencing human reaction to noise. Noise Health 1999, 3, 57–68. [Google Scholar]
  26. Fyhri, A; Klaeboe, R. Road traffic noise, sensitivity, annoyance and self-reported health—A structural equation model exercise. Environ. Int 2009, 35, 91–97. [Google Scholar]
  27. Stansfeld, SA. Noise, noise sensitivity and psychiatric disorder: epidemiological and psychophysiological studies. Psychol. Med. Supplement 1992, 22, 1–44. [Google Scholar]
  28. Dornic, S; Ekehammar, B. Extraversion, neuroticism, and noise sensitivity. Pers. Indiv. Differ 1990, 11, 989–992. [Google Scholar]
  29. Smith, A; Nutt, D; Wilson, S; Rich, N; Hayward, S; Hetherley, S. Noise and Insomnia: A Study of Community Noise Exposure, Sleep Disturbance, Noise Sensitivity and Subjective Reports of Health; Report to the UK Department of Health and Department of Environment,; Transport and the Regions: Cardiff, UK, 2002. [Google Scholar]
  30. Watson, D; Clark, LA. Negative affectivity: The disposition to experience aversive emotional states. Pol. Psychol. Bull 1984, 96, 465–490. [Google Scholar]
  31. Kroesen, M; Molin, EJE; Miedema, HME; Vos, H; Janssen, SA; van Wee, B. Estimation of the effects of aircraft noise on residential satisfaction. Transp. Res. Pt. D-Transp. Enviro 2010, 15, 144–153. [Google Scholar]
  32. Wirth, K. Lärmstudie 2000 Die Belästigungssituation im Umfeld des Flughafens Zürich (Noise Study 2000 Annoyance in the Region of Zurich Airport); Shaker: Aachen, Germany, 2004. [Google Scholar]
  33. Entwurf der neuen zivilen Flugzeugklassen (“AzB-99”) (Concept of New Categories of Civil Aircrafts, AzB-99); Report no. I3.3-60112-5; Umweltbundesamt (Federal Environmental Agency): Berlin, Germany, 1999.
  34. Fields, JM; DeJong, RG; Gjestland, T; Flindell, IH; Job, RFS; Kurra, S; Lercher, P; Vallet, M; Guski, R; Felscher-Suhr, U; Schuemer, R. Standardized general-purpose noise reaction questions for community noise surveys: Research and a recommendation. J. Sound Vib 2001, 242, 641–679. [Google Scholar]
  35. Bullinger, M; Kirchberger, I. SF-36 Fragebogen zum Gesundheitszustand—Manual (SF-36 Questionnaire for Assessing Health Status—Manual); Hogrefe: Goettingen, Germany, 1998. [Google Scholar]
  36. Braehler, E; Hinz, A; Scheer, JW. Der Giessener Beschwerdebogen (GBB-24)—Manual (The Giessen Subjective Complaints List—Manual), 3rd ed; Hogrefe: Goettingen, Germany, 2008. [Google Scholar]
  37. Bellach, BM; Knopf, H; Thefeld, W. Der Bundes-Gesundheitssurvey 1997/98 (The German National Health Survey 1997/1998). Das Gesundheitswesen 1998, 60, 59–68. [Google Scholar]
  38. Heimann, D; de Franceschi, M; Emeis, S; Lercher, P; Seibert, P. Air Pollution, Traffic Noise and Related Health Effects in the Alpine Space; Università degli Studi di Trentok: Trento, Italy, 2007; Available online: http://www.alpnap.org/alpnap.org_ge.html (accessed on 1 May 2010).
  39. Buysse, DJ; Reynolds, CF; Monk, TH; Berman, SR; Kupfer, DJ. The Pittsburgh Sleep Quality Index: A new instrument for psychiatric practice and research. Psychiat. Res 1989, 28, 93–213. [Google Scholar]
  40. Winkler, J. Die Messung des sozialen Status mit Hilfe eines Index in den Gesundheitssurveys der DHP (The measurement of the socio-economical status by means of an index in the Public Health Surveys of the DHP). In Messung soziodemographischer Merkmale in der Epidemiologie (Measurement of Socio-Demographic Variables in the Epidemiology); RKI-Schriften; MMV Medizin Verlag: Munich, Germany, 1998; Volume 1/1998, pp. 69–74. [Google Scholar]
  41. Schultz, TJ. Synthesis of social surveys on noise annoyance. J. Acoust. Soc. Amer 1978, 64, 377–405. [Google Scholar]
  42. Van Kempen, EEMM; Van Kamp, I. Annoyance from Air Traffic Noise. Possible Trends in Exposure-Response Relationships; Report 01/2005 MGO EvK, Reference 00265/2005; RIVM: Bilthoven, The Netherlands, 2005. [Google Scholar]
  43. Miedema, HME; Oudshoorn, CG. Annoyance from transportation noise: Relationships with exposure Metrics DNL and DENL and their confidence intervals. Environ. Health Perspect 2001, 109, 409–416. [Google Scholar]
  44. EC/WG2—Dose/Effect. Position Paper on Dose Response Relationships between Transportation Noise and Annoyance; Office for Official Publications of the European Communities: Luxembourg, 2002; Available online: http://www.eukn.org/binaries/eukn/dg-environment/policy/2005/1710-transportation-noise-and-annoyance.pdf (accessed on 1 May 2010).
  45. Brink, M; Wirth, K; Schierz, C. Lärmstudie 2000: Dosiswirkungskurven zur Belästigung durch Fluglärm im Umfeld des Flughafens Zürich (elektronische Daten) (Noise Study 2000: Dose-Response Curves on Annoyance Due To Aircraft Noise in the Vicinity of Zurich Airport, Electronic Data); ETH Zurich, Department of Public and Organizational Health: Zurich, Switzerland; Available online: http://www.laerm2000.ethz.ch/files/LS2000_DW-Kurven.zip (accessed on 1 May 2010).
  46. Le Masurier, P; Bates, J; Taylor, J; Flindell, I; Humpheson, D; Pownall, C; Woolley, A. Attitudes to Noise from Aviation Sources in England (ANASE): Final Report for Department for Transport; Her Majesty’s Stationery Office: Norwich, UK; Available online: http://webarchive.nationalarchives.gov.uk/+/http://www.dft.gov.uk/pgr/aviation/environmentalissues/Anase/finalreport.pdf (accessed on 1 May 2010).
  47. Babisch, W; Houthuijs, D; Pershagen, G; Cadum, E; Katsouyanni, K; Velonakis, M; Dudley, ML; Marohn, HD; Swart, W; Breugelmans, O; Bluhm, G; Selander, J; Vigna-Taglianti, F; Pisani, S; Haralabidis, A; Dimakopoulou, K; Zachos, I; Järup, L. Annoyance due to aircraft noise has increased over the years—results of the HYENA study. Environ. Int 2009, 35, 1169–1176. [Google Scholar]
  48. Guski, R. How to forecast community annoyance in planning noisy facilities? Noise Health 2004, 6, 59–64. [Google Scholar]
  49. Kroesen, M; Molin, EJE; van Wee, B. Determining the direction of causality between psychological factors and aircraft noise annoyance. Noise Health 2010, 12, 17–25. [Google Scholar]
  50. van Gerven, PWM; Vos, H; van Boxtel, MPJ; Janssen, SA; Miedema, HME. Annoyance from environmental noise across the lifespan. J. Acoust. Soc. Amer 2009, 126, 187–194. [Google Scholar]
  51. Cischinsky, H; Gräff, HJ; Häußermann, H. Externe wissenschaftliche Begleitung der Pilotphase eines Sozialmonitorings in den Gemeinden im Umfeld des Flughafens Frankfurt/Main. (External Scientific Evaluation of the Pilot Phase of a Social Monitoring in Communities in the Vicinity of Frankfurt Airport); Expertise on behalf of Regionales Dialogforum Flughafen Frankfurt; Institut Wohnen und Umwelt, Infrastruktur & Umwelt: Darmstadt; Humbold Universität: Berlin, Germany, 2008. [Google Scholar]
  52. van Kamp, I; Houthuijs, D; van Wiechen, C; Breugelmans, O. Environmental noise and mental health: evidence from the Schiphol monitoring program. In Proceedings of Inter-Noise 2007 [CD-ROM]; Turkish Acoustical Society: Istanbul, Turkey, 2007; Paper No. 132. [Google Scholar]
  53. Babisch, W; Houthuijs, D; Pershagen, G; Katsouyanni, K; Velonakis, M; Cadum, E; Dudley, ML; Bluhm, G; Breugelmans, O; Charalampidis, A; Dimakopoulou, K; Savigny, P; Seiffert, I; Selander, J; Sourtzi, P; Swart, W; Vigna-Taglianti, F; Järup, L. Association between noise annoyance and high blood pressure. Preliminary results from the HYENA study. In Proceedings of Inter-Noise 2007 [CD-ROM]; Turkish Acoustical Society: Istanbul, Turkey, 2007; Paper No. 133. [Google Scholar]
  54. Nivison, E; Endresen, IM. An analysis of relationships among environmental noise, annoyance and sensitivity to noise, and the consequences for health and sleep. Int. J. Behavioral Medicine 1993, 16, 257–275. [Google Scholar]
  55. Iwato, O. The relationship of noise sensitivity to health and personality. Jpn. Psychol. Res 1984, 26, 75–81. [Google Scholar]
  56. Babisch, W. Noise sensitivity in cardiovascular noise studies. In Proceedings of Inter-Noise 2010 [CD-ROM]; Sociedade Portuguesa de Acústica: Lisbon, Portugal, 2010; Paper No. 569. [Google Scholar]
  57. Job, RFS. The influence of subjective reactions to noise on health effects of the noise. Environ. Int 1996, 22, 93–104. [Google Scholar]
  58. Stansfeld, SA; Clark, CR; Turpin, G; Jenkins, LM; Tarnopolsky, A. Sensitivity to noise in a community sample: II. Measurement of psychophysiological indices. Psychol. Med 1985, 15, 255–263. [Google Scholar]
  59. Heinonen-Guzejev, M; Vuorinen, HS; H Mussalo-Rauhamaa, H; Heikkilä, K; Koskenvuo, M; Kaprio, J. Somatic and psychological characteristics of noise-sensitive adults in Finland. Arch. Environ. Health 2004, 59, 410–417. [Google Scholar]
  60. Babisch, W; Ising, H; Gallacher, JEJ. Health status as a potential effect modifier of the relation between noise annoyance and incidence of ischaemic heart disease. Occup. Environ. Med 2003, 60, 739–745. [Google Scholar]
  61. Sarafino, EP. Health Psychology: Biopsychosocial Interactions, 6th ed; Wiley & Sons: Hoboken, NJ, USA, 2008. [Google Scholar]

Appendix

Appendix 1. Variables assessed in the questionnaire.
Variable categoryVariableNumber of itemsResponse scaleCronbach’s αRef.
AnnoyanceAircraft noise annoyance in the last 12 months before the interview2intensity scales: verbal 5-pt., numerical 11-pt.34
Disturbances of activities due to aircraft noise…of communication indoor35-pt. intensity scale; mean score0.92
…of communication outdoor1
…of relaxation/concentration indoor20.93
…relaxation outdoor1
…nocturnal sleep30.92
Coping with aircraft noiseMeasures done within an aircraft noise situation (coping)165-pt. frequency scale; mean score0.94
Air traffic related attitudesFears concerning air traffic45-pt. intensity scale; mean score0.86
Confidence in authorities’ effort for aircraft noise reduction70.86
Expectation concerning airport expansion
Negative expectation65-pt. intensity scale; mean score0.91
Positive expectation30.71
Economic expectation20.76
Residential satisfactionSatisfaction with dwelling15-pt. intensity scale
Satisfaction with residential area15-pt. intensity scale
Satisfaction with infrastructure (6 items), attractiveness of residential area (3 items), quietness (3 items)125-pt. intensity scale; subscores and total score: mean scores0.8232
Health-related quality of life (HQoL)Vitality (SF-36)4SF subscales: Transformed scale with values between 0 and 100. Higher values indicate higher HQoL35
Mental health (SF-36)535
Mental health (SF-12)635
Physical health (SF-12)635
Health complaints (GSCL 24): exhaustion (6 items); stomach (6), limbs (6); cardiac (6), total (24)24Subscores transformed to scale from 0 to 100. Reference sample [36]: mean = 50, SD = 1036
Health diseases (morbidity)Self-reported diagnosed diseases; Multimorbidity: 0–1 diseases vs. 2 or more diseases18ever had; in the last 12 months; dichotomized37;38
SleepSleep quality (PSQI total index)18sum score: 0 to 21; values > 5 = bad quality39
Personal factorsNoise sensitivity (single item)15-pt. intensity scale
Age
Genderfemale / male
House ownershiptenant / owner
Socio-economical status ‘Scheuch-Winkler index’3includes income, education, occupational status40
Figure 1. Conceptual working model of aircraft noise effects.
Ijerph 07 03382f1
Figure 2. Dose-response data for severe aircraft noise annoyance from several surveys using a cut-off point of 70–75% of response scale for definition of high annoyance (HA).Source: van Kempen, und van Kamp ([42], p. 25, Figure 3b)—modified and supplemented; EU-curve: generalized dose-response curve for aircraft noise annoyance [43,44]. Source of the data of Zurich 2001/2003: Brink et al. [45]. Blue line and dots: data of the Frankfurt Noise Effect Study presented in this paper. References of all the other studies: see [42].
Ijerph 07 03382f2
Figure 3. Means and standard deviation of residential satisfaction (single item, total score) by aircraft noise exposure (left side) and by aircraft noise annoyance (right side).
Ijerph 07 03382f3
Figure 4. Results of GLM: Adjusted means of HQoL (SF12/36 scores, total health complaints, PSQI sleep quality) by aircraft sound level classes (LAeq,16h/8h) and morbidity.
Ijerph 07 03382f4
Table 2. Number of participants by gender, age, and socio-economic status.
VariableN% valid
GenderMale1,03444.8
Female1,27655.2
Missing#1

Age17–19 years693.0
20–29 years24010.5
30–39 years29312.8
40–49 years42018.4
50–59 years34415.1
60–69 years44019.3
70–79 years32214.1
80 years and more1556.8
Missing28

Socio-economic statusLow31814.6
Middle1,14552.5
High71732.9
Missing131
#In one case during the study (between study part I and II) a sex change occurred.
Table 3. Number of participants by indicators of aircraft noise exposure.
Sound level class (LAeq) in dBDay-Evening-NightDay-NightDayNight

Lden in dBLdn in dBLAeq,16h in dBLAeq,8h in dB

N%N%N%N%
<4004.21325.70038116.5
40–459822.756024.236315.774132.1
45–5052426.659725.856524.446220.0
50–5561519.250621.949721.552322.6
55–6044327.351622.370030.32048.8
≥606311868.000.0

Total2,311100.02,311100.02311100.02,311100.0

Mean54.754.151.945.9
Standard deviation6.15.96.26.6
Minimum42.441.940.824.4
Maximum65.964.862.757.6
Table 4. Product-moment correlation between aircraft noise annoyance 12 months before the interview and parameters of aircraft noise exposure.
ScalenEquivalent sound level (unweighted, weighted)Mean maximum sound levelNumber of events above threshold
LAeq,24hLdenLdnLmax55,24hLmax70,24hN55,24hN70,24h
Aircraft noise annoyance5-pt.2,3080.450.430.420.390.340.330.34
11-pt.2,2720.430.420.410.360.290.340.34
Table 5. Correlations and partial correlations of aircraft sound level (Lden) and aircraft noise annoyance with selected questionnaire variables.
VariablesCorrelationPartial correlation

Noise annoyance (11 pt.)Noise level LdenNoise annoyance (11 pt.)1Noise level Lden2between annoyance (11 pt.) and Lden3
Aircraft noise annoyance
annoyance (5-pt.)0.870.430.840.14
annoyance (11-pt.)1.000.431.00

Disturbances of...
communication indoor0.790.480.740.250.09
relaxation/concentration indoor0.790.420.750.150.17
communication outdoor0.810.400.770.110.19
relaxation outdoor0.790.380.750.080.22
nocturnal sleep0.760.370.720.080.24

Coping
Measures to cope with noise0.810.410.770.130.17

Source-related attitudes
Negative expections0.740.240.72−0.120.38
Positive expections−0.140.01#−0.160.080.43
Econom. expectations−0.40−0.19−0.36−0.02#0.39
Aircraft-related fears0.710.280.68−0.03#0.33
Confidence in authorities−0.35−0.20−0.29−0.060.39

Residential satisfaction
Satisfaction with dwelling−0.04#−0.120.01#−0.110.42
Satisfaction with residential area−0.28−0.19−0.23−0.080.40
Infrastructure−0.110.01#−0.130.080.43
Quietness, insulation−0.47−0.30−0.40−0.210.34
Attractiveness, neighbours−0.17−0.10−0.15−0.02#0.42
Residential satisfaction (total score)−0.29−0.15−0.26−0.01#0.41

Sensitivity
Noise sensitivity0.360.080.36−0.090.43
Partial correlation adjusted for
1Lden,
2aircraft noise annoyance (11-pt. scale),
3variable in row;
#not significant (p > 0.01); n = 2,127–2,311.
Table 6. Description of health variables grouped by aircraft sound level at daytime (LAeq,16h) and night-time (LAeq,8h).
Health variablesAircraft sound level
at daytime–––LAeq,16h [dBA]
at night-time–––LAeq,8h [dBA]
40–4545–5050–5555–60≥60<4040–4545–5050–55≥55
SF12/36 HQoL scores: mean (SD)
Vitality (SF36)70.8 (18.7)65.9 (17.8)66.6 (18.7)67.5 (19.1)67.8 (17.8)**68.3 (18.5)66.7 (18)67.9 (18.2)67.7 (20.1)67.5 (17.8)

Mental health (SF36)77.3 (13.8)75.6 (14)73.5 (15.9)75.5 (15.1)78.3 (13.7)**75.1 (14)76.0 (14.4)75.4 (15.6)75.0 (15.4)77.1 (13.7)

Mental health (SF12)54.1 (6.1)53.4 (6.9)52.4 (7.8)53.6 (6.9)54.5 (6.6)**53.4 (6.3)53.4 (7.1)53.2 (7.2)53.4 (7.2)54.4 (6.7)

Physical health (SF12)51.1 (8.7)49.5 (9.9)50.1 (9.2)49.9 (9.2)50.1 (9.7)50.2 (9.5)49.8 (9.7)50.6 (8.7)49.8 (9.4)49.9 (9.5)

GSCL-24 health complaints: mean (SD)
Exhaustion46.1 (9.1)47.6 (9.9)48.0 (9.3)47.7 (9.8)46.5 (8.6)47.4 (9.7)47.8 (9.6)46.6 (9.3)47.7 (9.8)46.9 (8.8)
Stomach complaints48.1 (7.4)48.5 (7.6)48.6 (8.1)49.1 (7.8)46.8 (6.3)*49.2 (8.0)48.6 (7.7)47.6 (7.1)49.2 (8.0)47.1 (6.7)**
Limb complaints45.9 (9.3)47.8 (9.7)47.1 (9.9)47.5 (9.7)44.3 (9.3)**47.3 (10.0)47.3 (9.6)45.8 (9.6)48.0 (9.9)45.4 (9.2)**
Cardiac complaints47.6 (7.4)47.8 (7.6)48.4 (8.0)48.4 (8.1)46.7 (6.9)48.0 (7.8)48.2 (7.7)47.4 (7.6)48.5 (8.2)47.2 (7.0)
Total score45.5 (9.2)47.0 (9.5)47.0 (9.7)47.2 (9.8)44.3 (9.0)**46.9 (9.7)47.0 (9.5)45.4 (9.5)47.5 (9.8)45.1 (9.1)**

Sleep quality: mean (SD)
Sleep quality (PSQI)3.4 (2.8)3.8 (3.0)4.0 (3.1)4.1 (3.1)3.4 (2.8)**3.7 (2.9)3.9 (3.1)3.7 (3.0)4.2 (3.1)3.6 (2.8)*
**p < 0.01;
*p < 0.05 (adjusted for number of tests)
Table 7. Description of health variables grouped by aircraft noise exposure and noise sensitivity.
Health variablesAircraft noise annoyance
Noise sensitivity
not at allslightlymoderatelyveryextremelynota littlemoderatelyrathervery
SF12/36 HQoL scores: mean (SD)
Vitality (SF36)73.6 (18.4)70.9 (18.0)68.4 (17.4)64.6 (17.9)60.7 (19.0)**73.8 (18.0)69.5 (17.0)66.9 (17.5)63.4 (20.4)53.3 (22.4)**
Mental health (SF36)79.6 (13.2)77.8 (13.8)76 (14.1)74.0 (15.0)71.1 (16.1)**81.3 (14.6)77.6 (13.1)74.9 (13.8)71.7 (16.1)63.9 (18.2)**
Mental health (SF12)55.2 (5.1)54.2 (6.0)53.5 (6.5)53.1 (7.2)51.5 (8.9)**55.1 (6.2)54.3 (5.8)53.2 (6.8)51.7 (8.8)49.4 (9.0)**
Physical health (SF12)51.1 (9.3)51.4 (8.1)50.2 (8.8)49.1 (9.7)48.5 (10.8)**51.2 (9.2)50.9 (8.9)50.1 (8.8)48.2 (9.9)45.3 (12.5)**

GSCL-24 health complaints: mean (SD)
Exhaustion44.8 (8.1)45.1 (7.8)46.4 (8.7)48.7 (10.3)51.7 (10.7)**45.0 (8.1)45.8 (8.2)47.9 (9.7)50.0 (10.7)54.1 (12.1)**
Stomach complaints47.5 (7.0)47.3 (6.6)48.5 (7.5)49.1 (8.2)50.1 (8.4)**46.0 (6.3)48.0 (7.2)49.1 (7.7)49.5 (8.4)51.7 (9.3)**
Limb complaints45.7 (8.6)45.2 (8.2)46.3 (9.4)47.9 (10.4)49.9 (10.9)**44.4 (8.9)45.7 (8.5)47.5 (9.8)49.2 (10.6)52.6 (12.3)**
Cardiac complaints46.3 (6.1)46.5 (6.3)47.8 (7.6)49.1 (8.6)50.1 (8.8)**46.1 (6.5)47.0 (6.7)48.1 (8)50.2 (8.9)52.7 (9.4)**
Total score44.4 (8.4)44.4 (7.9)46.0 (9.2)47.8 (10.4)50.2 (10.5)**43.4 (8.4)45.2 (8.5)47.3 (9.6)49.2 (10.5)52.9 (11.6)**

Sleep quality: mean (SD)
Sleep quality (PSQI)2.6 (2.2)3.2 (2.7)3.7 (2.7)4.2 (3.0)5.5 (3.6)**2.7 (2.6)3.2 (2.6)4.1 (3.0)5.2 (3.3)6.0 (3.6)**
**p < 0.01;
*p < 0.05 (adjusted for number of tests)
Table 8. Associations between aircraft noise exposure at daytime (LAeq,16h), aircraft noise annoyance, noise sensitivity, and health variables (Odds ratios [OR] per unit and ±95% confidence interval [CI]).
Health variablesAircraft sound level LAeq,16h/8h#Aircraft noise annoyanceNoise sensitivity

ORCI−CR+ORCI−CR+ORCI−CR+
Health-related quality of life (SF36/12 scores < median)

Vitality (SF36)0.950.930.971.251.131.371.131.021.26
Mental health (SF36)0.960.940.981.131.031.241.401.261.55
Mental health (SF12)0.960.940.981.060.971.171.221.101.36
Physical health (SF12)0.970.950.991.131.011.261.191.061.34

GSCL-24 health complaints (above 50% = average of population in Germany)
Exhaustion0.980.961.001.361.231.511.401.261.56
Stomach complaints0.990.971.011.121.021.241.181.061.30
Limb complaints0.960.940.981.221.101.341.481.331.65
Cardiac complaints0.960.940.981.321.191.471.351.211.50
Total score0.960.940.981.411.271.561.531.371.71

Sleep quality (bad sleep quality: PSQI score > 5))
Bad sleep quality0.950.930.971.451.291.631.421.251.61
Adjusted for railway and road traffic sound level, age, gender, socio-economical status, home ownership, residential satisfaction, usual window position in the sleeping room at night, number of hours away from home;
#LAeq,8h (10 pm–6 am) for sleep quality, LAeq,16h (6 am–10 pm) for all other health variables; bold: OR significant on significance level p < 0.05.
Table 9. Results of multi-factorial GLM with HQoL variables as criteria.
Effect1df factorSF 36 vitalitySF36 mental healthSF12 mental healthSF12 physical healthGSCL total health complaintsPSQI sleep quality

FpFpFpFpFpFp
LAeq242.10.0792.80.0254.20.0020.90.4553.90.0031.40.223
Morbidity1298.20.00083.50.00029.20.000635.60.000314.20.0002730.000
LAeq × morbidity44.60.0013.80.0041.80.1253.90.0041.40.2170.50.713

df error1,8821,8821,8571,8571,8441,764
1Results based on GLM with LAeq (five 5-dB-classes), morbidity (0–1 vs. ≥2 diseases), expectations about residential future (worse vs. better/no change), noise sensitivity (median split: low vs. high), daytime window position (closed vs. open/tilted);
2PSQI sleep quality: LAeq,8h for night-time; all others: LAeq,16h for daytime.

